

The DOI matches its Crossref record; 90 of the 90 references it cites were found in a registry or an index; none of the 49 sources its claims cite is checked for support yet.
Predicting multiple conformations via sequence clustering and AlphaFold2
Open accessAbstract
AlphaFold2 (ref. 1 ) has revolutionized structural biology by accurately predicting single structures of proteins. However, a protein’s biological function often depends on multiple conformational substates 2 , and disease-causing point mutations often cause population changes within these substates 3,4 . We demonstrate that clustering a multiple-sequence alignment by sequence similarity enables AlphaFold2 to sample alternative states of known metamorphic proteins with high confidence. Using this method, named AF-Cluster, we investigated the evolutionary distribution of predicted structures for the metamorphic protein KaiB 5 and found that predictions of both conformations were distributed in clusters across the KaiB family. We used nuclear magnetic resonance spectroscopy to confirm an AF-Cluster prediction: a cyanobacteria KaiB variant is stabilized in the opposite state compared with the more widely studied variant. To test AF-Cluster’s sensitivity to point mutations, we designed and experimentally verified a set of three mutations predicted to flip KaiB from Rhodobacter sphaeroides from the ground to the fold-switched state. Finally, screening for alternative states in protein families without known fold switching identified a putative alternative state for the oxidoreductase Mpt53 in Mycobacterium tuberculosis . Further development of such bioinformatic methods in tandem with experiments will probably have a considerable impact on predicting protein energy landscapes, essential for illuminating biological function.
Overview
AI snapshot
Written from the paper’s full text.
TL;DR
AF-Cluster clusters a protein multiple-sequence alignment by sequence similarity and feeds each cluster to AlphaFold2, enabling sampling of alternative conformational states for metamorphic proteins. The authors experimentally validate predicted KaiB states and designed point mutations, and identify a putative alternative state for Mpt53.
Key findings
- AF-Cluster predicted both ground and fold-switched states for KaiB, RfaH and MAD2; for RfaH, top-five-model plDDT was 84.2 for the active state and 73.9 for the autoinhibited state, versus 68.6 for the autoinhibited state from the complete MSA.
- NMR confirmed the AF-Cluster prediction for KaiBTV-4: CS-Rosetta models were within 1.8 ± 0.3 Å r.m.s.d. to the AF-Cluster model, and the NMR structure matched with 1.89 ± 0.13 Å r.m.s.d. and average pairwise r.m.s.d. of 0.7 Å over backbone atoms.
- Three mutations (I68R, V83D, N84R) switched KaiBRS from the ground to the fold-switched state; NMR showed the mutant occupied the FS state at 86% versus 11% in wild type, and the ground state at 14% versus 89% in wild type.
- Screening 628 protein families identified a putative alternative state for M. tuberculosis Mpt53; in the GA/GB system, AF-Cluster correctly predicted the most stable fold for 10 out of 12 point-mutation sets, whereas default AF2 predicted 8 out of 12.
Methods
- MSAs were generated with ColabFold/MMseqs2, sequences with >25% gaps removed, then clustered by edit distance using DBSCAN; each cluster was used as input to AlphaFold2, with MSA Transformer used to probe evolutionary couplings.
- Experimental validation used NMR spectroscopy, CS-Rosetta, NOESY-based structure calculation, SEC–MALS, and a curated KaiB phylogenetic tree of 487 variants.
- The fold-switch screen used 628 proteins of 48–150 residues with >1,000 MSA sequences from a database of MSAs associated with crystal structures; Mpt53 homologues were analyzed with DALI and phylogenetic analysis.
Limitations
- The paper states that pLDDT cannot be used as a measure of free energy; the thermodynamically disfavoured KaiB FS state still had higher pLDDT than the ground state, and the number of models per state reflects construct abundance rather than Boltzmann weight.
- The paper states that AF-Cluster could not predict the oligomeric states of selecase, lymphotactin or CLIC1, and that conformational substates absent from the evolutionary signal may require alternative methods.
- The paper notes that novel computationally identified folds may be difficult to validate experimentally if the triggering stimulus is unknown; the Mpt53 alternative state is a prediction without experimental validation in this work.
Model-written summary. Check it against the paper before relying on it.
Integrity signals
Registry
Cites
Statistics
Figures
Verification
Claims the paper makes
60 Own result · 32 Not checked yet · 10 Own interpretation · 3 Own method · 3 No basis given
In the paper
“Using this method, named AF-Cluster, we investigated the evolutionary distribution of predicted structures for the metamorphic protein KaiB5 and found that predictions of both conformations were distributed in clusters across the KaiB family.”
§ Predicting multiple conformations via sequence clustering and AlphaFold2 > Abstract
What the sources say
- Not checked yetcites [5] Chang, Y. G. et al. Circadian rhythms. A protein fold switch joins the circadian oscillator to clock output in cyanobacteria. Science 349, 324–328 (2015). source
plaincorrelational- Asserted: passes — The authors put it forward as true.
- Checkable: passes — It can be checked against evidence.
- Load-bearing: passes — The paper’s conclusions depend on it.
- Based: passes — The paper gives a reason why it holds.
A result the paper reports from its own data — it cites no other source for it, so there is none to check. The quote shows it is in the paper.
In the paper
“We demonstrate that clustering a multiple-sequence alignment by sequence similarity enables AlphaFold2 to sample alternative states of known metamorphic proteins with high confidence.”
§ Predicting multiple conformations via sequence clustering and AlphaFold2 > Abstract
boosteddirect- Asserted: passes — The authors put it forward as true.
- Checkable: passes — It can be checked against evidence.
- Load-bearing: passes — The paper’s conclusions depend on it.
- Based: passes — The paper gives a reason why it holds.
A result the paper reports from its own data — it cites no other source for it, so there is none to check. The quote shows it is in the paper.
In the paper
“To test AF-Cluster’s sensitivity to point mutations, we designed and experimentally verified a set of three mutations predicted to flip KaiB from Rhodobacter sphaeroides from the ground to the fold-switched state.”
§ Predicting multiple conformations via sequence clustering and AlphaFold2 > Abstract
plaindirectSingle case- Asserted: passes — The authors put it forward as true.
- Checkable: passes — It can be checked against evidence.
- Load-bearing: passes — The paper’s conclusions depend on it.
- Based: passes — The paper gives a reason why it holds.
A result the paper reports from its own data — it cites no other source for it, so there is none to check. The quote shows it is in the paper.
In the paper
“Finally, screening for alternative states in protein families without known fold switching identified a putative alternative state for the oxidoreductase Mpt53 in Mycobacterium tuberculosis.”
§ Predicting multiple conformations via sequence clustering and AlphaFold2 > Abstract
hedgedSingle case- Asserted: passes — The authors put it forward as true.
- Checkable: passes — It can be checked against evidence.
- Load-bearing: passes — The paper’s conclusions depend on it.
- Based: passes — The paper gives a reason why it holds.
A result the paper reports from its own data — it cites no other source for it, so there is none to check. The quote shows it is in the paper.
In the paper
“We used nuclear magnetic resonance spectroscopy to confirm an AF-Cluster prediction: a cyanobacteria KaiB variant is stabilized in the opposite state compared with the more widely studied variant.”
§ Predicting multiple conformations via sequence clustering and AlphaFold2 > Abstract
boostedSingle case- Asserted: passes — The authors put it forward as true.
- Checkable: passes — It can be checked against evidence.
- Load-bearing: passes — The paper’s conclusions depend on it.
- Based: passes — The paper gives a reason why it holds.
A result the paper reports from its own data — it cites no other source for it, so there is none to check. The quote shows it is in the paper.
In the paper
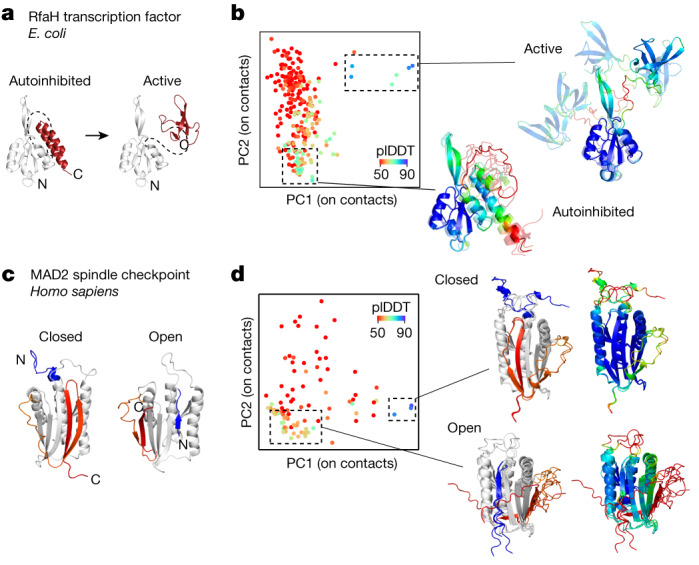
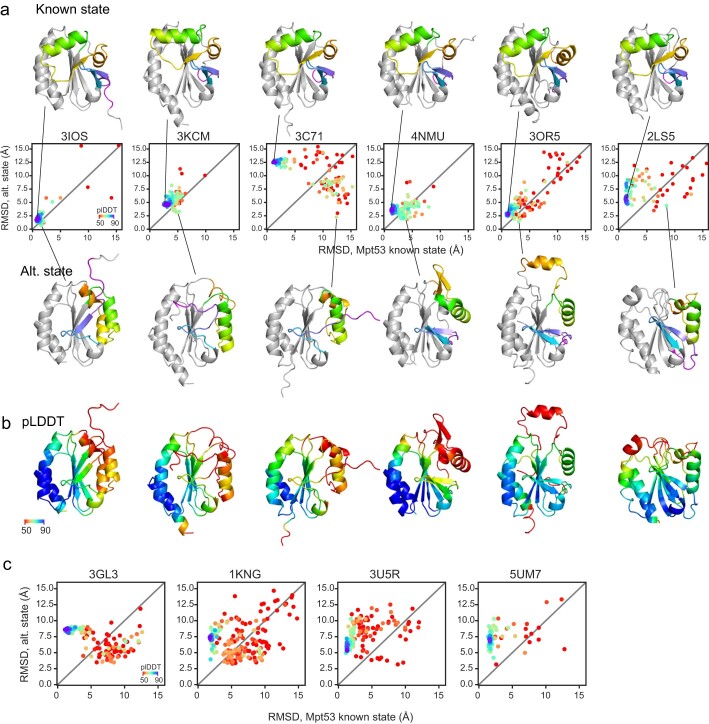
“By contrast, AF-Cluster predicted both the autoinhibited and the active state (Fig. 4b).”
§ Predicting multiple conformations via sequence clustering and AlphaFold2 > Testing AF-Cluster on other proteins
plaindirectSingle case- Asserted: passes — The authors put it forward as true.
- Checkable: passes — It can be checked against evidence.
- Load-bearing: passes — The paper’s conclusions depend on it.
- Based: passes — The paper gives a reason why it holds.
A result the paper reports from its own data — it cites no other source for it, so there is none to check. The quote shows it is in the paper.
In the paper
“We found that AF-Cluster again had the ability to predict models for both of MAD2’s conformational states (Fig. 4d).”
§ Predicting multiple conformations via sequence clustering and AlphaFold2 > Testing AF-Cluster on other proteins
plaindirectSingle case- Asserted: passes — The authors put it forward as true.
- Checkable: passes — It can be checked against evidence.
- Load-bearing: passes — The paper’s conclusions depend on it.
- Based: passes — The paper gives a reason why it holds.
In the paper
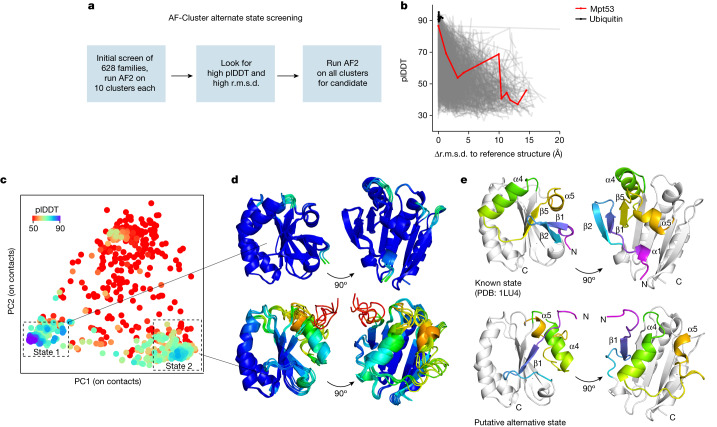
“As a control, AF-Cluster models of ubiquitin, a protein that is well characterized to have no alternative states, returns only models with high confidence and low r.m.s.d. to the crystal structure PDB 1UBQ.”
§ Predicting multiple conformations via sequence clustering and AlphaFold2 > AF-Cluster predicts novel states
What the sources say
- Not checked yetcites 1UBQ
boostedSingle case- Asserted: passes — The authors put it forward as true.
- Checkable: passes — It can be checked against evidence.
- Load-bearing: passes — The paper’s conclusions depend on it.
- Based: passes — The paper gives a reason why it holds.
A result the paper reports from its own data — it cites no other source for it, so there is none to check. The quote shows it is in the paper.
In the paper
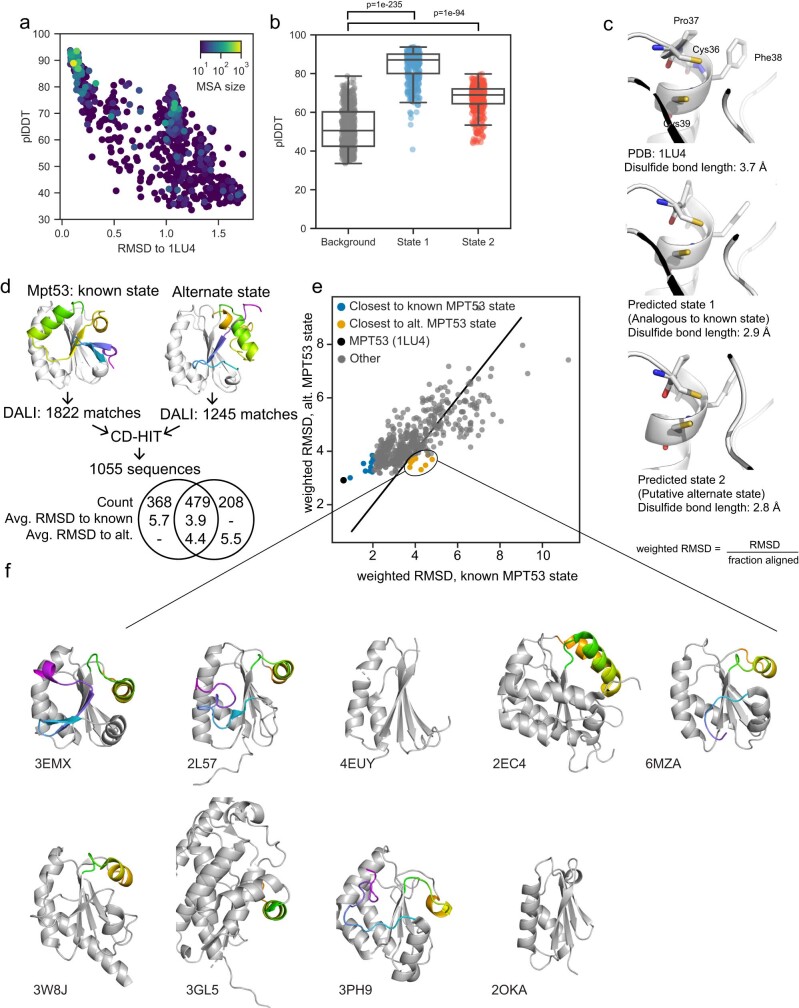
“For most of the protein families screened, an increase in r.m.s.d. corresponded to a decrease in plDDT (Fig. 5b).”
§ Predicting multiple conformations via sequence clustering and AlphaFold2 > AF-Cluster predicts novel states
plaincorrelational- Asserted: passes — The authors put it forward as true.
- Checkable: passes — It can be checked against evidence.
- Load-bearing: passes — The paper’s conclusions depend on it.
- Based: passes — The paper gives a reason why it holds.
A result the paper reports from its own data — it cites no other source for it, so there is none to check. The quote shows it is in the paper.
In the paper
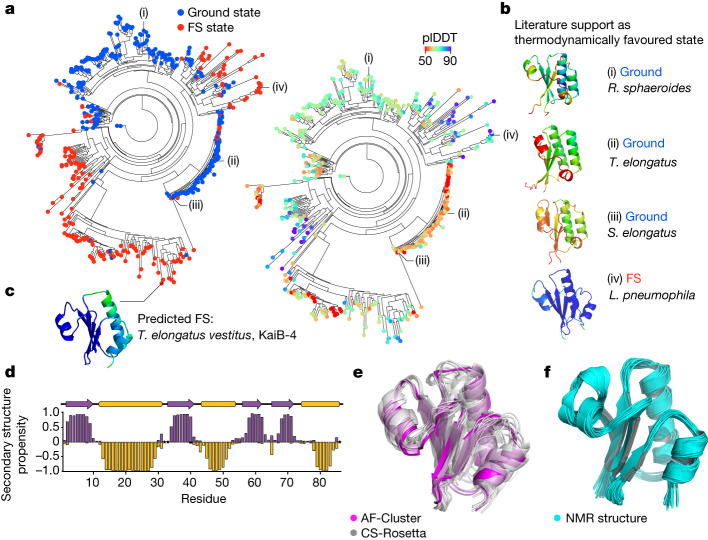
“We confirmed that, for variants in the tree that had been experimentally characterized, the prediction from AF-Cluster corresponded to the structure expected to be thermodynamically favoured (Fig. 2b).”
§ Predicting multiple conformations via sequence clustering and AlphaFold2 > Experimental test of KaiB predictions
plaincorrelational- Asserted: passes — The authors put it forward as true.
- Checkable: passes — It can be checked against evidence.
- Load-bearing: passes — The paper’s conclusions depend on it.
- Based: passes — The paper gives a reason why it holds.
A result the paper reports from its own data — it cites no other source for it, so there is none to check. The quote shows it is in the paper.
In the paper
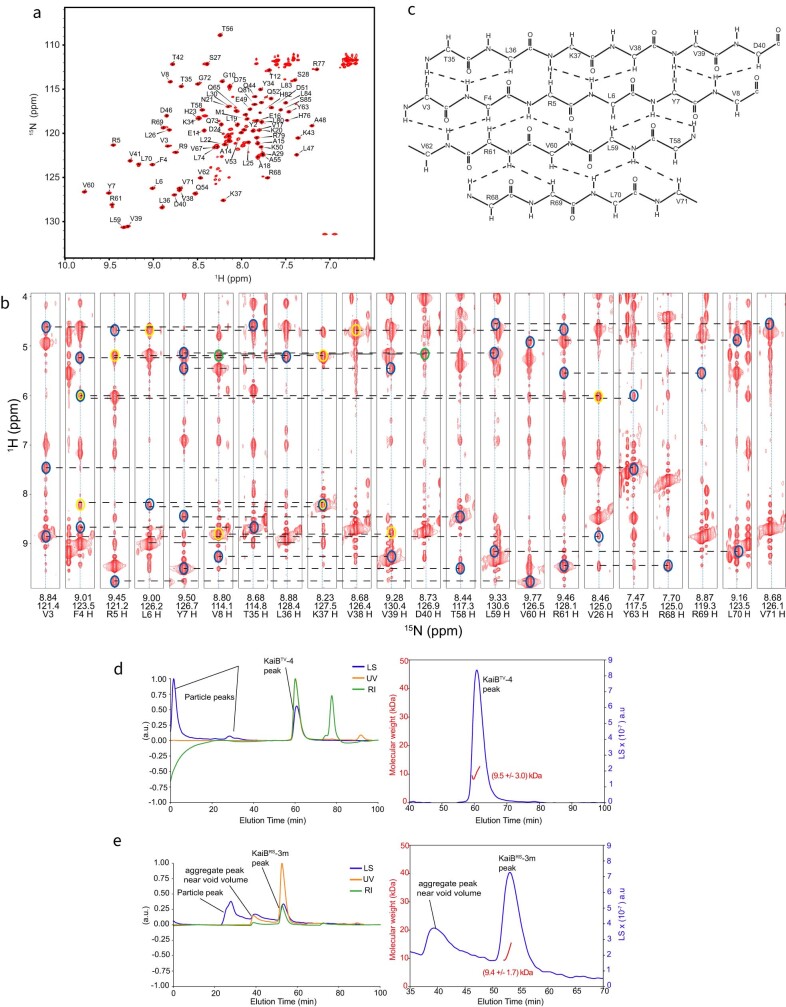
“The secondary structure calculated from the major state chemical shifts indeed corresponded to the FS KaiB state (Fig. 2d).”
§ Predicting multiple conformations via sequence clustering and AlphaFold2 > Experimental test of KaiB predictions
boostedcorrelationalSingle case- Asserted: passes — The authors put it forward as true.
- Checkable: passes — It can be checked against evidence.
- Load-bearing: passes — The paper’s conclusions depend on it.
- Based: passes — The paper gives a reason why it holds.
A result the paper reports from its own data — it cites no other source for it, so there is none to check. The quote shows it is in the paper.
In the paper
“However, a handful of proteins in this preliminary screen returned models with a high r.m.s.d. and high plDDT, hinting to a predicted structure with high dissimilarity to the original structure as well as high confidence from AF2.”
§ Predicting multiple conformations via sequence clustering and AlphaFold2 > AF-Cluster predicts novel states
hedgedcorrelational- Asserted: passes — The authors put it forward as true.
- Checkable: passes — It can be checked against evidence.
- Load-bearing: passes — The paper’s conclusions depend on it.
- Based: passes — The paper gives a reason why it holds.
A result the paper reports from its own data — it cites no other source for it, so there is none to check. The quote shows it is in the paper.
In the paper
“To test the ability of our method to predict the effect of point mutations in switching a protein’s conformational equilibrium, we predicted and consequently validated a minimal set of point mutations that switch KaiB from R. sphaeroides between the ground and FS state.”
§ Predicting multiple conformations via sequence clustering and AlphaFold2 > Main
plaindirect- Asserted: passes — The authors put it forward as true.
- Checkable: passes — It can be checked against evidence.
- Load-bearing: passes — The paper’s conclusions depend on it.
- Based: passes — The paper gives a reason why it holds.
A result the paper reports from its own data — it cites no other source for it, so there is none to check. The quote shows it is in the paper.
In the paper
“The active state was not predicted.”
§ Predicting multiple conformations via sequence clustering and AlphaFold2 > Testing AF-Cluster on other proteins
plainSingle case- Asserted: passes — The authors put it forward as true.
- Checkable: passes — It can be checked against evidence.
- Load-bearing: passes — The paper’s conclusions depend on it.
- Based: passes — The paper gives a reason why it holds.
A result the paper reports from its own data — it cites no other source for it, so there is none to check. The quote shows it is in the paper.
In the paper
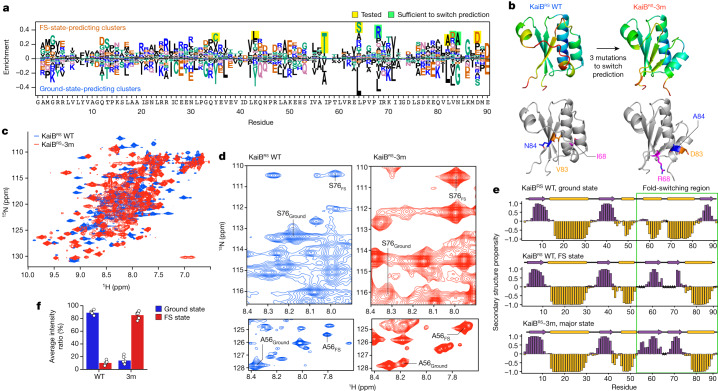
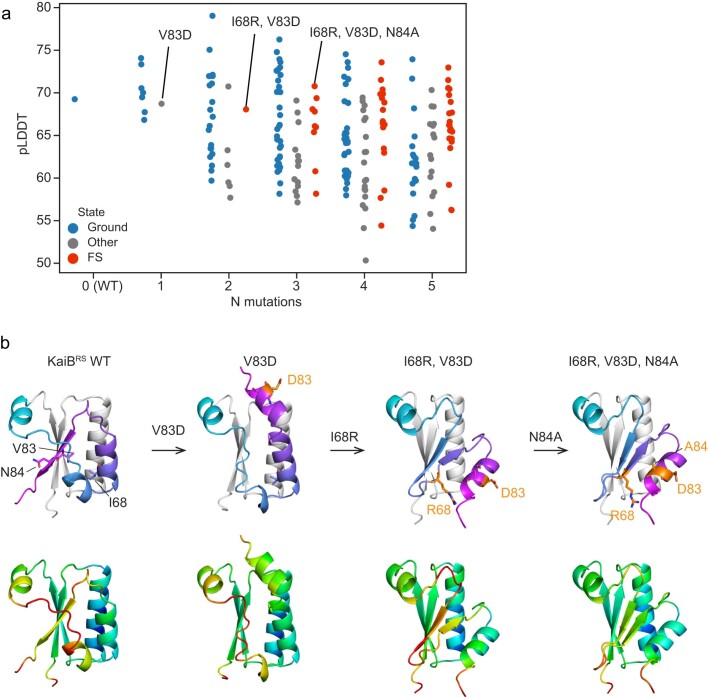
“Notably, the secondary chemical shifts from backbone resonance assignment of the major peaks confirmed that the incorporation of these mutations indeed switch KaiBRS from the ground to the FS state (Fig. 3e).”
§ Predicting multiple conformations via sequence clustering and AlphaFold2 > Mutations to flip the KaiB equilibrium
boosteddirectSingle case- Asserted: passes — The authors put it forward as true.
- Checkable: passes — It can be checked against evidence.
- Load-bearing: passes — The paper’s conclusions depend on it.
- Based: passes — The paper gives a reason why it holds.
A result the paper reports from its own data — it cites no other source for it, so there is none to check. The quote shows it is in the paper.
In the paper
“Overall, NMR confirmed our prediction that a triple mutation switches KaiBRS to the FS state.”
§ Predicting multiple conformations via sequence clustering and AlphaFold2 > Mutations to flip the KaiB equilibrium
plaindirectSingle case- Asserted: passes — The authors put it forward as true.
- Checkable: passes — It can be checked against evidence.
- Load-bearing: passes — The paper’s conclusions depend on it.
- Based: passes — The paper gives a reason why it holds.
A result the paper reports from its own data — it cites no other source for it, so there is none to check. The quote shows it is in the paper.
In the paper
“Indeed, we found that three mutations—I68R, V83D and N84R—were sufficient to switch a prediction of KaiBRS from the ground state to a prediction of the FS state (Fig. 3b).”
§ Predicting multiple conformations via sequence clustering and AlphaFold2 > Mutations to flip the KaiB equilibrium
plaindirect- Asserted: passes — The authors put it forward as true.
- Checkable: passes — It can be checked against evidence.
- Load-bearing: passes — The paper’s conclusions depend on it.
- Based: passes — The paper gives a reason why it holds.
A result the paper reports from its own data — it cites no other source for it, so there is none to check. The quote shows it is in the paper.
In the paper
“We demonstrate that a simple MSA subsampling method—clustering sequences by sequence similarity—enables AF2 to predict both states of the metamorphic proteins KaiB, RfaH and MAD2.”
§ Predicting multiple conformations via sequence clustering and AlphaFold2 > Main
boosteddirect- Asserted: passes — The authors put it forward as true.
- Checkable: passes — It can be checked against evidence.
- Load-bearing: passes — The paper’s conclusions depend on it.
- Based: passes — The paper gives a reason why it holds.
None of the sources cited for this claim have been checked yet.
In the paper
“We used KaiB from R. sphaeroides32 (hereafter KaiBRS) for this test, which we found using NMR switches between two monomeric states, to eliminate the complicating factor of mutations contributing to ground-state tetramerization in the previously studied KaiBTE (ref. 5).”
§ Predicting multiple conformations via sequence clustering and AlphaFold2 > Mutations to flip the KaiB equilibrium
What the sources say
- Not checked yetcites [32] Pitsawong, W. et al. From primordial clocks to circadian oscillators. Nature 616, 183–189 (2023). source
- Not checked yetcites [5] Chang, Y. G. et al. Circadian rhythms. A protein fold switch joins the circadian oscillator to clock output in cyanobacteria. Science 349, 324–328 (2015). source
plain- Asserted: passes — The authors put it forward as true.
- Checkable: passes — It can be checked against evidence.
- Load-bearing: passes — The paper’s conclusions depend on it.
- Based: passes — The paper gives a reason why it holds.
A result the paper reports from its own data — it cites no other source for it, so there is none to check. The quote shows it is in the paper.
In the paper
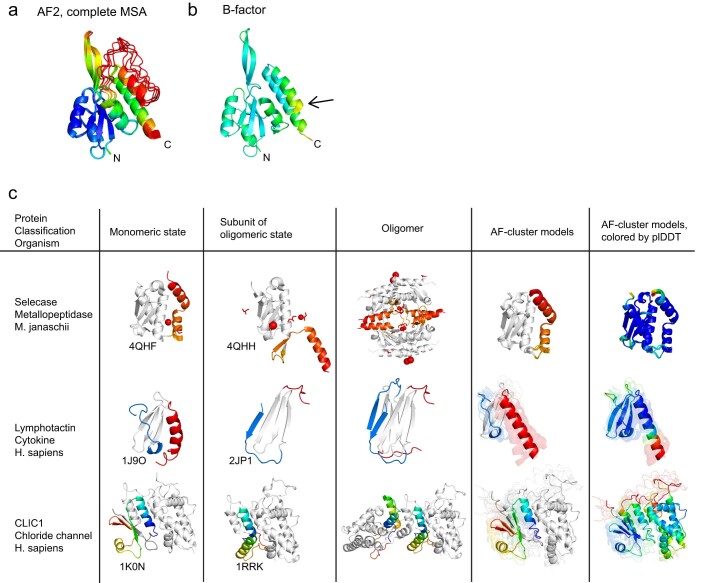
“Predicting the structure of RfaH with the complete MSA from ColabFold returned a structure that largely matched the autoinhibited state (Extended Data Fig. 6a) apart from the first helical turn in the CTD being predicted as disordered.”
§ Predicting multiple conformations via sequence clustering and AlphaFold2 > Testing AF-Cluster on other proteins
plainSingle case- Asserted: passes — The authors put it forward as true.
- Checkable: passes — It can be checked against evidence.
- Load-bearing: passes — The paper’s conclusions depend on it.
- Based: passes — The paper gives a reason why it holds.
A result the paper reports from its own data — it cites no other source for it, so there is none to check. The quote shows it is in the paper.
In the paper
“Models for the alternative state demonstrate a very similar active site orientation at residues Cys36–Cys39 (Extended Data Fig. 7c).”
§ Predicting multiple conformations via sequence clustering and AlphaFold2 > AF-Cluster predicts novel states
boostedSingle case- Asserted: passes — The authors put it forward as true.
- Checkable: passes — It can be checked against evidence.
- Load-bearing: unclear — It is unclear whether the paper’s conclusions depend on it.
- Based: passes — The paper gives a reason why it holds.
In the paper
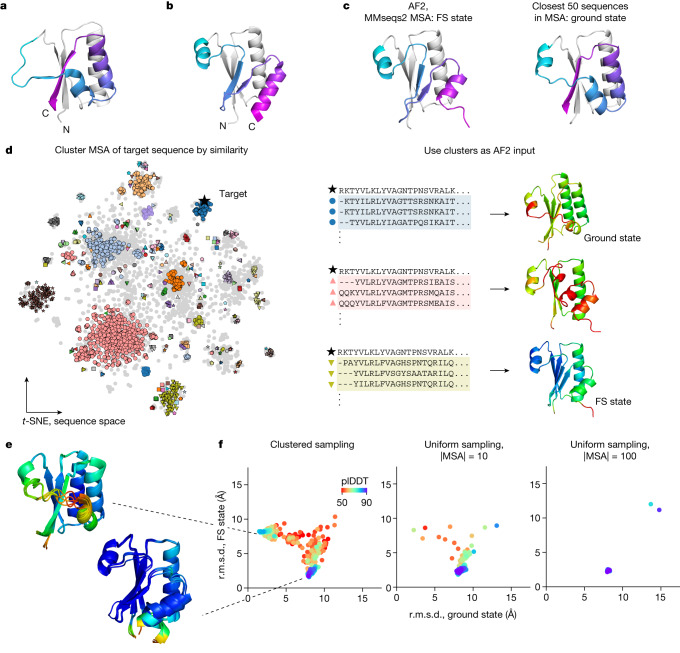
“However, AF2 run using ColabFold34 predicts the thermodynamically unfavoured FS state for KaiBTE (Fig. 1c (left)).”
§ Predicting multiple conformations via sequence clustering and AlphaFold2 > AF-Cluster predicts both KaiB states
What the sources say
- Not checked yetcites [34] Mirdita, M. et al. ColabFold: making protein folding accessible to all. Nat. Methods 19, 679–682 (2022). source
plaindirectSingle case- Asserted: passes — The authors put it forward as true.
- Checkable: passes — It can be checked against evidence.
- Load-bearing: passes — The paper’s conclusions depend on it.
- Based: passes — The paper gives a reason why it holds.
A result the paper reports from its own data — it cites no other source for it, so there is none to check. The quote shows it is in the paper.
In the paper
“We experimentally tested the AF-Cluster predictions on a KaiB variant in Thermosynechococcus elongatus vestitus that was predicted to favour the fold-switched (FS) state. Using nuclear magnetic resonance (NMR) spectroscopy, we could indeed verify our AF-Cluster prediction.”
§ Predicting multiple conformations via sequence clustering and AlphaFold2 > Main
hedgedcorrelationalSingle case- Asserted: passes — The authors put it forward as true.
- Checkable: passes — It can be checked against evidence.
- Load-bearing: passes — The paper’s conclusions depend on it.
- Based: passes — The paper gives a reason why it holds.
A result the paper reports from its own data — it cites no other source for it, so there is none to check. The quote shows it is in the paper.
In the paper
“We found that regions of high plDDT for both the ground and FS state were interspersed across the tree (Fig. 2a).”
§ Predicting multiple conformations via sequence clustering and AlphaFold2 > Experimental test of KaiB predictions
plaincorrelational- Asserted: passes — The authors put it forward as true.
- Checkable: passes — It can be checked against evidence.
- Load-bearing: unclear — It is unclear whether the paper’s conclusions depend on it.
- Based: passes — The paper gives a reason why it holds.
In the paper
“By contrast, a KaiB variant from Legionella pneumophila that has previously been crystallized in the FS state37 was predicted with high confidence for the FS state.”
§ Predicting multiple conformations via sequence clustering and AlphaFold2 > Experimental test of KaiB predictions
What the sources say
- Not checked yetcites [37] Loza-Correa, M. et al. The Legionella pneumophila kai operon is implicated in stress response and confers fitness in competitive environments. Environ. Microbiol. 16, 359–381 (2014). source
plainSingle case- Asserted: passes — The authors put it forward as true.
- Checkable: passes — It can be checked against evidence.
- Load-bearing: passes — The paper’s conclusions depend on it.
- Based: passes — The paper gives a reason why it holds.
A result the paper reports from its own data — it cites no other source for it, so there is none to check. The quote shows it is in the paper.
In the paper
“We observed that, as for KaiBTE, AF-Cluster predicts the ground and FS state for KaiBRS with high confidence.”
§ Predicting multiple conformations via sequence clustering and AlphaFold2 > Mutations to flip the KaiB equilibrium
boostedSingle case- Asserted: passes — The authors put it forward as true.
- Checkable: passes — It can be checked against evidence.
- Load-bearing: passes — The paper’s conclusions depend on it.
- Based: passes — The paper gives a reason why it holds.
In the paper
“CS-Rosetta39 models calculated from the chemical shifts (Fig. 2e) are within 1.8 ± 0.3 Å r.m.s.d. to the FS state predicted by AF-cluster.”
§ Predicting multiple conformations via sequence clustering and AlphaFold2 > Experimental test of KaiB predictions
What the sources say
- Not checked yetcites [39] Shen, Y. et al. Consistent blind protein structure generation from NMR chemical shift data. Proc. Natl Acad. Sci. USA 105, 4685–4690 (2008). source
plaincorrelationalSingle case- Asserted: passes — The authors put it forward as true.
- Checkable: passes — It can be checked against evidence.
- Load-bearing: passes — The paper’s conclusions depend on it.
- Based: passes — The paper gives a reason why it holds.
The paper states this without a source or data behind it here, so there is nothing to check it against. The quote shows it is in the paper.
In the paper
“AF-Cluster was unable to predict the oligomeric state for selecase, lymphotactin and CLIC1.”
§ Predicting multiple conformations via sequence clustering and AlphaFold2 > Testing AF-Cluster on other proteins
plain- Asserted: passes — The authors put it forward as true.
- Checkable: passes — It can be checked against evidence.
- Load-bearing: passes — The paper’s conclusions depend on it.
- Based: passes — The paper gives a reason why it holds.
A result the paper reports from its own data — it cites no other source for it, so there is none to check. The quote shows it is in the paper.
In the paper
“by making AF-Cluster predictions for KaiB variants from a curated phylogenetic tree, we found that KaiB variants predicted to fold to one or the other substate were distributed in clusters throughout the phylogenetic tree.”
§ Predicting multiple conformations via sequence clustering and AlphaFold2 > Main
plaincorrelational- Asserted: passes — The authors put it forward as true.
- Checkable: passes — It can be checked against evidence.
- Load-bearing: passes — The paper’s conclusions depend on it.
- Based: passes — The paper gives a reason why it holds.
A result the paper reports from its own data — it cites no other source for it, so there is none to check. The quote shows it is in the paper.
In the paper
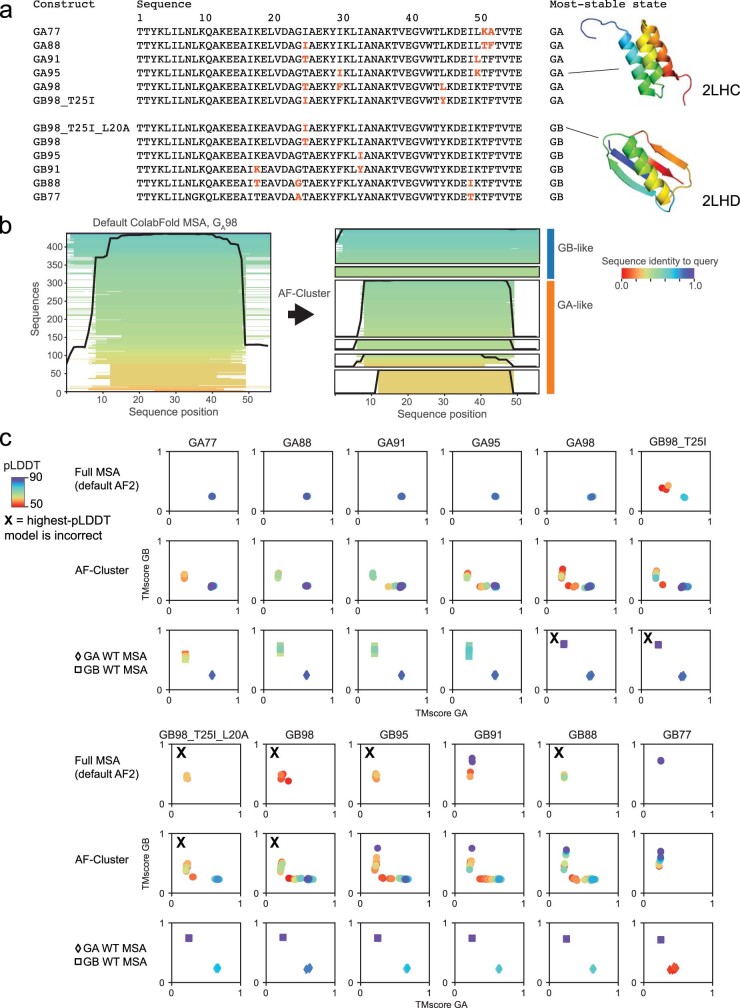
“For the remaining two that AF-Cluster did not predict, using the WT GB MSA returns a higher-scoring model than the WT GA MSA”
§ Predicting multiple conformations via sequence clustering and AlphaFold2 > Methods > Testing the sensitivity of AF2 and AF-Cluster to point mutations in the GA/GB system
plaincorrelational- Asserted: passes — The authors put it forward as true.
- Checkable: passes — It can be checked against evidence.
- Load-bearing: passes — The paper’s conclusions depend on it.
- Based: passes — The paper gives a reason why it holds.
A result the paper reports from its own data — it cites no other source for it, so there is none to check. The quote shows it is in the paper.
In the paper
“We found that the information provided by our AF-Cluster method was sufficiently predictive to inform the design of three point mutations that could switch the equilibrium of KaiBRS from the ground to FS state.”
§ Predicting multiple conformations via sequence clustering and AlphaFold2 > Discussion
hedgeddirectSingle case- Asserted: passes — The authors put it forward as true.
- Checkable: passes — It can be checked against evidence.
- Load-bearing: passes — The paper’s conclusions depend on it.
- Based: passes — The paper gives a reason why it holds.
A result the paper reports from its own data — it cites no other source for it, so there is none to check. The quote shows it is in the paper.
In the paper
“We found that pockets of KaiB variants in a phylogenetic tree were predicted to be stabilized for one or the other state.”
§ Predicting multiple conformations via sequence clustering and AlphaFold2 > Discussion
plaincorrelational- Asserted: passes — The authors put it forward as true.
- Checkable: passes — It can be checked against evidence.
- Load-bearing: passes — The paper’s conclusions depend on it.
- Based: passes — The paper gives a reason why it holds.
A result the paper reports from its own data — it cites no other source for it, so there is none to check. The quote shows it is in the paper.
In the paper
“Notably, predicting this variant in single-sequence mode in AF2 incorrectly predicts the ground state (Supplementary Discussion), further underscoring the utility of isolating local evolutionary couplings by clustering sequences.”
§ Predicting multiple conformations via sequence clustering and AlphaFold2 > Discussion
plaindirectSingle case- Asserted: passes — The authors put it forward as true.
- Checkable: passes — It can be checked against evidence.
- Load-bearing: passes — The paper’s conclusions depend on it.
- Based: passes — The paper gives a reason why it holds.
A result the paper reports from its own data — it cites no other source for it, so there is none to check. The quote shows it is in the paper.
In the paper
“We observed that the matches exclusively for one or the other state had worse weighted r.m.s.d. for their structure compared to matches that matched both structures (Extended Data Fig. 7d)”
§ Predicting multiple conformations via sequence clustering and AlphaFold2 > Methods > Screening for Mpt53 structure homologues
plaincorrelational- Asserted: passes — The authors put it forward as true.
- Checkable: passes — It can be checked against evidence.
- Load-bearing: passes — The paper’s conclusions depend on it.
- Based: passes — The paper gives a reason why it holds.
A result the paper reports from its own data — it cites no other source for it, so there is none to check. The quote shows it is in the paper.
In the paper
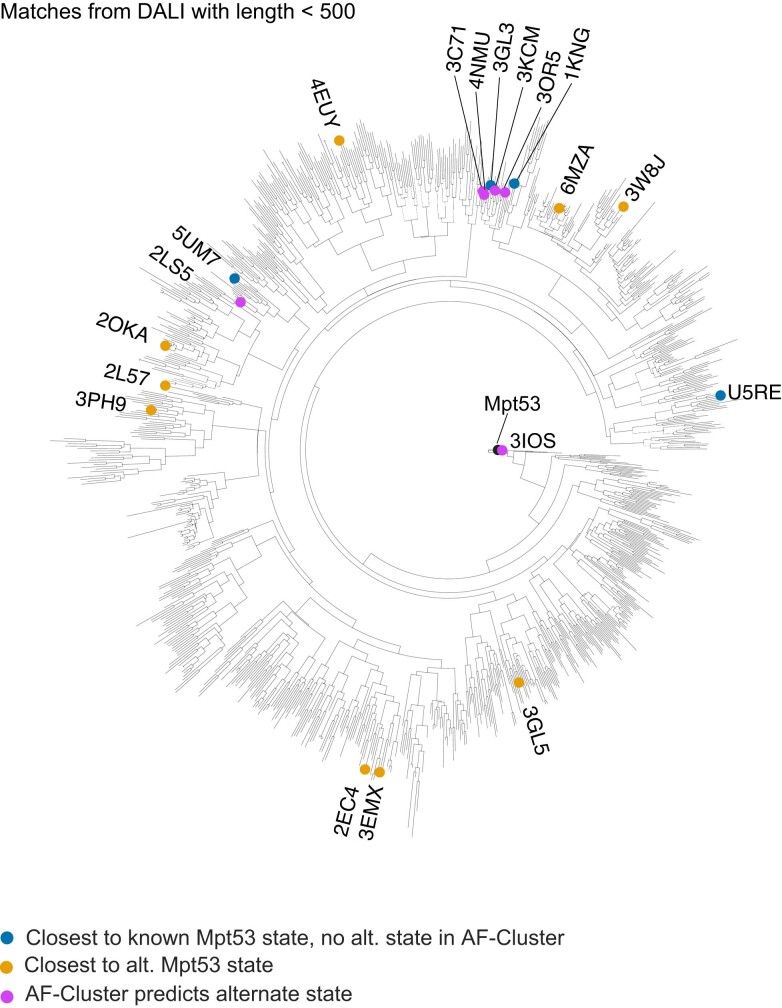
“One structure, PDB 3EMX, had an N-terminal β-strand arranged in the same conformation as the Mpt53 alternative state.”
§ Predicting multiple conformations via sequence clustering and AlphaFold2 > Methods > Screening for Mpt53 structure homologues
plainSingle case- Asserted: passes — The authors put it forward as true.
- Checkable: passes — It can be checked against evidence.
- Load-bearing: unclear — It is unclear whether the paper’s conclusions depend on it.
- Based: passes — The paper gives a reason why it holds.
A result the paper reports from its own data — it cites no other source for it, so there is none to check. The quote shows it is in the paper.
In the paper
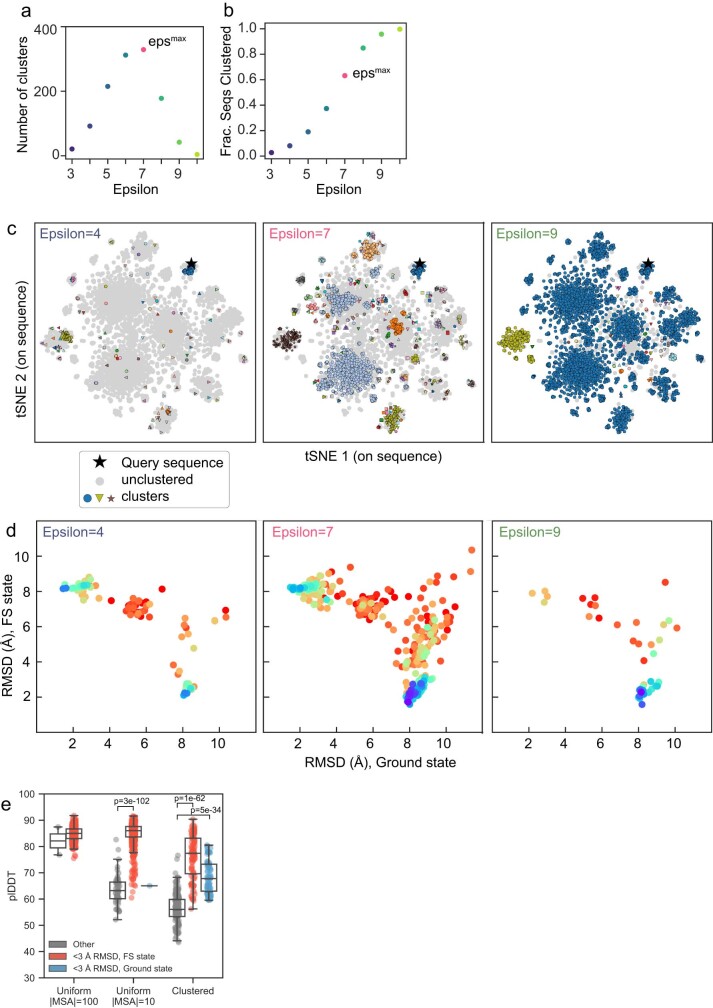
“For epsilon < epsmax, the number of clusters is lower because more sequences are left unclustered as outliers (Extended Data Fig. 2b).”
§ Predicting multiple conformations via sequence clustering and AlphaFold2 > Methods > Clustering
plaindirect- Asserted: passes — The authors put it forward as true.
- Checkable: passes — It can be checked against evidence.
- Load-bearing: unclear — It is unclear whether the paper’s conclusions depend on it.
- Based: passes — The paper gives a reason why it holds.
A result the paper reports from its own data — it cites no other source for it, so there is none to check. The quote shows it is in the paper.
In the paper
“Investigating a few sequences from each cluster revealed that sequences of different lengths corresponded to GB-like and GA-like proteins.”
§ Predicting multiple conformations via sequence clustering and AlphaFold2 > Methods > Testing the sensitivity of AF2 and AF-Cluster to point mutations in the GA/GB system
plaincorrelational- Asserted: passes — The authors put it forward as true.
- Checkable: passes — It can be checked against evidence.
- Load-bearing: unclear — It is unclear whether the paper’s conclusions depend on it.
- Based: passes — The paper gives a reason why it holds.
A result the paper reports from its own data — it cites no other source for it, so there is none to check. The quote shows it is in the paper.
In the paper
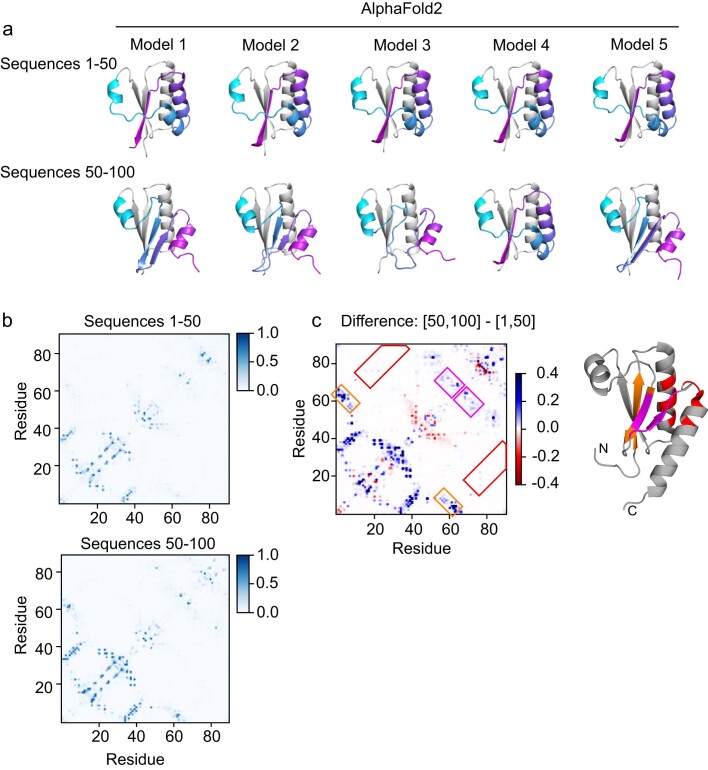
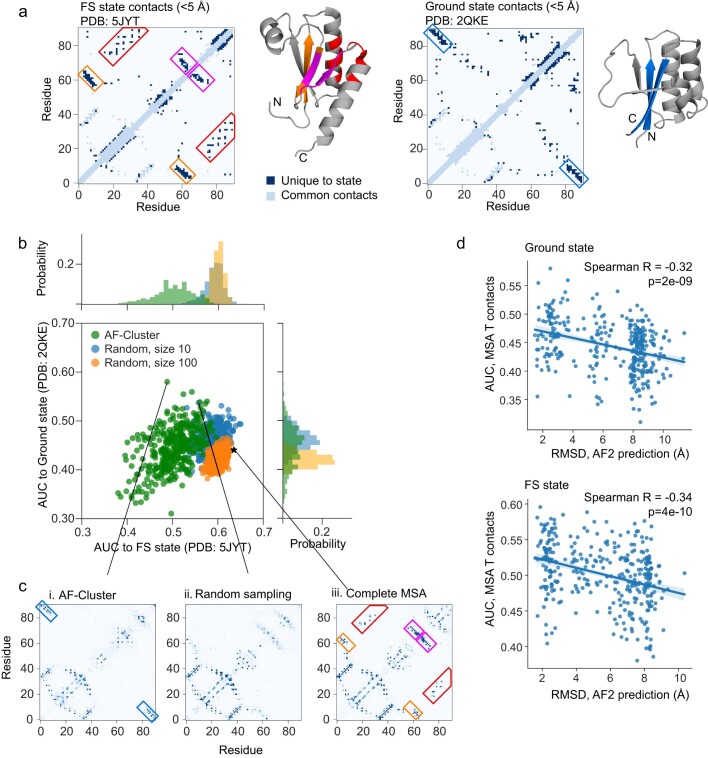
“the highest-scoring randomly sampled cluster did not contain the secondary structure feature most emblematic of the ground state: the C-terminal β-strand (indicated by a box in Extended Data Fig. 3c (i), but absent from Extended Data Fig. 2c (ii)).”
§ Predicting multiple conformations via sequence clustering and AlphaFold2 > Methods > Investigating evolutionary couplings from clustering using MSA Transformer
plainSingle case- Asserted: passes — The authors put it forward as true.
- Checkable: passes — It can be checked against evidence.
- Load-bearing: unclear — It is unclear whether the paper’s conclusions depend on it.
- Based: passes — The paper gives a reason why it holds.
A result the paper reports from its own data — it cites no other source for it, so there is none to check. The quote shows it is in the paper.
In the paper
“AF-Cluster corrected two of these—GB95 and GB88.”
§ Predicting multiple conformations via sequence clustering and AlphaFold2 > Methods > Testing the sensitivity of AF2 and AF-Cluster to point mutations in the GA/GB system
plaindirect- Asserted: passes — The authors put it forward as true.
- Checkable: passes — It can be checked against evidence.
- Load-bearing: passes — The paper’s conclusions depend on it.
- Based: passes — The paper gives a reason why it holds.
A result the paper reports from its own data — it cites no other source for it, so there is none to check. The quote shows it is in the paper.
In the paper
“For 4 out of 12 point mutants, the default ColabFold MSA did not return any models corresponding to the correct structure.”
§ Predicting multiple conformations via sequence clustering and AlphaFold2 > Methods > Testing the sensitivity of AF2 and AF-Cluster to point mutations in the GA/GB system
plain- Asserted: passes — The authors put it forward as true.
- Checkable: passes — It can be checked against evidence.
- Load-bearing: passes — The paper’s conclusions depend on it.
- Based: passes — The paper gives a reason why it holds.
The paper states this without a source or data behind it here, so there is nothing to check it against. The quote shows it is in the paper.
In the paper
“We demonstrate that simply clustering input sequences from MSAs of metamorphic proteins enables AF2 to sample multiple biologically relevant conformations with high confidence.”
§ Predicting multiple conformations via sequence clustering and AlphaFold2 > Discussion
boosteddirect- Asserted: passes — The authors put it forward as true.
- Checkable: passes — It can be checked against evidence.
- Load-bearing: passes — The paper’s conclusions depend on it.
- Based: unclear — It is unclear why the paper says it holds.
A result the paper reports from its own data — it cites no other source for it, so there is none to check. The quote shows it is in the paper.
In the paper
“This was immediately evident in our investigation of KaiB, for which, in our models generated using AF-Cluster, the thermodynamically disfavoured FS state still had a higher pLDDT than the ground state (Extended Data Fig. 2e).”
§ Predicting multiple conformations via sequence clustering and AlphaFold2 > Discussion
plaincorrelationalSingle case- Asserted: passes — The authors put it forward as true.
- Checkable: passes — It can be checked against evidence.
- Load-bearing: passes — The paper’s conclusions depend on it.
- Based: passes — The paper gives a reason why it holds.
A result the paper reports from its own data — it cites no other source for it, so there is none to check. The quote shows it is in the paper.
In the paper
“an extreme case of this is exemplified in how KaiB predicted using its entire MSA resulted in only the FS state.”
§ Predicting multiple conformations via sequence clustering and AlphaFold2 > Methods > Clustering
plaindirectSingle case- Asserted: passes — The authors put it forward as true.
- Checkable: passes — It can be checked against evidence.
- Load-bearing: passes — The paper’s conclusions depend on it.
- Based: passes — The paper gives a reason why it holds.
A result the paper reports from its own data — it cites no other source for it, so there is none to check. The quote shows it is in the paper.
In the paper
“We found that our method for parameter selection in DBSCAN35 empirically optimized predicting KaiB’s two states from its MSA with no prior information about the KaiB landscape in the following way.”
§ Predicting multiple conformations via sequence clustering and AlphaFold2 > Methods > Clustering
plaindirectSingle case- Asserted: passes — The authors put it forward as true.
- Checkable: passes — It can be checked against evidence.
- Load-bearing: passes — The paper’s conclusions depend on it.
- Based: passes — The paper gives a reason why it holds.
A result the paper reports from its own data — it cites no other source for it, so there is none to check. The quote shows it is in the paper.
In the paper
“Clustering the KaiB MSA with varying epsilon values resulted in a peak in the number of clusters returned (Extended Data Fig. 2a).”
§ Predicting multiple conformations via sequence clustering and AlphaFold2 > Methods > Clustering
plaindirect- Asserted: passes — The authors put it forward as true.
- Checkable: passes — It can be checked against evidence.
- Load-bearing: passes — The paper’s conclusions depend on it.
- Based: passes — The paper gives a reason why it holds.
A result the paper reports from its own data — it cites no other source for it, so there is none to check. The quote shows it is in the paper.
In the paper
“We tested other methods for introducing noise in AF2 using KaiBRS with no MSA as a test—sampling across the five models, incorporating dropout and using random seeds—and found that none of these cause AF2 to predict any models of the FS state (Supplementary Discussion).”
§ Predicting multiple conformations via sequence clustering and AlphaFold2 > Discussion
plainSingle case- Asserted: passes — The authors put it forward as true.
- Checkable: passes — It can be checked against evidence.
- Load-bearing: unclear — It is unclear whether the paper’s conclusions depend on it.
- Based: passes — The paper gives a reason why it holds.
A result the paper reports from its own data — it cites no other source for it, so there is none to check. The quote shows it is in the paper.
In the paper
“Notably, six out of the ten sampled an analogous alternative fold with varying amounts of sampling (Extended Data Fig. 8).”
§ Predicting multiple conformations via sequence clustering and AlphaFold2 > AF-Cluster predicts novel states
plain- Asserted: passes — The authors put it forward as true.
- Checkable: passes — It can be checked against evidence.
- Load-bearing: passes — The paper’s conclusions depend on it.
- Based: passes — The paper gives a reason why it holds.
In the paper
“Despite these demonstrations of shortcomings, it was shown that subsampling the input MSA enables AF2 to predict known conformational changes of transporters14.”
§ Predicting multiple conformations via sequence clustering and AlphaFold2 > Main
What the sources say
- Not checked yetcites [14] Del Alamo, D., Sala, D., McHaourab, H. S. & Meiler, J. Sampling alternative conformational states of transporters and receptors with AlphaFold2. eLife 11, e75751 (2022). source
plaindirect- Asserted: passes — The authors put it forward as true.
- Checkable: passes — It can be checked against evidence.
- Load-bearing: passes — The paper’s conclusions depend on it.
- Based: passes — The paper gives a reason why it holds.
None of the sources cited for this claim have been checked yet.
In the paper
“yet AF2 has been demonstrated to fail in predicting multiple structures of metamorphic proteins11, proteins with apo/holo conformational changes12 and other multi-state proteins13 using its default settings.”
§ Predicting multiple conformations via sequence clustering and AlphaFold2 > Main
What the sources say
- Not checked yetcites [11] Chakravarty, D. & Porter, L. L. AlphaFold2 fails to predict protein fold switching. Protein Sci. 31, e4353 (2022). source
- Not checked yetcites [12] Saldano, T. et al. Impact of protein conformational diversity on AlphaFold predictions. Bioinformatics 38, 2742–2748 (2022). source
- Not checked yetcites [13] Huang, Y. J. et al. Assessment of prediction methods for protein structures determined by NMR in CASP14: impact of AlphaFold2. Proteins 89, 1959–1976 (2021). source
boosted- Asserted: passes — The authors put it forward as true.
- Checkable: passes — It can be checked against evidence.
- Load-bearing: passes — The paper’s conclusions depend on it.
- Based: passes — The paper gives a reason why it holds.
In the paper
“MAD2 has two topologically distinct monomeric structures that are in equilibrium under physiological conditions27.”
§ Predicting multiple conformations via sequence clustering and AlphaFold2 > Testing AF-Cluster on other proteins
What the sources say
- Not checked yetcites [27] Luo, X. et al. The Mad2 spindle checkpoint protein has two distinct natively folded states. Nat. Struct. Mol. Biol. 11, 338–345 (2004). source
plain- Asserted: passes — The authors put it forward as true.
- Checkable: passes — It can be checked against evidence.
- Load-bearing: passes — The paper’s conclusions depend on it.
- Based: passes — The paper gives a reason why it holds.
In the paper
“Beyond predicting the predominant state of naturally occurring proteins, we wanted to test the ability of AF-Cluster to predict effects of point mutations, a task that AF2 in its default settings has not achieved40.”
§ Predicting multiple conformations via sequence clustering and AlphaFold2 > Mutations to flip the KaiB equilibrium
What the sources say
- Not checked yetcites [40] Pak, M. A. et al. Using AlphaFold to predict the impact of single mutations on protein stability and function. PLoS ONE 18, e0282689 (2023). source
plain- Asserted: passes — The authors put it forward as true.
- Checkable: passes — It can be checked against evidence.
- Load-bearing: passes — The paper’s conclusions depend on it.
- Based: passes — The paper gives a reason why it holds.
A conclusion the paper draws from its own results — it cites no other source for it, so there is none to check. The quote shows it is in the paper.
In the paper
“if clusters are too small, they may contain insufficient signal to capture any state.”
§ Predicting multiple conformations via sequence clustering and AlphaFold2 > Methods > Clustering
hedgedconditional- Asserted: passes — The authors put it forward as true.
- Checkable: passes — It can be checked against evidence.
- Load-bearing: passes — The paper’s conclusions depend on it.
- Based: passes — The paper gives a reason why it holds.
A conclusion the paper draws from its own results — it cites no other source for it, so there is none to check. The quote shows it is in the paper.
In the paper
“However, if clusters are too large, they may dilute the signal from some states”
§ Predicting multiple conformations via sequence clustering and AlphaFold2 > Methods > Clustering
hedgedconditionalSingle case- Asserted: passes — The authors put it forward as true.
- Checkable: passes — It can be checked against evidence.
- Load-bearing: passes — The paper’s conclusions depend on it.
- Based: passes — The paper gives a reason why it holds.
A conclusion the paper draws from its own results — it cites no other source for it, so there is none to check. The quote shows it is in the paper.
In the paper
“An optimal clustering to identify sets of contacts corresponding to multiple states needs to balance two size effects: if clusters are too small, they may contain insufficient signal to capture any state.”
§ Predicting multiple conformations via sequence clustering and AlphaFold2 > Methods > Clustering
hedgedconditional- Asserted: passes — The authors put it forward as true.
- Checkable: passes — It can be checked against evidence.
- Load-bearing: passes — The paper’s conclusions depend on it.
- Based: passes — The paper gives a reason why it holds.
A conclusion the paper draws from its own results — it cites no other source for it, so there is none to check. The quote shows it is in the paper.
In the paper
“First, the pLDDT metric itself cannot be used as a measure of free energy.”
§ Predicting multiple conformations via sequence clustering and AlphaFold2 > Discussion
plainSingle case- Asserted: passes — The authors put it forward as true.
- Checkable: passes — It can be checked against evidence.
- Load-bearing: passes — The paper’s conclusions depend on it.
- Based: passes — The paper gives a reason why it holds.
A conclusion the paper draws from its own results — it cites no other source for it, so there is none to check. The quote shows it is in the paper.
In the paper
“suggesting that the limitation is in either the sequence retrieval or clustering stages, rather than the structure module of AF2.”
§ Predicting multiple conformations via sequence clustering and AlphaFold2 > Methods > Testing the sensitivity of AF2 and AF-Cluster to point mutations in the GA/GB system
hedgeddirect- Asserted: passes — The authors put it forward as true.
- Checkable: passes — It can be checked against evidence.
- Load-bearing: passes — The paper’s conclusions depend on it.
- Based: passes — The paper gives a reason why it holds.
A conclusion the paper draws from its own results — it cites no other source for it, so there is none to check. The quote shows it is in the paper.
In the paper
“suggesting that the evolutionary couplings that MSA Transformer detected in each cluster also affected predictions in AF2.”
§ Predicting multiple conformations via sequence clustering and AlphaFold2 > Methods > Investigating evolutionary couplings from clustering using MSA Transformer
hedgeddirect- Asserted: passes — The authors put it forward as true.
- Checkable: passes — It can be checked against evidence.
- Load-bearing: passes — The paper’s conclusions depend on it.
- Based: passes — The paper gives a reason why it holds.
In the paper
“On the basis of Procheck82 analysis of secondary structure elements, the Ramachandran statistics among the top 20 lowest-energy structures are 98% for most favoured regions, 2% for additional allowed regions and 0% for disallowed regions.”
§ Predicting multiple conformations via sequence clustering and AlphaFold2 > Methods > NMR data analysis and structure calculation
What the sources say
- Not checked yetcites [82] Laskowski, R. A., Rullmannn, J. A., MacArthur, M. W., Kaptein, R. & Thornton, J. M. AQUA and PROCHECK-NMR: programs for checking the quality of protein structures solved by NMR. J. Biomol. NMR 8, 477–486 (1996). source
plain- Asserted: passes — The authors put it forward as true.
- Checkable: passes — It can be checked against evidence.
- Load-bearing: unclear — It is unclear whether the paper’s conclusions depend on it.
- Based: passes — The paper gives a reason why it holds.
- It may state two separate claims as one. 33
- Probably not a substantial claim. 21
- The quote only partly states this claim. 1
A result the paper reports from its own data — it cites no other source for it, so there is none to check. The quote shows it is in the paper.
In the paper
“Notably, the average plDDT for the top five models for each state (84.2 for the active state, 73.9 for the autoinhibited) was higher than the plDDT of the autoinhibited state by the complete MSA (plDDT of 68.6), suggesting that clustering resulted in deconvolving conflicting sets of couplings.”
§ Predicting multiple conformations via sequence clustering and AlphaFold2 > Testing AF-Cluster on other proteins
hedgeddirectSingle case- Asserted: passes — The authors put it forward as true.
- Checkable: passes — It can be checked against evidence.
- Load-bearing: passes — The paper’s conclusions depend on it.
- Based: passes — The paper gives a reason why it holds.
It may state two separate claims as one.
In the paper
“We used the same set of clusters to make predictions using the unsupervised deep learning model MSA Transformer36 and found that these clusters contained evolutionary couplings for both states, and the score based on contact maps correlated with the root mean squared deviation (r.m.s.d.) in AF2 (Methods and Extended Data Fig. 3).”
§ Predicting multiple conformations via sequence clustering and AlphaFold2 > AF-Cluster predicts both KaiB states
What the sources say
- Not checked yetcites [36] Rao, R. M. et al. MSA Transformer. In Proc. International Conference on Machine Learning 8844–8856 (PMLR, 2021). source
plaincorrelational- Asserted: passes — The authors put it forward as true.
- Checkable: passes — It can be checked against evidence.
- Load-bearing: passes — The paper’s conclusions depend on it.
- Based: passes — The paper gives a reason why it holds.
It may state two separate claims as one.
A result the paper reports from its own data — it cites no other source for it, so there is none to check. The quote shows it is in the paper.
In the paper
“Notably, we found that the AF2 predictions from our MSA clusters comprised a distribution of structures, with the highest-scored regions of the distribution corresponding to the ground and FS state.”
§ Predicting multiple conformations via sequence clustering and AlphaFold2 > AF-Cluster predicts both KaiB states
plaincorrelational- Asserted: passes — The authors put it forward as true.
- Checkable: passes — It can be checked against evidence.
- Load-bearing: passes — The paper’s conclusions depend on it.
- Based: passes — The paper gives a reason why it holds.
It may state two separate claims as one.
A result the paper reports from its own data — it cites no other source for it, so there is none to check. The quote shows it is in the paper.
In the paper
“Two prominent states are observed that correspond to the largest-sized MSA clusters (Extended Data Fig. 7a), and both of which have plDDT values that are statistically significantly higher than the rest of the set (Extended Data Fig. 7b).”
§ Predicting multiple conformations via sequence clustering and AlphaFold2 > AF-Cluster predicts novel states
plaincorrelationalSingle case- Asserted: passes — The authors put it forward as true.
- Checkable: passes — It can be checked against evidence.
- Load-bearing: passes — The paper’s conclusions depend on it.
- Based: passes — The paper gives a reason why it holds.
It may state two separate claims as one.
A result the paper reports from its own data — it cites no other source for it, so there is none to check. The quote shows it is in the paper.
In the paper
“For example, clusters predicting the FS state were enriched for arginine at position 68, whereas clusters predicting the ground state at position 68 were enriched for leucine, a switch between a charged and a hydrophobic residue.”
§ Predicting multiple conformations via sequence clustering and AlphaFold2 > Mutations to flip the KaiB equilibrium
plaincorrelational- Asserted: passes — The authors put it forward as true.
- Checkable: passes — It can be checked against evidence.
- Load-bearing: passes — The paper’s conclusions depend on it.
- Based: passes — The paper gives a reason why it holds.
It may state two separate claims as one.
A result the paper reports from its own data — it cites no other source for it, so there is none to check. The quote shows it is in the paper.
In the paper
“We found that, for uniformly subsampled MSAs of size 10, 1 out of 500 samples was within 3 Å of the ground state, with lower confidence than the MSA cluster samples (Extended Data Fig. 2e). Uniformly subsampled MSAs of size 100 did not sample the ground state at all.”
§ Predicting multiple conformations via sequence clustering and AlphaFold2 > AF-Cluster predicts both KaiB states
plainn = 500- Asserted: passes — The authors put it forward as true.
- Checkable: passes — It can be checked against evidence.
- Load-bearing: passes — The paper’s conclusions depend on it.
- Based: passes — The paper gives a reason why it holds.
It may state two separate claims as one.
None of the sources cited for this claim have been checked yet.
In the paper
“For example, variants from R. sphaeroides32, T. elongatus5 and Synechococcus elongatus31 all were predicted in the ground state, confirming their characterized circadian-rhythm function.”
§ Predicting multiple conformations via sequence clustering and AlphaFold2 > Experimental test of KaiB predictions
What the sources say
- Not checked yetcites [32] Pitsawong, W. et al. From primordial clocks to circadian oscillators. Nature 616, 183–189 (2023). source
- Not checked yetcites [5] Chang, Y. G. et al. Circadian rhythms. A protein fold switch joins the circadian oscillator to clock output in cyanobacteria. Science 349, 324–328 (2015). source
- Not checked yetcites [31] Ishiura, M. et al. Expression of a gene cluster kaiABC as a circadian feedback process in cyanobacteria. Science 281, 1519–1523 (1998). source
plaincorrelational- Asserted: passes — The authors put it forward as true.
- Checkable: passes — It can be checked against evidence.
- Load-bearing: passes — The paper’s conclusions depend on it.
- Based: passes — The paper gives a reason why it holds.
It may state two separate claims as one.
A result the paper reports from its own data — it cites no other source for it, so there is none to check. The quote shows it is in the paper.
In the paper
“Comparison of the average peak intensity ratios of the assignable minor (ground state) peaks to those of the major state (FS) peaks show that the mutant occupies the FS state with a population of 86% (versus 11% in the WT), and the ground state with a population of 14% (versus 89% in the WT) (Fig. 3f).”
§ Predicting multiple conformations via sequence clustering and AlphaFold2 > Mutations to flip the KaiB equilibrium
plainSingle case- Asserted: passes — The authors put it forward as true.
- Checkable: passes — It can be checked against evidence.
- Load-bearing: passes — The paper’s conclusions depend on it.
- Based: passes — The paper gives a reason why it holds.
It may state two separate claims as one.
In the paper
“One state corresponds to the known thioredoxin-like conformation of Mpt53 (ref. 42), whereas the other state corresponds to a conformation with a different secondary structure layout (Fig. 5d,e).”
§ Predicting multiple conformations via sequence clustering and AlphaFold2 > AF-Cluster predicts novel states
What the sources say
- Not checked yetcites [42] Goulding, C. W. et al. Gram-positive DsbE proteins function differently from Gram-negative DsbE homologs. A structure to function analysis of DsbE from Mycobacterium tuberculosis. J. Biol. Chem. 279, 3516–3524 (2004). source
plaincorrelationalSingle case- Asserted: passes — The authors put it forward as true.
- Checkable: passes — It can be checked against evidence.
- Load-bearing: passes — The paper’s conclusions depend on it.
- Based: passes — The paper gives a reason why it holds.
It may state two separate claims as one.
In the paper
“The closest structure that we found (PDB: 3EMX) adopted a similar secondary structure to the Mpt53 alternative structure. This structure is of an unspecified thioredoxin from the archaea Aeropyrum pernix with no associated publication.”
§ Predicting multiple conformations via sequence clustering and AlphaFold2 > AF-Cluster predicts novel states
What the sources say
- Not checked yetcites 3EMX
plaincorrelationalSingle case- Asserted: passes — The authors put it forward as true.
- Checkable: passes — It can be checked against evidence.
- Load-bearing: unclear — It is unclear whether the paper’s conclusions depend on it.
- Based: passes — The paper gives a reason why it holds.
It may state two separate claims as one.
A result the paper reports from its own data — it cites no other source for it, so there is none to check. The quote shows it is in the paper.
In the paper
“Notably, predicting the 3D structure of KaiB using just the 50 MSA sequences that are closest by number of mutations (hereafter, edit distance) to KaiBTE resulted in a prediction of the ground state (Fig. 1c (right)); however, predicting the 3D structure of KaiBTE using the closest 100 sequences returned to predicting the FS state.”
§ Predicting multiple conformations via sequence clustering and AlphaFold2 > AF-Cluster predicts both KaiB states
plaindirect- Asserted: passes — The authors put it forward as true.
- Checkable: passes — It can be checked against evidence.
- Load-bearing: passes — The paper’s conclusions depend on it.
- Based: passes — The paper gives a reason why it holds.
It may state two separate claims as one.
A result the paper reports from its own data — it cites no other source for it, so there is none to check. The quote shows it is in the paper.
In the paper
“Notably, we noticed that KaiB-4 variants were evolutionarily close to the better-studied KaiB-1 variants involved in the circadian clock, yet the KaiB-4 variants were predicted by AF-Cluster to primarily occupy the FS state (Fig. 2c).”
§ Predicting multiple conformations via sequence clustering and AlphaFold2 > Experimental test of KaiB predictions
plaincorrelational- Asserted: passes — The authors put it forward as true.
- Checkable: passes — It can be checked against evidence.
- Load-bearing: passes — The paper’s conclusions depend on it.
- Based: passes — The paper gives a reason why it holds.
It may state two separate claims as one.
A result the paper reports from its own data — it cites no other source for it, so there is none to check. The quote shows it is in the paper.
In the paper
“In the second state, strand β1 replaces β5 within the β-sheet. The α-helix α4 is displaced to the opposite side of the β-sheet, and α5 is rotated.”
§ Predicting multiple conformations via sequence clustering and AlphaFold2 > AF-Cluster predicts novel states
plainSingle case- Asserted: passes — The authors put it forward as true.
- Checkable: passes — It can be checked against evidence.
- Load-bearing: passes — The paper’s conclusions depend on it.
- Based: passes — The paper gives a reason why it holds.
It may state two separate claims as one.
A result the paper reports from its own data — it cites no other source for it, so there is none to check. The quote shows it is in the paper.
In the paper
“Importantly, we show that, using our method, AF-Cluster, both states are sampled and scored with high confidence by AF2’s learned predicted local distance difference test (plDDT) measure.”
§ Predicting multiple conformations via sequence clustering and AlphaFold2 > Main
boosteddirect- Asserted: passes — The authors put it forward as true.
- Checkable: passes — It can be checked against evidence.
- Load-bearing: passes — The paper’s conclusions depend on it.
- Based: passes — The paper gives a reason why it holds.
It may state two separate claims as one.
A result the paper reports from its own data — it cites no other source for it, so there is none to check. The quote shows it is in the paper.
In the paper
“The 1H-15N heteronuclear single quantum coherence (HSQC) spectra in both the wild-type (WT) and KaiBRS-3m indicate the presence of major and minor state peaks, with the populations appearing to be flipped (Fig. 3d).”
§ Predicting multiple conformations via sequence clustering and AlphaFold2 > Mutations to flip the KaiB equilibrium
hedgedcorrelational- Asserted: passes — The authors put it forward as true.
- Checkable: passes — It can be checked against evidence.
- Load-bearing: passes — The paper’s conclusions depend on it.
- Based: passes — The paper gives a reason why it holds.
It may state two separate claims as one.
A result the paper reports from its own data — it cites no other source for it, so there is none to check. The quote shows it is in the paper.
In the paper
“KaiBTV-4 was found to be stably folded at 35 °C and, after backbone assignments, we found peak duplication for many peaks corresponding to a major stable and minor unfolded state (Extended Data Fig. 4).”
§ Predicting multiple conformations via sequence clustering and AlphaFold2 > Experimental test of KaiB predictions
plaincorrelationalSingle case- Asserted: passes — The authors put it forward as true.
- Checkable: passes — It can be checked against evidence.
- Load-bearing: passes — The paper’s conclusions depend on it.
- Based: passes — The paper gives a reason why it holds.
It may state two separate claims as one.
The paper states this without a source or data behind it here, so there is nothing to check it against. The quote shows it is in the paper.
In the paper
“For epsilon > epsmax, more sequences are clustered, so the number of clusters is decreasing because clusters are merged.”
§ Predicting multiple conformations via sequence clustering and AlphaFold2 > Methods > Clustering
plaindirect- Asserted: passes — The authors put it forward as true.
- Checkable: passes — It can be checked against evidence.
- Load-bearing: fails — The paper’s conclusions may not depend on it.
- Based: passes — The paper gives a reason why it holds.
Probably not a substantial claim. The paper’s conclusions may not depend on it. It may state two separate claims as one.
A result the paper reports from its own data — it cites no other source for it, so there is none to check. The quote shows it is in the paper.
In the paper
“A total of 479 of these were hits for both the known and alternative state, with 368 exclusively for the known and 208 exclusively for the alternative state.”
§ Predicting multiple conformations via sequence clustering and AlphaFold2 > Methods > Screening for Mpt53 structure homologues
plain- Asserted: passes — The authors put it forward as true.
- Checkable: passes — It can be checked against evidence.
- Load-bearing: unclear — It is unclear whether the paper’s conclusions depend on it.
- Based: passes — The paper gives a reason why it holds.
It may state two separate claims as one.
A result the paper reports from its own data — it cites no other source for it, so there is none to check. The quote shows it is in the paper.
In the paper
“The resulting tree is shown in Extended Data Fig. 9, and demonstrates that, while the closest structure homologues to the known state are clustered, the closest homologues to the alternative state are dispersed across the tree.”
§ Predicting multiple conformations via sequence clustering and AlphaFold2 > Methods > Screening for Mpt53 structure homologues
boostedcorrelational- Asserted: passes — The authors put it forward as true.
- Checkable: passes — It can be checked against evidence.
- Load-bearing: passes — The paper’s conclusions depend on it.
- Based: passes — The paper gives a reason why it holds.
It may state two separate claims as one.
A result the paper reports from its own data — it cites no other source for it, so there is none to check. The quote shows it is in the paper.
In the paper
“We found that clusters from AF-Cluster scored higher to the ground state (Extended Data Fig. 3b)”
§ Predicting multiple conformations via sequence clustering and AlphaFold2 > Methods > Investigating evolutionary couplings from clustering using MSA Transformer
plaincorrelational- Asserted: passes — The authors put it forward as true.
- Checkable: passes — It can be checked against evidence.
- Load-bearing: passes — The paper’s conclusions depend on it.
- Based: passes — The paper gives a reason why it holds.
The quote only partly states this claim.
A result the paper reports from its own data — it cites no other source for it, so there is none to check. The quote shows it is in the paper.
In the paper
“Seven out of the depicted nine proteins had a helix in an analogous spot to the α-4 helix location in the Mpt53 alternative structure.”
§ Predicting multiple conformations via sequence clustering and AlphaFold2 > Methods > Screening for Mpt53 structure homologues
plain- Asserted: passes — The authors put it forward as true.
- Checkable: passes — It can be checked against evidence.
- Load-bearing: fails — The paper’s conclusions may not depend on it.
- Based: passes — The paper gives a reason why it holds.
Probably not a substantial claim. The paper’s conclusions may not depend on it.
A result the paper reports from its own data — it cites no other source for it, so there is none to check. The quote shows it is in the paper.
In the paper
“We found that the highest-pLDDT model from AF-Cluster correctly predicted the most stable folds for 10 out of 12, whereas default AF2 correctly predicted 8 out of 12.”
§ Predicting multiple conformations via sequence clustering and AlphaFold2 > Discussion
plaincorrelational- Asserted: passes — The authors put it forward as true.
- Checkable: passes — It can be checked against evidence.
- Load-bearing: passes — The paper’s conclusions depend on it.
- Based: passes — The paper gives a reason why it holds.
It may state two separate claims as one.
A result the paper reports from its own data — it cites no other source for it, so there is none to check. The quote shows it is in the paper.
In the paper
“For both states, we found that the AUC scores correlated with the r.m.s.d. to the FS state from AF2 (ground state: Spearman R = −0.32, P = 2 × 10⁻⁹; FS state: Spearman R = −0.34, P = 4 × 10⁻¹⁰)”
§ Predicting multiple conformations via sequence clustering and AlphaFold2 > Methods > Investigating evolutionary couplings from clustering using MSA Transformer
plaincorrelational- Asserted: passes — The authors put it forward as true.
- Checkable: passes — It can be checked against evidence.
- Load-bearing: passes — The paper’s conclusions depend on it.
- Based: passes — The paper gives a reason why it holds.
It may state two separate claims as one.
In the paper
“We took the union of these two sets and applied CD-HIT65 with default parameters to filter for highly similar sequences. This resulted in 1,055 sequences remaining.”
§ Predicting multiple conformations via sequence clustering and AlphaFold2 > Methods > Screening for Mpt53 structure homologues
What the sources say
- Not checked yetcites [65] Fu, L., Niu, B., Zhu, Z., Wu, S. & Li, W. CD-HIT: accelerated for clustering the next-generation sequencing data. Bioinformatics 28, 3150–3152 (2012). source
plaindirect- Asserted: passes — The authors put it forward as true.
- Checkable: passes — It can be checked against evidence.
- Load-bearing: passes — The paper’s conclusions depend on it.
- Based: passes — The paper gives a reason why it holds.
Probably not a substantial claim.
A result the paper reports from its own data — it cites no other source for it, so there is none to check. The quote shows it is in the paper.
In the paper
“A few structures had higher weighted r.m.s.d. for the alternative Mpt53 state than for the known Mpt53 state (Extended Data Fig. 7e (orange points) and 7f (structures)).”
§ Predicting multiple conformations via sequence clustering and AlphaFold2 > Methods > Screening for Mpt53 structure homologues
plain- Asserted: passes — The authors put it forward as true.
- Checkable: passes — It can be checked against evidence.
- Load-bearing: fails — The paper’s conclusions may not depend on it.
- Based: passes — The paper gives a reason why it holds.
Probably not a substantial claim. The paper’s conclusions may not depend on it.
A result the paper reports from its own data — it cites no other source for it, so there is none to check. The quote shows it is in the paper.
In the paper
“This resulted in 1,822 matches for the Mpt53 known state and 1,245 matches for the Mpt53 alternative state (Extended Data Fig. 7d).”
§ Predicting multiple conformations via sequence clustering and AlphaFold2 > Methods > Screening for Mpt53 structure homologues
plain- Asserted: passes — The authors put it forward as true.
- Checkable: passes — It can be checked against evidence.
- Load-bearing: fails — The paper’s conclusions may not depend on it.
- Based: passes — The paper gives a reason why it holds.
Probably not a substantial claim. The paper’s conclusions may not depend on it. It may state two separate claims as one.
A result the paper reports from its own data — it cites no other source for it, so there is none to check. The quote shows it is in the paper.
In the paper
“We identified a KaiB variant in T. elongatus vestitus that is phylogenetically close to the known fold-switching KaiB for which the ground state is thermodynamically favoured, yet was predicted and experimentally corroborated to be stabilized in the FS state.”
§ Predicting multiple conformations via sequence clustering and AlphaFold2 > Discussion
plaincorrelationalSingle case- Asserted: passes — The authors put it forward as true.
- Checkable: passes — It can be checked against evidence.
- Load-bearing: passes — The paper’s conclusions depend on it.
- Based: passes — The paper gives a reason why it holds.
It may state two separate claims as one.
None of the sources cited for this claim have been checked yet.
In the paper
“The premise of methods to infer structure based on evolutionary couplings is that, because amino acids exist and evolve in the context of 3D structure, they are not free to evolve independently, but instead co-evolve in patterns reflective of the underlying structure.”
§ Predicting multiple conformations via sequence clustering and AlphaFold2 > Main
What the sources say
- Not checked yetcites [7] Altschuh, D., Lesk, A. M., Bloomer, A. C. & Klug, A. Correlation of co-ordinated amino acid substitutions with function in viruses related to tobacco mosaic virus. J. Mol. Biol. 193, 693–707 (1987). source
- Not checked yetcites [8] Lockless, S. W. & Ranganathan, R. Evolutionarily conserved pathways of energetic connectivity in protein families. Science 286, 295–299 (1999). source
- Not checked yetcites [9] Marks, D. S. et al. Protein 3D structure computed from evolutionary sequence variation. PLoS ONE 6, e28766 (2011). source
- Not checked yetcites [10] Morcos, F. et al. Direct-coupling analysis of residue coevolution captures native contacts across many protein families. Proc. Natl Acad. Sci. USA 108, E1293–E1301 (2011). source
plaindirect- Asserted: passes — The authors put it forward as true.
- Checkable: passes — It can be checked against evidence.
- Load-bearing: fails — The paper’s conclusions may not depend on it.
- Based: passes — The paper gives a reason why it holds.
Probably not a substantial claim. The paper’s conclusions may not depend on it.
In the paper
“Understanding the mechanistic basis of any protein’s functions requires understanding the complete set of conformational substates that it can adopt2.”
§ Predicting multiple conformations via sequence clustering and AlphaFold2 > Main
What the sources say
- Not checked yetcites [2] Henzler-Wildman, K. & Kern, D. Dynamic personalities of proteins. Nature 450, 964–972 (2007). source
plaindirect- Asserted: passes — The authors put it forward as true.
- Checkable: fails — It may be too vague to check against evidence.
- Load-bearing: passes — The paper’s conclusions depend on it.
- Based: passes — The paper gives a reason why it holds.
Probably not a substantial claim. It may be too vague to check against evidence.
None of the sources cited for this claim have been checked yet.
In the paper
“Indeed, methods for inferring evolutionary couplings have already demonstrated that contacts corresponding to multiple states can be observed at the level of entire MSAs for membrane proteins15, ligand-induced conformational changes16 and multimerization-induced conformational changes17.”
§ Predicting multiple conformations via sequence clustering and AlphaFold2 > Main
What the sources say
- Not checked yetcites [15] Hopf, T. A. et al. Three-dimensional structures of membrane proteins from genomic sequencing. Cell 149, 1607–1621 (2012). source
- Not checked yetcites [16] Morcos, F., Jana, B., Hwa, T. & Onuchic, J. N. Coevolutionary signals across protein lineages help capture multiple protein conformations. Proc. Natl Acad. Sci. USA 110, 20533–20538 (2013). source
- Not checked yetcites [17] Uguzzoni, G. et al. Large-scale identification of coevolution signals across homo-oligomeric protein interfaces by direct coupling analysis. Proc. Natl Acad. Sci. USA 114, E2662–E2671 (2017). source
boostedcorrelational- Asserted: passes — The authors put it forward as true.
- Checkable: passes — It can be checked against evidence.
- Load-bearing: passes — The paper’s conclusions depend on it.
- Based: passes — The paper gives a reason why it holds.
It may state two separate claims as one.
In the paper
“For example, although the metamorphic protein KaiB contains only 108 residues, it undergoes a conformational change that affects the secondary structure of around 40 residues in its C-terminal part, switching between a canonical thioredoxin-like structure and a unique alternative conformation5”
§ Predicting multiple conformations via sequence clustering and AlphaFold2 > Main
What the sources say
- Not checked yetcites [5] Chang, Y. G. et al. Circadian rhythms. A protein fold switch joins the circadian oscillator to clock output in cyanobacteria. Science 349, 324–328 (2015). source
plain- Asserted: passes — The authors put it forward as true.
- Checkable: passes — It can be checked against evidence.
- Load-bearing: unclear — It is unclear whether the paper’s conclusions depend on it.
- Based: passes — The paper gives a reason why it holds.
It may state two separate claims as one.
In the paper
“A computational analysis of the Protein Data Bank (PDB) that identified changes in secondary structure between protein models sharing the same sequence suggested that between 0.5% and 4% of all proteins are fold switching29.”
§ Predicting multiple conformations via sequence clustering and AlphaFold2 > Main
What the sources say
- Not checked yetcites [29] Porter, L. L. & Looger, L. L. Extant fold-switching proteins are widespread. Proc. Natl Acad. Sci. USA 115, 5968–5973 (2018). source
hedged- Asserted: passes — The authors put it forward as true.
- Checkable: passes — It can be checked against evidence.
- Load-bearing: fails — The paper’s conclusions may not depend on it.
- Based: passes — The paper gives a reason why it holds.
Probably not a substantial claim. The paper’s conclusions may not depend on it.
In the paper
“Mpt53 is an extracellular single-domain enzyme that is suggested to ensure correct folding of several cell-wall and extracellular protein substrates in M. tuberculosis by catalysing disulfide oxidation42.”
§ Predicting multiple conformations via sequence clustering and AlphaFold2 > AF-Cluster predicts novel states
What the sources say
- Not checked yetcites [42] Goulding, C. W. et al. Gram-positive DsbE proteins function differently from Gram-negative DsbE homologs. A structure to function analysis of DsbE from Mycobacterium tuberculosis. J. Biol. Chem. 279, 3516–3524 (2004). source
hedgedconditional- Asserted: passes — The authors put it forward as true.
- Checkable: passes — It can be checked against evidence.
- Load-bearing: fails — The paper’s conclusions may not depend on it.
- Based: passes — The paper gives a reason why it holds.
Probably not a substantial claim. The paper’s conclusions may not depend on it.
In the paper
“Fewer than ten metamorphic protein families have been thoroughly experimentally characterized21, spanning a diverse range of functions.”
§ Predicting multiple conformations via sequence clustering and AlphaFold2 > Main
What the sources say
- Not checked yetcites [21] Dishman, A. F. & Volkman, B. F. Design and discovery of metamorphic proteins. Curr. Opin. Struct. Biol. 74, 102380 (2022). source
plainn = 10- Asserted: passes — The authors put it forward as true.
- Checkable: passes — It can be checked against evidence.
- Load-bearing: fails — The paper’s conclusions may not depend on it.
- Based: passes — The paper gives a reason why it holds.
Probably not a substantial claim. The paper’s conclusions may not depend on it. It may state two separate claims as one.
In the paper
“In RfaH, the C-terminal domain (CTD) interconverts between an α-helix bundle and a β-barrel through binding to functional partners23.”
§ Predicting multiple conformations via sequence clustering and AlphaFold2 > Testing AF-Cluster on other proteins
What the sources say
- Not checked yetcites [23] Zuber, P. K., Schweimer, K., Rosch, P., Artsimovitch, I. & Knauer, S. H. Reversible fold-switching controls the functional cycle of the antitermination factor RfaH. Nat. Commun. 10, 702 (2019). source
plaindirect- Asserted: passes — The authors put it forward as true.
- Checkable: passes — It can be checked against evidence.
- Load-bearing: passes — The paper’s conclusions depend on it.
- Based: passes — The paper gives a reason why it holds.
Probably not a substantial claim.
A conclusion the paper draws from its own results — it cites no other source for it, so there is none to check. The quote shows it is in the paper.
In the paper
“Our results demonstrate that, in the oncoming age of AF2-enabled structural biology, related sequences for any given protein target might contain a signal for more than one biologically relevant structure, and that deep-learning methods can be used to detect and analyse these multiple conformational states.”
§ Predicting multiple conformations via sequence clustering and AlphaFold2 > Main
hedgedcorrelational- Asserted: passes — The authors put it forward as true.
- Checkable: passes — It can be checked against evidence.
- Load-bearing: passes — The paper’s conclusions depend on it.
- Based: passes — The paper gives a reason why it holds.
It may state two separate claims as one.
None of the sources cited for this claim have been checked yet.
In the paper
“KaiB is a circadian-rhythm protein found in cyanobacteria5,31 and proteobacteria32 that adopts two conformations with distinct secondary structures as part of its function”
§ Predicting multiple conformations via sequence clustering and AlphaFold2 > AF-Cluster predicts both KaiB states
What the sources say
- Not checked yetcites [5] Chang, Y. G. et al. Circadian rhythms. A protein fold switch joins the circadian oscillator to clock output in cyanobacteria. Science 349, 324–328 (2015). source
- Not checked yetcites [31] Ishiura, M. et al. Expression of a gene cluster kaiABC as a circadian feedback process in cyanobacteria. Science 281, 1519–1523 (1998). source
- Not checked yetcites [32] Pitsawong, W. et al. From primordial clocks to circadian oscillators. Nature 616, 183–189 (2023). source
plain- Asserted: passes — The authors put it forward as true.
- Checkable: passes — It can be checked against evidence.
- Load-bearing: passes — The paper’s conclusions depend on it.
- Based: passes — The paper gives a reason why it holds.
It may state two separate claims as one.
In the paper
“The thermodynamically favoured state for KaiB from T. elongatus (KaiBTE) is the ground state; the FS structure was first solved in a complex with KaiC33, and could be solved for the isolated KaiB only by introducing stabilizing mutations to this variant33.”
§ Predicting multiple conformations via sequence clustering and AlphaFold2 > AF-Cluster predicts both KaiB states
What the sources say
- Not checked yetcites [33] Tseng, R. et al. Structural basis of the day-night transition in a bacterial circadian clock. Science 355, 1174–1180 (2017). source
plaindirect- Asserted: passes — The authors put it forward as true.
- Checkable: passes — It can be checked against evidence.
- Load-bearing: passes — The paper’s conclusions depend on it.
- Based: passes — The paper gives a reason why it holds.
It may state two separate claims as one.
None of the sources cited for this claim have been checked yet.
In the paper
“As previous studies have identified evolutionary couplings corresponding to multiple states of domain-based conformational changes15,16,20”
§ Predicting multiple conformations via sequence clustering and AlphaFold2 > Discussion
What the sources say
- Not checked yetcites [15] Hopf, T. A. et al. Three-dimensional structures of membrane proteins from genomic sequencing. Cell 149, 1607–1621 (2012). source
- Not checked yetcites [16] Morcos, F., Jana, B., Hwa, T. & Onuchic, J. N. Coevolutionary signals across protein lineages help capture multiple protein conformations. Proc. Natl Acad. Sci. USA 110, 20533–20538 (2013). source
- Not checked yetcites [20] Malinverni, D. & Barducci, A. Coevolutionary analysis of protein subfamilies by sequence reweighting. Entropy 21, 1127 (2020). source
plaincorrelational- Asserted: passes — The authors put it forward as true.
- Checkable: passes — It can be checked against evidence.
- Load-bearing: passes — The paper’s conclusions depend on it.
- Based: passes — The paper gives a reason why it holds.
Probably not a substantial claim.
What the paper did — it cites no source for this, so there is none to check. The quote shows it is in the paper.
In the paper
“The assignments from I-PINE were verified and some were adjusted manually in POKY.”
§ Predicting multiple conformations via sequence clustering and AlphaFold2 > Methods > NMR data analysis and structure calculation
plain- Asserted: passes — The authors put it forward as true.
- Checkable: passes — It can be checked against evidence.
- Load-bearing: fails — The paper’s conclusions may not depend on it.
- Based: passes — The paper gives a reason why it holds.
Probably not a substantial claim. The paper’s conclusions may not depend on it. It may state two separate claims as one.
In the paper
“MSA transformer is an unsupervised learning method, which signifies that its contact predictions purely reflect evolutionary couplings learned in sequences, rather than being supervised on structure as is the case AF2.”
§ Predicting multiple conformations via sequence clustering and AlphaFold2 > Methods > Investigating evolutionary couplings from clustering using MSA Transformer
What the sources say
- Not checked yetcites [36] Rao, R. M. et al. MSA Transformer. In Proc. International Conference on Machine Learning 8844–8856 (PMLR, 2021). source
plaindirect- Asserted: passes — The authors put it forward as true.
- Checkable: passes — It can be checked against evidence.
- Load-bearing: passes — The paper’s conclusions depend on it.
- Based: passes — The paper gives a reason why it holds.
It may state two separate claims as one.
In the paper
“Mpt53 oxidizes the human kinase TAK1, which was shown to trigger an immune response52.”
§ Predicting multiple conformations via sequence clustering and AlphaFold2 > Discussion
What the sources say
- Not checked yetcites [52] Wang, L. et al. Oxidization of TGFbeta-activated kinase by MPT53 is required for immunity to Mycobacterium tuberculosis. Nat. Microbiol. 4, 1378–1388 (2019). source
plaindirect- Asserted: passes — The authors put it forward as true.
- Checkable: passes — It can be checked against evidence.
- Load-bearing: fails — The paper’s conclusions may not depend on it.
- Based: passes — The paper gives a reason why it holds.
Probably not a substantial claim. The paper’s conclusions may not depend on it. It may state two separate claims as one.
None of the sources cited for this claim have been checked yet.
In the paper
“The final structures were validated using the wwPDB validation tool79,80 (https://validate-rcsb-east.wwpdb.org/validservice/) and the Protein Structure Validation Suite (PSVS)81.”
§ Predicting multiple conformations via sequence clustering and AlphaFold2 > Methods > NMR data analysis and structure calculation
What the sources say
- Not checked yetcites [79] Xu, W. et al. Announcing the launch of Protein Data Bank China as an associate member of the Worldwide Protein Data Bank Partnership. Acta Crystallogr. D 79, 792–795 (2023). source
- Not checked yetcites [80] ww, P. D. B. c. Protein Data Bank: the single global archive for 3D macromolecular structure data. Nucleic Acids Res. 47, D520–D528 (2019). source
- Not checked yetcites [81] Bhattacharya, A., Tejero, R. & Montelione, G. T. Evaluating protein structures determined by structural genomics consortia. Proteins 66, 778–795 (2007). source
plain- Asserted: passes — The authors put it forward as true.
- Checkable: passes — It can be checked against evidence.
- Load-bearing: fails — The paper’s conclusions may not depend on it.
- Based: passes — The paper gives a reason why it holds.
Probably not a substantial claim. The paper’s conclusions may not depend on it.
A conclusion the paper draws from its own results — it cites no other source for it, so there is none to check. The quote shows it is in the paper.
In the paper
“Given that known metamorphic proteins often switch folds through cellular stimuli, it may in general be difficult to experimentally validate novel folds identified through computational methods if the stimulus—whether pH, redox reaction or a binding partner—is unknown.”
§ Predicting multiple conformations via sequence clustering and AlphaFold2 > Discussion
hedgedconditional- Asserted: passes — The authors put it forward as true.
- Checkable: fails — It may be too vague to check against evidence.
- Load-bearing: fails — The paper’s conclusions may not depend on it.
- Based: passes — The paper gives a reason why it holds.
Probably not a substantial claim. It may be too vague to check against evidence. The paper’s conclusions may not depend on it.
A conclusion the paper draws from its own results — it cites no other source for it, so there is none to check. The quote shows it is in the paper.
In the paper
“However, conformational substates not present in the evolutionary signal may require alternative methods.”
§ Predicting multiple conformations via sequence clustering and AlphaFold2 > Discussion
hedgedconditional- Asserted: passes — The authors put it forward as true.
- Checkable: passes — It can be checked against evidence.
- Load-bearing: fails — The paper’s conclusions may not depend on it.
- Based: fails — The paper may give no reason why it holds.
Probably not a substantial claim. The paper’s conclusions may not depend on it. The paper may give no reason why it holds.
What the paper did — it cites no source for this, so there is none to check. The quote shows it is in the paper.
In the paper
“The triple mutation was confirmed by DNA sequencing using GeneWiz primers.”
§ Predicting multiple conformations via sequence clustering and AlphaFold2 > Methods > Protein expression and purification
plain- Asserted: passes — The authors put it forward as true.
- Checkable: passes — It can be checked against evidence.
- Load-bearing: fails — The paper’s conclusions may not depend on it.
- Based: passes — The paper gives a reason why it holds.
Probably not a substantial claim. The paper’s conclusions may not depend on it.
In the paper
“If the previous estimate29 that 0.5–4% of all proteins contain fold-switching domains is accurate, this would correspond to approximately 1–8 million fold-switching proteins with possible alternative states that would not be predicted by the default AF2 method.”
§ Predicting multiple conformations via sequence clustering and AlphaFold2 > Discussion
What the sources say
- Not checked yetcites [29] Porter, L. L. & Looger, L. L. Extant fold-switching proteins are widespread. Proc. Natl Acad. Sci. USA 115, 5968–5973 (2018). source
hedgedconditional- Asserted: passes — The authors put it forward as true.
- Checkable: passes — It can be checked against evidence.
- Load-bearing: fails — The paper’s conclusions may not depend on it.
- Based: passes — The paper gives a reason why it holds.
Probably not a substantial claim. The paper’s conclusions may not depend on it.
A conclusion the paper draws from its own results — it cites no other source for it, so there is none to check. The quote shows it is in the paper.
In the paper
“Second, the number of models returned for each state from AF-Cluster will reflect the abundance of constructs reflecting different states across the protein family, which cannot be interpreted as that state’s Boltzmann weight.”
§ Predicting multiple conformations via sequence clustering and AlphaFold2 > Discussion
hedgeddirect- Asserted: passes — The authors put it forward as true.
- Checkable: passes — It can be checked against evidence.
- Load-bearing: passes — The paper’s conclusions depend on it.
- Based: passes — The paper gives a reason why it holds.
It may state two separate claims as one.
What the paper did — it cites no source for this, so there is none to check. The quote shows it is in the paper.
In the paper
“All of the samples were purified to homogeneity with a single band at ~10 kDa on a Bis-Tris 4–12% gradient SDS–PAGE gel (GenScript).”
§ Predicting multiple conformations via sequence clustering and AlphaFold2 > Methods > Protein expression and purification
plain- Asserted: passes — The authors put it forward as true.
- Checkable: passes — It can be checked against evidence.
- Load-bearing: fails — The paper’s conclusions may not depend on it.
- Based: passes — The paper gives a reason why it holds.
Probably not a substantial claim. The paper’s conclusions may not depend on it.
None of the sources cited for this claim have been checked yet.
In the paper
“Disease-causing point mutations are often due to population changes of protein substates3,4 and there is therefore great interest for methods to predict the effects of point mutations on structural ensembles and free energy.”
§ Predicting multiple conformations via sequence clustering and AlphaFold2 > Discussion
What the sources say
- Not checked yetcites [3] Wang, Z. & Moult, J. SNPs, protein structure, and disease. Hum. Mutat. 17, 263–270 (2001). source
- Not checked yetcites [4] Stein, A., Fowler, D. M., Hartmann-Petersen, R. & Lindorff-Larsen, K. Biophysical and mechanistic models for disease-causing protein variants. Trends Biochem. Sci. 44, 575–588 (2019). source
plaindirect- Asserted: passes — The authors put it forward as true.
- Checkable: passes — It can be checked against evidence.
- Load-bearing: passes — The paper’s conclusions depend on it.
- Based: passes — The paper gives a reason why it holds.
Probably not a substantial claim.
The paper relies on this without support.
Proteins must evolve in the context of the multiple conformational states that they adopt.
“However, proteins must evolve in the context of the multiple conformational states that they adopt.”
The paper relies on this without support.
There is a need for methods that deconvolve signal from multiple states if they are not already both present at the level of the entire MSA.
“However, there is a need for methods that deconvolve signal from multiple states if they are not already both present at the level of the entire MSA.”
Claims other papers make about this one
Each is checked against this paper’s own text: does it say what the citing paper says it does?
In the citing paper
“Wayment-Steele et al found that clustering MSAs by sequence similarity enables AF2 to sample known alternative states of KaiB, RfaH, and Mad247”
From The power and pitfalls of AlphaFold2 for structure prediction beyond rigid globular proteins (2024) · cites this paper as [47]
In the citing paper
“Initial efforts to enhance sampling of different conformations have involved altering the number of sequences used to generate shallower MSA representations, masking coevolutionary information provided by MSAs, and splitting conflicting coevolutionary signals by clustering MSAs46,47,105.”
From The power and pitfalls of AlphaFold2 for structure prediction beyond rigid globular proteins (2024) · cites this paper as [47]
In the citing paper
“we curated a dataset of 74 complexes released after 2024 and with residues less than 800 for efficiency, ensuring no overlap with Boltz-2's training data [22].”
From Reshaping biomolecular structure prediction through strategic conformational exploration with HelixFold-S1 (2026) · cites this paper as [22]
Self-check
Percentages, sums and reported differences re-computed from the paper’s own numbers.
Each contradiction between two passages listed here was confirmed by an independent check.
Rated major: it would touch a result — a value a result rests on, reported and recomputed p-values on opposite sides of the significance level, two passages that conflict with no sign which is right, or a cited work retracted before this paper was published.
In the paper
§ Predicting multiple conformations via sequence clustering and AlphaFold2 > Mutations to flip the KaiB equilibrium
“Indeed, we found that three mutations—I68R, V83D and N84R—were sufficient to switch a prediction of KaiBRS from the ground state to a prediction of the FS state (Fig. 3b).”
§ Predicting multiple conformations via sequence clustering and AlphaFold2 > Methods > Protein expression and purification
“The triple mutant (I68R/V83D/N84A) of KaiBRS used in this study was generated according to the Q5 Site Directed Mutagenesis protocol using WT KaiBRS as a template.”
Rated minor: it would not touch a result — a value no result rests on, a p-value that stays on the same side of the significance level, or a conflict that is clerical, resolved elsewhere in the paper, or outside its own findings.
In the paper
§ Predicting multiple conformations via sequence clustering and AlphaFold2 > AF-Cluster predicts novel states
“As a starting point, we selected 628 proteins 48–150 amino acids in length from a database of MSAs associated with crystal structures30 (Methods).”
§ Predicting multiple conformations via sequence clustering and AlphaFold2 > Methods > Data selection for fold-switch screening
“we selected only proteins with a sequence length of between 52 and 150 residues and with more than 1,000 sequences in the alignment, totalling 628 proteins.”
Citations
Cites
Gapped BLAST and PSI-BLAST: a new generation of protein database search programs
Altschul, S. (1997) · Nucleic Acids Research · doi:10.1093/nar/25.17.3389 · Cited by 73,302
MAFFT Multiple Sequence Alignment Software Version 7: Improvements in Performance and Usability
Katoh, K., & Standley, D. M. (2013) · Molecular Biology and Evolution · doi:10.1093/molbev/mst010 · Cited by 46,209
Highly accurate protein structure prediction with AlphaFold
Jumper, J., Evans, R., Pritzel, A., Green, T., Figurnov, M., Ronneberger, O., Tunyasuvunakool, K., Bates, R., Žídek, A., Potapenko, A., et al. (2021) · Nature · doi:10.1038/s41586-021-03819-2 · Cited by 43,764
SciPy 1.0: fundamental algorithms for scientific computing in Python
Virtanen, P., Gommers, R., Oliphant, T. E., Haberland, M., Reddy, T., Cournapeau, D., Burovski, E., Peterson, P., Weckesser, W., Bright, J., et al. (2020) · Nature Methods · doi:10.1038/s41592-019-0686-2 · Cited by 38,430
RAxML version 8: a tool for phylogenetic analysis and post-analysis of large phylogenies
Stamatakis, A. (2014) · Bioinformatics · doi:10.1093/bioinformatics/btu033 · Cited by 32,291
Guindon, S., Dufayard, J.-F., Lefort, V., Anisimova, M., Hordijk, W., & Gascuel, O. (2010) · Systematic Biology · doi:10.1093/sysbio/syq010 · Cited by 18,376
IQ-TREE 2: New Models and Efficient Methods for Phylogenetic Inference in the Genomic Era
Minh, B. Q., Schmidt, H. A., Chernomor, O., Schrempf, D., Woodhams, M. D., von Haeseler, A., & Lanfear, R. (2020) · Molecular Biology and Evolution · doi:10.1093/molbev/msaa015 · Cited by 16,873
NMRPipe: A multidimensional spectral processing system based on UNIX pipes
Delaglio, F., Grzesiek, S., Vuister, G. W., Zhu, G., Pfeifer, J., & Bax, A. (1995) · Journal of Biomolecular NMR · doi:10.1007/bf00197809 · Cited by 15,961
Cd-hit: Accelerated for clustering the next-generation sequencing data
Fu, L., Niu, B., Zhu, Z., Wu, S., & Li, W. (2012) · Bioinformatics · doi:10.1093/bioinformatics/bts565 · Cited by 11,175
SciPy 1.0: fundamental algorithms for scientific computing in Python
Virtanen, P., Gommers, R., Oliphant, T. E., Haberland, M., Reddy, T., Cournapeau, D., Burovski, E., Peterson, P., Weckesser, W., Bright, J., et al. (2019) · Apollo - University of Cambridge Repository · doi:10.17863/cam.64134 · Cited by 10,460
Research works printed but not linked: 3
- Ester, M., Kriegel, H.-P., Sander, J. & Xu, X. A density-based algorithm for discovering clusters in large spatial databases with noise. In Proc. 2nd International Conference on Knowledge Discovery and Data Mining (KDD-96) 226–231 (ACM, 1996).
- DeLano, W. L. Pymol: an open-source molecular graphics tool. CCP4 Newsl. Protein Crystallogr. 40, 82–92 (2002).
- Pedregosa, F. et al. Scikit-learn: machine learning in Python. J. Mach. Learn. Res. 12, 2825–2830 (2011).
Cited by
Sorted by citations
Accurate structure prediction of biomolecular interactions with AlphaFold 3
Abramson, J., Adler, J., Dunger, J., Evans, R., Green, T., Pritzel, A., Ronneberger, O., Willmore, L., Ballard, A. J., Bambrick, J., et al. (2024) · Nature · doi:10.1038/s41586-024-07487-w · Cited by 15,861
“Many methods have been developed, particularly around MSA resampling, that assist in generating diversity from previous AlphaFold models 43–45 and may also assist in multistate prediction with AF3.”
MethodDe novo protein design—From new structures to programmable functions
Kortemme, T. (2024) · Cell · doi:10.1016/j.cell.2023.12.028 · Cited by 383
Scalable emulation of protein equilibrium ensembles with generative deep learning
Lewis, S., Hempel, T., Jiménez-Luna, J., Gastegger, M., Xie, Y., Foong, A. Y. K., Satorras, V. G., Abdin, O., Veeling, B. S., Zaporozhets, I., et al. (2025) · Science · doi:10.1126/science.adv9817 · Cited by 390
Ahdritz, G., Bouatta, N., Floristean, C., Kadyan, S., Xia, Q., Gerecke, W., O’Donnell, T. J., Berenberg, D., Fisk, I., Zanichelli, N., et al. (2024) · Nature Methods · doi:10.1038/s41592-024-02272-z · Cited by 439
High-throughput prediction of protein conformational distributions with subsampled AlphaFold2
Monteiro da Silva, G., Cui, J. Y., Dalgarno, D. C., Lisi, G. P., & Rubenstein, B. M. (2024) · Nature Communications · doi:10.1038/s41467-024-46715-9 · Cited by 196
“Optimizing MSA subsampling to predict kinase core conformational ensembles In recent years, multiple groups have observed that AF2 with different parameters and MSA depths is capable of predicting conformational changes based on sequence data alone 27,28 .”
Influential
Metadata
- Authors
- Wayment-Steele, H. K., Ojoawo, A., Otten, R., Apitz, J. M., Pitsawong, W., Hömberger, M., Ovchinnikov, S., Colwell, L., & Kern, D.
- Affiliations
- Howard Hughes Medical Institute (US)
- Harvard University (US)
- Google (United States) (US)
- Corresponding author
- Kern, Dorothee
- ORCID
- Venue
- Nature
- Published
- 2023-11-13
- Volume
- 625
- Issue
- 7996
- Pages
- 832-839
- ISSN
- 0028-0836 (ISSN-L)
- 1476-4687
- PMC
- PMC10808063
- OpenAlex
- W4388627063
- Semantic Scholar
- 6d464c44cad5eb182ae580adfff8624562e457b8
- Cited by
- 545
- References
- 90
- Citations by year
- 2026: 175 · 2025: 202 · 2024: 160 · 2023: 8
- FWCI
- 48.74
- Type
- journal article
- Language
- en
- Open access
- hybrid
- doi.org
- Locations
- Nature (publishedVersion, cc-by)
- PubMed Central (publishedVersion, cc-by)
- PubMed (publishedVersion)
- RePEc: Research Papers in Economics (submittedVersion)
- Apollo (University of Cambridge) (submittedVersion, cc-by)
- Funders
- National Institute of General Medical Sciences (P41GM111135, T32GM135126, R24GM141526)
- Topics
- Life Sciences › Biochemistry, Genetics and Molecular Biology › Molecular Biology › Protein Structure and Dynamics
- Life Sciences › Biochemistry, Genetics and Molecular Biology › Structural Biology › Enzyme Structure and Function
- Life Sciences › Biochemistry, Genetics and Molecular Biology › Molecular Biology › Receptor Mechanisms and Signaling
- Keywords
- protein conformational switching, sequence clustering, AlphaFold2, KaiB, fold switching, point mutations, protein energy landscape, oxidative enzymes, protein family evolution
- MeSH terms
- Machine Learning, Antigens, Bacterial, Bacterial Proteins, Mutation, Protein Conformation, Proteins, Rhodobacter sphaeroides, Cluster Analysis, Sequence Alignment, Protein Folding
About these checks
Registry, retraction, Cites and statistics results are computed, not judged, with one exception: a printed reference that no index lists is read once by a model before it counts as a citation error. Claims are extracted by a model and kept only when their quote appears verbatim in the text; each cited source is then checked, with a model’s help, for whether it says what the claim relies on. Those verdicts can be wrong — read the claim’s quote and the cited source before relying on one.
A language model drew the claims from the paper on 2026-10-07, under version 3 of the claim definition (model deepseek-v4.1-flash, prompt extract-v3).
A second model labelled each claim on 2026-10-07 (model jev-1.13-20260917, definition revision gold-guideline-v0.2).
Statistics and arithmetic are recomputed, not judged.
Confidence bands are shown only for fields calibrated on our annotated test set. None is calibrated yet, so no band is shown.
What counts as a claim ›How we measure confidence ›How we check this ›
Are you an author, or do you see a problem with this page? Request a review
