

The DOI matches its Crossref record; 63 of the 63 references it cites were found in a registry or an index; 32 of the 44 sources its claims cite were checked for support.
APOE4/4 is linked to damaging lipid droplets in Alzheimer’s disease microglia
Open accessAbstract
Several genetic risk factors for Alzheimer’s disease implicate genes involved in lipid metabolism and many of these lipid genes are highly expressed in glial cells 1 . However, the relationship between lipid metabolism in glia and Alzheimer’s disease pathology remains poorly understood. Through single-nucleus RNA sequencing of brain tissue in Alzheimer’s disease, we have identified a microglial state defined by the expression of the lipid droplet-associated enzyme ACSL1 with ACSL1-positive microglia being most abundant in patients with Alzheimer’s disease having the APOE4/4 genotype. In human induced pluripotent stem cell-derived microglia, fibrillar Aβ induces ACSL1 expression, triglyceride synthesis and lipid droplet accumulation in an APOE-dependent manner. Additionally, conditioned media from lipid droplet-containing microglia lead to Tau phosphorylation and neurotoxicity in an APOE-dependent manner. Our findings suggest a link between genetic risk factors for Alzheimer’s disease with microglial lipid droplet accumulation and neurotoxic microglia-derived factors, potentially providing therapeutic strategies for Alzheimer’s disease.
Overview
AI snapshot
Written from the paper’s full text.
TL;DR
Single-nucleus RNA sequencing of human Alzheimer’s disease brain identifies an ACSL1+ lipid-droplet-accumulating microglial state (LDAM) that is most abundant in APOE4/4 AD. In iPS-derived microglia, fibrillar Aβ induces ACSL1, triglyceride synthesis, and lipid droplets in an APOE-dependent manner, and conditioned media from lipid-droplet-high microglia induce Tau phosphorylation and neurotoxicity.
Key findings
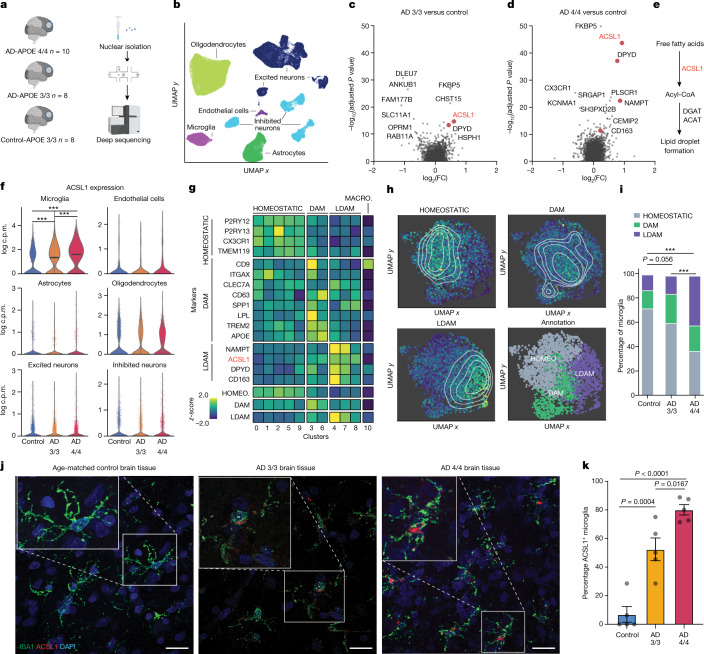
- snRNA-seq of frontal cortex yielded ~100,000 single-nucleus transcriptomes (n = 100,317 cells); ACSL1 was the most significantly differentially expressed gene in AD-APOE4/4 versus control microglia. ACSL1+ LDAM were a distinct state from homeostatic and DAM microglia, with the greatest percentage in AD-APOE4/4, followed by AD-APOE3/3, and least in age-matched controls (chi-square P < 0.0001); immunofluorescence confirmed ACSL1 abundance differences (n = 5 per group).
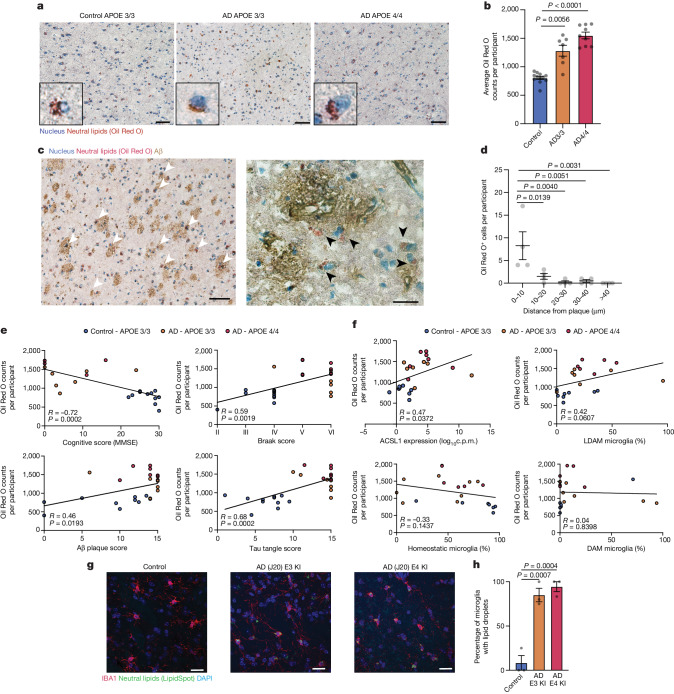
- Oil Red O+ neutral lipid bodies were abundant in AD-APOE4/4 brain tissue, often near or at Aβ plaques, with a slight but not significant increase in AD-APOE4/4 versus AD-APOE3/3 (control n = 12; AD33 n = 7; AD44 n = 9). Lipid body counts negatively correlated with MMSE and positively correlated with Aβ plaque amounts and Tau pathology; microglial ACSL1 expression positively correlated with lipid body numbers. J20/APOE3 and J20/APOE4 mice had more LD+ microglia than age-matched wild-type mice (n = 3 mice per group).
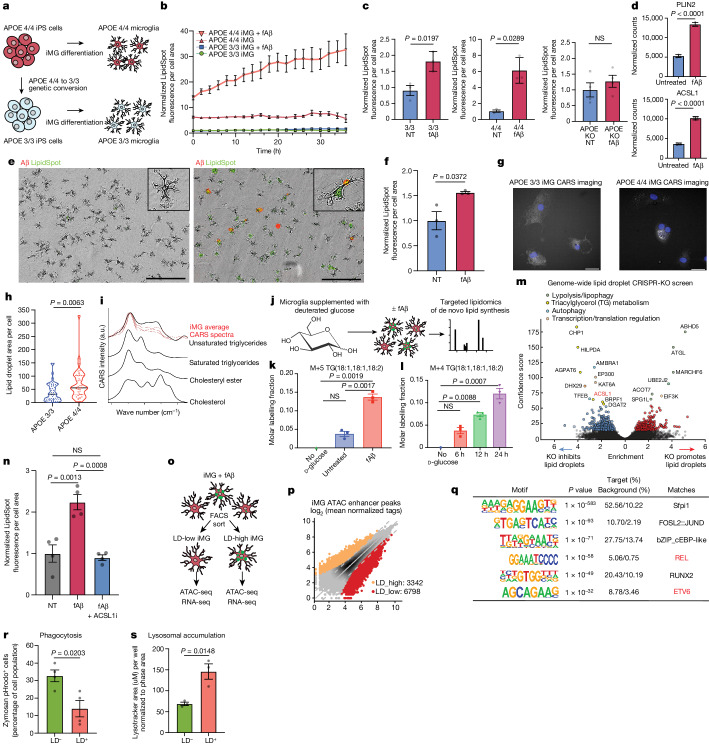
- In isogenic APOE4/4 versus APOE3/3 iMG, fibrillar Aβ strongly increased lipid droplet accumulation, exacerbated by APOE4 and absent in APOE-KO; fAβ upregulated PLIN2 and ACSL1. CARS spectra overlapped unsaturated/triglyceride spectra, and d-glucose 13C incorporation into triglycerides increased time-dependently after fAβ. CRISPR screens identified triglyceride metabolism regulators and ACSL1 as required for LD formation; the top druggable-genome hit in APOE4/4 iMG was PIK3CA, and ACSL1 inhibitor Triacin C or PI3K inhibitor GNE-317 reduced lipid droplets.
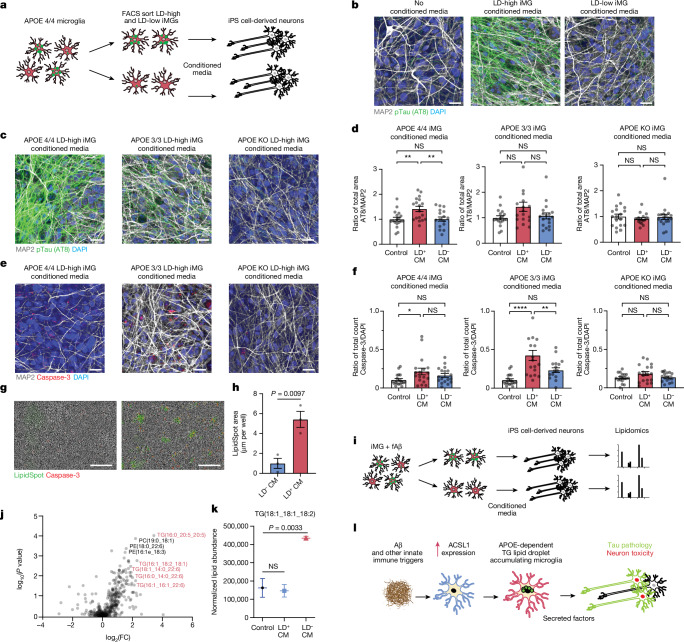
- Conditioned media from LD-high APOE4/4 iMG induced high pTau (AT8) and caspase activation in human iPS cell-derived neurons; effects were similar with APOE3/3 and APOE4/4 iMG-conditioned media but absent with APOE-KO iMG-conditioned media. Neurons exposed to LD-high conditioned media showed increased LipidSpot staining and higher concentrations of triglyceride lipid species.
Methods
- Human postmortem frontal cortex from AD-APOE4/4, AD-APOE3/3, and age/sex-matched control APOE3/3 individuals was processed for snRNA-seq (~100,000 nuclei), with CellRanger alignment, Scanpy/BBKNN integration, Leiden clustering, pseudobulk DESeq2, and MAST single-cell differential expression; microglia were subclustered and annotated using HOMEOSTATIC, DAM, and LDAM marker signatures.
- Histology and imaging included Oil Red O, immunofluorescence for IBA1/ACSL1/Aβ in human tissue, and IBA1/LipidSpot imaging in J20/APOE3-KI and J20/APOE4-KI mice. Cell models included isogenic APOE3/3, APOE4/4, and APOE-KO iPS cell-derived microglia, iPS cell-derived human neurons, primary rat microglia, BV2 cells, and human macrophages; assays included fAβ treatment, live-cell microscopy, CARS, electron microscopy, lipidomics, cytokine/chemokine assays, ATAC-seq, and RNA-seq.
- CRISPR–Cas9 screens were performed genome-wide in U937 cells and with a druggable-genome library in APOE4/4 iMG, using FACS for LD-high versus LD-low populations and casTLE analysis. Conditioned media from FACS-sorted LD-high and LD-low iMG were applied to iPS cell-derived neurons, followed by AT8 and cleaved caspase-3 quantification.
Limitations
- The paper states that identifying the cell type(s) accumulating lipids requires simultaneous staining for lipids and several protein markers, which is challenging in aged human histological brain sections; that GNE-317 experiments do not conclusively show increased autophagic flux; and that 13C-labelled TAG lipids in mouse neurons treated with conditioned media were not robustly detected across several replicates, perhaps due to low isotopic enrichment.
- Evident from the text: human postmortem associations are cross-sectional and correlational, and several experiments rely on small samples (for example, n = 3 mice per group and n = 3 replicate wells in multiple assays). The mechanistic work largely uses in vitro iPS cell-derived microglia/neurons and mouse models, which may not fully capture human AD.
Model-written summary. Check it against the paper before relying on it.
Integrity signals
Registry
Cites
Statistics
Figures
Verification
Claims the paper makes
45 Own result · 15 Supported · 14 Own method · 7 No full text of the sources · 6 Partly supported · 6 Own interpretation · 2 Couldn’t confirm · 2 No basis given · 1 Supported so far · 1 Sources not found · accuracy not yet measured
The cited sources that could be checked couldn’t confirm or dispute this claim.
In the paper
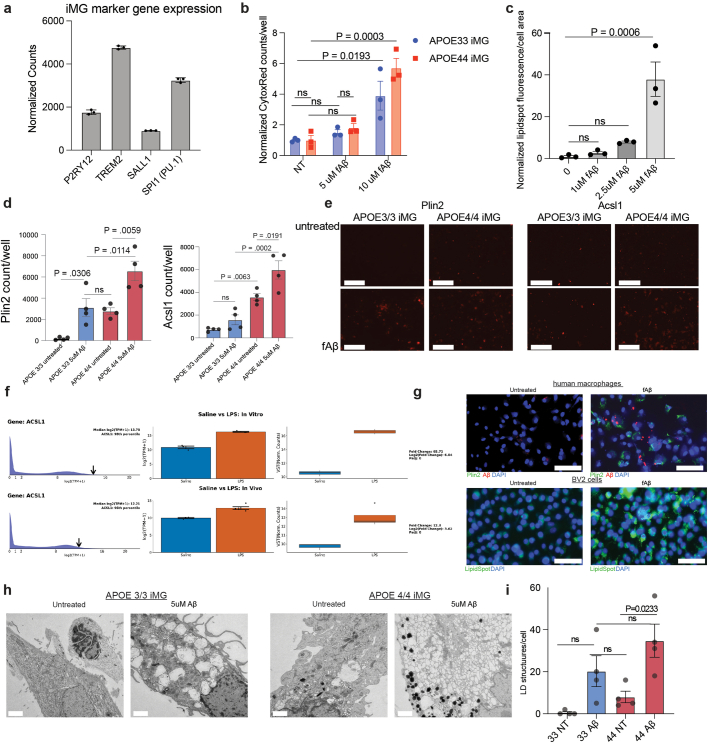
“In accordance with this accumulation of LDs, the gene expressions of LD-associated genes PLIN2 (ref. 21) and ACSL1 (refs. 13,14) are upregulated on fAβ challenge in iMGs”
§ APOE4/4 is linked to damaging lipid droplets in Alzheimer’s disease microglia > ACSL1 and triglycerides increase after fAβ challenge
What the sources say
- Could not verifycites [21] Olzmann, J. A. & Carvalho, P. Dynamics and functions of lipid droplets. Nat. Rev. Mol. Cell Biol. 20, 137–155 (2019). sourceExperimental — accuracy not yet measured
The citation is attached to ACSL1’s identification as a lipid-droplet-associated gene. The lipid droplet–lysosome contacts section discusses PLIN2, but the passages found for ACSL1 do not establish that association. The source also does not report gene-expression changes after fibrillar Aβ challenge in iMGs. (LLM, conf=0.72)
- Not checked — no full text of the sourcecites [13] Li, L. O. et al. Overexpression of rat long chain acyl-coa synthetase 1 alters fatty acid metabolism in rat primary hepatocytes. J. Biol. Chem. 281, 37246–37255 (2006). source
- Not checked — no full text of the sourcecites [14] Zhao, Z. et al. Effects of overexpression of ACSL1 gene on the synthesis of unsaturated fatty acids in adipocytes of bovine. Arch. Biochem. Biophys. 695, 108648 (2020). source
plaindirect- Asserted: passes — The authors put it forward as true.
- Checkable: passes — It can be checked against evidence.
- Load-bearing: passes — The paper’s conclusions depend on it.
- Based: passes — The paper gives a reason why it holds.
- Could not verify
Every source the paper cites for this claim was checked and supports it.
In the paper
“LDAM were also observed in chimaeric human–mouse AD models6.”
§ APOE4/4 is linked to damaging lipid droplets in Alzheimer’s disease microglia > Main
What the sources say
- Supportedcites [6] Claes, C. et al. Plaque-associated human microglia accumulate lipid droplets in a chimeric model of Alzheimer’s disease. Mol. Neurodegener. 16, 50 (2021). source
The Findings section reports lipid droplets in human microglia adjacent to plaques in chimeric mice (Fig. 2). It also identifies the mice as a chimeric model of Alzheimer’s disease. Page numbers are not provided in our copy. (LLM, conf=0.93)
plain- Asserted: passes — The authors put it forward as true.
- Checkable: passes — It can be checked against evidence.
- Load-bearing: unclear — It is unclear whether the paper’s conclusions depend on it.
- Based: passes — The paper gives a reason why it holds.
- Supported
Every source the paper cites for this claim was checked and supports it.
In the paper
“Live cell microscopy of iMG with a fluorescent dye for neutral lipids (LipidSpot) showed greater LD accumulation in APOE4/4 iMG compared with isogenic APOE3/3 iMG, similar to recent reports in isogenic iMG4 and astrocytes20.”
§ APOE4/4 is linked to damaging lipid droplets in Alzheimer’s disease microglia > ACSL1 and triglycerides increase after fAβ challenge
What the sources say
- Supportedcites [4] Victor, M. B. et al. Lipid accumulation induced by APOE4 impairs microglial surveillance of neuronal-network activity. Cell Stem Cell 29, 1197–1212 (2022). source
The Results section, “Microglial energetics and lipid processing are altered in APOE4 iMGLs,” reports significantly greater lipid-droplet content in APOE4 than APOE3 iMGLs. The Methods section identifies the cell lines as isogenic. LipidSpot and live-cell microscopy describe the citing authors’ experiment, not the finding attributed to this source. (LLM, conf=0.92)
- Supportedcites [20] Sienski, G. et al. APOE4 disrupts intracellular lipid homeostasis in human iPSC-derived glia. Sci. Transl. Med. 13, eaaz4564 (2021). source
The citation is attached to the comparison with prior reports, not to the citing authors’ live-cell microscopy method. In the Results section, the source reports greater lipid-droplet accumulation in isogenic APOE4 astrocytes than APOE3 astrocytes; it also reports more lipid-droplet-positive APOE4 microglia per well. (LLM, conf=0.90)
plaincorrelational- Asserted: passes — The authors put it forward as true.
- Checkable: passes — It can be checked against evidence.
- Load-bearing: passes — The paper’s conclusions depend on it.
- Based: passes — The paper gives a reason why it holds.
- Supported
Every source the paper cites for this claim was checked and supports it.
In the paper
“human induced pluripotent stem (iPS) cell-derived microglia (iMG) with APOE risk variants have more lipid droplets (LDs)4.”
§ APOE4/4 is linked to damaging lipid droplets in Alzheimer’s disease microglia > Main
What the sources say
- Supportedcites [4] Victor, M. B. et al. Lipid accumulation induced by APOE4 impairs microglial surveillance of neuronal-network activity. Cell Stem Cell 29, 1197–1212 (2022). source
The Results section, “Microglial energetics and lipid processing are altered in APOE4 iMGLs” (page unavailable), reports significantly greater lipid-droplet content in APOE4 iPSC-derived microglia-like cells than in APOE3 controls. This directly supports the cited claim. (LLM, conf=0.94)
plaincorrelational- Asserted: passes — The authors put it forward as true.
- Checkable: passes — It can be checked against evidence.
- Load-bearing: passes — The paper’s conclusions depend on it.
- Based: passes — The paper gives a reason why it holds.
- Supported
The cited sources that could be checked couldn’t confirm or dispute this claim.
In the paper
“Mirroring these observations in the human AD tissue, there are more LD+ microglia in the J20/APOE3 and J20/APOE4 models of AD15 compared to age-matched wild-type mice”
§ APOE4/4 is linked to damaging lipid droplets in Alzheimer’s disease microglia > Lipid accumulation is linked to AD pathology
What the sources say
- Could not verifycites [15] Taubes, A. et al. Experimental and real-world evidence supporting the computational repurposing of bumetanide for APOE4-related Alzheimer’s disease. Nat. Aging 1, 932–947 (2021). sourceExperimental — accuracy not yet measured
The Methods (Mice; page unavailable) identify J20/E3-KI, J20/E4-KI, and wild-type mice. The Results on J20/E4-KI neurons and glia discuss microglial gene expression, but neither passage reports counts of lipid-droplet-positive microglia compared with age-matched wild-type mice. Searches for “lipid droplets,” “LD+ microglia,” and the model comparison found no passage addressing that outcome. (LLM, conf=0.76)
plaincorrelational- Asserted: passes — The authors put it forward as true.
- Checkable: passes — It can be checked against evidence.
- Load-bearing: passes — The paper’s conclusions depend on it.
- Based: passes — The paper gives a reason why it holds.
- Could not verify
Every source the paper cites for this claim was checked and supports it.
In the paper
“A recent meta-analysis of all genetic risk factors for AD identified through genome-wide association studies discovered genes involved in lipid processing and innate immunity as a statistically enriched category of genetic risk factors for AD, alongside the more characteristic categories of genes in amyloid and Tau processing1.”
§ APOE4/4 is linked to damaging lipid droplets in Alzheimer’s disease microglia > Main
What the sources say
- Supportedcites [1] Kunkle, B. W. et al. Genetic meta-analysis of diagnosed Alzheimer’s disease identifies new risk loci and implicates Aβ, tau, immunity and lipid processing. Nat. Genet. 51, 414–430 (2019). source
The Results section (Candidate gene prioritization at genome-wide loci; page not provided) reports statistically significant enrichment of four clusters in the common-variant analysis: APP/Aβ formation, tau protein binding, lipid metabolism, and immune response. It also identifies microglia and macrophages in its discussion of AD-related immune processes, consistent with the claim’s reference to innate immunity. (LLM, conf=0.91)
plaincorrelational- Asserted: passes — The authors put it forward as true.
- Checkable: passes — It can be checked against evidence.
- Load-bearing: passes — The paper’s conclusions depend on it.
- Based: passes — The paper gives a reason why it holds.
- Supported
Every source the paper cites for this claim was checked and supports it.
In the paper
“Activation of innate immune receptors such as TLR4 in microglia suppresses autophagy39”
§ APOE4/4 is linked to damaging lipid droplets in Alzheimer’s disease microglia > Discussion
What the sources say
- Supportedcites [39] Lee, J.-W. et al. TLR4 (toll-like receptor 4) activation suppresses autophagy through inhibition of FOXO3 and impairs phagocytic capacity of microglia. Autophagy 15, 753–770 (2019). source
The Discussion states that TLR activation significantly suppresses autophagic flux in microglia and identifies TLR4 signaling in this effect. The Introduction likewise reports that LPS repressed autophagy in microglia. (LLM, conf=0.94)
plaindirect- Asserted: passes — The authors put it forward as true.
- Checkable: passes — It can be checked against evidence.
- Load-bearing: unclear — It is unclear whether the paper’s conclusions depend on it.
- Based: passes — The paper gives a reason why it holds.
- Supported
The cited sources support only part of this claim — read each source’s verdict below.
In the paper
“this mechanism has been shown to increase LD concentrations in microglia40.”
§ APOE4/4 is linked to damaging lipid droplets in Alzheimer’s disease microglia > Discussion
What the sources say
- Partly supportedcites [40] Xu, Y., Propson, N. E., Du, S., Xiong, W. & Zheng, H. Autophagy deficiency modulates microglial lipid homeostasis and aggravates tau pathology and spreading. Proc. Natl Acad. Sci. USA 118, e2023418118 (2021). sourceExperimental — accuracy not yet measured
The Abstract and Discussion report that blocking microglial autophagy by genetically deleting Atg7 leads to lipid-droplet accumulation. They do not establish that TLR4 mediates the suppression of autophagy, so the claimed TLR4 mechanism is unsupported. (LLM, conf=0.87)
boosteddirect- Asserted: passes — The authors put it forward as true.
- Checkable: passes — It can be checked against evidence.
- Load-bearing: unclear — It is unclear whether the paper’s conclusions depend on it.
- Based: passes — The paper gives a reason why it holds.
- Partly supported
A result the paper reports from its own data — it cites no other source for it, so there is none to check. The quote shows it is in the paper.
In the paper
“and to a greater extent in the APOE4/4 background”
§ APOE4/4 is linked to damaging lipid droplets in Alzheimer’s disease microglia > ACSL1 and triglycerides increase after fAβ challenge
plaincorrelational- Asserted: passes — The authors put it forward as true.
- Checkable: passes — It can be checked against evidence.
- Load-bearing: passes — The paper’s conclusions depend on it.
- Based: passes — The paper gives a reason why it holds.
A result the paper reports from its own data — it cites no other source for it, so there is none to check. The quote shows it is in the paper.
In the paper
“Immunofluorescence microscopy of human AD brain tissue confirmed the ACSL1 abundance differences observed by snRNA-seq”
§ APOE4/4 is linked to damaging lipid droplets in Alzheimer’s disease microglia > Lipid-associated ACSL1+ microglia in AD
plaincorrelational- Asserted: passes — The authors put it forward as true.
- Checkable: passes — It can be checked against evidence.
- Load-bearing: passes — The paper’s conclusions depend on it.
- Based: passes — The paper gives a reason why it holds.
- It may state two separate claims as one. 27
- Probably not a substantial claim. 40
The cited sources support only part of this claim — read each source’s verdict below.
In the paper
“This epigenetic signature is also seen in macrophages in atherosclerosis models23 and adipose-associated macrophages24 but this signature is not seen in DAM microglia25.”
§ APOE4/4 is linked to damaging lipid droplets in Alzheimer’s disease microglia > ACSL1 and triglycerides increase after fAβ challenge
What the sources say
- Could not verifycites [23] Xiong, X., Yan, Z., Jiang, W. & Jiang, X. ETS variant transcription factor 6 enhances oxidized low-density lipoprotein-induced inflammatory response in atherosclerotic macrophages via activating NF-κB signaling. Int. J. Immunopathol. Pharmacol. https://doi.org/10.1177/20587384221076472 (2022). sourceExperimental — accuracy not yet measured
The Results section ('Elevation of ETV6 in aorta macrophages in ApoE−/− mice'; page unavailable) reports increased ETV6 expression in macrophages from an atherosclerosis model. The cited portion of the sentence concerns an epigenetic signature, but neither that section nor the passages retrieved by searching for epigenetic and chromatin terms identifies or measures one. The adipose-macrophage and DAM-microglia portions have separate citations and are not assessed here. (LLM, conf=0.72)
- Supportedcites [24] Hill, D. A. et al. Distinct macrophage populations direct inflammatory versus physiological changes in adipose tissue. Proc. Natl Acad. Sci. USA 115, E5096–E5105 (2018). source
The citation is attached to the adipose-associated macrophage portion of the sentence. The Results section reports ATAC-seq evidence of distinct chromatin-accessibility patterns in adipose tissue macrophage populations, supporting the attribution that these cells have an epigenetic signature. This source is not cited for the atherosclerosis or DAM microglia comparisons. (LLM, conf=0.84)
- Could not verifycites [25] Morabito, S. et al. Single-nucleus chromatin accessibility and transcriptomic characterization of Alzheimer’s disease. Nat. Genet. 53, 1143–1155 (2021). sourceExperimental — accuracy not yet measured
The Results section on the microglia trajectory reports depletion of a stage 2 DAM gene signature, but does not identify the epigenetic signature meant by the citing sentence or say that it is absent in DAM microglia. Searches for that epigenetic signature and for a comparison with macrophages did not find a passage establishing the cited claim; page numbers were unavailable in our copy. (LLM, conf=0.72)
plain- Asserted: passes — The authors put it forward as true.
- Checkable: passes — It can be checked against evidence.
- Load-bearing: unclear — It is unclear whether the paper’s conclusions depend on it.
- Based: passes — The paper gives a reason why it holds.
It may state two separate claims as one.
- Could not verify
The cited sources support only part of this claim — read each source’s verdict below.
In the paper
“A previously published dataset shows that ACSL1 is highly upregulated by the innate immune trigger lipopolysaccharides (LPS) in an independent human iMG chimaeric mouse model22”
§ APOE4/4 is linked to damaging lipid droplets in Alzheimer’s disease microglia > ACSL1 and triglycerides increase after fAβ challenge
What the sources say
- Partly supportedcites [22] Hasselmann, J. et al. Development of a chimeric model to study and manipulate human microglia in vivo. Neuron 103, 1016–1033 (2019). sourceExperimental — accuracy not yet measured
The Results section, “xMGs respond robustly to a systemic inflammatory challenge” (page not available), reports a dataset comparing human microglia from saline- and LPS-treated chimeric mice and identifies 607 upregulated genes. Our copy does not identify ACSL1 among them or establish that it was highly upregulated; searches for ACSL1 and its full gene name found no supporting passage. (LLM, conf=0.85)
plaindirect- Asserted: passes — The authors put it forward as true.
- Checkable: passes — It can be checked against evidence.
- Load-bearing: fails — The paper’s conclusions may not depend on it.
- Based: passes — The paper gives a reason why it holds.
Probably not a substantial claim. The paper’s conclusions may not depend on it.
- Partly supported
Every source the paper cites for this claim was checked and supports it.
In the paper
“APOE is one such lipid-related AD risk gene, which is highly upregulated in human microglia in AD3”
§ APOE4/4 is linked to damaging lipid droplets in Alzheimer’s disease microglia > Main
What the sources say
- Supportedcites [3] Mathys, H. et al. Single-cell transcriptomic analysis of Alzheimer’s disease. Nature 570, 332–337 (2019). source
The section on systematic differential expression reports that APOE was strongly upregulated in human microglia in AD pathology. The section on cell-type-specific associations also identifies APOE as an AD risk factor whose microglial expression correlates positively with pathology. (LLM, conf=0.92)
plaincorrelational- Asserted: passes — The authors put it forward as true.
- Checkable: passes — It can be checked against evidence.
- Load-bearing: passes — The paper’s conclusions depend on it.
- Based: passes — The paper gives a reason why it holds.
It may state two separate claims as one.
- Supported
The cited sources support only part of this claim — read each source’s verdict below.
In the paper
“LDs form in myeloid cells through the upregulation of lipid-synthesis enzymes triggered by the engagement of toll receptors by innate immune triggers, such as bacteria7.”
§ APOE4/4 is linked to damaging lipid droplets in Alzheimer’s disease microglia > Main
What the sources say
- Partly supportedcites [7] Huang, Y. et al. Toll-like receptor agonists promote prolonged triglyceride storage in macrophages. J. Biol. Chem. 289, 3001–3012 (2014). sourceExperimental — accuracy not yet measured
The Discussion reports that TLR agonists increased triglyceride synthesis and the abundance of ACSL1 and DGAT2 in macrophages, supporting the proposed link to lipid droplets. But it describes enzyme upregulation as one part of a multifaceted storage response, alongside increased fatty-acid uptake and decreased lipolysis; it does not establish this as the mechanism across myeloid cells generally. Page numbers are unavailable in our copy. (LLM, conf=0.84)
plaindirect- Asserted: passes — The authors put it forward as true.
- Checkable: passes — It can be checked against evidence.
- Load-bearing: fails — The paper’s conclusions may not depend on it.
- Based: passes — The paper gives a reason why it holds.
Probably not a substantial claim. The paper’s conclusions may not depend on it.
- Partly supported
Every source the paper cites for this claim was checked and supports it.
In the paper
“Aged mouse microglia accumulate LDs and exhibit a dysfunctional microglial state termed LD-accumulating microglia (LDAM)5”
§ APOE4/4 is linked to damaging lipid droplets in Alzheimer’s disease microglia > Main
What the sources say
- Supportedcites [5] Marschallinger, J. et al. Lipid-droplet-accumulating microglia represent a dysfunctional and proinflammatory state in the aging brain. Nat. Neurosci. 23, 194–208 (2020). source
The Results section describes lipid-droplet-containing aged microglia and names this distinct state “lipid droplet accumulating microglia” (LDAM). The Discussion identifies LDAM in the aging brain and reports severe functional deficits; the Results passages specifically describe deficits in microglia from aged mice. The cited paper therefore supports the sentence. (LLM, conf=0.94)
plaincorrelational- Asserted: passes — The authors put it forward as true.
- Checkable: passes — It can be checked against evidence.
- Load-bearing: passes — The paper’s conclusions depend on it.
- Based: passes — The paper gives a reason why it holds.
It may state two separate claims as one.
- Supported
The cited sources support only part of this claim — read each source’s verdict below.
In the paper
“Cholesterol-rich lysosomes and LDs in dysfunctional microglia have also been observed in the context of demyelination mouse models and human iPS cell models9–12.”
§ APOE4/4 is linked to damaging lipid droplets in Alzheimer’s disease microglia > Main
What the sources say
- Partly supportedcites [9] Safaiyan, S. et al. Age-related myelin degradation burdens the clearance function of microglia during aging. Nat. Neurosci. 19, 995–998 (2016). sourceExperimental — accuracy not yet measured
The passage on Pelizaeus–Merzbacher disease mice (page unavailable in our copy) reports demyelination, increased lipofuscin in microglia, and reduced microglial uptake function. The paper also describes lipofuscin as accumulating in lysosomes. It does not identify those lysosomes as cholesterol-rich or report lipid droplets or human iPS-cell models. (LLM, conf=0.88)
- Partly supportedcites [10] Cantuti-Castelvetri, L. et al. Defective cholesterol clearance limits remyelination in the aged central nervous system. Science 359, 684–688 (2018). sourceExperimental — accuracy not yet measured
The main text (p. 1) reports myelin debris in phagocyte lysosomes and lipid-droplet-bearing foam cells in demyelinated old mice; the supplementary Fig. 3 caption (p. 6) identifies microglial cultures treated with myelin debris. Our copy does not report these observations in human iPS cell models, so it supports the mouse-model portion but not that extension. (LLM, conf=0.86)
- Partly supportedcites [11] Nugent, A. A. et al. TREM2 regulates microglial cholesterol metabolism upon chronic phagocytic challenge. Neuron 105, 837–854 (2020). sourceExperimental — accuracy not yet measured
The Results (page unavailable) report cholesteryl-ester accumulation in Trem2-deficient microglia after chronic demyelination and increased cholesteryl esters and cholesterol in myelin-treated human iPSC-derived microglia. The paper suggests lipid-droplet storage from experiments in murine macrophages, but it does not report observing cholesterol-rich lysosomes in either microglial model; its evidence for lysosomal dysfunction is indirect. (LLM, conf=0.85)
- Partly supportedcites [12] Tcw, J. et al. Cholesterol and matrisome pathways dysregulated in astrocytes and microglia. Cell 185, 2213–2233 (2022). sourceExperimental — accuracy not yet measured
The Results (‘Altered lipid metabolism in human APOE4 microglia and astrocytes’; page unavailable) report impaired cholesterol metabolism in human iPSC-derived microglia and predict lysosomal cholesterol accumulation. They do not establish cholesterol-rich lysosomes or lipid droplets in those microglia, or report those observations in demyelination mouse models. The measured increase in lysosomal cholesterol described in ‘Impaired cholesterol trafficking’ was in astrocytes. (LLM, conf=0.84)
plaincorrelational- Asserted: passes — The authors put it forward as true.
- Checkable: passes — It can be checked against evidence.
- Load-bearing: fails — The paper’s conclusions may not depend on it.
- Based: passes — The paper gives a reason why it holds.
Probably not a substantial claim. The paper’s conclusions may not depend on it.
- Partly supported
The sources with a verdict support this claim; the rest weren’t checked yet, have no full text we could read, or their verdicts aren’t rated yet.
In the paper
“a mechanism which is known to regulate LD concentrations27–29”
§ APOE4/4 is linked to damaging lipid droplets in Alzheimer’s disease microglia > ACSL1 and triglycerides increase after fAβ challenge
What the sources say
- Supportedcites [27] Singh, R. et al. Autophagy regulates lipid metabolism. Nature 458, 1131–1135 (2009). source
The Discussion states that autophagy regulates lipid content and that inhibiting it increased lipid droplets in vitro and in vivo. The section “Autophagic pathway components associate with LDs” also reports that activating autophagy significantly decreased lipid-droplet number. (LLM, conf=0.94)
- Supportedcites [28] Qiao, L. et al. Deficient chaperone-mediated autophagy promotes lipid accumulation in macrophage. J. Cardiovasc. Transl. Res. 14, 661–669 (2021). source
The Introduction states that autophagy regulates intracellular lipid stores and describes lipophagy as lipid-droplet breakdown through the autophagy–lysosome pathway. The Results section, “Progressive Atherosclerosis Has Features of Dysfunctional Lipophagy,” likewise describes lipolysis of lipid droplets through that pathway. Page numbers are not provided in our copy. (LLM, conf=0.92)
- Not checked — no full text of the sourcecites [29] Zhou, H. et al. In vivo simultaneous transcriptional activation of multiple genes in the brain using CRISPR-dCas9-activator transgenic mice. Nat. Neurosci. 21, 440–446 (2018). source
boosteddirect- Asserted: passes — The authors put it forward as true.
- Checkable: passes — It can be checked against evidence.
- Load-bearing: passes — The paper’s conclusions depend on it.
- Based: passes — The paper gives a reason why it holds.
Probably not a substantial claim.
- Supported
Every source the paper cites for this claim was checked and supports it.
In the paper
“cell culture models have demonstrated that hyperactive neurons can release APOE-associated fatty acids which are taken up by astrocytes and buffer lipotoxic stress35.”
§ APOE4/4 is linked to damaging lipid droplets in Alzheimer’s disease microglia > Discussion
What the sources say
- Supportedcites [35] Ioannou, M. S. et al. Neuron–astrocyte metabolic coupling protects against activity-induced fatty acid toxicity. Cell 177, 1522–1535 (2019). source
The Discussion (p. 11) says hyperactive neurons release toxic fatty acids in lipoprotein particles that astrocytes take up and detoxify, protecting neurons from fatty-acid toxicity. The Discussion (p. 13) says the neuron–astrocyte transfer assays included ApoE-positive particles. (LLM, conf=0.92)
boosteddirect- Asserted: passes — The authors put it forward as true.
- Checkable: passes — It can be checked against evidence.
- Load-bearing: fails — The paper’s conclusions may not depend on it.
- Based: passes — The paper gives a reason why it holds.
Probably not a substantial claim. The paper’s conclusions may not depend on it.
- Supported
Every source the paper cites for this claim was checked and supports it.
In the paper
“These results are similar to recent reports describing mouse LDAM that have a dysfunctional and inflammatory microglial state5.”
§ APOE4/4 is linked to damaging lipid droplets in Alzheimer’s disease microglia > ACSL1 and triglycerides increase after fAβ challenge
What the sources say
- Supportedcites [5] Marschallinger, J. et al. Lipid-droplet-accumulating microglia represent a dysfunctional and proinflammatory state in the aging brain. Nat. Neurosci. 23, 194–208 (2020). source
The Discussion describes LDAM in the aging brain as having severe functional deficits and a pro-inflammatory phenotype. The Results also report increased cytokine release by lipid-droplet-high microglia isolated from aged mice, supporting the claim about mouse LDAM. (LLM, conf=0.95)
plaincorrelational- Asserted: passes — The authors put it forward as true.
- Checkable: passes — It can be checked against evidence.
- Load-bearing: fails — The paper’s conclusions may not depend on it.
- Based: passes — The paper gives a reason why it holds.
Probably not a substantial claim. The paper’s conclusions may not depend on it. It may state two separate claims as one.
- Supported
Every source the paper cites for this claim was checked and supports it.
In the paper
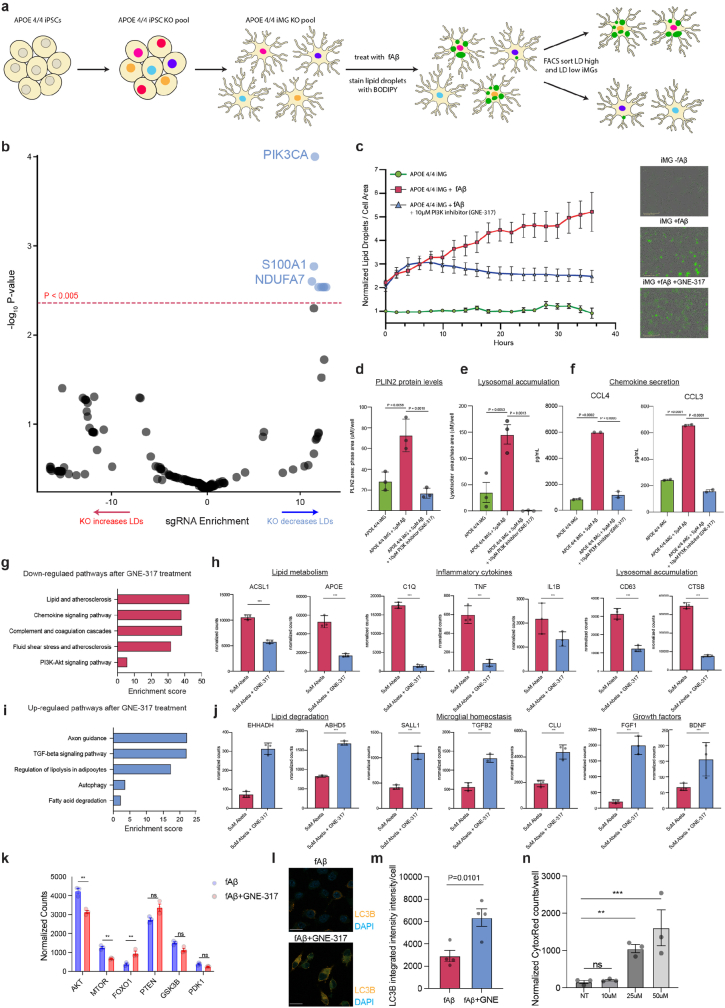
“PI3 kinase inhibition is a known modulator of LDs in mouse macrophages26 but this has not been previously shown in human microglia.”
§ APOE4/4 is linked to damaging lipid droplets in Alzheimer’s disease microglia > ACSL1 and triglycerides increase after fAβ challenge
What the sources say
- Supportedcites [26] Pacheco, P. et al. Monocyte chemoattractant protein-1/CC chemokine ligand 2 controls microtubule-driven biogenesis and leukotriene B 4-synthesizing function of macrophage lipid bodies elicited by innate immune response. J. Immunol. 179, 8500–8508 (2007). source
The section on CCR2, ERK, and PI3K activation reports that the PI3K inhibitor LY294002 blocked MCP-1-induced lipid body formation in mouse macrophages. The citation is attached to the mouse-macrophage finding; the statement about human microglia is the citing authors’ own novelty claim. (LLM, conf=0.92)
boosteddirect- Asserted: passes — The authors put it forward as true.
- Checkable: passes — It can be checked against evidence.
- Load-bearing: fails — The paper’s conclusions may not depend on it.
- Based: passes — The paper gives a reason why it holds.
Probably not a substantial claim. The paper’s conclusions may not depend on it. It may state two separate claims as one.
- Supported
Every source the paper cites for this claim was checked and supports it.
In the paper
“lipid-laden ‘foamy macrophages’ in atherosclerosis which have a senescent phenotype and are drivers of pathology37.”
§ APOE4/4 is linked to damaging lipid droplets in Alzheimer’s disease microglia > Discussion
What the sources say
- Supportedcites [37] Childs, B. G. et al. Senescent intimal foam cells are deleterious at all stages of atherosclerosis. Science 354, 472–477 (2016). source
The paper reports that foamy macrophages bearing senescence markers accumulate in early atherosclerotic lesions and drive pathology through inflammatory and atherogenic signaling. It also reports that removing senescent foamy macrophages from early lesions led to lesion regression. These findings are from an atherosclerosis-prone mouse model. (LLM, conf=0.93)
plaindirect- Asserted: passes — The authors put it forward as true.
- Checkable: passes — It can be checked against evidence.
- Load-bearing: fails — The paper’s conclusions may not depend on it.
- Based: passes — The paper gives a reason why it holds.
Probably not a substantial claim. The paper’s conclusions may not depend on it. It may state two separate claims as one.
- Supported
Every source the paper cites for this claim was checked and supports it.
In the paper
“Isogenic APOE4/4 and APOE3/3 iPS cells were generated as previously described16.”
§ APOE4/4 is linked to damaging lipid droplets in Alzheimer’s disease microglia > Methods > iPS cell maintenance and differentiation to microglia
What the sources say
- Supportedcites [16] Wang, C. et al. Gain of toxic apolipoprotein E4 effects in human iPSC-derived neurons is ameliorated by a small-molecule structure corrector article. Nat. Med. 24, 647–657 (2018). source
The Results section (‘Gene editing reveals the specificity of apoE4’) states that the authors generated an isogenic APOE3/3 hiPSC line from an APOE4/4 hiPSC line. The Online Methods section describes the gene-editing procedure, supporting the cited description of the cells. (LLM, conf=0.94)
plain- Asserted: passes — The authors put it forward as true.
- Checkable: passes — It can be checked against evidence.
- Load-bearing: passes — The paper’s conclusions depend on it.
- Based: passes — The paper gives a reason why it holds.
Probably not a substantial claim.
- Supported
Every source the paper cites for this claim was checked and supports it.
In the paper
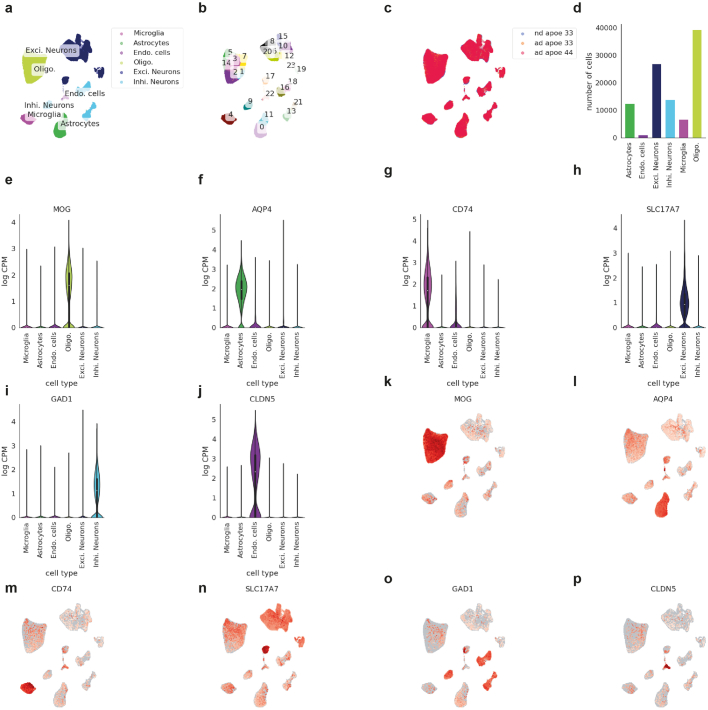
“We then used the Python implementation of BBKNN (v.1.5.1), a fast batch correction algorithm suitable for large datasets to integrate data across the samples45. BBKNN calculates a batch-corrected neighbourhood graph from the imputed principal components. We set the individual sample IDs as batch labels to correct for potential sample-wise batch effects.”
§ APOE4/4 is linked to damaging lipid droplets in Alzheimer’s disease microglia > Methods > Global data integration and clustering
What the sources say
- Supportedcites [45] Polański, K. et al. BBKNN: fast batch alignment of single cell transcriptomes. Bioinformatics 36, 964–965 (2020). source
The Introduction identifies BBKNN as a fast Python batch-alignment method. The Materials and methods section explains that it constructs a neighbourhood graph balanced across user-defined batches, supporting its use to integrate samples and address sample-wise batch effects. The choice to use individual sample IDs as batch labels describes the citing authors’ procedure, not a result attributed to this source. (LLM, conf=0.92)
plaindirect- Asserted: passes — The authors put it forward as true.
- Checkable: passes — It can be checked against evidence.
- Load-bearing: fails — The paper’s conclusions may not depend on it.
- Based: passes — The paper gives a reason why it holds.
Probably not a substantial claim. The paper’s conclusions may not depend on it.
- Supported
The cited sources support only part of this claim — read each source’s verdict below.
In the paper
“alpha-synuclein binding to TLR2 and TLR5 induces microglial NLRP3 inflammasome activation, which is a shared signature seen in LDAM36.”
§ APOE4/4 is linked to damaging lipid droplets in Alzheimer’s disease microglia > Discussion
What the sources say
- Partly supportedcites [36] Scheiblich, H. et al. Microglial NLRP3 inflammasome activation upon TLR2 and TLR5 ligation by distinct α-synuclein assemblies. J. Immunol. 207, 2143–2154 (2021). sourceExperimental — accuracy not yet measured
The Discussion (page not available) reports that α-synuclein monomers and oligomers act through TLR2 to prime the microglial NLRP3 inflammasome and through TLR5 to activate it. The paper does not identify this activation as a shared signature of LDAM; searches for LDAM and lipid-droplet-associated microglia found no supporting passage. (LLM, conf=0.86)
plaindirect- Asserted: passes — The authors put it forward as true.
- Checkable: passes — It can be checked against evidence.
- Load-bearing: fails — The paper’s conclusions may not depend on it.
- Based: passes — The paper gives a reason why it holds.
Probably not a substantial claim. The paper’s conclusions may not depend on it. It may state two separate claims as one.
- Partly supported
Every source the paper cites for this claim was checked and supports it.
In the paper
“This approach takes inspiration from recent work showing the deleterious effects of conditioned media on neurons from astrocytes30 and microglia4.”
§ APOE4/4 is linked to damaging lipid droplets in Alzheimer’s disease microglia > LD+ iMG induce pTau and apoptosis in neurons
What the sources say
- Supportedcites [30] Guttenplan, K. A. et al. Neurotoxic reactive astrocytes induce cell death via saturated lipids. Nature 599, 102–107 (2021). source
The Abstract (page unavailable) states that activated astrocytes secrete factors toxic to neurons, and the Methods (page unavailable) describe collecting reactive astrocyte conditioned media and testing neuronal survival. Citation 30 is attached to the astrocyte portion of the citing sentence; the microglia portion has a separate citation. (LLM, conf=0.91)
- Supportedcites [4] Victor, M. B. et al. Lipid accumulation induced by APOE4 impairs microglial surveillance of neuronal-network activity. Cell Stem Cell 29, 1197–1212 (2022). source
The citation to this paper is attached to the microglia portion of the sentence, not the astrocyte portion. In Results, under “Imbalance in the net flux of lipids by APOE4 iMGLs,” the authors report that conditioned media from APOE4 microglia-like cells robustly decreased neuronal calcium transients; the finding is specific to APOE4 conditioned media. (LLM, conf=0.92)
plaindirect- Asserted: passes — The authors put it forward as true.
- Checkable: passes — It can be checked against evidence.
- Load-bearing: fails — The paper’s conclusions may not depend on it.
- Based: passes — The paper gives a reason why it holds.
Probably not a substantial claim. The paper’s conclusions may not depend on it.
- Supported
Every source the paper cites for this claim was checked and supports it.
In the paper
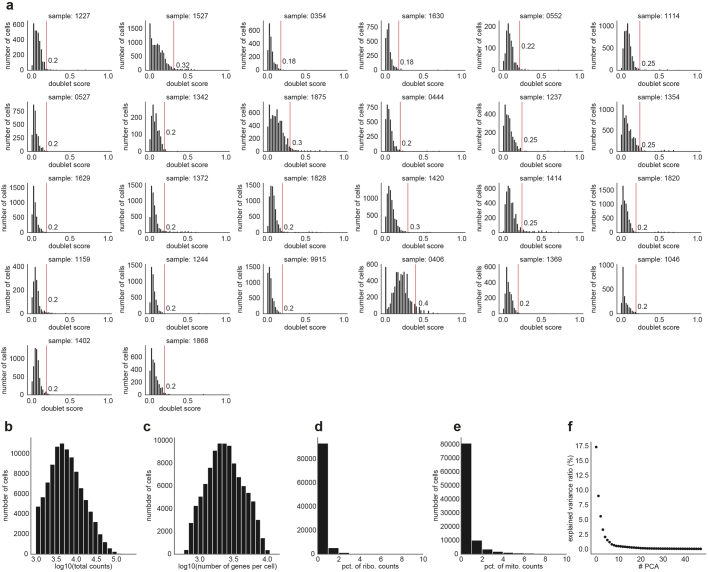
“Count data were first screened for doublets with the Scrublet (v.0.2.3) Python package43. Once each cell was doublet scored, we applied a separate doublet score threshold per sample to discard doublets from the data.”
§ APOE4/4 is linked to damaging lipid droplets in Alzheimer’s disease microglia > Methods > snRNA-seq quality control
What the sources say
- Supportedcites [43] Wolock, S. L., Lopez, R. & Klein, A. M. Scrublet: computational identification of cell doublets in single-cell transcriptomic data. Cell Syst. 8, 281–291 (2019). source
The Introduction identifies Scrublet as a method for scoring transcriptomes to detect doublets. The STAR★METHODS General Approach describes removing likely doublets by thresholding those scores, and the dataset methods show thresholds set for individual datasets. The citing authors’ choice of a separate threshold for each of their samples is their own procedure, not a result attributed to this paper. (LLM, conf=0.92)
plain- Asserted: passes — The authors put it forward as true.
- Checkable: passes — It can be checked against evidence.
- Load-bearing: fails — The paper’s conclusions may not depend on it.
- Based: passes — The paper gives a reason why it holds.
Probably not a substantial claim. The paper’s conclusions may not depend on it.
- Supported
A result the paper reports from its own data — it cites no other source for it, so there is none to check. The quote shows it is in the paper.
In the paper
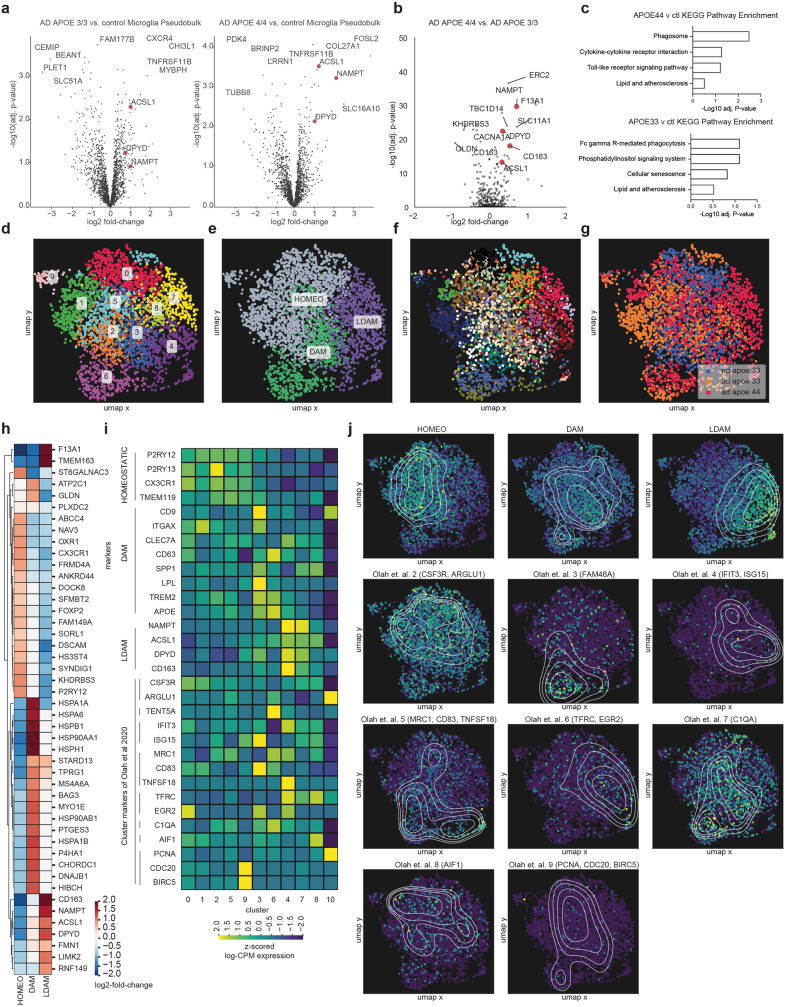
“AD-APOE4/4 brain tissue has the greatest percentage of LDAM, followed by AD-APOE3/3 and the least amount of the LDAM microglia state is found in the aged-matched control brain tissue”
- Also stated in: § Discussion · plain
“We report that LDAM are more prevalent in AD brains compared to controls and enriched in individuals with the APOE4/4 genotype.”
§ APOE4/4 is linked to damaging lipid droplets in Alzheimer’s disease microglia > Lipid-associated ACSL1+ microglia in AD
plaincorrelational- Asserted: passes — The authors put it forward as true.
- Checkable: passes — It can be checked against evidence.
- Load-bearing: passes — The paper’s conclusions depend on it.
- Based: passes — The paper gives a reason why it holds.
It may state two separate claims as one.
- Also stated in: § Discussion · plain
A result the paper reports from its own data — it cites no other source for it, so there is none to check. The quote shows it is in the paper.
In the paper
“This screen revealed regulators of triglyceride metabolism as being a top category of genes required for LD accumulation and ACSL1 as one of the most significant genes required for LD formation”
§ APOE4/4 is linked to damaging lipid droplets in Alzheimer’s disease microglia > ACSL1 and triglycerides increase after fAβ challenge
plaindirect- Asserted: passes — The authors put it forward as true.
- Checkable: passes — It can be checked against evidence.
- Load-bearing: passes — The paper’s conclusions depend on it.
- Based: passes — The paper gives a reason why it holds.
It may state two separate claims as one.
A result the paper reports from its own data — it cites no other source for it, so there is none to check. The quote shows it is in the paper.
In the paper
“Through single-nucleus RNA sequencing of brain tissue in Alzheimer’s disease, we have identified a microglial state defined by the expression of the lipid droplet-associated enzyme ACSL1 with ACSL1-positive microglia being most abundant in patients with Alzheimer’s disease having the APOE4/4 genotype.”
§ APOE4/4 is linked to damaging lipid droplets in Alzheimer’s disease microglia > Abstract
plaincorrelational- Asserted: passes — The authors put it forward as true.
- Checkable: passes — It can be checked against evidence.
- Load-bearing: passes — The paper’s conclusions depend on it.
- Based: passes — The paper gives a reason why it holds.
It may state two separate claims as one.
A result the paper reports from its own data — it cites no other source for it, so there is none to check. The quote shows it is in the paper.
In the paper
“ACSL1 was upregulated specifically in microglia in AD brain tissue compared to controls and to a greater extent in APOE4/4 compared to AD-APOE3/3 microglia”
§ APOE4/4 is linked to damaging lipid droplets in Alzheimer’s disease microglia > Lipid-associated ACSL1+ microglia in AD
plaincorrelational- Asserted: passes — The authors put it forward as true.
- Checkable: passes — It can be checked against evidence.
- Load-bearing: passes — The paper’s conclusions depend on it.
- Based: passes — The paper gives a reason why it holds.
It may state two separate claims as one.
A result the paper reports from its own data — it cites no other source for it, so there is none to check. The quote shows it is in the paper.
In the paper
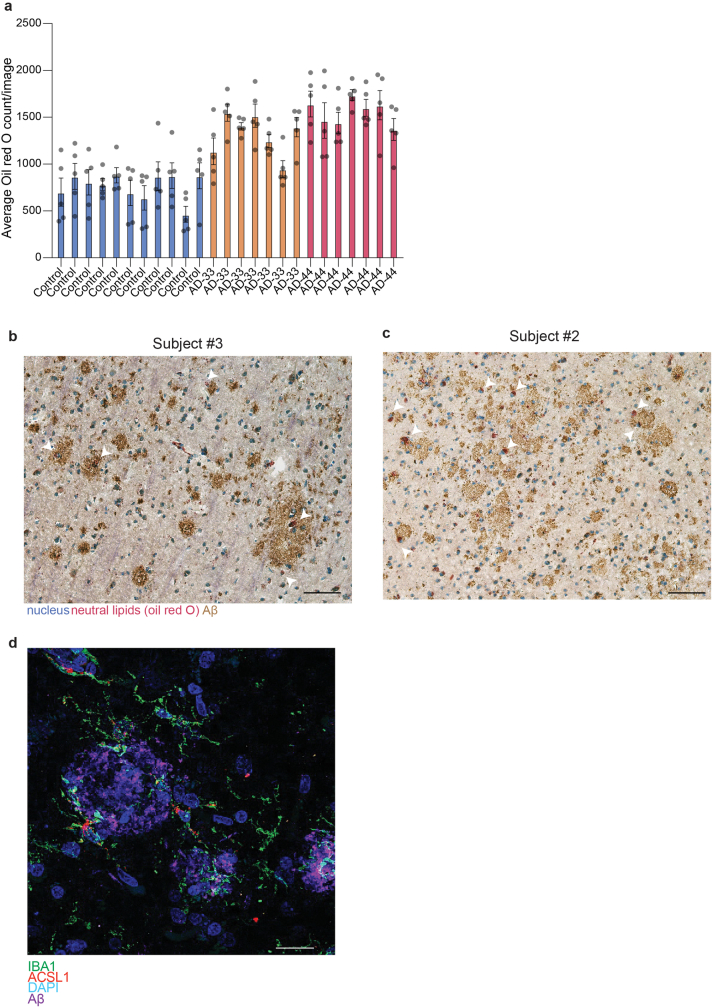
“The number of lipid bodies is negatively correlated with cognitive performance, as measured by the mini-mental state exam (MMSE) and positively correlated with Aβ plaque amounts and Tau pathology levels”
§ APOE4/4 is linked to damaging lipid droplets in Alzheimer’s disease microglia > Lipid accumulation is linked to AD pathology
plaincorrelational- Asserted: passes — The authors put it forward as true.
- Checkable: passes — It can be checked against evidence.
- Load-bearing: passes — The paper’s conclusions depend on it.
- Based: passes — The paper gives a reason why it holds.
It may state two separate claims as one.
A result the paper reports from its own data — it cites no other source for it, so there is none to check. The quote shows it is in the paper.
In the paper
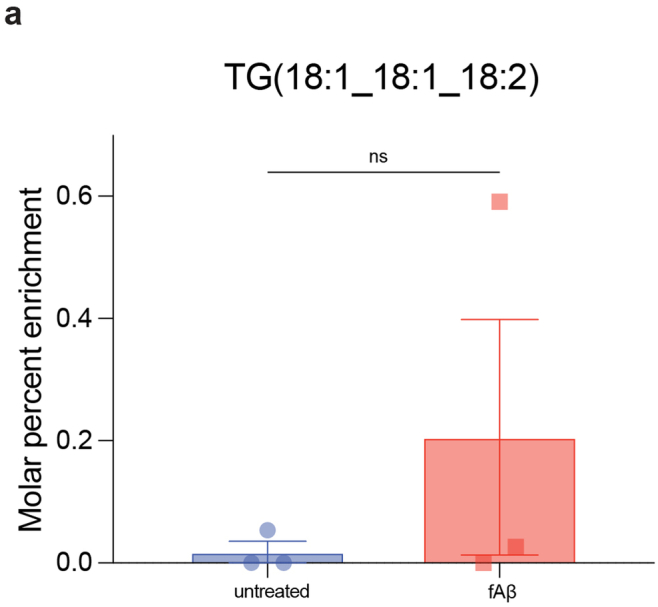
“However, treatment of iMG with fibrillar Aβ (fAβ) led to a strong increase in LD accumulation which was exacerbated by the presence of the APOE4 AD-risk allele.”
- Also stated in: § Discussion · plain
“We also describe the induction of triglyceride synthesis and LD accumulation following fAβ treatment in iMG and that the LD induction is greater in isogenic APOE4/4 iMG than APOE3/3 iMG.”
§ APOE4/4 is linked to damaging lipid droplets in Alzheimer’s disease microglia > ACSL1 and triglycerides increase after fAβ challenge
boosteddirect- Asserted: passes — The authors put it forward as true.
- Checkable: passes — It can be checked against evidence.
- Load-bearing: passes — The paper’s conclusions depend on it.
- Based: passes — The paper gives a reason why it holds.
It may state two separate claims as one.
- Also stated in: § Discussion · plain
A result the paper reports from its own data — it cites no other source for it, so there is none to check. The quote shows it is in the paper.
In the paper
“These lipid bodies are most prevalent in AD brain tissue with a slight but not significant increase in individuals with AD-APOE4/4 compared to those with AD-APOE3/3”
§ APOE4/4 is linked to damaging lipid droplets in Alzheimer’s disease microglia > Lipid accumulation is linked to AD pathology
plain- Asserted: passes — The authors put it forward as true.
- Checkable: passes — It can be checked against evidence.
- Load-bearing: unclear — It is unclear whether the paper’s conclusions depend on it.
- Based: passes — The paper gives a reason why it holds.
It may state two separate claims as one.
A result the paper reports from its own data — it cites no other source for it, so there is none to check. The quote shows it is in the paper.
In the paper
“This yielded ~100,000 single-nucleus transcriptomes with all main cell types of the brain represented”
§ APOE4/4 is linked to damaging lipid droplets in Alzheimer’s disease microglia > Lipid-associated ACSL1+ microglia in AD
plain- Asserted: passes — The authors put it forward as true.
- Checkable: passes — It can be checked against evidence.
- Load-bearing: passes — The paper’s conclusions depend on it.
- Based: passes — The paper gives a reason why it holds.
Probably not a substantial claim. It may state two separate claims as one.
A result the paper reports from its own data — it cites no other source for it, so there is none to check. The quote shows it is in the paper.
In the paper
“13C-labelled TAG lipids synthesized in microglia were also observed in mouse neurons treated with conditioned media from BV2s grown in 13C-labelled glucose, however, this was not robustly detected across several replicates perhaps due to the low isotopic enrichment of these lipids”
§ APOE4/4 is linked to damaging lipid droplets in Alzheimer’s disease microglia > LD+ iMG induce pTau and apoptosis in neurons
hedged- Asserted: passes — The authors put it forward as true.
- Checkable: passes — It can be checked against evidence.
- Load-bearing: fails — The paper’s conclusions may not depend on it.
- Based: passes — The paper gives a reason why it holds.
Probably not a substantial claim. The paper’s conclusions may not depend on it. It may state two separate claims as one.
The paper states this without a source or data behind it here, so there is nothing to check it against. The quote shows it is in the paper.
In the paper
“the LDAM expression signature, such as ACSL1 and NAMPT upregulation, seems to be unique to microglia.”
§ APOE4/4 is linked to damaging lipid droplets in Alzheimer’s disease microglia > Discussion
hedged- Asserted: passes — The authors put it forward as true.
- Checkable: passes — It can be checked against evidence.
- Load-bearing: fails — The paper’s conclusions may not depend on it.
- Based: fails — The paper may give no reason why it holds.
Probably not a substantial claim. The paper’s conclusions may not depend on it. The paper may give no reason why it holds.
A result the paper reports from its own data — it cites no other source for it, so there is none to check. The quote shows it is in the paper.
In the paper
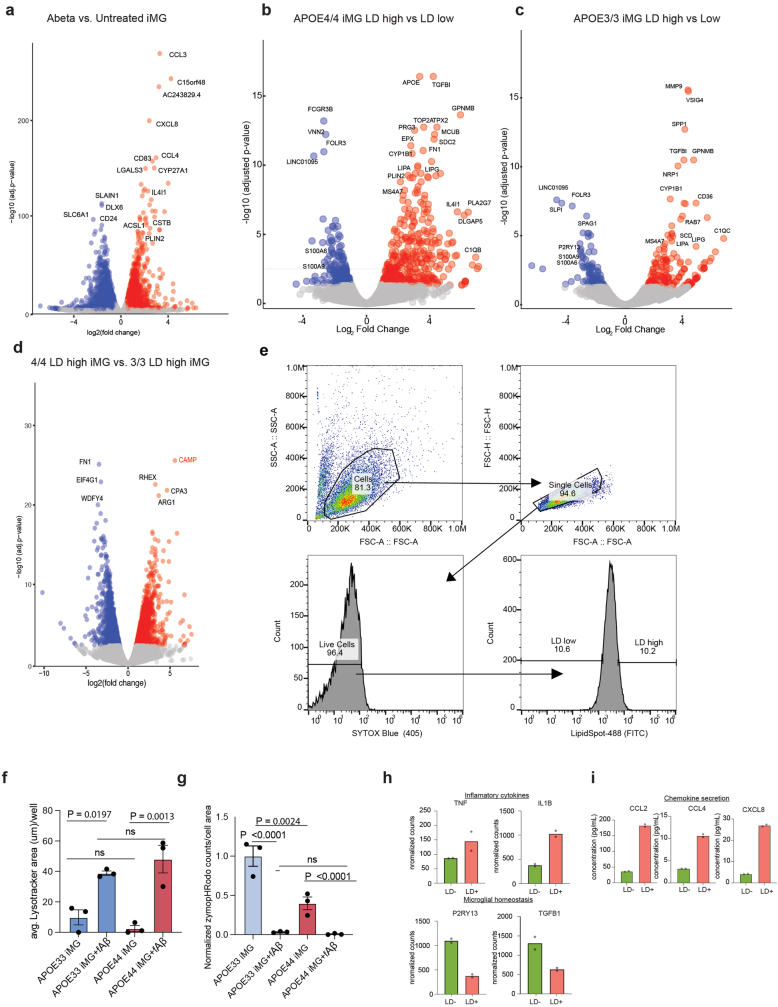
“In accordance with these RNA-seq results, phenotypic measurements of LD-containing APOE4/4 iMGs indicate that they are dysfunctional in phagocytosis, accumulate lysosomes and secrete inflammation-associated chemokines as measured in the cell culture media”
§ APOE4/4 is linked to damaging lipid droplets in Alzheimer’s disease microglia > ACSL1 and triglycerides increase after fAβ challenge
hedgedcorrelational- Asserted: passes — The authors put it forward as true.
- Checkable: passes — It can be checked against evidence.
- Load-bearing: passes — The paper’s conclusions depend on it.
- Based: passes — The paper gives a reason why it holds.
It may state two separate claims as one.
A result the paper reports from its own data — it cites no other source for it, so there is none to check. The quote shows it is in the paper.
In the paper
“RNA-seq results indicated that LD-high microglia had higher expression of NF-κB associated pro-inflammatory cytokines (for example, TNFA and IL1B) and lower expression of microglial homeostasis markers compared to LD-low microglia”
§ APOE4/4 is linked to damaging lipid droplets in Alzheimer’s disease microglia > ACSL1 and triglycerides increase after fAβ challenge
hedgedcorrelational- Asserted: passes — The authors put it forward as true.
- Checkable: passes — It can be checked against evidence.
- Load-bearing: passes — The paper’s conclusions depend on it.
- Based: passes — The paper gives a reason why it holds.
It may state two separate claims as one.
A result the paper reports from its own data — it cites no other source for it, so there is none to check. The quote shows it is in the paper.
In the paper
“On GNE-317 treatment, genes in the PI3K/mTOR and autophagy pathways exhibit changes in expression and we also observed an increase in LC3B protein levels”
§ APOE4/4 is linked to damaging lipid droplets in Alzheimer’s disease microglia > ACSL1 and triglycerides increase after fAβ challenge
plaindirect- Asserted: passes — The authors put it forward as true.
- Checkable: passes — It can be checked against evidence.
- Load-bearing: passes — The paper’s conclusions depend on it.
- Based: passes — The paper gives a reason why it holds.
It may state two separate claims as one.
A result the paper reports from its own data — it cites no other source for it, so there is none to check. The quote shows it is in the paper.
In the paper
“Likewise, conditioned media from APOE3/3 and APOE4/4 iMGs with a higher concentrations of LDs induced caspase activation in human neurons, whereas conditioned media from APOE-KO iMG had no effect”
§ APOE4/4 is linked to damaging lipid droplets in Alzheimer’s disease microglia > LD+ iMG induce pTau and apoptosis in neurons
plaindirect- Asserted: passes — The authors put it forward as true.
- Checkable: passes — It can be checked against evidence.
- Load-bearing: passes — The paper’s conclusions depend on it.
- Based: passes — The paper gives a reason why it holds.
It may state two separate claims as one.
A result the paper reports from its own data — it cites no other source for it, so there is none to check. The quote shows it is in the paper.
In the paper
“Only the LD-high iMG-conditioned media induced high concentrations of pTau in the iPS cell-derived neurons, whereas the LD-low iMG-conditioned media induced similar concentrations of pTau in the iPS cell-derived neurons as the untreated condition”
§ APOE4/4 is linked to damaging lipid droplets in Alzheimer’s disease microglia > LD+ iMG induce pTau and apoptosis in neurons
plaindirect- Asserted: passes — The authors put it forward as true.
- Checkable: passes — It can be checked against evidence.
- Load-bearing: passes — The paper’s conclusions depend on it.
- Based: passes — The paper gives a reason why it holds.
It may state two separate claims as one.
A result the paper reports from its own data — it cites no other source for it, so there is none to check. The quote shows it is in the paper.
In the paper
“This effect was similar when conditioned media from APOE3/3 and APOE4/4 iPS cell-derived iMG were used to treat the human neurons but absent when conditioned media from APOE-KO iMGs were used”
§ APOE4/4 is linked to damaging lipid droplets in Alzheimer’s disease microglia > LD+ iMG induce pTau and apoptosis in neurons
plaindirect- Asserted: passes — The authors put it forward as true.
- Checkable: passes — It can be checked against evidence.
- Load-bearing: passes — The paper’s conclusions depend on it.
- Based: passes — The paper gives a reason why it holds.
It may state two separate claims as one.
A result the paper reports from its own data — it cites no other source for it, so there is none to check. The quote shows it is in the paper.
In the paper
“Interestingly, the second top hit was S100A1, an AD risk gene downstream of the LPS and TLR4 response in macrophages.”
§ APOE4/4 is linked to damaging lipid droplets in Alzheimer’s disease microglia > ACSL1 and triglycerides increase after fAβ challenge
plain- Asserted: passes — The authors put it forward as true.
- Checkable: passes — It can be checked against evidence.
- Load-bearing: fails — The paper’s conclusions may not depend on it.
- Based: passes — The paper gives a reason why it holds.
Probably not a substantial claim. The paper’s conclusions may not depend on it.
In the paper
“LDs themselves have antimicrobial properties and are an evolutionarily conserved form of innate immune defence in macrophages8.”
§ APOE4/4 is linked to damaging lipid droplets in Alzheimer’s disease microglia > Main
What the sources say
- Not checked — no full text of the sourcecites [8] Bosch, M. et al. Mammalian lipid droplets are innate immune hubs integrating cell metabolism and host defense. Science 370, eaay8085 (2020). source
plain- Asserted: passes — The authors put it forward as true.
- Checkable: passes — It can be checked against evidence.
- Load-bearing: fails — The paper’s conclusions may not depend on it.
- Based: passes — The paper gives a reason why it holds.
Probably not a substantial claim. The paper’s conclusions may not depend on it. It may state two separate claims as one.
A conclusion the paper draws from its own results — it cites no other source for it, so there is none to check. The quote shows it is in the paper.
In the paper
“suggesting that the cells containing lipid bodies near plaques could be ACSL1+ microglia.”
§ APOE4/4 is linked to damaging lipid droplets in Alzheimer’s disease microglia > Lipid accumulation is linked to AD pathology
hedgedcorrelational- Asserted: passes — The authors put it forward as true.
- Checkable: passes — It can be checked against evidence.
- Load-bearing: fails — The paper’s conclusions may not depend on it.
- Based: passes — The paper gives a reason why it holds.
Probably not a substantial claim. The paper’s conclusions may not depend on it.
A claim is checked only against the cited paper’s full text, never its abstract, and none is available for its sources.
In the paper
“ACSL1 is a key enzyme in LD biogenesis and overexpression of ACSL1 is sufficient to induce triglyceride-specific LD formation in several cell types13,14”
§ APOE4/4 is linked to damaging lipid droplets in Alzheimer’s disease microglia > Lipid-associated ACSL1+ microglia in AD
What the sources say
- Not checked — no full text of the sourcecites [13] Li, L. O. et al. Overexpression of rat long chain acyl-coa synthetase 1 alters fatty acid metabolism in rat primary hepatocytes. J. Biol. Chem. 281, 37246–37255 (2006). source
- Not checked — no full text of the sourcecites [14] Zhao, Z. et al. Effects of overexpression of ACSL1 gene on the synthesis of unsaturated fatty acids in adipocytes of bovine. Arch. Biochem. Biophys. 695, 108648 (2020). source
plaindirect- Asserted: passes — The authors put it forward as true.
- Checkable: passes — It can be checked against evidence.
- Load-bearing: passes — The paper’s conclusions depend on it.
- Based: passes — The paper gives a reason why it holds.
It may state two separate claims as one.
What the paper did — it cites no source for this, so there is none to check. The quote shows it is in the paper.
In the paper
“We used the Scanpy (v.1.9.1) package to discard cells with (1) fewer than 500 genes or (2) less than total 1,000 reads or (3) more than 10% mitochondrial reads or (4) more than 10% ribosomal reads.”
§ APOE4/4 is linked to damaging lipid droplets in Alzheimer’s disease microglia > Methods > snRNA-seq quality control
plain- Asserted: passes — The authors put it forward as true.
- Checkable: passes — It can be checked against evidence.
- Load-bearing: fails — The paper’s conclusions may not depend on it.
- Based: passes — The paper gives a reason why it holds.
Probably not a substantial claim. The paper’s conclusions may not depend on it. It may state two separate claims as one.
In the paper
“To conduct unbiased single-cell level downstream analysis of the microglial cells which is not biased towards any of the patient samples, first we subsampled the microglia cluster with purification50.”
§ APOE4/4 is linked to damaging lipid droplets in Alzheimer’s disease microglia > Methods > Microglia subsampling
What the sources say
- Not matchedcites [50] Palovics, R., Wyss-Coray, T. & Mirzasoleiman, B. Purification of single-cell transcriptomics data with coreset selection. In The 2022 ICML Workshop on Computational Biology Paper 67 (ICML, 2022).
Couldn’t be matched to a paper in Crossref, so it can’t be checked.
plain- Asserted: passes — The authors put it forward as true.
- Checkable: passes — It can be checked against evidence.
- Load-bearing: passes — The paper’s conclusions depend on it.
- Based: passes — The paper gives a reason why it holds.
Probably not a substantial claim.
- Not matched
What the paper did — it cites no source for this, so there is none to check. The quote shows it is in the paper.
In the paper
“Irreproducible discovery rate (IDR) was used to test for reproducibility between replicates.”
§ APOE4/4 is linked to damaging lipid droplets in Alzheimer’s disease microglia > Methods > ATAC-seq analysis
plain- Asserted: passes — The authors put it forward as true.
- Checkable: passes — It can be checked against evidence.
- Load-bearing: fails — The paper’s conclusions may not depend on it.
- Based: passes — The paper gives a reason why it holds.
Probably not a substantial claim. The paper’s conclusions may not depend on it.
What the paper did — it cites no source for this, so there is none to check. The quote shows it is in the paper.
In the paper
“In duplicate culture conditions, cells were treated with 5 μM Aβ fibrils for 24 h, stained with BODIPY 493/503 (1:2,000 from 1 mg ml−1 of stock solution in DMSO; Thermo Fisher) and top 10% highest and 10% lowest BODIPY fluorescent cells were separated by FACS (Sony, MA900).”
§ APOE4/4 is linked to damaging lipid droplets in Alzheimer’s disease microglia > Methods > iMG CRISPR–Cas9 screen
plain- Asserted: passes — The authors put it forward as true.
- Checkable: passes — It can be checked against evidence.
- Load-bearing: fails — The paper’s conclusions may not depend on it.
- Based: passes — The paper gives a reason why it holds.
Probably not a substantial claim. The paper’s conclusions may not depend on it.
What the paper did — it cites no source for this, so there is none to check. The quote shows it is in the paper.
In the paper
“Cells were identified by thresholding with the Triangle method.”
§ APOE4/4 is linked to damaging lipid droplets in Alzheimer’s disease microglia > Methods > Characterization by CARS and confocal fluorescence microscopy
plain- Asserted: passes — The authors put it forward as true.
- Checkable: passes — It can be checked against evidence.
- Load-bearing: fails — The paper’s conclusions may not depend on it.
- Based: passes — The paper gives a reason why it holds.
Probably not a substantial claim. The paper’s conclusions may not depend on it.
What the paper did — it cites no source for this, so there is none to check. The quote shows it is in the paper.
In the paper
“ATAC-seq experiments were performed in replicate and peaks were called with parameters -L 0 -C 0 -fdr 0.9 -minDist 200 -size 200.”
§ APOE4/4 is linked to damaging lipid droplets in Alzheimer’s disease microglia > Methods > ATAC-seq analysis
plain- Asserted: passes — The authors put it forward as true.
- Checkable: passes — It can be checked against evidence.
- Load-bearing: fails — The paper’s conclusions may not depend on it.
- Based: passes — The paper gives a reason why it holds.
Probably not a substantial claim. The paper’s conclusions may not depend on it.
In the paper
“A recent report showed that innate immune triggers (for example, Escherichia coli and Salmonella) induce LD formation in peripheral macrophages as part of an evolutionarily conserved antimicrobial defence in which LDs coated with antimicrobial proteins, such as cathelicidin (CAMP), kill bacteria8.”
§ APOE4/4 is linked to damaging lipid droplets in Alzheimer’s disease microglia > Discussion
What the sources say
- Not checked — no full text of the sourcecites [8] Bosch, M. et al. Mammalian lipid droplets are innate immune hubs integrating cell metabolism and host defense. Science 370, eaay8085 (2020). source
plaindirect- Asserted: passes — The authors put it forward as true.
- Checkable: passes — It can be checked against evidence.
- Load-bearing: fails — The paper’s conclusions may not depend on it.
- Based: passes — The paper gives a reason why it holds.
Probably not a substantial claim. The paper’s conclusions may not depend on it. It may state two separate claims as one.
In the paper
“P values were corrected with Benjamini–Hochberg procedure49 (false discovery rate (FDR) = 0.05) per comparison.”
§ APOE4/4 is linked to damaging lipid droplets in Alzheimer’s disease microglia > Methods > Microglia pseudobulk differential gene expression
What the sources say
- Not checked — no full text of the sourcecites [49] Benjamini, Y. & Hochberg, Y. Controlling the false discovery rate: a practical and powerful approach to multiple testing. J. R. Stat. Soc. B 57, 289–300 (1995). source
plain- Asserted: passes — The authors put it forward as true.
- Checkable: passes — It can be checked against evidence.
- Load-bearing: passes — The paper’s conclusions depend on it.
- Based: passes — The paper gives a reason why it holds.
Probably not a substantial claim.
What the paper did — it cites no source for this, so there is none to check. The quote shows it is in the paper.
In the paper
“Screens were performed in duplicate.”
§ APOE4/4 is linked to damaging lipid droplets in Alzheimer’s disease microglia > Methods > GW lipid droplet CRISPR–Cas9 screen
plain- Asserted: passes — The authors put it forward as true.
- Checkable: passes — It can be checked against evidence.
- Load-bearing: fails — The paper’s conclusions may not depend on it.
- Based: passes — The paper gives a reason why it holds.
Probably not a substantial claim. The paper’s conclusions may not depend on it.
In the paper
“Enhancing autophagy has previously been explored as a strategy to modulate neurodegeneration disease progression but with a focus on autophagic degradation of proteins41, as opposed to the autophagic degradation of intracellular LDs (lipophagy).”
§ APOE4/4 is linked to damaging lipid droplets in Alzheimer’s disease microglia > Discussion
What the sources say
- Not checked — no full text of the sourcecites [41] Heras-Sandoval, D., Pérez-Rojas, J. M., Hernández-Damián, J. & Pedraza-Chaverri, J. The role of PI3K/AKT/mTOR pathway in the modulation of autophagy and the clearance of protein aggregates in neurodegeneration. Cell. Signal. 26, 2694–2701 (2014). source
plain- Asserted: passes — The authors put it forward as true.
- Checkable: passes — It can be checked against evidence.
- Load-bearing: fails — The paper’s conclusions may not depend on it.
- Based: passes — The paper gives a reason why it holds.
Probably not a substantial claim. The paper’s conclusions may not depend on it.
What the paper did — it cites no source for this, so there is none to check. The quote shows it is in the paper.
In the paper
“these experiments do not conclusively demonstrate that there is increased autophagic flux of lipids in this context”
§ APOE4/4 is linked to damaging lipid droplets in Alzheimer’s disease microglia > Discussion
boosted- Asserted: passes — The authors put it forward as true.
- Checkable: passes — It can be checked against evidence.
- Load-bearing: fails — The paper’s conclusions may not depend on it.
- Based: passes — The paper gives a reason why it holds.
Probably not a substantial claim. The paper’s conclusions may not depend on it.
A conclusion the paper draws from its own results — it cites no other source for it, so there is none to check. The quote shows it is in the paper.
In the paper
“It is likely that the APOE genotype contributes to AD pathogenesis through several distinct mechanisms unique to individual cell-type dysfunction or through crosstalk between these cell types.”
§ APOE4/4 is linked to damaging lipid droplets in Alzheimer’s disease microglia > Discussion
hedgedconditional- Asserted: passes — The authors put it forward as true.
- Checkable: fails — It may be too vague to check against evidence.
- Load-bearing: fails — The paper’s conclusions may not depend on it.
- Based: passes — The paper gives a reason why it holds.
Probably not a substantial claim. It may be too vague to check against evidence. The paper’s conclusions may not depend on it.
What the paper did — it cites no source for this, so there is none to check. The quote shows it is in the paper.
In the paper
“All assays were performed under serum-free conditions (MGdM media).”
§ APOE4/4 is linked to damaging lipid droplets in Alzheimer’s disease microglia > Methods > iPS cell maintenance and differentiation to microglia
plain- Asserted: passes — The authors put it forward as true.
- Checkable: passes — It can be checked against evidence.
- Load-bearing: fails — The paper’s conclusions may not depend on it.
- Based: passes — The paper gives a reason why it holds.
Probably not a substantial claim. The paper’s conclusions may not depend on it.
What the paper did — it cites no source for this, so there is none to check. The quote shows it is in the paper.
In the paper
“For all image analyses, a standard threshold value was chosen and automatically applied to each channel of each image before measurement.”
§ APOE4/4 is linked to damaging lipid droplets in Alzheimer’s disease microglia > Methods > Immunocytochemistry, imaging and quantification
plain- Asserted: passes — The authors put it forward as true.
- Checkable: passes — It can be checked against evidence.
- Load-bearing: fails — The paper’s conclusions may not depend on it.
- Based: passes — The paper gives a reason why it holds.
Probably not a substantial claim. The paper’s conclusions may not depend on it.
What the paper did — it cites no source for this, so there is none to check. The quote shows it is in the paper.
In the paper
“We set gender, expired age, postmortem interval and the percentage of mitochondrial and ribosomal counts as covariates.”
§ APOE4/4 is linked to damaging lipid droplets in Alzheimer’s disease microglia > Methods > Single-cell differential gene expression
plain- Asserted: passes — The authors put it forward as true.
- Checkable: passes — It can be checked against evidence.
- Load-bearing: fails — The paper’s conclusions may not depend on it.
- Based: passes — The paper gives a reason why it holds.
Probably not a substantial claim. The paper’s conclusions may not depend on it.
What the paper did — it cites no source for this, so there is none to check. The quote shows it is in the paper.
In the paper
“Intracellular lipid features were quantified using the ‘3D Objects Counter’ command.”
§ APOE4/4 is linked to damaging lipid droplets in Alzheimer’s disease microglia > Methods > Characterization by CARS and confocal fluorescence microscopy
plain- Asserted: passes — The authors put it forward as true.
- Checkable: passes — It can be checked against evidence.
- Load-bearing: passes — The paper’s conclusions depend on it.
- Based: passes — The paper gives a reason why it holds.
Probably not a substantial claim.
In the paper
“which is found on LD surfaces with antimicrobial properties in macrophages exposed to bacteria8.”
§ APOE4/4 is linked to damaging lipid droplets in Alzheimer’s disease microglia > ACSL1 and triglycerides increase after fAβ challenge
What the sources say
- Not checked — no full text of the sourcecites [8] Bosch, M. et al. Mammalian lipid droplets are innate immune hubs integrating cell metabolism and host defense. Science 370, eaay8085 (2020). source
plaincorrelational- Asserted: passes — The authors put it forward as true.
- Checkable: passes — It can be checked against evidence.
- Load-bearing: fails — The paper’s conclusions may not depend on it.
- Based: passes — The paper gives a reason why it holds.
Probably not a substantial claim. The paper’s conclusions may not depend on it.
What the paper did — it cites no source for this, so there is none to check. The quote shows it is in the paper.
In the paper
“The CARS stacks underwent east shadows correction, Gaussian blur filtering (σ = 1) and background subtraction (30 pixel rolling ball radius).”
§ APOE4/4 is linked to damaging lipid droplets in Alzheimer’s disease microglia > Methods > Characterization by CARS and confocal fluorescence microscopy
plain- Asserted: passes — The authors put it forward as true.
- Checkable: passes — It can be checked against evidence.
- Load-bearing: fails — The paper’s conclusions may not depend on it.
- Based: passes — The paper gives a reason why it holds.
Probably not a substantial claim. The paper’s conclusions may not depend on it. It may state two separate claims as one.
What the paper did — it cites no source for this, so there is none to check. The quote shows it is in the paper.
In the paper
“Lipid particles were identified by thresholding using the FindFoci method, with a search parameter for half peak value of 0.1, peak parameter for minimum peak height relative to background of 0 and a minimum peak size of 200 pixels.”
§ APOE4/4 is linked to damaging lipid droplets in Alzheimer’s disease microglia > Methods > Characterization by CARS and confocal fluorescence microscopy
plain- Asserted: passes — The authors put it forward as true.
- Checkable: passes — It can be checked against evidence.
- Load-bearing: passes — The paper’s conclusions depend on it.
- Based: passes — The paper gives a reason why it holds.
Probably not a substantial claim.
What the paper did — it cites no source for this, so there is none to check. The quote shows it is in the paper.
In the paper
“For each time point, red and green fluorescence was normalized to the phase confluence per well.”
§ APOE4/4 is linked to damaging lipid droplets in Alzheimer’s disease microglia > Methods > iMicroglia and macrophages immunofluorescence and live cell microscopy
plain- Asserted: passes — The authors put it forward as true.
- Checkable: passes — It can be checked against evidence.
- Load-bearing: fails — The paper’s conclusions may not depend on it.
- Based: passes — The paper gives a reason why it holds.
Probably not a substantial claim. The paper’s conclusions may not depend on it.
In the paper
“PI3K inhibition, shown to increase autophagy38.”
§ APOE4/4 is linked to damaging lipid droplets in Alzheimer’s disease microglia > Discussion
What the sources say
- Not checked — no full text of the sourcecites [38] Ersahin, T., Tuncbag, N. & Cetin-Atalay, R. The PI3K/AKT/mTOR interactive pathway. Mol. Biosyst. 11, 1946–1954 (2015). source
plaindirect- Asserted: passes — The authors put it forward as true.
- Checkable: passes — It can be checked against evidence.
- Load-bearing: passes — The paper’s conclusions depend on it.
- Based: passes — The paper gives a reason why it holds.
Probably not a substantial claim.
The paper relies on this without support.
The relationship between lipid metabolism in glia and Alzheimer’s disease pathology remains poorly understood.
“However, the relationship between lipid metabolism in glia and Alzheimer’s disease pathology remains poorly understood.”
The paper relies on this without support.
The role lipids and innate immunity play in Alzheimer’s disease risk remains poorly understood.
“However, the role lipids and innate immunity play in AD risk remains poorly understood.”
The paper relies on this without support.
Human induced pluripotent stem cell-derived microglia and neurons are valid models of human Alzheimer’s disease microglia and neurons.
“APOE4/4 and isogenic APOE3/3 iPS cells16 were differentiated into microglia (iMG) as previously described17–19”
The paper relies on this without support.
The LDAM state is maladaptive and damaging.
“maladaptive and damaging LDAM state”
The paper relies on this without support.
The iPS cell-derived microglia model recapitulates key aspects of human microglial biology relevant to LDAM.
“Differentiation into microglia was performed as previously described17–19.”
Claims other papers make about this one
Each is checked against this paper’s own text: does it say what the citing paper says it does?
The source backs part of the claim, not all of it — or backs it for a different population, condition or comparison.
In the citing paper
“and the APOE4-associated glial LD accumulation modulates neuron function and brain memory17–19.”
From PICALM Alzheimer’s risk allele causes aberrant lipid droplets in microglia (2025) · cites this paper as [19]
Experimental — accuracy not yet measuredThe source backs part of the claim, not all of it — or backs it for a different population, condition or comparison.
In the citing paper
“PI3K-AKT signaling is another key regulator of lipid metabolism, and PI3K inhibitors have been shown to efficiently block the accumulation of LDs in numerous studies and in several study models [9, 64, 65].”
From The protective PLCγ2-P522R variant mitigates Alzheimer’s disease-associated pathologies by enhancing beneficial microglial functions (2025) · cites this paper as [9]
Experimental — accuracy not yet measuredThe source backs part of the claim, not all of it — or backs it for a different population, condition or comparison.
In the citing paper
“APOE4 expression in human iMG was shown to induce secretion of lipids, which promoted tau phosphorylation in neurons63.”
From Decreased lipidated ApoE‐receptor interactions confer protection against pathogenicity of ApoE and its lipid cargoes in lysosomes (2025) · cites this paper as [63]
Experimental — accuracy not yet measuredThe source backs part of the claim, not all of it — or backs it for a different population, condition or comparison.
In the citing paper
“Also, both studies identified homeostatic, proliferative and lipid-associated types60 (micro-PVM_4 in SEA-AD and Mic.6 and Mic.15 in ref. 13), and one other subtype with no functional data or tissue localization information.”
From Integrated multimodal cell atlas of Alzheimer’s disease (2024) · cites this paper as [60]
Experimental — accuracy not yet measuredThe cited source says what the claim attributes to it.
In the citing paper
“BODIPY 493/503, a dye that detects LDs consisting of neutral lipids34,36”
From INPP5D/SHIP1 regulates endo-lysosomal function and cargo-selective phagocytosis in human microglia (2025) · cites this paper as [36]
The cited source says what the claim attributes to it.
In the citing paper
“Moreover, by recapitulating snRNA-seq analysis of AD brain MG states19, we found lower PICALM expression in disease-associated MGs (DAMs) and LD-accumulating MGs (LDAMs) (versus homeostatic MGs) (P = 0.016) (Extended Data Fig. 4c).”
From PICALM Alzheimer’s risk allele causes aberrant lipid droplets in microglia (2025) · cites this paper as [19]
The cited source says what the claim attributes to it.
In the citing paper
“Our results align with previously reported TG increases in LDAMs10 and APOE4-associated LDs19, further supporting our observed PICALM-risk-allele-associated LD accumulation in iMGs.”
From PICALM Alzheimer’s risk allele causes aberrant lipid droplets in microglia (2025) · cites this paper as [19]
The cited source says what the claim attributes to it.
In the citing paper
“Treating iMGs with triacsin C (TrC), an inhibitor of long-chain acyl-CoA synthetase that reduces LD formation10,18,19,39,40, effectively decreased BODIPY-labelled LDs (Extended Data Fig. 7e–i).”
From PICALM Alzheimer’s risk allele causes aberrant lipid droplets in microglia (2025) · cites this paper as [19]
The cited source says what the claim attributes to it.
In the citing paper
“given that the APOE4 allele was recently found to induce LD accumulation in MGs and impair neuronal function18,19”
From PICALM Alzheimer’s risk allele causes aberrant lipid droplets in microglia (2025) · cites this paper as [19]
The cited source says what the claim attributes to it.
In the citing paper
“Nonetheless, given that the APOE4 allele was recently found to induce LD accumulation in MGs and impair neuronal function18,19, our findings with PICALM further strengthen the notion of a causal role of LDs in mediating LOAD genetic risk factors, providing potential mechanistic targets for AD treatments.”
From PICALM Alzheimer’s risk allele causes aberrant lipid droplets in microglia (2025) · cites this paper as [19]
The cited source says what the claim attributes to it.
In the citing paper
“Human induced pluripotent stem cell-derived microglia were also shown to accumulate LDs upon Aβ exposure in an APOE-dependent manner.64”
From Amyloid-β induces lipid droplet-mediated microglial dysfunction via the enzyme DGAT2 in Alzheimer’s disease (2025) · cites this paper as [64]
The cited source says what the claim attributes to it.
In the citing paper
“APOE4 has been linked to detrimental effects on lipid droplets in AD microglia through ACSL1.73”
From Microglial APOE3 Christchurch protects neurons from Tau pathology in a human iPSC-based model of Alzheimer’s disease (2024) · cites this paper as [73]
The cited source says what the claim attributes to it.
In the citing paper
“Work both in vitro and in vivo has highlighted an APOE isoform-specific impact on lipid droplet accumulation in astrocytes146, neurons177 and microglia178.”
From Multifaceted roles of APOE in Alzheimer disease (2024) · cites this paper as [178]
The cited source says what the claim attributes to it.
In the citing paper
“Studies performed in vitro have shown that APOE genetic variation can alter cellular metabolic profiles in distinct cell types including astrocytes, microglia, and neurons [27][28][29][30] .”
From APOE4-drives brain bioenergetic shifts independent of Alzheimer’s disease pathology (2026) · cites this paper as [28]
The cited source says what the claim attributes to it.
In the citing paper
“Microglia from APOE4 mouse models, as well as human microglia from post-mortem brain tissue in AD and APOE4 carriers, exhibit lipid dysregulation and upregulation of neutral lipid storage17,27–29.”
From APOE genotypes differentially remodel the astrocytic lipid droplet proteome to shape lipid droplet dynamics (2026) · cites this paper as [17]
The cited source says what the claim attributes to it.
In the citing paper
“Altered lipid droplet biology has been linked to both brain aging and neurodegenerative diseases10–24.”
From APOE genotypes differentially remodel the astrocytic lipid droplet proteome to shape lipid droplet dynamics (2026) · cites this paper as [17]
The cited source says what the claim attributes to it.
In the citing paper
“Various studies have shown that lipid droplets influence intercellular communication13,17,61.”
From APOE genotypes differentially remodel the astrocytic lipid droplet proteome to shape lipid droplet dynamics (2026) · cites this paper as [17]
The cited source says what the claim attributes to it.
In the citing paper
“Many LOAD risk‐associated genes, such as Apolipoprotein E4 (APOE4), 9 , 10 Triggering receptor expressed on myeloid cells 2 (TREM2), 11 and Phosphatidylinositol‑binding clathrin assembly protein (PICALM), 12 have been implicated in regulating microglial immunity and lipid metabolism, 13”
From Aberrant phase separation from a rare ABI3 mutation drives microglial dysfunction and Alzheimer's risk (2026) · cites this paper as [10]
The cited source says what the claim attributes to it.
In the citing paper
“Lipid droplet containing microglia have been associated with the APOE ε4/ε4 genotype in human AD brain [129].”
From ApoE lipoproteins in the central nervous system under homeostasis and role in Alzheimer’s disease and related disorders (2026) · cites this paper as [129]
The cited source says what the claim attributes to it.
In the citing paper
“Microglia conditioned media, derived from lipid droplet containing human iPSC-derived microglia, added to iPS neurons resulted in tau phosphorylation and apoptosis [129].”
From ApoE lipoproteins in the central nervous system under homeostasis and role in Alzheimer’s disease and related disorders (2026) · cites this paper as [129]
The check wasn’t confident either way, so it gives no verdict — never disputed.
In the citing paper
“Given the reported genetic interaction between the PICALM risk-allele and APOE419,58, it will be interesting to empirically examine possible epistasis between these two AD risk factors.”
From PICALM Alzheimer’s risk allele causes aberrant lipid droplets in microglia (2025) · cites this paper as [19]
Experimental — accuracy not yet measuredThe check wasn’t confident either way, so it gives no verdict — never disputed.
In the citing paper
“Note lower PICALM expression in DAM and LDAM cell clusters.”
From PICALM Alzheimer’s risk allele causes aberrant lipid droplets in microglia (2025) · cites this paper as [19]
Experimental — accuracy not yet measured
Self-check
Percentages, sums and reported differences re-computed from the paper’s own numbers.
Each contradiction between two passages listed here was confirmed by an independent check.
Rated minor: it would not touch a result — a value no result rests on, a p-value that stays on the same side of the significance level, or a conflict that is clerical, resolved elsewhere in the paper, or outside its own findings.
In the paper
§ APOE4/4 is linked to damaging lipid droplets in Alzheimer’s disease microglia > Methods > ATAC-seq library preparation
“single-end sequenced for 100 cycles”
§ APOE4/4 is linked to damaging lipid droplets in Alzheimer’s disease microglia > Methods > ATAC-seq library preparation
“(PE100) on an Illumina NovaSeq 6000.”
Rated minor: it would not touch a result — a value no result rests on, a p-value that stays on the same side of the significance level, or a conflict that is clerical, resolved elsewhere in the paper, or outside its own findings.
In the paper
§ APOE4/4 is linked to damaging lipid droplets in Alzheimer’s disease microglia > ACSL1 and triglycerides increase after fAβ challenge
“BV2 microglia were grown with deuterated glucose (d-glucose) (Fig. 3j).”
§ APOE4/4 is linked to damaging lipid droplets in Alzheimer’s disease microglia > Methods > BV2 cell culture conditions
“replacing glucose with 10 mM d-glucose (U-13C6, Cambridge isotope laboratories CLM-1396-PK)”
Citations
Cites
Controlling the False Discovery Rate: A Practical and Powerful Approach to Multiple Testing
Benjamini, Y., & Hochberg, Y. (1995) · Journal of the Royal Statistical Society Series B: Statistical Methodology · doi:10.1111/j.2517-6161.1995.tb02031.x · Cited by 109,482 · cited 2×
“P values were corrected with Benjamini–Hochberg procedure 49 (FDR = 0.05) per comparison.”
InfluentialModerated estimation of fold change and dispersion for RNA-seq data with DESeq2
Love, M. I., Huber, W., & Anders, S. (2014) · Genome Biology · doi:10.1186/s13059-014-0550-8 · Cited by 95,106
KEGG: Kyoto Encyclopedia of Genes and Genomes
Kanehisa, M. (2000) · Nucleic Acids Research · doi:10.1093/nar/28.1.27 · Cited by 37,077
KEGG: Kyoto Encyclopedia of Genes and Genomes
Ogata, H., Goto, S., Sato, K., Fujibuchi, W., Bono, H., & Kanehisa, M. (1999) · Nucleic Acids Research · doi:10.1093/nar/27.1.29 · Cited by 31,232
Heinz, S., Benner, C., Spann, N., Bertolino, E., Lin, Y. C., Laslo, P., Cheng, J. X., Murre, C., Singh, H., & Glass, C. K. (2010) · Molecular Cell · doi:10.1016/j.molcel.2010.05.004 · Cited by 13,382 · cited 1×
“HOMER was used to convert aligned reads into ‘tag directories’ for further analysis 55 .”
Self-citationSCANPY: large-scale single-cell gene expression data analysis
Wolf, F. A., Angerer, P., & Theis, F. J. (2018) · Genome Biology · doi:10.1186/s13059-017-1382-0 · Cited by 8,881
From Louvain to Leiden: guaranteeing well-connected communities
Traag, V. A., Waltman, L., & van Eck, N. J. (2019) · Scientific Reports · doi:10.1038/s41598-019-41695-z · Cited by 5,635 · cited 1×
“We then used the batch-corrected neighbourhood graph to run Leiden clustering 46 and to calculate a global UMAP embedding with default parameters in Scanpy (v.1.9.1).”
InfluentialAutophagy regulates lipid metabolism
Singh, R., Kaushik, S., Wang, Y., Xiang, Y., Novak, I., Komatsu, M., Tanaka, K., Cuervo, A. M., & Czaja, M. J. (2009) · Nature · doi:10.1038/nature07976 · Cited by 3,975 · cited 1×
“…may indicate that GNE-317 treatment reduced LD concentrations through increasing autophagy, a mechanism which is known to regulate LD concentrations 27–29 ; however, these observations do not conclusively show increased autophagic flux after GNE-317 treatment. were then grown in complete media…”
Self-citationFinak, G., McDavid, A., Yajima, M., Deng, J., Gersuk, V., Shalek, A. K., Slichter, C. K., Miller, H. W., McElrath, M. J., Prlic, M., et al. (2015) · Genome Biology · doi:10.1186/s13059-015-0844-5 · Cited by 3,159
Alzheimer Disease Genetics Consortium (ADGC), Kunkle, B. W., The European Alzheimer’s Disease Initiative (EADI), Cohorts for Heart and Aging Research in Genomic Epidemiology Consortium (CHARGE), Genetic and Environmental Risk in AD/Defining Genetic, P. A. E. R. F. A. D. C. (., Grenier-Boley, B., Sims, R., Bis, J. C., Damotte, V., Naj, A. C., et al. (2019) · Nature Genetics · doi:10.1038/s41588-019-0358-2 · Cited by 2,946
Self-citationScrublet: computational identification of cell doublets in single-cell transcriptomic data
Wolock, S. L., Lopez, R., & Klein, A. M. (2018) · doi:10.1101/357368 · Cited by 2,758 · cited 1×
“Count data were first screened for doublets with the Scrublet (v.0.2.3) Python package 43 .”
InfluentialScrublet: computational identification of cell doublets in single-cell transcriptomic data
Wolock, S. L., Lopez, R., & Klein, A. M. (2019) · Cell Systems · doi:10.1016/j.cels.2018.11.005 · Cited by 2,758
Dynamics and functions of lipid droplets
Olzmann, J. A., & Carvalho, P. (2019) · Nature Reviews Molecular Cell Biology · doi:10.1038/s41580-018-0085-z · Cited by 2,740 · cited 1×
“21) and ACSL1 (refs.”
Single-cell transcriptomic analysis of Alzheimer’s disease
Mathys, H., Davila-Velderrain, J., Peng, Z., Gao, F., Mohammadi, S., Young, J. Z., Menon, M., He, L., Abdurrob, F., Jiang, X., et al. (2019) · Nature · doi:10.1038/s41586-019-1195-2 · Cited by 2,568 · cited 2×
“Subsampled microglia data were normalized as described previously 3,52 .”
Current best practices in single-cell RNA-seq analysis: a tutorial
Luecken, M. D., & Theis, F. J. (2019) · Molecular Systems Biology · doi:10.15252/msb.20188746 · Cited by 2,231 · cited 1×
“44.”
Marschallinger, J., Iram, T., Zardeneta, M., Lee, S. E., Lehallier, B., Haney, M. S., Pluvinage, J. V., Mathur, V., Hahn, O., Morgens, D. W., et al. (2020) · Nature Neuroscience · doi:10.1038/s41593-019-0566-1 · Cited by 1,384 · cited 3×
“6a–e and Supplementary Tables 4 and 5).”
InfluentialSelf-citationAPOE4 leads to blood–brain barrier dysfunction predicting cognitive decline
Montagne, A., Nation, D. A., Sagare, A. P., Barisano, G., Sweeney, M. D., Chakhoyan, A., Pachicano, M., Joe, E., Nelson, A. R., D’Orazio, L. M., et al. (2020) · Nature · doi:10.1038/s41586-020-2247-3 · Cited by 1,281 · cited 1×
“Whereas recent studies have focused on the role of APOE in astrocytes 31 , endothelial cells 32 , neurons 33 and oligodendrocytes 34 , the LDAM expression signature, such as ACSL1 and NAMPT upregulation, seems to be unique to microglia.”
Self-citationSenescent intimal foam cells are deleterious at all stages of atherosclerosis
Childs, B. G., Baker, D. J., Wijshake, T., Conover, C. A., Campisi, J., & van Deursen, J. M. (2016) · Science · doi:10.1126/science.aaf6659 · Cited by 1,195 · cited 1×
“Interestingly, the most enriched pathway in human LD-containing iMGs is ‘cellular senescence’, similar to lipid-laden ‘foamy macrophages’ in atherosclerosis which have a senescent phenotype and are drivers of pathology 37 .”
Heras-Sandoval, D., Pérez-Rojas, J. M., Hernández-Damián, J., & Pedraza-Chaverri, J. (2014) · Cellular Signalling · doi:10.1016/j.cellsig.2014.08.019 · Cited by 1,091
Confronting false discoveries in single-cell differential expression
Squair, J. W., Gautier, M., Kathe, C., Anderson, M. A., James, N. D., Hutson, T. H., Hudelle, R., Qaiser, T., Matson, K. J. E., Barraud, Q., et al. (2021) · doi:10.1101/2021.03.12.435024 · Cited by 1,086 · cited 1×
“We summed the raw counts per patient sample and hence derived ‘pseu-dobulk’ samples 47 from the single-cell counts.”
BBKNN: fast batch alignment of single cell transcriptomes
Polański, K., Young, M. D., Miao, Z., Meyer, K. B., Teichmann, S. A., & Park, J.-E. (2020) · Bioinformatics · doi:10.1093/bioinformatics/btz625 · Cited by 932 · cited 1×
“We then used the Python implementation of BBKNN (v.1.5.1), a fast batch correction algo-rithm suitable for large datasets to integrate data across the samples 45 .”
InfluentialNeuron-Astrocyte Metabolic Coupling Protects against Activity-Induced Fatty Acid Toxicity
Ioannou, M. S., Jackson, J., Sheu, S.-H., Chang, C.-L., Weigel, A. V., Liu, H., Pasolli, H. A., Xu, C. S., Pang, S., Matthies, D., et al. (2019) · Cell · doi:10.1016/j.cell.2019.04.001 · Cited by 760 · cited 1×
“For example, cell culture models have demonstrated that hyperactive neurons can release APOE -associated fatty acids which are taken up by astrocytes and buffer lipotoxic stress 35 .”
TREM2 regulates microglial cholesterol metabolism upon chronic phagocytic challenge
Nugent, A. A., Lin, K., van Lengerich, B., Lianoglou, S., Przybyla, L., Davis, S. S., Llapashtica, C., Wang, J., Kim, D. J., Xia, D., et al. (2020) · Neuron · doi:10.1016/j.neuron.2019.12.007 · Cited by 745
Single cell RNA sequencing of human microglia uncovers a subset associated with Alzheimer’s disease
Olah, M., Menon, V., Habib, N., Taga, M. F., Ma, Y., Yung, C. J., Cimpean, M., Khairallah, A., Coronas-Samano, G., Sankowski, R., et al. (2020) · Nature Communications · doi:10.1038/s41467-020-19737-2 · Cited by 722
The PI3K/AKT/mTOR interactive pathway
Ersahin, T., Tuncbag, N., & Cetin-Atalay, R. (2015) · Molecular BioSystems · doi:10.1039/c5mb00101c · Cited by 683 · cited 1×
“One strategy to clear LD accumulation in microglia, which we present here, is PI3K inhibition, shown to increase autophagy 38 .”
Efficient derivation of microglia-like cells from human pluripotent stem cells
Muffat, J., Li, Y., Yuan, B., Mitalipova, M., Omer, A., Corcoran, S., Bakiasi, G., Tsai, L.-H., Aubourg, P., Ransohoff, R. M., et al. (2016) · Nature Medicine · doi:10.1038/nm.4189 · Cited by 651 · cited 2×
“Differentiation into microglia was performed as previously described 17–19 .”
Single-nucleus chromatin accessibility and transcriptomic characterization of Alzheimer’s disease
Morabito, S., Miyoshi, E., Michael, N., Shahin, S., Martini, A. C., Head, E., Silva, J., Leavy, K., Perez-Rosendahl, M., & Swarup, V. (2021) · Nature Genetics · doi:10.1038/s41588-021-00894-z · Cited by 643 · cited 1×
“This epigenetic signature is also seen in macrophages in atherosclerosis models 23 and adipose-associated macrophages 24 but this signature is not seen in DAM microglia 25 .”
Age-related myelin degradation burdens the clearance function of microglia during aging
Safaiyan, S., Kannaiyan, N., Snaidero, N., Brioschi, S., Biber, K., Yona, S., Edinger, A. L., Jung, S., Rossner, M. J., & Simons, M. (2016) · Nature Neuroscience · doi:10.1038/nn.4325 · Cited by 604 · cited 1×
“Cholesterol-rich lysosomes and LDs in dysfunctional microglia have also been observed in the context of demyelination mouse models and human iPS cell models 9–12 .”
Defective cholesterol clearance limits remyelination in the aged central nervous system
Cantuti-Castelvetri, L., Fitzner, D., Bosch-Queralt, M., Weil, M.-T., Su, M., Sen, P., Ruhwedel, T., Mitkovski, M., Trendelenburg, G., Lütjohann, D., et al. (2018) · Science · doi:10.1126/science.aan4183 · Cited by 586
Neurotoxic reactive astrocytes induce cell death via saturated lipids
Guttenplan, K. A., Weigel, M. K., Prakash, P., Wijewardhane, P. R., Hasel, P., Rufen-Blanchette, U., Münch, A. E., Blum, J. A., Fine, J., Neal, M. C., et al. (2021) · Nature · doi:10.1038/s41586-021-03960-y · Cited by 578
Genome-wide CRISPR Screens in Primary Human T Cells Reveal Key Regulators of Immune Function
Shifrut, E., Carnevale, J., Tobin, V., Roth, T. L., Woo, J. M., Bui, C. T., Li, P. J., Diolaiti, M. E., Ashworth, A., & Marson, A. (2018) · Cell · doi:10.1016/j.cell.2018.10.024 · Cited by 573
APOE4 impairs myelination via cholesterol dysregulation in oligodendrocytes
Blanchard, J. W., Akay, L. A., Davila-Velderrain, J., von Maydell, D., Mathys, H., Davidson, S. M., Effenberger, A., Chen, C.-Y., Maner-Smith, K., Hajjar, I., et al. (2022) · Nature · doi:10.1038/s41586-022-05439-w · Cited by 496 · cited 1×
“Whereas recent studies have focused on the role of APOE in astrocytes 31 , endothelial cells 32 , neurons 33 and oligodendrocytes 34 , the LDAM expression signature, such as ACSL1 and NAMPT upregulation, seems to be unique to microglia.”
Mammalian lipid droplets are innate immune hubs integrating cell metabolism and host defense
Bosch, M., Sánchez-Álvarez, M., Fajardo, A., Kapetanovic, R., Steiner, B., Dutra, F., Moreira, L., López, J. A., Campo, R., Marí, M., et al. (2020) · Science · doi:10.1126/science.aay8085 · Cited by 480 · cited 3×
“LDs themselves have anti-microbial properties and are an evolutionarily conserved form of innate immune defence in macrophages 8 .”
InfluentialWang, C., Najm, R., Xu, Q., Jeong, D.-E., Walker, D., Balestra, M. E., Yoon, S. Y., Yuan, H., Li, G., Miller, Z. A., et al. (2018) · Nature Medicine · doi:10.1038/s41591-018-0004-z · Cited by 428 · cited 3×
“Human induced pluripotent stem (hiPS) cells were derived into neurons as previously described 16 , with slight modifications to increase yield.”
Self-citationDistinct macrophage populations direct inflammatory versus physiological changes in adipose tissue
Hill, D. A., Lim, H.-W., Kim, Y. H., Ho, W. Y., Foong, Y. H., Nelson, V. L., Nguyen, H. C. B., Chegireddy, K., Kim, J., Habertheuer, A., et al. (2018) · Proceedings of the National Academy of Sciences · doi:10.1073/pnas.1802611115 · Cited by 415 · cited 1×
“This epigenetic signature is also seen in macrophages in atherosclerosis models 23 and adipose-associated macrophages 24 but this signature is not seen in DAM microglia 25 .”
Cholesterol and matrisome pathways dysregulated in astrocytes and microglia
TCW, J., Qian, L., Pipalia, N. H., Chao, M. J., Liang, S. A., Shi, Y., Jain, B. R., Bertelsen, S. E., Kapoor, M., Marcora, E., et al. (2022) · Cell · doi:10.1016/j.cell.2022.05.017 · Cited by 411 · cited 1×
“Cholesterol-rich lysosomes and LDs in dysfunctional microglia have also been observed in the context of demyelination mouse models and human iPS cell models 9–12 .”
Differentiation of human and murine induced pluripotent stem cells to microglia-like cells
Pandya, H., Shen, M. J., Ichikawa, D. M., Sedlock, A. B., Choi, Y., Johnson, K. R., Kim, G., Brown, M. A., Elkahloun, A. G., Maric, D., et al. (2017) · Nature Neuroscience · doi:10.1038/nn.4534 · Cited by 405
Preparing Synthetic Aβ in Different Aggregation States
Stine, W. B., Jungbauer, L., Yu, C., & LaDu, M. J. (2010) · Methods in Molecular Biology · doi:10.1007/978-1-60761-744-0_2 · Cited by 403
Systematic comparison of CRISPR/Cas9 and RNAi screens for essential genes
Morgens, D. W., Deans, R. M., Li, A., & Bassik, M. C. (2016) · Nature Biotechnology · doi:10.1038/nbt.3567 · Cited by 398
Development of a Chimeric Model to Study and Manipulate Human Microglia In Vivo
Hasselmann, J., Coburn, M. A., England, W., Figueroa Velez, D. X., Kiani Shabestari, S., Tu, C. H., McQuade, A., Kolahdouzan, M., Echeverria, K., Claes, C., et al. (2019) · Neuron · doi:10.1016/j.neuron.2019.07.002 · Cited by 380 · cited 1×
“A previously published dataset shows that ACSL1 is highly upregulated by the innate immune trigger lipopolysaccharides (LPS) in an independent human iMG chimaeric mouse model 22 (Extended Data Fig.”
Self-citationAPOE4 disrupts intracellular lipid homeostasis in human iPSC-derived glia
Sienski, G., Narayan, P., Bonner, J. M., Kory, N., Boland, S., Arczewska, A. A., Ralvenius, W. T., Akay, L., Lockshin, E., He, L., et al. (2021) · Science Translational Medicine · doi:10.1126/scitranslmed.aaz4564 · Cited by 336 · cited 1×
“Live cell microscopy of iMG with a fluorescent dye for neutral lipids (LipidSpot) showed greater LD accumulation in APOE4/4 iMG compared with isogenic APOE3/3 iMG, similar to recent reports in isogenic iMG 4 and astrocytes 20 .”
Wang, C., Xiong, M., Gratuze, M., Bao, X., Shi, Y., Andhey, P. S., Manis, M., Schroeder, C., Yin, Z., Madore, C., et al. (2021) · Neuron · doi:10.1016/j.neuron.2021.03.024 · Cited by 334 · cited 1×
“Whereas recent studies have focused on the role of APOE in astrocytes 31 , endothelial cells 32 , neurons 33 and oligodendrocytes 34 , the LDAM expression signature, such as ACSL1 and NAMPT upregulation, seems to be unique to microglia.”
Self-citationLipid accumulation induced by APOE4 impairs microglial surveillance of neuronal-network activity
Victor, M. B., Leary, N., Luna, X., Meharena, H. S., Scannail, A. N., Bozzelli, P. L., Samaan, G., Murdock, M. H., von Maydell, D., Effenberger, A. H., et al. (2022) · Cell Stem Cell · doi:10.1016/j.stem.2022.07.005 · Cited by 316
Zhou, H., Liu, J., Zhou, C., Gao, N., Rao, Z., Li, H., Hu, X., Li, C., Yao, X., Shen, X., et al. (2018) · Nature Neuroscience · doi:10.1038/s41593-017-0060-6 · Cited by 276 · cited 1×
“…indicate that GNE-317 treatment reduced LD concentrations through increasing autophagy, a mechanism which is known to regulate LD concentrations 27–29 ; however, these observations do not conclusively show increased autophagic flux after GNE-317 treatment. were then grown in complete media…”
Lee, J.-W., Nam, H., Kim, L. E., Jeon, Y., Min, H., Ha, S., Lee, Y., Kim, S.-Y., Lee, S. J., Kim, E.-K., et al. (2019) · Autophagy · doi:10.1080/15548627.2018.1556946 · Cited by 260 · cited 1×
“of innate immune receptors such as TLR4 in microglia suppresses autophagy 39 and this mechanism has been shown to increase LD concentrations in microglia 40 .”
Andreone, B. J., Przybyla, L., Llapashtica, C., Rana, A., Davis, S. S., van Lengerich, B., Lin, K., Shi, J., Mei, Y., Astarita, G., et al. (2020) · Nature Neuroscience · doi:10.1038/s41593-020-0650-6 · Cited by 233 · cited 2×
“Differentiation into microglia was performed as previously described 17–19 .”
Claes, C., Danhash, E. P., Hasselmann, J., Chadarevian, J. P., Shabestari, S. K., England, W. E., Lim, T. E., Hidalgo, J. L. S., Spitale, R. C., Davtyan, H., et al. (2021) · Molecular Neurodegeneration · doi:10.1186/s13024-021-00473-0 · Cited by 197
Identification of phagocytosis regulators using magnetic genome-wide CRISPR screens
Haney, M. S., Bohlen, C. J., Morgens, D. W., Ousey, J. A., Barkal, A. A., Tsui, C. K., Ego, B. K., Levin, R., Kamber, R. A., Collins, H., et al. (2018) · Nature Genetics · doi:10.1038/s41588-018-0254-1 · Cited by 193
Self-citationZalocusky, K. A., Najm, R., Taubes, A. L., Hao, Y., Yoon, S. Y., Koutsodendris, N., Nelson, M. R., Rao, A., Bennett, D. A., Bant, J., et al. (2021) · Nature Neuroscience · doi:10.1038/s41593-021-00851-3 · Cited by 189 · cited 1×
“Whereas recent studies have focused on the role of APOE in astrocytes 31 , endothelial cells 32 , neurons 33 and oligodendrocytes 34 , the LDAM expression signature, such as ACSL1 and NAMPT upregulation, seems to be unique to microglia.”
Self-citationXu, Y., Propson, N. E., Du, S., Xiong, W., & Zheng, H. (2021) · Proceedings of the National Academy of Sciences · doi:10.1073/pnas.2023418118 · Cited by 171 · cited 1×
“of innate immune receptors such as TLR4 in microglia suppresses autophagy 39 and this mechanism has been shown to increase LD concentrations in microglia 40 .”
CLN3 is required for the clearance of glycerophosphodiesters from lysosomes
Laqtom, N. N., Dong, W., Medoh, U. N., Cangelosi, A. L., Dharamdasani, V., Chan, S. H., Kunchok, T., Lewis, C. A., Heinze, I., Tang, R., et al. (2022) · Nature · doi:10.1038/s41586-022-05221-y · Cited by 144
Self-citationToll-like Receptor Agonists Promote Prolonged Triglyceride Storage in Macrophages
Huang, Y.-L., Morales-Rosado, J., Ray, J., Myers, T. G., Kho, T., Lu, M., & Munford, R. S. (2014) · Journal of Biological Chemistry · doi:10.1074/jbc.m113.524587 · Cited by 133 · cited 1×
“LDs form in myeloid cells through the upregulation of lipid-synthesis enzymes triggered by the engagement of toll receptors by innate immune triggers, such as bacteria 7 .”
Self-citationLi, L. O., Mashek, D. G., An, J., Doughman, S. D., Newgard, C. B., & Coleman, R. A. (2006) · Journal of Biological Chemistry · doi:10.1074/jbc.m604427200 · Cited by 123 · cited 2×
“is sufficient to induce triglyceride-specific LD formation in several cell types 13,14 (Fig.”
Scheiblich, H., Bousset, L., Schwartz, S., Griep, A., Latz, E., Melki, R., & Heneka, M. T. (2021) · The Journal of Immunology · doi:10.4049/jimmunol.2100035 · Cited by 122
Isolation and Culture of Microglia
Bohlen, C. J., Bennett, F. C., & Bennett, M. L. (2018) · Current Protocols in Immunology · doi:10.1002/cpim.70 · Cited by 118
Taubes, A., Nova, P., Zalocusky, K. A., Kosti, I., Bicak, M., Zilberter, M. Y., Hao, Y., Yoon, S. Y., Oskotsky, T., Pineda, S., et al. (2021) · Nature Aging · doi:10.1038/s43587-021-00122-7 · Cited by 118 · cited 1×
“Mirroring these observations in the human AD tissue, there are more LD + microglia in the J20/ APOE3 and J20/ APOE4 models of AD 15 compared to age-matched wild-type mice (Fig.”
Self-citationPacheco, P., Vieira-de-Abreu, A., Gomes, R. N., Barbosa-Lima, G., Wermelinger, L. B., Maya-Monteiro, C. M., Silva, A. R., Bozza, M. T., Castro-Faria-Neto, H. C., Bandeira-Melo, C., et al. (2007) · The Journal of Immunology · doi:10.4049/jimmunol.179.12.8500 · Cited by 103
Golgi-IP, a tool for multimodal analysis of Golgi molecular content
Fasimoye, R. Y., Dong, W., Nirujogi, R. S., Rawat, E. S., Iguchi, M., Nyame, K., Phung, T. K., Bagnoli, E., Prescott, A. R., Alessi, D. R., et al. (2023) · Proceedings of the National Academy of Sciences · doi:10.1073/pnas.2219953120 · Cited by 77
Self-citationZhao, Z., Abbas Raza, S. H., Tian, H., Shi, B., Luo, Y., Wang, J., Liu, X., Li, S., Bai, Y., & Hu, J. (2020) · Archives of Biochemistry and Biophysics · doi:10.1016/j.abb.2020.108648 · Cited by 48 · cited 2×
“is sufficient to induce triglyceride-specific LD formation in several cell types 13,14 (Fig.”
Deficient Chaperone-Mediated Autophagy Promotes Lipid Accumulation in Macrophage
Qiao, L., Wang, H.-F., Xiang, L., Ma, J., Zhu, Q., Xu, D., Zheng, H., Peng, J.-Q., Zhang, S., Lu, H.-X., et al. (2021) · Journal of Cardiovascular Translational Research · doi:10.1007/s12265-020-09986-3 · Cited by 45
Olah, M., Menon, V., Habib, N., Taga, M. F., Ma, Y., Khairallah, A., Yung, C. J., Coronas‐Samano, G., Vonsattel, J. P., Teich, A. F., et al. (2020) · Alzheimer s & Dementia · doi:10.1002/alz.038589 · Cited by 30
Xiong, X., Yan, Z., Jiang, W., & Jiang, X. (2022) · International Journal of Immunopathology and Pharmacology · doi:10.1177/20587384221076472 · Cited by 10 · cited 1×
“This epigenetic signature is also seen in macrophages in atherosclerosis models 23 and adipose-associated macrophages 24 but this signature is not seen in DAM microglia 25 .”
Lin, G., Zhang, L., Yan, Z., et al. (2022) · International Journal of Immunopathology and Pharmacology · doi:10.1177/03946320221117933 · Cited by 5
Research works printed but not linked: 1
- Palovics, R., Wyss-Coray, T. & Mirzasoleiman, B. Purification of single-cell transcriptomics data with coreset selection. In The 2022 ICML Workshop on Computational Biology Paper 67 (ICML, 2022).
Cited by
Sorted by citations
Neuroinflammation in Alzheimer disease
Heneka, M. T., van der Flier, W. M., Jessen, F., Hoozemanns, J., Thal, D. R., Boche, D., Brosseron, F., Teunissen, C., Zetterberg, H., Jacobs, A. H., et al. (2025) · Nature Reviews Immunology · doi:10.1038/s41577-024-01104-7 · Cited by 638
“Phosphatidylinositol-binding clathrin assembly protein (PICALM) and homozygosity for the APOEε4 allele are also linked to microglial lipid droplet formation in AD 282,283 and raised total cholesterol levels 284 that, in turn, cause problems in neurons 285 .”
Self-citationAlzheimer’s disease: insights into pathology, molecular mechanisms, and therapy
Zheng, Q., & Wang, X. (2024) · Protein & Cell · doi:10.1093/procel/pwae026 · Cited by 483
Integrated multimodal cell atlas of Alzheimer’s disease
Gabitto, M. I., Travaglini, K. J., Rachleff, V. M., Kaplan, E. S., Long, B., Ariza, J., Ding, Y., Mahoney, J. T., Dee, N., Goldy, J., et al. (2024) · Nature Neuroscience · doi:10.1038/s41593-024-01774-5 · Cited by 397
Updates in Alzheimer's disease: from basic research to diagnosis and therapies
Liu, E., Zhang, Y., & Wang, J. (2024) · Translational Neurodegeneration · doi:10.1186/s40035-024-00432-x · Cited by 241
“Lipid accumulation induced by APOE4 impairs microglial surveillance of neuronal-net-work activity [76], and Aβ induces lipid droplet accumulation, tau phosphorylation and neurotoxicity in an APOE4-dependent manner [77].”
BackgroundMultifaceted roles of APOE in Alzheimer disease
Jackson, R. J., Hyman, B. T., & Serrano-Pozo, A. (2024) · Nature Reviews Neurology · doi:10.1038/s41582-024-00988-2 · Cited by 193
“Work both in vitro and in vivo has highlighted an APOE isoform-specific impact on lipid droplet accumulation in astrocytes 146 , neurons 177 and microglia 178 .”
Metadata
- Authors
- Haney, M. S., Pálovics, R., Munson, C. N., Long, C., Johansson, P. K., Yip, O., Dong, W., Rawat, E., West, E., Schlachetzki, J. C. M., Tsai, A., Guldner, I. H., Lamichhane, B. S., Smith, A., Schaum, N., Calcuttawala, K., Shin, A., Wang, Y.-H., Wang, C., Koutsodendris, N., Serrano, G. E., Beach, T. G., Reiman, E. M., Glass, C. K., Abu-Remaileh, M., Enejder, A., Huang, Y., & Wyss-Coray, T.
- Affiliations
- Stanford Medicine (US)
- Gladstone Institutes (US)
- Stanford University (US)
- University of California San Diego (US)
- Banner Sun Health Research Institute (US)
- Banner Alzheimer’s Institute
- University of California, San Francisco (US)
- ORCID
- Haney, Michael S.
- Pálovics, Róbert
- Munson, Christy Nicole
- Long, Chris
- Johansson, Patrik K.
- Yip, Oscar
- Dong, Wentao
- Rawat, Eshaan
- Schlachetzki, Johannes C. M.
- Tsai, Andy
- Guldner, Ian Hunter
- Lamichhane, Bhawika S.
- Shin, Andrew
- Wang, Yung-Hua
- Wang, Chengzhong
- Koutsodendris, Nicole
- Serrano, Geidy E.
- Beach, Thomas G.
- Reiman, Eric M.
- Glass, Christopher K.
- Abu-Remaileh, Monther
- Enejder, Annika
- Huang, Yadong
- Wyss-Coray, Tony
- Venue
- Nature
- Published
- 2024-03-13
- Volume
- 628
- Issue
- 8006
- Pages
- 154-161
- ISSN
- 0028-0836 (ISSN-L)
- 1476-4687
- PMC
- PMC10990924
- OpenAlex
- W4392762752
- Semantic Scholar
- 403a5aefdc0c66f64029809243f84878c8677bae
- Cited by
- 536
- References
- 61
- Citations by year
- 2026: 204 · 2025: 236 · 2024: 94
- FWCI
- 125.62
- Type
- journal article
- Language
- en
- Open access
- hybrid
- doi.org
- Locations
- Nature (publishedVersion, cc-by)
- PubMed (publishedVersion)
- PubMed Central (submittedVersion, cc-by)
- RePEc: Research Papers in Economics (submittedVersion)
- eScholarship (California Digital Library) (submittedVersion, cc-by)
- Funders
- Pew Charitable Trusts
- Alzheimer's Association
- Alexander and Margaret Stewart Trust
- Arizona Department of Health Services (P30 AG19610, U24 NS072026, 05-901, 211002)
- Arizona Biomedical Research Commission (P30 AG19610, 05–901, U24 NS072026, 211002)
- National Institute on Aging (RF1AG064928, P30AG019610, R03AG071791, P30AG062429, P30AG059307, P30AG072980, P30AG066515, R01AG069453, P01AG073082, T32AG000266)
- National Institute of Neurological Disorders and Stroke (U24NS072026)
- Topics
- Life Sciences › Neuroscience › Cellular and Molecular Neuroscience › Alzheimer's disease research and treatments
- Life Sciences › Neuroscience › Neurology › Neuroinflammation and Neurodegeneration Mechanisms
- Life Sciences › Biochemistry, Genetics and Molecular Biology › Biochemistry › Lipid metabolism and biosynthesis
- Keywords
- Alzheimer's disease, APOE ε4, microglia, lipid droplets, ACSL1, lipid metabolism, amyloid-beta, triglyceride synthesis, tau phosphorylation, neurotoxicity, single-nucleus RNA sequencing, induced pluripotent stem cell-derived microglia, genetic risk factors
- MeSH terms
- Alzheimer Disease, Animals, Coenzyme A Ligases, Female, Humans, Male, Phosphorylation, Triglycerides, Amyloid beta-Peptides, tau Proteins, Culture Media, Conditioned, Microglia, Genetic Predisposition to Disease, Mice, Apolipoprotein E4, Induced Pluripotent Stem Cells, Lipid Droplets
About these checks
Registry, retraction, Cites and statistics results are computed, not judged, with one exception: a printed reference that no index lists is read once by a model before it counts as a citation error. Claims are extracted by a model and kept only when their quote appears verbatim in the text; each cited source is then checked, with a model’s help, for whether it says what the claim relies on. Those verdicts can be wrong — read the claim’s quote and the cited source before relying on one.
A language model drew the claims from the paper on 2026-10-16, under version 3 of the claim definition (model deepseek-v4.1-flash, prompt extract-v3).
A second model labelled each claim on 2026-10-16 (model jev-1.13-20260917, definition revision gold-guideline-v0.2).
Cited sources are checked with a language model’s help (gpt-6-sol).
Statistics and arithmetic are recomputed, not judged.
Confidence bands are shown only for fields calibrated on our annotated test set. None is calibrated yet, so no band is shown.
What counts as a claim ›How we measure confidence ›How we check this ›
Are you an author, or do you see a problem with this page? Request a review
