

The DOI matches its Crossref record; 91 of the 91 references it cites were found in a registry or an index; 30 of the 47 sources its claims cite were checked for support.
Single-cell multi-omics identifies chronic inflammation as a driver of TP53-mutant leukemic evolution
Open accessAbstract
Understanding the genetic and nongenetic determinants of tumor protein 53 ( TP53 ) - mutation-driven clonal evolution and subsequent transformation is a crucial step toward the design of rational therapeutic strategies. Here we carry out allelic resolution single-cell multi-omic analysis of hematopoietic stem/progenitor cells (HSPCs) from patients with a myeloproliferative neoplasm who transform to TP53- mutant secondary acute myeloid leukemia (sAML). All patients showed dominant TP53 ‘multihit’ HSPC clones at transformation, with a leukemia stem cell transcriptional signature strongly predictive of adverse outcomes in independent cohorts, across both TP53- mutant and wild-type (WT) AML. Through analysis of serial samples, antecedent TP53 -heterozygous clones and in vivo perturbations, we demonstrate a hitherto unrecognized effect of chronic inflammation, which suppressed TP53 WT HSPCs while enhancing the fitness advantage of TP53- mutant cells and promoted genetic evolution. Our findings will facilitate the development of risk-stratification, early detection and treatment strategies for TP53 -mutant leukemia, and are of broad relevance to other cancer types.
Overview
AI snapshot
Written from the paper’s full text.
TL;DR
In TP53-mutant secondary AML arising from myeloproliferative neoplasms, allelic-resolution single-cell multi-omics identifies dominant TP53 multihit HSPC clones with complex copy-number alterations and a leukemia stem cell transcriptional signature that predicts adverse AML outcomes. Chronic inflammation suppresses TP53-WT pre-LSCs while enhancing the fitness and genetic evolution of TP53-mutant cells.
Key findings
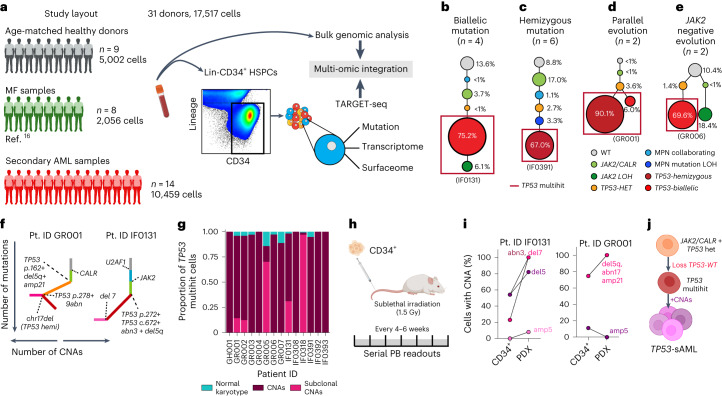
- Across 33 TP53-sAML patients, TP53-sAML showed complex genetic heterogeneity: multiple TP53 mutations in 11/33 patients, high VAF >50% in 82% (18/22) of single-TP53-mutation cases, CNAs in all analyzed patients, complex karyotype in 87% (20/23), and TP53 locus deletion/copy-neutral LOH in 43% (10/23).
- TARGET-seq of 17,517 Lin−CD34+ HSPCs from 14 TP53-sAML patients, 9 healthy donors, and 8 MF patients showed dominant TP53 multihit clones in all cases, with four clonal-evolution patterns; TP53 multihit clones were enriched in progenitors and nearly all carried at least one clonally dominant CNA (only 3.4 ± 1.2% TP53-mutant cells lacked CNA evidence).
- A 44-gene p53LSC signature derived from single-cell transcriptomes predicted poor survival in independent BeatAML and TCGA cohorts irrespective of TP53 mutational status; TP53-mutant AML also showed erythroid-biased transcription with increased GATA1 and reduced CEBPA/GATA1 ratio.
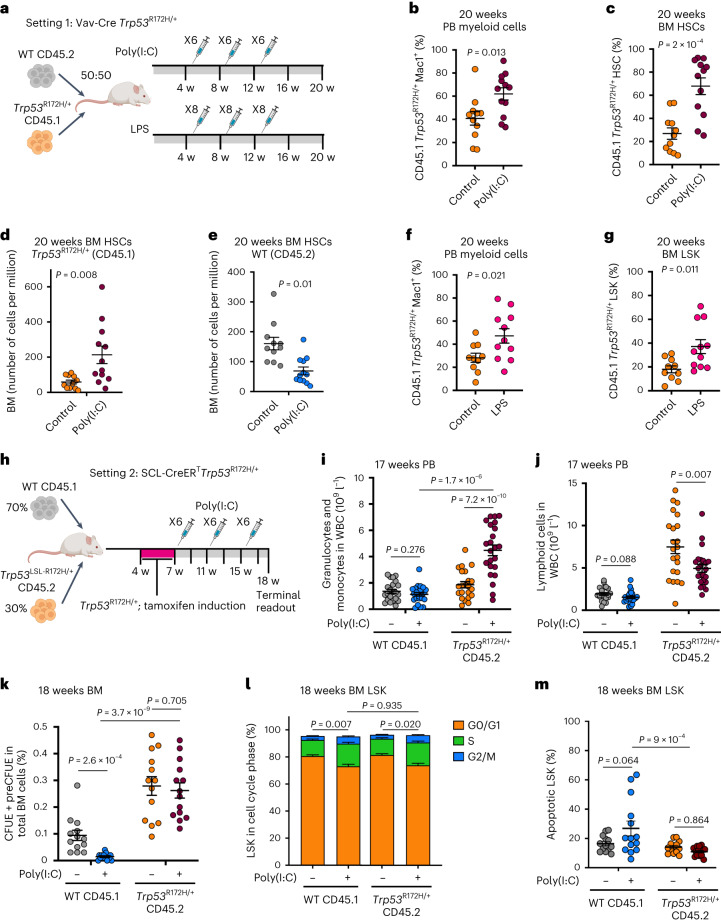
- In serial CP-MPN/pre-TP53-sAML samples, TP53-heterozygous HSPCs from pre-TP53-sAML (n = 296) versus CP TP53-MPN (n = 273) showed inflammatory pathway changes; in mouse chimeras, poly(I:C) or LPS promoted Trp53-mutant myeloid/HSC/LSK expansion, reduced WT competitors, and increased karyotypic abnormalities in Trp53-mutant LSKs.
Methods
- Allelic-resolution TARGET-seq was used for simultaneous single-cell genotyping, whole-transcriptome profiling, and immunophenotypic index sorting of Lin−CD34+ HSPCs, alongside bulk targeted NGS and SNP arrays; samples included 33 TP53-sAML patients, 14 TP53-sAML patients for single-cell analysis, 9 age-matched HDs, 8 MF patients, and CP-MPN/pre-TP53-sAML cohorts.
- Functional validation used patient-derived xenografts, LTC-IC and short-term cultures, TP53 knockdown in JAK2V617F MPN CD34+ cells, and mouse bone marrow chimeras with Vav-iCre Trp53R172H/+ or SCL-CreERT Trp53R172H/+ cells treated with poly(I:C) or LPS.
- Computational analysis included SCITE clonal hierarchy reconstruction, inferCNV CNA inference, Monocle3/scVelo trajectory analysis, GSEA, differential expression, and lasso Cox survival modeling in BeatAML and TCGA bulk expression cohorts.
Limitations
- Stated by the authors: because CNAs were universally present and inextricably linked with TP53 multihit status, the study cannot disentangle the impact of TP53 multihit mutation versus patient-specific CNAs.
- Stated by the authors: the data do not distinguish whether the erythroid lineage switch is primarily an instructive versus permissive effect of TP53 mutation, and further studies are required to characterize the key inflammatory mediators and molecular mechanisms, which are unlikely to be restricted to a single axis.
- Evident from the text: some functional and validation experiments rely on small numbers, including PDX models (n = 1 for IF0131; n = 3 for GR001), pre-LSC functional assays from 3 TP53-sAML patients, and CP/pre-TP53-sAML TARGET-seq cohorts of 4–5 patients per group.
Model-written summary. Check it against the paper before relying on it.
Integrity signals
Registry
Cites
Statistics
Figures
Verification
Claims the paper makes
53 Own result · 18 Own method · 13 Own interpretation · 9 No full text of the sources · 8 Partly supported · 7 Supported · 4 Supported so far · 4 Couldn’t confirm · accuracy not yet measured
The cited sources that could be checked couldn’t confirm or dispute this claim.
In the paper
“HSPCs WT for all mutations analyzed were present in 10 of 14 patients (Extended Data Fig. 2b–o), providing a valuable population of cells for intrapatient comparison with mutation-positive cells17.”
§ Single-cell multi-omics identifies chronic inflammation as a driver of TP53-mutant leukemic evolution > Results > Convergent clonal evolution in TP53 leukemic transformation
What the sources say
- Could not verifycites [17] Giustacchini, A. et al. Single-cell transcriptomics uncovers distinct molecular signatures of stem cells in chronic myeloid leukemia. Nat. Med. 23, 692–702 (2017). sourceExperimental — accuracy not yet measured
The supplied passages are an IRIS repository page, with no results section or page number from the paper. Searches for the 10-of-14 wild-type HSPC finding and TP53-sAML returned only repository text, so our indexed copy does not establish the claim. (LLM, conf=0.75)
plainn = 14- Asserted: passes — The authors put it forward as true.
- Checkable: passes — It can be checked against evidence.
- Load-bearing: passes — The paper’s conclusions depend on it.
- Based: passes — The paper gives a reason why it holds.
- Could not verify
Every source the paper cites for this claim was checked and supports it.
In the paper
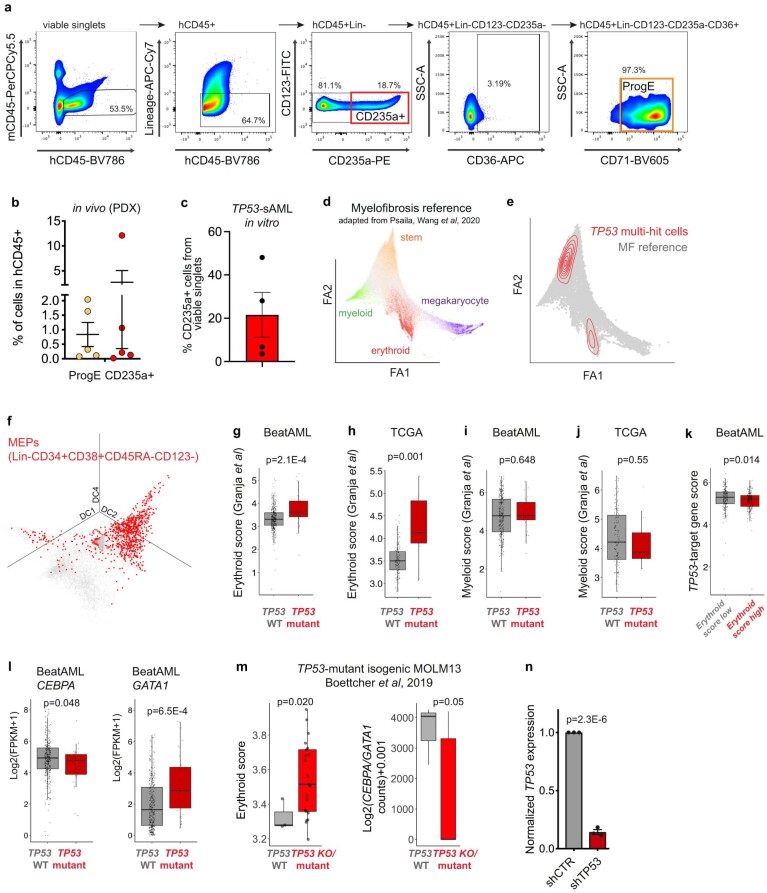
“Similar findings were observed in TP53 knock-out or mutant isogenic MOLM13 cell lines (Extended Data Fig. 5m)28.”
§ Single-cell multi-omics identifies chronic inflammation as a driver of TP53-mutant leukemic evolution > Results > Molecular signatures of TP53-mutant-mediated transformation
What the sources say
- Supportedcites [28] Boettcher, S. et al. A dominant-negative effect drives selection of TP53 missense mutations in myeloid malignancies. Science 365, 599–604 (2019). source
The source describes isogenic MOLM13 cell lines carrying TP53 missense or null alleles. It reports that these cells showed similar resistance to daunorubicin-induced apoptosis and chemotherapy (passages 2–3; page not provided). Extended Data Fig. 5m belongs to the citing paper, so it is not needed to verify this citation. (LLM, conf=0.88)
plain- Asserted: passes — The authors put it forward as true.
- Checkable: passes — It can be checked against evidence.
- Load-bearing: passes — The paper’s conclusions depend on it.
- Based: passes — The paper gives a reason why it holds.
- Supported
Every source the paper cites for this claim was checked and supports it.
In the paper
“as reported for bromodomain inhibitors, which, when combined with JAK2 inhibition, markedly reduce the serum levels of inflammatory cytokines51.”
§ Single-cell multi-omics identifies chronic inflammation as a driver of TP53-mutant leukemic evolution > Discussion
What the sources say
- Supportedcites [51] Kleppe, M. et al. Dual targeting of oncogenic activation and inflammatory signaling increases therapeutic efficacy in myeloproliferative neoplasms. Cancer Cell 33, 29–43 (2018). source
The Abstract states that combined JAK/BET inhibition markedly reduced serum levels of inflammatory cytokines in vivo. The Results section on JAK-inhibitor persistence also reports significantly lower serum pro-inflammatory cytokine levels in mice receiving combination therapy than in vehicle- or ruxolitinib-treated mice. (LLM, conf=0.94)
plaindirect- Asserted: passes — The authors put it forward as true.
- Checkable: passes — It can be checked against evidence.
- Load-bearing: unclear — It is unclear whether the paper’s conclusions depend on it.
- Based: passes — The paper gives a reason why it holds.
- Supported
Every source the paper cites for this claim was checked and supports it.
In the paper
“loss of the Trp53-WT allele confers an additional fitness advantage to Trp53-mutant HSPC following DNA damage as previously described28”
§ Single-cell multi-omics identifies chronic inflammation as a driver of TP53-mutant leukemic evolution > Discussion
What the sources say
- Supportedcites [28] Boettcher, S. et al. A dominant-negative effect drives selection of TP53 missense mutations in myeloid malignancies. Science 365, 599–604 (2019). source
In the passage discussing Figure 4 (section labelled Abstract; page unavailable), the paper reports that missense-mutant HSPCs retaining a wild-type Trp53 allele had a competitive disadvantage relative to Trp53-null HSPCs after DNA damage. It attributes this to residual wild-type p53 activity and describes selective pressure to inactivate the remaining wild-type allele, supporting the claimed additional fitness advantage. (LLM, conf=0.88)
plaindirect- Asserted: passes — The authors put it forward as true.
- Checkable: passes — It can be checked against evidence.
- Load-bearing: unclear — It is unclear whether the paper’s conclusions depend on it.
- Based: passes — The paper gives a reason why it holds.
- Supported
The cited sources support only part of this claim — read each source’s verdict below.
In the paper
“Treatment of chimeric mice with LPS (Fig. 5a), which induces an inflammatory response mediated through the release of IL1β and IL6 (ref. 37), among others, led to a similar increase in the number of Trp53-mutant PB myeloid cells and LSKs (Fig. 5f,g).”
§ Single-cell multi-omics identifies chronic inflammation as a driver of TP53-mutant leukemic evolution > Results > Inflammation promotes TP53-associated clonal dominance
What the sources say
- Partly supportedcites [37] Ngkelo, A., Meja, K., Yeadon, M., Adcock, I. & Kirkham, P. A. LPS induced inflammatory responses in human peripheral blood mononuclear cells is mediated through NOX4 and Giα dependent PI-3kinase signalling. J. Inflamm. 9, 1 (2012). sourceExperimental — accuracy not yet measured
The citation is attached to the explanation that LPS induces inflammation through IL-1β and IL-6 release, not to the citing authors’ finding about Trp53-mutant cells. The Results and Discussion report LPS-induced IL-6 release from human PBMCs, but not IL-1β release; the Introduction says only that LPS mimics some effects of IL-1β. No page numbers are available in our copy. (LLM, conf=0.88)
plaindirect- Asserted: passes — The authors put it forward as true.
- Checkable: passes — It can be checked against evidence.
- Load-bearing: passes — The paper’s conclusions depend on it.
- Based: passes — The paper gives a reason why it holds.
- Partly supported
The cited sources support only part of this claim — read each source’s verdict below.
In the paper
“Despite the known dominant negative and/or gain of function effect of certain TP53 mutations28,42, loss of the TP53-WT allele, a genetic event associated with a particularly dismal prognosis2, confers an additional fitness advantage to TP53-sAML LSCs.”
§ Single-cell multi-omics identifies chronic inflammation as a driver of TP53-mutant leukemic evolution > Discussion
What the sources say
- Partly supportedcites [28] Boettcher, S. et al. A dominant-negative effect drives selection of TP53 missense mutations in myeloid malignancies. Science 365, 599–604 (2019). sourceExperimental — accuracy not yet measured
In the passage discussing mouse hematopoietic stem and progenitor cells (section labeled Abstract; page unavailable), cells with a TP53 missense mutation and no wild-type allele outcompeted cells retaining a wild-type allele after DNA damage. That supports an additional fitness advantage in that experimental setting, but the paper does not establish it for TP53-sAML leukemia stem cells. In the citing sentence, the citation is attached to the earlier statement about mutation effects, not directly to the LSC conclusion. (LLM, conf=0.88)
- Partly supportedcites [42] Loizou, E. et al. A gain-of-function p53-mutant oncogene promotes cell fate plasticity and myeloid leukemia through the pluripotency factor FOXH1. Cancer Discov. 9, 962–979 (2019). sourceExperimental — accuracy not yet measured
The Results section (“p53R172H enhances self-renewal in hematopoietic cells in vitro and in vivo”; page unavailable) reports enhanced self-renewal in mutant mouse hematopoietic cells only after loss of the remaining wild-type p53 allele, along with a competitive advantage in transplantation. It does not directly establish that loss of the TP53-WT allele gives human TP53-sAML leukemia stem cells an additional fitness advantage. (LLM, conf=0.84)
- Supportedcites [2] Bernard, E. et al. Implications of TP53 allelic state for genome stability, clinical presentation and outcomes in myelodysplastic syndromes. Nat. Med. 26, 1549–1556 (2020). source
Citation 2 is attached to the statement that loss of the TP53 wild-type allele is associated with a particularly dismal prognosis, not to the citing authors’ conclusion about fitness in TP53-sAML LSCs. The outcomes passage (indexed as Abstract; page not supplied) reports equally dismal outcomes for multi-hit groups including mutation with deletion or copy-neutral loss of heterozygosity. (LLM, conf=0.91)
plaindirect- Asserted: passes — The authors put it forward as true.
- Checkable: passes — It can be checked against evidence.
- Load-bearing: passes — The paper’s conclusions depend on it.
- Based: passes — The paper gives a reason why it holds.
- Partly supported
The cited sources support only part of this claim — read each source’s verdict below.
In the paper
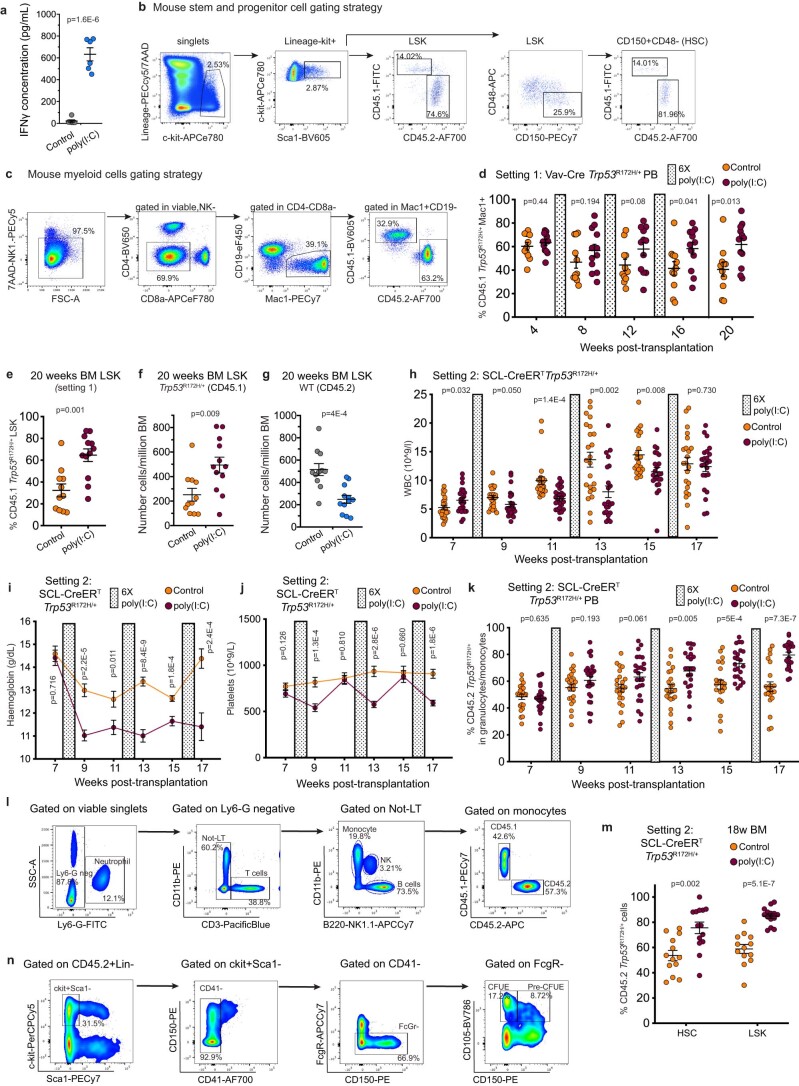
“These experiments recapitulate chronic inflammation through induction of multiple pro-inflammatory cytokines34,35 known to be increased in the serum of patients with MPN36, including IFNγ (Fig. 5a and Extended Data Fig. 10a).”
§ Single-cell multi-omics identifies chronic inflammation as a driver of TP53-mutant leukemic evolution > Results > Inflammation promotes TP53-associated clonal dominance
What the sources say
- Partly supportedcites [34] Demerdash, Y., Kain, B., Essers, M. A. G. & King, K. Y. Yin and Yang: the dual effects of interferons on hematopoiesis. Exp. Hematol. 96, 1–12 (2021). sourceExperimental — accuracy not yet measured
The Introduction’s section on short- versus long-term interferon signaling describes persistent IFNγ signaling in mouse infection models, supporting the inflammatory IFNγ component. It does not establish that the citing paper’s mouse experiments induced multiple pro-inflammatory cytokines or recapitulated chronic inflammation in that way. The separate claim about cytokines in MPN patient serum is attached to citation 36, not this source. (LLM, conf=0.82)
- Not checked — no full text of the sourcecites [35] Trapp, S. et al. Double-stranded RNA analog poly(I:C) inhibits human immunodeficiency virus amplification in dendritic cells via type I interferon-mediated activation of APOBEC3G. J. Virol. 83, 884–895 (2009). source
- Partly supportedcites [36] Cacemiro, M. D. C. et al. Philadelphia-negative myeloproliferative neoplasms as disorders marked by cytokine modulation. Hematol. Transfus. Cell Ther. 40, 120–131 (2018). sourceExperimental — accuracy not yet measured
The Results section (page not provided) reports elevated plasma levels of several cytokines in MPN patients compared with controls. It reports higher IFN-γ in PMF patients than in ET patients, but not compared with healthy controls; the Discussion also recounts a study finding lower IFN-γ in PMF patients than in controls. Thus the source supports the broader cytokine claim, but not the unqualified implication that IFN-γ is increased in MPN patients relative to healthy people. The mouse experiments are not the part attributed to this source. (LLM, conf=0.86)
plaindirect- Asserted: passes — The authors put it forward as true.
- Checkable: passes — It can be checked against evidence.
- Load-bearing: passes — The paper’s conclusions depend on it.
- Based: passes — The paper gives a reason why it holds.
- Partly supported
A result the paper reports from its own data — it cites no other source for it, so there is none to check. The quote shows it is in the paper.
In the paper
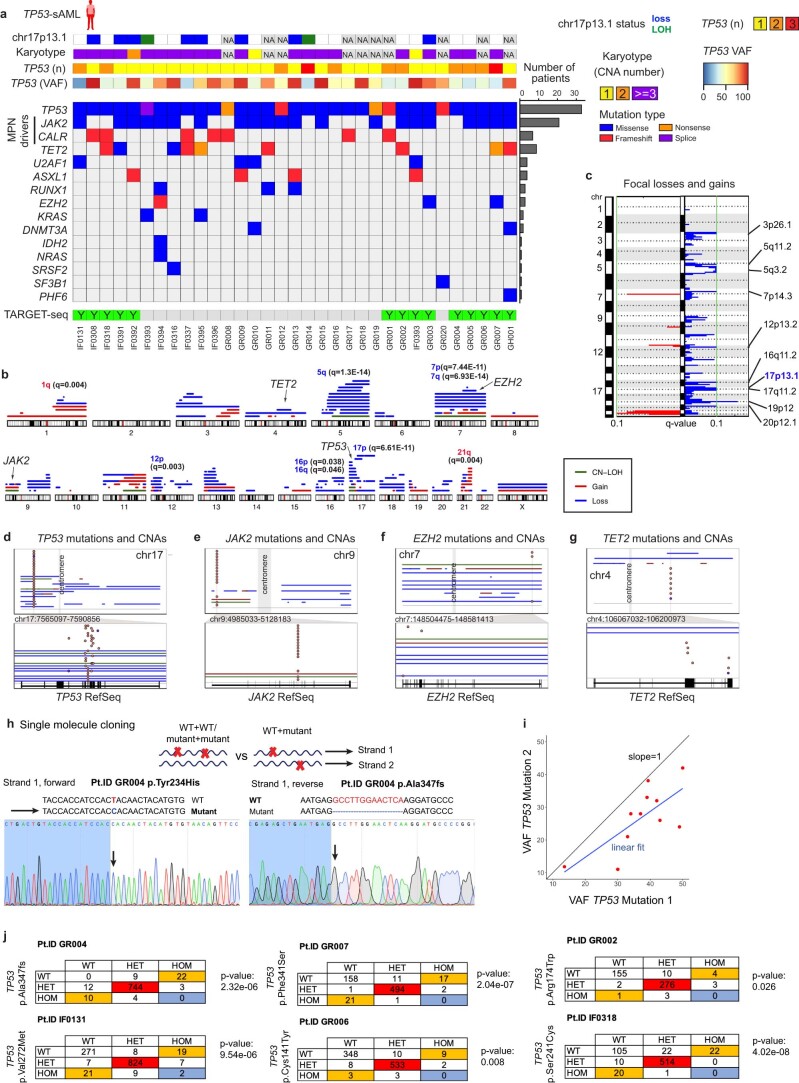
“Multiple TP53 mutations were present in one-third (n = 11) of patients, including 2 patients with 3 TP53 mutations; 82% (18 of 22) of patients with a single TP53 mutation showed a high variant allelic frequency (VAF) of >50%.”
§ Single-cell multi-omics identifies chronic inflammation as a driver of TP53-mutant leukemic evolution > Results > Convergent clonal evolution in TP53 leukemic transformation
plain- Asserted: passes — The authors put it forward as true.
- Checkable: passes — It can be checked against evidence.
- Load-bearing: unclear — It is unclear whether the paper’s conclusions depend on it.
- Based: passes — The paper gives a reason why it holds.
A result the paper reports from its own data — it cites no other source for it, so there is none to check. The quote shows it is in the paper.
In the paper
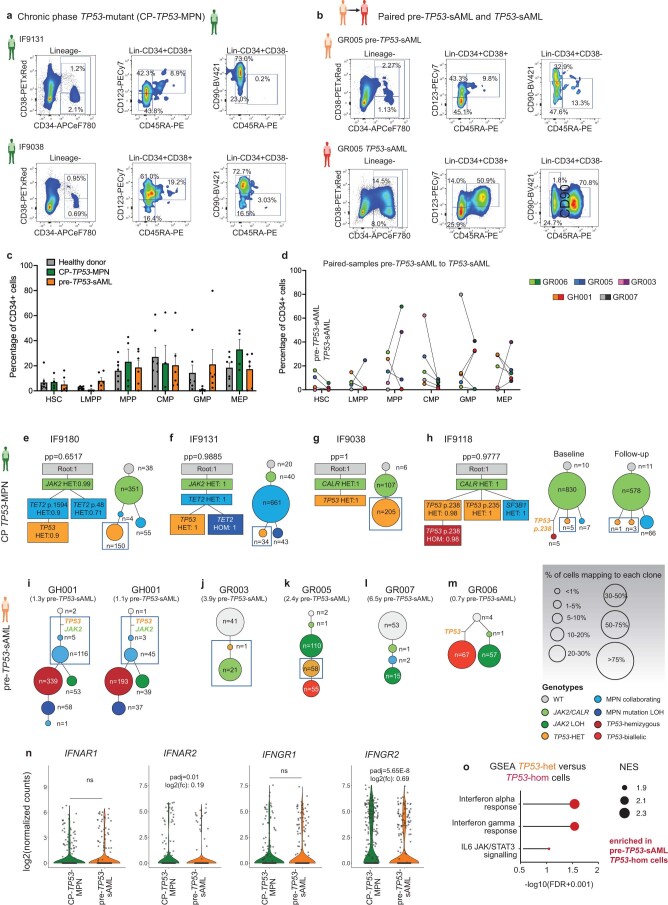
“Upregulation of inflammatory signatures was detected in TP53-homozygous cells from the same pre-TP53-sAML patients at a higher level than in TP53-heterozygous cells (Extended Data Fig. 9o).”
§ Single-cell multi-omics identifies chronic inflammation as a driver of TP53-mutant leukemic evolution > Results > Inflammation promotes TP53-associated clonal dominance
plaincorrelational- Asserted: passes — The authors put it forward as true.
- Checkable: passes — It can be checked against evidence.
- Load-bearing: passes — The paper’s conclusions depend on it.
- Based: passes — The paper gives a reason why it holds.
A result the paper reports from its own data — it cites no other source for it, so there is none to check. The quote shows it is in the paper.
In the paper
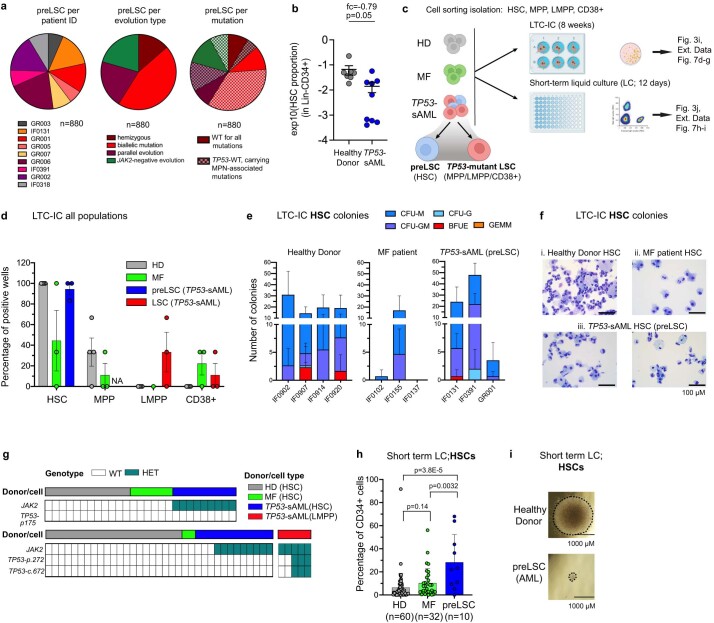
“Pre-LSCs were rare, as reflected by a reduction in the numbers of phenotypic HSCs present within the Lin-CD34+ HSPC compartment in TP53-sAML compared to HDs (Extended Data Fig. 7b).”
§ Single-cell multi-omics identifies chronic inflammation as a driver of TP53-mutant leukemic evolution > Results > TP53-WT cells display self-renewal and differentiation defects
plaincorrelational- Asserted: passes — The authors put it forward as true.
- Checkable: passes — It can be checked against evidence.
- Load-bearing: unclear — It is unclear whether the paper’s conclusions depend on it.
- Based: passes — The paper gives a reason why it holds.
A result the paper reports from its own data — it cites no other source for it, so there is none to check. The quote shows it is in the paper.
In the paper
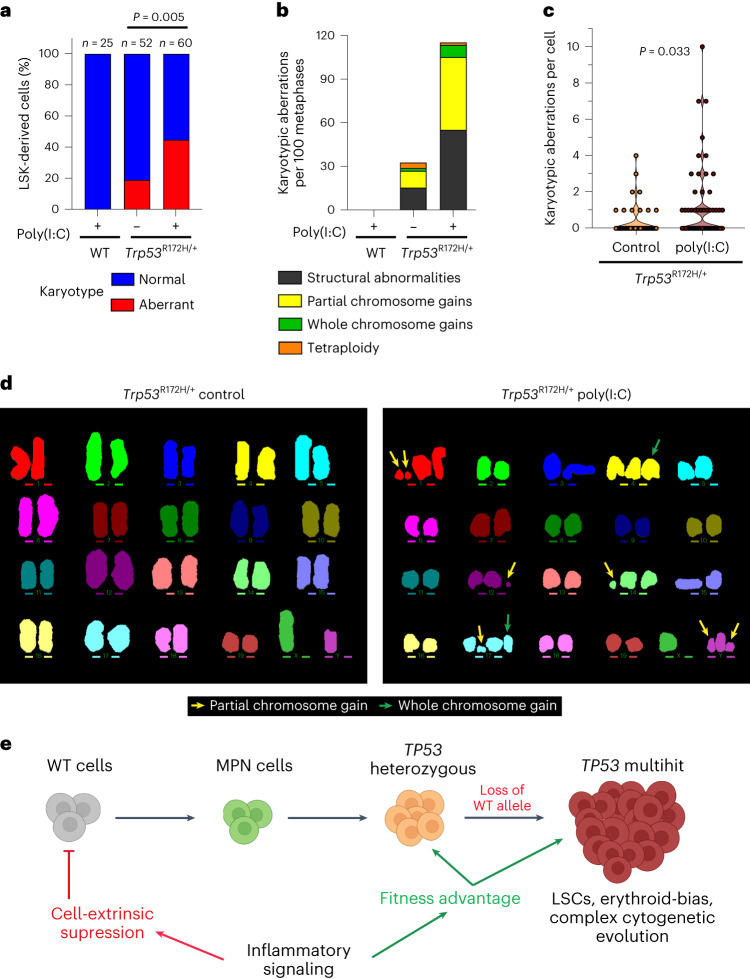
“In contrast, we observed a striking increase in the frequency and number of karyotypic abnormalities in Trp53-mutated LSK-derived cells upon poly(I:C) treatment (Fig. 6a–d).”
§ Single-cell multi-omics identifies chronic inflammation as a driver of TP53-mutant leukemic evolution > Results > Inflammation promotes the genetic evolution of Trp53-mutant HSPC
plaindirect- Asserted: passes — The authors put it forward as true.
- Checkable: passes — It can be checked against evidence.
- Load-bearing: passes — The paper’s conclusions depend on it.
- Based: passes — The paper gives a reason why it holds.
A result the paper reports from its own data — it cites no other source for it, so there is none to check. The quote shows it is in the paper.
In the paper
“Poly(I:C) treatment led to inflammation-associated changes in blood cell parameters, including anemia, leucopenia and thrombocytopenia (Extended Data Fig. 10h–j).”
§ Single-cell multi-omics identifies chronic inflammation as a driver of TP53-mutant leukemic evolution > Results > Inflammation promotes TP53-associated clonal dominance
plaindirect- Asserted: passes — The authors put it forward as true.
- Checkable: passes — It can be checked against evidence.
- Load-bearing: unclear — It is unclear whether the paper’s conclusions depend on it.
- Based: passes — The paper gives a reason why it holds.
A result the paper reports from its own data — it cites no other source for it, so there is none to check. The quote shows it is in the paper.
In the paper
“Here we demonstrate a hitherto unrecognized effect of TP53 mutations, which conferred a marked fitness advantage to HSPCs in the presence of chronic inflammation induced with both poly(I:C) as well as LPS.”
§ Single-cell multi-omics identifies chronic inflammation as a driver of TP53-mutant leukemic evolution > Discussion
boosteddirect- Asserted: passes — The authors put it forward as true.
- Checkable: passes — It can be checked against evidence.
- Load-bearing: passes — The paper’s conclusions depend on it.
- Based: passes — The paper gives a reason why it holds.
A result the paper reports from its own data — it cites no other source for it, so there is none to check. The quote shows it is in the paper.
In the paper
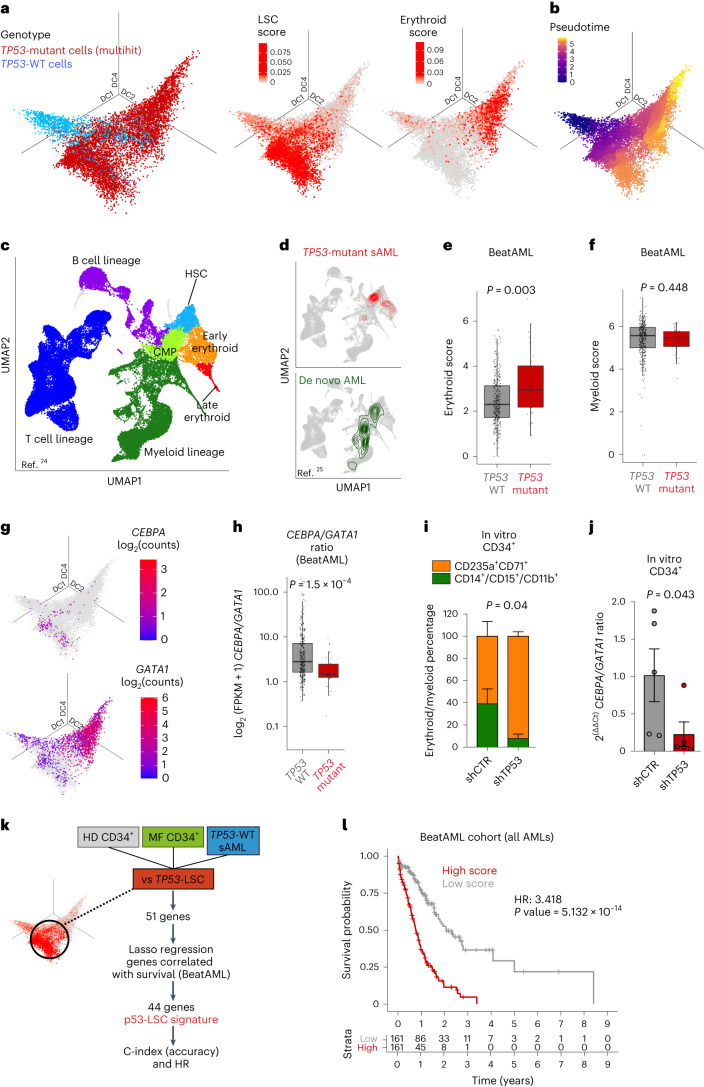
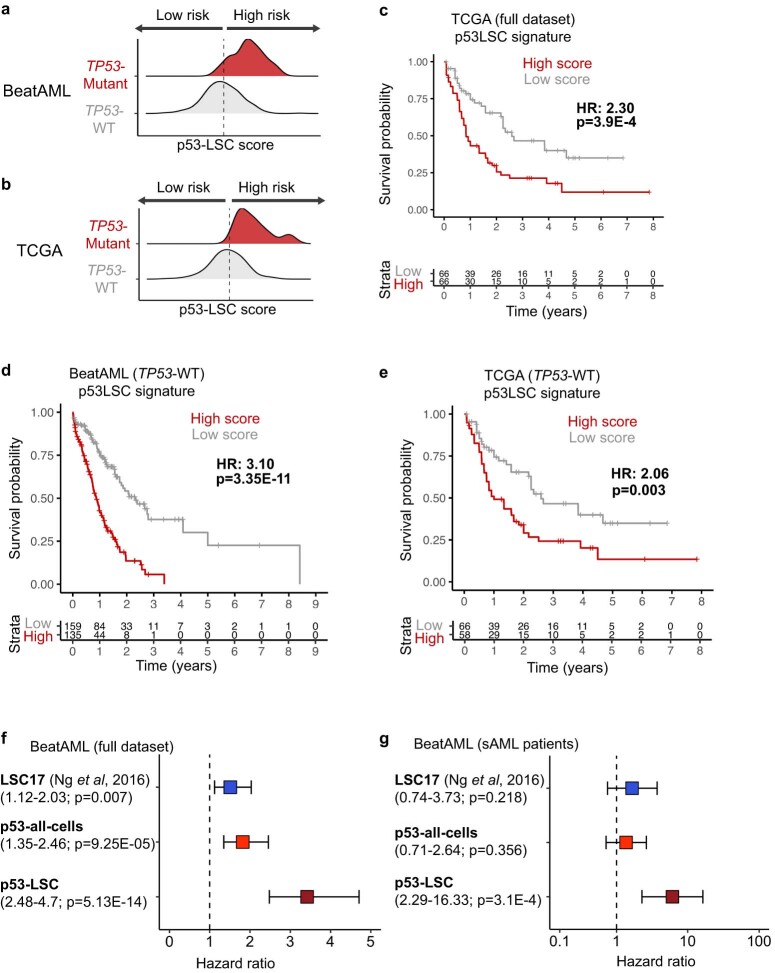
“A high p53LSC score predicted poor survival in the independent BeatAML and TCGA cohorts, irrespective of TP53 mutational status (Fig. 2l and Extended Data Fig. 6c–e).”
§ Single-cell multi-omics identifies chronic inflammation as a driver of TP53-mutant leukemic evolution > Results > Molecular signatures of TP53-mutant-mediated transformation
plaincorrelational- Asserted: passes — The authors put it forward as true.
- Checkable: passes — It can be checked against evidence.
- Load-bearing: passes — The paper’s conclusions depend on it.
- Based: passes — The paper gives a reason why it holds.
A result the paper reports from its own data — it cites no other source for it, so there is none to check. The quote shows it is in the paper.
In the paper
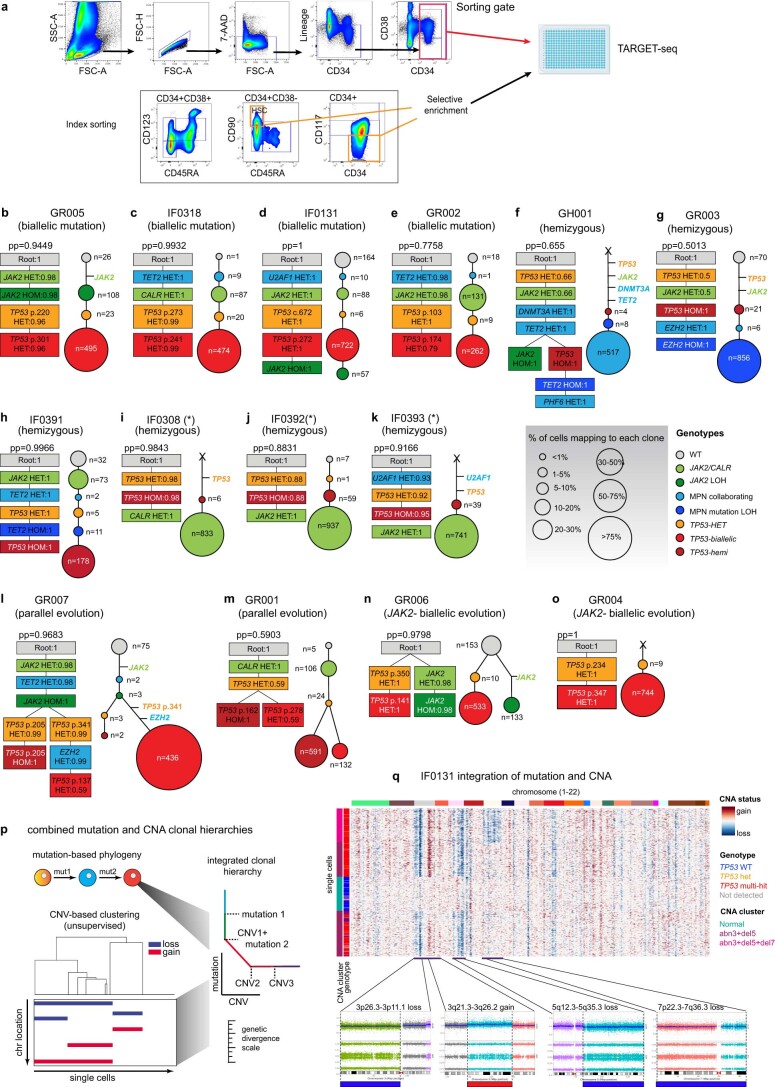
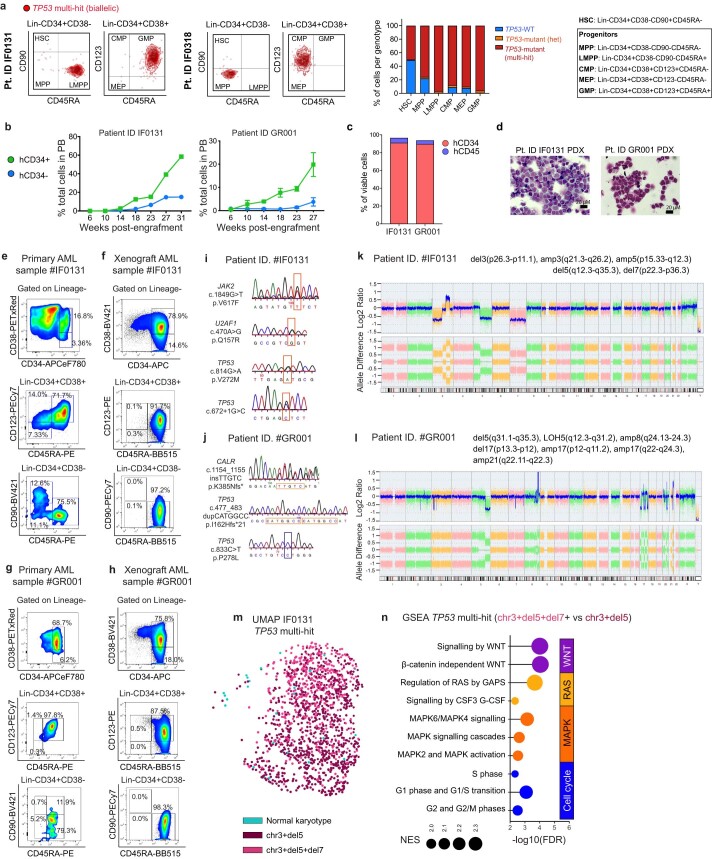
“In patient IF0131, a monosomy 7 subclone (Fig. 1f) preferentially expanded in PDX models (Fig. 1i).”
§ Single-cell multi-omics identifies chronic inflammation as a driver of TP53-mutant leukemic evolution > Results > Convergent clonal evolution in TP53 leukemic transformation
plaincorrelationalSingle case- Asserted: passes — The authors put it forward as true.
- Checkable: passes — It can be checked against evidence.
- Load-bearing: unclear — It is unclear whether the paper’s conclusions depend on it.
- Based: passes — The paper gives a reason why it holds.
A result the paper reports from its own data — it cites no other source for it, so there is none to check. The quote shows it is in the paper.
In the paper
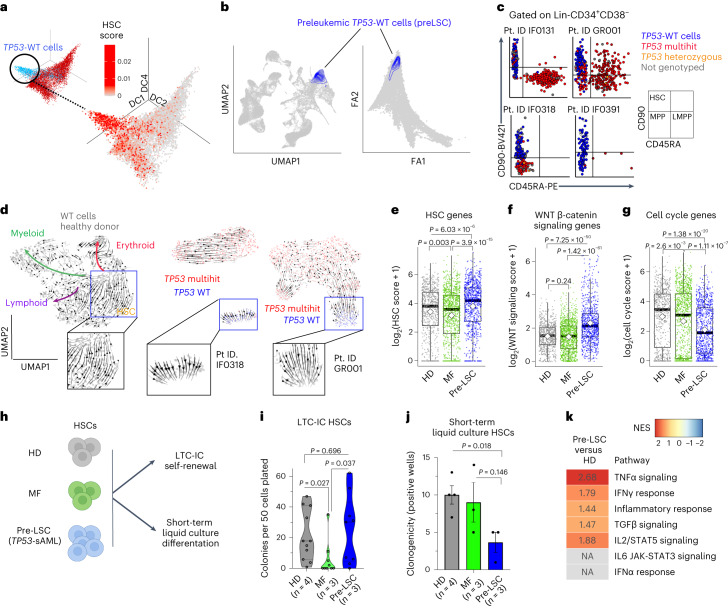
“Index sorting revealed that pre-LSCs were strikingly enriched in the phenotypic HSC compartment, unlike TP53 multihit HSPCs (Fig. 3c and Extended Data Fig. 3a).”
§ Single-cell multi-omics identifies chronic inflammation as a driver of TP53-mutant leukemic evolution > Results > TP53-WT cells display self-renewal and differentiation defects
boostedcorrelational- Asserted: passes — The authors put it forward as true.
- Checkable: passes — It can be checked against evidence.
- Load-bearing: passes — The paper’s conclusions depend on it.
- Based: passes — The paper gives a reason why it holds.
A result the paper reports from its own data — it cites no other source for it, so there is none to check. The quote shows it is in the paper.
In the paper
“Pre-LSCs representing the antecedent MPN clone (positive for MPN-associated driver mutations) were more frequent (60.5%) than pre-LSCs that were WT for all mutations (39.5%).”
§ Single-cell multi-omics identifies chronic inflammation as a driver of TP53-mutant leukemic evolution > Results > TP53-WT cells display self-renewal and differentiation defects
plainn = 14- Asserted: passes — The authors put it forward as true.
- Checkable: passes — It can be checked against evidence.
- Load-bearing: unclear — It is unclear whether the paper’s conclusions depend on it.
- Based: passes — The paper gives a reason why it holds.
A result the paper reports from its own data — it cites no other source for it, so there is none to check. The quote shows it is in the paper.
In the paper
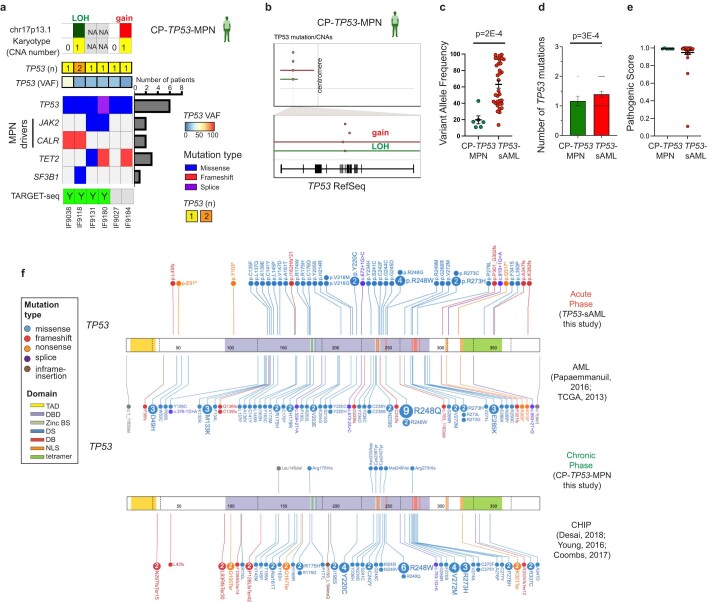
“The type, distribution and pathogenicity score of TP53 mutations were similar between chronic and acute stages (Extended Data Fig. 8e,f).”
§ Single-cell multi-omics identifies chronic inflammation as a driver of TP53-mutant leukemic evolution > Results > Inflammation promotes TP53-associated clonal dominance
plain- Asserted: passes — The authors put it forward as true.
- Checkable: passes — It can be checked against evidence.
- Load-bearing: unclear — It is unclear whether the paper’s conclusions depend on it.
- Based: passes — The paper gives a reason why it holds.
A result the paper reports from its own data — it cites no other source for it, so there is none to check. The quote shows it is in the paper.
In the paper
“Indeed, pre-LSCs showed enrichment of gene signatures associated with certain cell-extrinsic inflammatory mediators (TNFα, IFNγ, TGFβ and IL2; Fig. 3k).”
§ Single-cell multi-omics identifies chronic inflammation as a driver of TP53-mutant leukemic evolution > Results > TP53-WT cells display self-renewal and differentiation defects
plaincorrelational- Asserted: passes — The authors put it forward as true.
- Checkable: passes — It can be checked against evidence.
- Load-bearing: passes — The paper’s conclusions depend on it.
- Based: passes — The paper gives a reason why it holds.
A result the paper reports from its own data — it cites no other source for it, so there is none to check. The quote shows it is in the paper.
In the paper
“TP53 knock-down led to increased erythroid (CD71+CD235a+) and decreased myeloid (CD14+/CD15+/CD11b+) differentiation in vitro (Fig. 2i), and consequently decreased CEBPA/GATA1 expression ratio (Fig. 2j), suggesting that p53 may directly contribute to the aberrant myelo-erythroid differentiation observed.”
§ Single-cell multi-omics identifies chronic inflammation as a driver of TP53-mutant leukemic evolution > Results > Molecular signatures of TP53-mutant-mediated transformation
plaindirect- Asserted: passes — The authors put it forward as true.
- Checkable: passes — It can be checked against evidence.
- Load-bearing: passes — The paper’s conclusions depend on it.
- Based: passes — The paper gives a reason why it holds.
A result the paper reports from its own data — it cites no other source for it, so there is none to check. The quote shows it is in the paper.
In the paper
“A third TP53 WT ‘pre-LSC’ HSPC cluster was characterized by quiescence signatures and defective differentiation, reflecting the impaired hematopoiesis observed in patients with TP53-sAML.”
§ Single-cell multi-omics identifies chronic inflammation as a driver of TP53-mutant leukemic evolution > Discussion
plaincorrelational- Asserted: passes — The authors put it forward as true.
- Checkable: passes — It can be checked against evidence.
- Load-bearing: passes — The paper’s conclusions depend on it.
- Based: passes — The paper gives a reason why it holds.
A result the paper reports from its own data — it cites no other source for it, so there is none to check. The quote shows it is in the paper.
In the paper
“WT competitor LSK-derived cells from poly(I:C) treated mice were karyotypically normal.”
§ Single-cell multi-omics identifies chronic inflammation as a driver of TP53-mutant leukemic evolution > Results > Inflammation promotes the genetic evolution of Trp53-mutant HSPC
plain- Asserted: passes — The authors put it forward as true.
- Checkable: passes — It can be checked against evidence.
- Load-bearing: passes — The paper’s conclusions depend on it.
- Based: passes — The paper gives a reason why it holds.
A result the paper reports from its own data — it cites no other source for it, so there is none to check. The quote shows it is in the paper.
In the paper
“This hypothesis was strongly supported through in vivo experiments in which inflammation promoted genetic evolution of Trp53-mutant mouse HSPCs.”
§ Single-cell multi-omics identifies chronic inflammation as a driver of TP53-mutant leukemic evolution > Discussion
boosteddirect- Asserted: passes — The authors put it forward as true.
- Checkable: passes — It can be checked against evidence.
- Load-bearing: passes — The paper’s conclusions depend on it.
- Based: passes — The paper gives a reason why it holds.
A result the paper reports from its own data — it cites no other source for it, so there is none to check. The quote shows it is in the paper.
In the paper
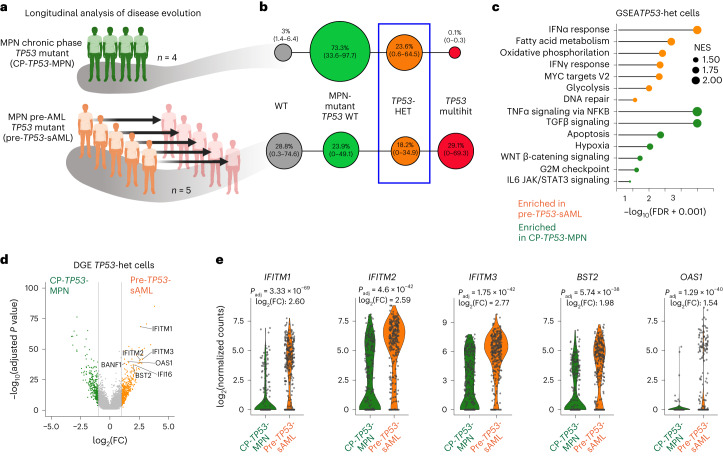
“Heterozygous TP53 clones were identified in 3 pre-TP53-sAML patients and all 4 CP TP53-MPN (Fig. 4b and Extended Data Fig. 9e–m).”
§ Single-cell multi-omics identifies chronic inflammation as a driver of TP53-mutant leukemic evolution > Results > Inflammation promotes TP53-associated clonal dominance
plainn = 3- Asserted: passes — The authors put it forward as true.
- Checkable: passes — It can be checked against evidence.
- Load-bearing: passes — The paper’s conclusions depend on it.
- Based: passes — The paper gives a reason why it holds.
A result the paper reports from its own data — it cites no other source for it, so there is none to check. The quote shows it is in the paper.
In the paper
“Deletion or copy-neutral loss of heterozygosity affecting the TP53 locus (chr17p13.1) was detectable at the bulk level in 43% of patients (10 of 23; Extended Data Fig. 1b–d).”
§ Single-cell multi-omics identifies chronic inflammation as a driver of TP53-mutant leukemic evolution > Results > Convergent clonal evolution in TP53 leukemic transformation
plain- Asserted: passes — The authors put it forward as true.
- Checkable: passes — It can be checked against evidence.
- Load-bearing: unclear — It is unclear whether the paper’s conclusions depend on it.
- Based: passes — The paper gives a reason why it holds.
A result the paper reports from its own data — it cites no other source for it, so there is none to check. The quote shows it is in the paper.
In the paper
“We detected MPN-driver mutations (JAK2 and CALR) in 28 patients (85%), and co-occurring myeloid driver mutations in 24 patients (73%).”
§ Single-cell multi-omics identifies chronic inflammation as a driver of TP53-mutant leukemic evolution > Results > Convergent clonal evolution in TP53 leukemic transformation
plainn = 33- Asserted: passes — The authors put it forward as true.
- Checkable: passes — It can be checked against evidence.
- Load-bearing: unclear — It is unclear whether the paper’s conclusions depend on it.
- Based: passes — The paper gives a reason why it holds.
In the paper
“The p53LSC signature performed well as a predictor of survival, including in sAML patients, as compared to the previously published LSC17 score31 and p53-mutant score generated using all TP53-mutant HSPC rather than LSCs (Extended Data Fig. 6f,g and Supplementary Table 4), providing a powerful tool to aid risk stratification in AML.”
§ Single-cell multi-omics identifies chronic inflammation as a driver of TP53-mutant leukemic evolution > Results > Molecular signatures of TP53-mutant-mediated transformation
What the sources say
- Not checked — no full text of the sourcecites [31] Ng, S. W. et al. A 17-gene stemness score for rapid determination of risk in acute leukaemia. Nature 540, 433–437 (2016). source
boostedcorrelational- Asserted: passes — The authors put it forward as true.
- Checkable: passes — It can be checked against evidence.
- Load-bearing: passes — The paper’s conclusions depend on it.
- Based: passes — The paper gives a reason why it holds.
A result the paper reports from its own data — it cites no other source for it, so there is none to check. The quote shows it is in the paper.
In the paper
“Concomitantly, patients with high erythroid scores also showed decreased TP53-target gene expression (Extended Data Fig. 5k).”
§ Single-cell multi-omics identifies chronic inflammation as a driver of TP53-mutant leukemic evolution > Results > Molecular signatures of TP53-mutant-mediated transformation
plaincorrelational- Asserted: passes — The authors put it forward as true.
- Checkable: passes — It can be checked against evidence.
- Load-bearing: passes — The paper’s conclusions depend on it.
- Based: passes — The paper gives a reason why it holds.
A result the paper reports from its own data — it cites no other source for it, so there is none to check. The quote shows it is in the paper.
In the paper
“Analysis of TP53 VAF and reported karyotypic abnormalities indicated that the vast majority of patients could be classified as ‘multi-hit’, and therefore patients were classified as TP53-mutant or WT without taking into account TP53 allelic status.”
§ Single-cell multi-omics identifies chronic inflammation as a driver of TP53-mutant leukemic evolution > Methods > Analysis of bulk BeatAML and TCGA gene expression datasets
hedgedcorrelationaln = 360- Asserted: passes — The authors put it forward as true.
- Checkable: passes — It can be checked against evidence.
- Load-bearing: unclear — It is unclear whether the paper’s conclusions depend on it.
- Based: passes — The paper gives a reason why it holds.
A result the paper reports from its own data — it cites no other source for it, so there is none to check. The quote shows it is in the paper.
In the paper
“CNA analysis using single-cell transcriptomes showed that all TP53 multihit clones harbored at least one highly clonally-dominant CNA, with very few TP53-mutant cells without evidence of a CNA (3.4 ± 1.2%) and an additional 5 of 14 (36%) patients also showing cytogenetically-distinct subclones (Fig. 1f,g and Extended Data Fig. 2p,q).”
§ Single-cell multi-omics identifies chronic inflammation as a driver of TP53-mutant leukemic evolution > Results > Convergent clonal evolution in TP53 leukemic transformation
plain- Asserted: passes — The authors put it forward as true.
- Checkable: passes — It can be checked against evidence.
- Load-bearing: unclear — It is unclear whether the paper’s conclusions depend on it.
- Based: passes — The paper gives a reason why it holds.
A result the paper reports from its own data — it cites no other source for it, so there is none to check. The quote shows it is in the paper.
In the paper
“Trp53-mutant peripheral blood (PB) myeloid cells, BM HSCs (Lin-Sca1+c-Kit+CD150+CD48−) and LSKs (Lin-Sca1+c-Kit+) were selectively enriched upon poly(I:C) treatment (Fig. 5b,c and Extended Data Fig. 10b–e).”
§ Single-cell multi-omics identifies chronic inflammation as a driver of TP53-mutant leukemic evolution > Results > Inflammation promotes TP53-associated clonal dominance
plaindirect- Asserted: passes — The authors put it forward as true.
- Checkable: passes — It can be checked against evidence.
- Load-bearing: passes — The paper’s conclusions depend on it.
- Based: passes — The paper gives a reason why it holds.
A result the paper reports from its own data — it cites no other source for it, so there is none to check. The quote shows it is in the paper.
In the paper
“Monosomy 7 cells showed a distinct transcriptional profile with increased WNT, RAS, MAPK signaling and cell cycle associated transcription (Extended Data Fig. 3m,n).”
§ Single-cell multi-omics identifies chronic inflammation as a driver of TP53-mutant leukemic evolution > Results > Convergent clonal evolution in TP53 leukemic transformation
plaincorrelationalSingle case- Asserted: passes — The authors put it forward as true.
- Checkable: passes — It can be checked against evidence.
- Load-bearing: passes — The paper’s conclusions depend on it.
- Based: passes — The paper gives a reason why it holds.
A result the paper reports from its own data — it cites no other source for it, so there is none to check. The quote shows it is in the paper.
In the paper
“Analysis of HSPCs showed the expected selection for Trp53-mutant HSCs and LSKs following Poly(I:C) treatment (Extended Data Fig. 10m).”
§ Single-cell multi-omics identifies chronic inflammation as a driver of TP53-mutant leukemic evolution > Results > Inflammation promotes TP53-associated clonal dominance
plaindirect- Asserted: passes — The authors put it forward as true.
- Checkable: passes — It can be checked against evidence.
- Load-bearing: passes — The paper’s conclusions depend on it.
- Based: passes — The paper gives a reason why it holds.
A result the paper reports from its own data — it cites no other source for it, so there is none to check. The quote shows it is in the paper.
In the paper
“These pre-LSCs were obtained in sufficient numbers (>20 cells) from 9 of 14 TP53-sAML patients, including all patterns of clonal evolution (Fig. 3a and Extended Data Fig. 7a).”
§ Single-cell multi-omics identifies chronic inflammation as a driver of TP53-mutant leukemic evolution > Results > TP53-WT cells display self-renewal and differentiation defects
plainn = 14- Asserted: passes — The authors put it forward as true.
- Checkable: passes — It can be checked against evidence.
- Load-bearing: passes — The paper’s conclusions depend on it.
- Based: passes — The paper gives a reason why it holds.
A result the paper reports from its own data — it cites no other source for it, so there is none to check. The quote shows it is in the paper.
In the paper
“We provide evidence that TP53-mutant HSPCs showing dysregulated inflammation-associated gene expression are enriched in patients who will develop TP53-sAML.”
§ Single-cell multi-omics identifies chronic inflammation as a driver of TP53-mutant leukemic evolution > Discussion
boostedcorrelational- Asserted: passes — The authors put it forward as true.
- Checkable: passes — It can be checked against evidence.
- Load-bearing: passes — The paper’s conclusions depend on it.
- Based: passes — The paper gives a reason why it holds.
A result the paper reports from its own data — it cites no other source for it, so there is none to check. The quote shows it is in the paper.
In the paper
“We detected MPN-driver mutations (JAK2 and CALR) in 28 patients (85%), and co-occurring myeloid driver mutations in 24 patients (73%).”
§ Single-cell multi-omics identifies chronic inflammation as a driver of TP53-mutant leukemic evolution > Results > Convergent clonal evolution in TP53 leukemic transformation
plainn = 33- Asserted: passes — The authors put it forward as true.
- Checkable: passes — It can be checked against evidence.
- Load-bearing: unclear — It is unclear whether the paper’s conclusions depend on it.
- Based: passes — The paper gives a reason why it holds.
What the paper did — it cites no source for this, so there is none to check. The quote shows it is in the paper.
In the paper
“Bi-allelic mutations were confirmed by single molecule cloning and computational analysis (Extended Data Fig. 1h–j).”
§ Single-cell multi-omics identifies chronic inflammation as a driver of TP53-mutant leukemic evolution > Results > Convergent clonal evolution in TP53 leukemic transformation
plain- Asserted: passes — The authors put it forward as true.
- Checkable: passes — It can be checked against evidence.
- Load-bearing: passes — The paper’s conclusions depend on it.
- Based: passes — The paper gives a reason why it holds.
A conclusion the paper draws from its own results — it cites no other source for it, so there is none to check. The quote shows it is in the paper.
In the paper
“These results indicate that a variety of inflammatory stimuli can promote expansion of the Trp53-mutant clone.”
§ Single-cell multi-omics identifies chronic inflammation as a driver of TP53-mutant leukemic evolution > Results > Inflammation promotes TP53-associated clonal dominance
hedgeddirect- Asserted: passes — The authors put it forward as true.
- Checkable: passes — It can be checked against evidence.
- Load-bearing: passes — The paper’s conclusions depend on it.
- Based: passes — The paper gives a reason why it holds.
A claim is checked only against the cited paper’s full text, never its abstract, and none is available for its sources.
In the paper
“These observations suggest that the CEBPA/GATA1 expression ratio, an important transcription factor balance that affects erythroid versus myeloid differentiation in leukemia29,30, is disrupted by TP53 mutation.”
§ Single-cell multi-omics identifies chronic inflammation as a driver of TP53-mutant leukemic evolution > Results > Molecular signatures of TP53-mutant-mediated transformation
What the sources say
- Not checked — no full text of the sourcecites [29] Wagner, K. et al. Absence of the transcription factor CCAAT enhancer binding protein α results in loss of myeloid identity in bcr/abl-induced malignancy. Proc. Natl Acad. Sci. USA 103, 6338–6343 (2006). source
- Not checked — no full text of the sourcecites [30] Bereshchenko, O. et al. Hematopoietic stem cell expansion precedes the generation of committed myeloid leukemia-initiating cells in C/EBPα mutant AML. Cancer Cell 16, 390–400 (2009). source
hedgeddirect- Asserted: passes — The authors put it forward as true.
- Checkable: passes — It can be checked against evidence.
- Load-bearing: passes — The paper’s conclusions depend on it.
- Based: passes — The paper gives a reason why it holds.
A conclusion the paper draws from its own results — it cites no other source for it, so there is none to check. The quote shows it is in the paper.
In the paper
“Taken together, these findings support that TP53-sAML is associated with complex genetic intratumoral heterogeneity.”
§ Single-cell multi-omics identifies chronic inflammation as a driver of TP53-mutant leukemic evolution > Results > Convergent clonal evolution in TP53 leukemic transformation
plaincorrelationaln = 33- Asserted: passes — The authors put it forward as true.
- Checkable: passes — It can be checked against evidence.
- Load-bearing: passes — The paper’s conclusions depend on it.
- Based: passes — The paper gives a reason why it holds.
A conclusion the paper draws from its own results — it cites no other source for it, so there is none to check. The quote shows it is in the paper.
In the paper
“providing an explanation for the selection for multihit TP53-mutant clones observed in patients.”
§ Single-cell multi-omics identifies chronic inflammation as a driver of TP53-mutant leukemic evolution > Discussion
plaindirect- Asserted: passes — The authors put it forward as true.
- Checkable: passes — It can be checked against evidence.
- Load-bearing: passes — The paper’s conclusions depend on it.
- Based: passes — The paper gives a reason why it holds.
A conclusion the paper draws from its own results — it cites no other source for it, so there is none to check. The quote shows it is in the paper.
In the paper
“Taken together, these findings support an aberrant erythroid-biased differentiation trajectory in TP53-sAML.”
§ Single-cell multi-omics identifies chronic inflammation as a driver of TP53-mutant leukemic evolution > Results > Molecular signatures of TP53-mutant-mediated transformation
plaincorrelational- Asserted: passes — The authors put it forward as true.
- Checkable: passes — It can be checked against evidence.
- Load-bearing: passes — The paper’s conclusions depend on it.
- Based: passes — The paper gives a reason why it holds.
A conclusion the paper draws from its own results — it cites no other source for it, so there is none to check. The quote shows it is in the paper.
In the paper
“In summary, we identified rare and phenotypically distinct pre-LSCs from TP53-sAML samples, which were characterized by differentiation defects and distinct stemness, self-renewal and quiescence signatures.”
§ Single-cell multi-omics identifies chronic inflammation as a driver of TP53-mutant leukemic evolution > Results > TP53-WT cells display self-renewal and differentiation defects
plaincorrelational- Asserted: passes — The authors put it forward as true.
- Checkable: passes — It can be checked against evidence.
- Load-bearing: passes — The paper’s conclusions depend on it.
- Based: passes — The paper gives a reason why it holds.
In the paper
“with a myriad of inflammatory mediators overexpressed in MPN50.”
§ Single-cell multi-omics identifies chronic inflammation as a driver of TP53-mutant leukemic evolution > Discussion
What the sources say
- Not checked — no full text of the sourcecites [50] Lussana, F. & Rambaldi, A. Inflammation and myeloproliferative neoplasms. J. Autoimmun. 85, 58–63 (2017). source
plain- Asserted: passes — The authors put it forward as true.
- Checkable: passes — It can be checked against evidence.
- Load-bearing: passes — The paper’s conclusions depend on it.
- Based: passes — The paper gives a reason why it holds.
What the paper did — it cites no source for this, so there is none to check. The quote shows it is in the paper.
In the paper
“As CNA were universally present in TP53-sAML with a very high clonal burden, it is not possible, even with high-resolution single-cell analyses, to disentangle the impact of TP53-multi-hit mutation versus the effects of patient-specific CNA that were inextricably linked in all patients analyzed.”
§ Single-cell multi-omics identifies chronic inflammation as a driver of TP53-mutant leukemic evolution > Discussion
plaincorrelational- Asserted: passes — The authors put it forward as true.
- Checkable: passes — It can be checked against evidence.
- Load-bearing: unclear — It is unclear whether the paper’s conclusions depend on it.
- Based: passes — The paper gives a reason why it holds.
A conclusion the paper draws from its own results — it cites no other source for it, so there is none to check. The quote shows it is in the paper.
In the paper
“TP53 knock-down led to increased erythroid (CD71+CD235a+) and decreased myeloid (CD14+/CD15+/CD11b+) differentiation in vitro (Fig. 2i), and consequently decreased CEBPA/GATA1 expression ratio (Fig. 2j), suggesting that p53 may directly contribute to the aberrant myelo-erythroid differentiation observed.”
§ Single-cell multi-omics identifies chronic inflammation as a driver of TP53-mutant leukemic evolution > Results > Molecular signatures of TP53-mutant-mediated transformation
hedgedconditional- Asserted: passes — The authors put it forward as true.
- Checkable: passes — It can be checked against evidence.
- Load-bearing: passes — The paper’s conclusions depend on it.
- Based: passes — The paper gives a reason why it holds.
- Probably not a substantial claim. 33
- It may state two separate claims as one. 49
The cited sources support only part of this claim — read each source’s verdict below.
In the paper
“shRNA sequence for p53 knockdown has been previously cloned into the lentiviral vector pRRLsin-PGK-eGFP-WPRE and validated87.”
§ Single-cell multi-omics identifies chronic inflammation as a driver of TP53-mutant leukemic evolution > Methods > In vitro assays
What the sources say
- Partly supportedcites [87] Mahfoudhi, E. et al. P53 activation inhibits all types of hematopoietic progenitors and all stages of megakaryopoiesis. Oncotarget 7, 31980–31992 (2016). sourceExperimental — accuracy not yet measured
The Materials and Methods section (Lentivirus production; page unavailable) lists p53-targeting shRNA sequences in GFP-encoding lentiviruses. The Results section (Effects of p53 stabilization on late stages of megakaryocyte differentiation; page unavailable) shows that two shRNAs reduced p53 RNA and protein, supporting their knockdown activity. Neither passage identifies the vector as pRRLsin-PGK-eGFP-WPRE or states that the sequences were cloned into it. (LLM, conf=0.86)
plain- Asserted: passes — The authors put it forward as true.
- Checkable: passes — It can be checked against evidence.
- Load-bearing: passes — The paper’s conclusions depend on it.
- Based: passes — The paper gives a reason why it holds.
Probably not a substantial claim. It may state two separate claims as one.
- Partly supported
The sources with a verdict support this claim; the rest weren’t checked yet, have no full text we could read, or their verdicts aren’t rated yet.
In the paper
“Furthermore, deletion of Trp53 combined with JAK2 V617F mutation leads to highly penetrant myeloid leukemia in mice11,14.”
§ Single-cell multi-omics identifies chronic inflammation as a driver of TP53-mutant leukemic evolution > Main
What the sources say
- Supportedcites [11] Rampal, R. et al. Genomic and functional analysis of leukemic transformation of myeloproliferative neoplasms. Proc. Natl Acad. Sci. USA 111, E5401–E5410 (2014). source
In “Loss of Tp53 Cooperates with JAK2V617F to Promote AML” (page not supplied), the authors report transplanting JAK2V617F-expressing, Tp53-null mouse bone marrow into recipients; all recipients developed lethal disease within 110 days. The same section identifies the disease as AML, supporting the claim of highly penetrant myeloid leukemia in this mouse model. (LLM, conf=0.93)
- Not checked — no full text of the sourcecites [14] Tsuruta-Kishino, T. et al. Loss of p53 induces leukemic transformation in a murine model of Jak2 V617F-driven polycythemia vera. Oncogene 36, 3300–3311 (2017). source
plaindirect- Asserted: passes — The authors put it forward as true.
- Checkable: passes — It can be checked against evidence.
- Load-bearing: fails — The paper’s conclusions may not depend on it.
- Based: passes — The paper gives a reason why it holds.
Probably not a substantial claim. The paper’s conclusions may not depend on it.
- Supported
The cited sources support only part of this claim — read each source’s verdict below.
In the paper
“Three distinct clusters of HSPCs were identified in TP53-sAML, including one characterized by overexpression of erythroid genes, of particular note as erythroleukemia is a rare entity, associated with adverse outcomes and TP53 mutation43,44.”
§ Single-cell multi-omics identifies chronic inflammation as a driver of TP53-mutant leukemic evolution > Discussion
What the sources say
- Supportedcites [43] Boddu, P. et al. Erythroleukemia-historical perspectives and recent advances in diagnosis and management. Blood Rev. 32, 96–105 (2018). source
The citation follows the clause describing erythroleukemia as rare, associated with adverse outcomes and TP53 mutation—not the preceding finding about HSPC clusters. Section 2, “Morphologic and clinical features” (page unavailable), describes acute erythroleukemia as 1% of de novo AML and reports a dismal prognosis for the rarer pure erythroid form. Section 4.2.2, “TP53” (page unavailable), reports frequent TP53 mutations or abnormalities in erythroleukemia. (LLM, conf=0.92)
- Partly supportedcites [44] Iacobucci, I. et al. Genomic subtyping and therapeutic targeting of acute erythroleukemia. Nat. Genet. 51, 694–704 (2019). sourceExperimental — accuracy not yet measured
The Results sections on TP53 alterations and genomic determinants of outcome link acute erythroleukemia to TP53 mutations and poor prognosis. Our copy does not report three HSPC clusters in TP53-sAML or establish that erythroleukemia is rare. In the citing sentence, the cluster finding appears to be the citing authors’ own result; the citations follow the background statement about erythroleukemia. (LLM, conf=0.85)
plain- Asserted: passes — The authors put it forward as true.
- Checkable: passes — It can be checked against evidence.
- Load-bearing: passes — The paper’s conclusions depend on it.
- Based: passes — The paper gives a reason why it holds.
It may state two separate claims as one.
- Supported
The cited sources support only part of this claim — read each source’s verdict below.
In the paper
“Together, these data are compatible with a fitness advantage of monosomy 7 cells, a recurrent event in TP53-sAML (Extended Data Fig. 1b,c), driven by activation of signaling pathways that may relate to deletion of chromosome 7 genes such as EZH2 (ref. 20).”
§ Single-cell multi-omics identifies chronic inflammation as a driver of TP53-mutant leukemic evolution > Results > Convergent clonal evolution in TP53 leukemic transformation
What the sources say
- Partly supportedcites [20] Booth, C. A. G. et al. Ezh2 and Runx1 mutations collaborate to initiate lympho-myeloid leukemia in early thymic progenitors. Cancer Cell 33, 274–291 (2018). sourceExperimental — accuracy not yet measured
The Discussion (page unavailable) reports that Ezh2 loss increased expression of oncogenic Flt3-ITD signaling in a mouse model of early thymic progenitor leukemia, supporting the proposed link between EZH2 loss and signaling. It does not establish that chromosome 7 deletion activates signaling or gives monosomy 7 cells a fitness advantage in TP53-sAML; the paper cautions that its findings cannot be extrapolated to other contexts without validation. (LLM, conf=0.86)
hedgedconditionalSingle case- Asserted: passes — The authors put it forward as true.
- Checkable: passes — It can be checked against evidence.
- Load-bearing: passes — The paper’s conclusions depend on it.
- Based: passes — The paper gives a reason why it holds.
It may state two separate claims as one.
- Partly supported
Every source the paper cites for this claim was checked and supports it.
In the paper
“p53 targets positively regulated from ref. 77 were used to compute a TP53-target gene score”
§ Single-cell multi-omics identifies chronic inflammation as a driver of TP53-mutant leukemic evolution > Methods > Analysis of bulk BeatAML and TCGA gene expression datasets
What the sources say
- Supportedcites [77] Fischer, M. Census and evaluation of p53 target genes. Oncogene 36, 3943–3956 (2017). source
The Introduction (page not provided) says the survey compiles a list of p53 target genes. The section surveying 16 high-throughput data sets distinguishes genes activated by p53 from those repressed by p53 and identifies a set of p53-activated targets. This supports citing the paper as the source of a positively regulated target-gene set; the score calculation is the citing authors’ own method. (LLM, conf=0.92)
plain- Asserted: passes — The authors put it forward as true.
- Checkable: passes — It can be checked against evidence.
- Load-bearing: passes — The paper’s conclusions depend on it.
- Based: passes — The paper gives a reason why it holds.
Probably not a substantial claim.
- Supported
Every source the paper cites for this claim was checked and supports it.
In the paper
“Trp53tm2Tyj (ref. 88), Commd10Tg(Vav1-icre)A2Kio (ref. 89; Jackson Laboratory, 008610) and Tg(Tal1-cre/ERT)42-056Jrg (ref. 90) have been previously described.”
§ Single-cell multi-omics identifies chronic inflammation as a driver of TP53-mutant leukemic evolution > Methods > Mouse bone marrow chimeras and ethical approval
What the sources say
- Supportedcites [90] Göthert, J. R. et al. In vivo fate-tracing studies using the Scl stem cell enhancer: embryonic hematopoietic stem cells significantly contribute to adult hematopoiesis. Blood 105, 2724–2732 (2005). source
The “Generation of transgenic mice” section identifies founder line #42-056 and says it is referred to as HSC-SCL-Cre-ERT. The “Mice” section describes how the Cre-ERT transgenic mice were made, supporting the citation as a prior description of the line. (LLM, conf=0.91)
plain- Asserted: passes — The authors put it forward as true.
- Checkable: passes — It can be checked against evidence.
- Load-bearing: fails — The paper’s conclusions may not depend on it.
- Based: passes — The paper gives a reason why it holds.
Probably not a substantial claim. The paper’s conclusions may not depend on it.
- Supported
The cited sources that could be checked couldn’t confirm or dispute this claim.
In the paper
“In total, 100 erythroid genes and 135 myeloid genes were identified from this single-cell dataset (Supplementary Table 3) and were used to compute the scores presented in Extended Data Fig. 5g–j.”
§ Single-cell multi-omics identifies chronic inflammation as a driver of TP53-mutant leukemic evolution > Methods > Analysis of bulk BeatAML and TCGA gene expression datasets
What the sources say
- Could not verifycites [24] Granja, J. M. et al. Single-cell multiomic analysis identifies regulatory programs in mixed-phenotype acute leukemia. Nat. Biotechnol. 37, 1458–1465 (2019). sourceExperimental — accuracy not yet measured
The paper’s hematopoiesis discussion (page unavailable) identifies erythroid and myeloid lineages and examples of lineage-associated genes. Searches for “100 erythroid,” “135 myeloid,” and the claimed gene counts did not find a passage reporting those totals or the gene sets used for the cited scores. (LLM, conf=0.72)
plain- Asserted: passes — The authors put it forward as true.
- Checkable: passes — It can be checked against evidence.
- Load-bearing: fails — The paper’s conclusions may not depend on it.
- Based: passes — The paper gives a reason why it holds.
Probably not a substantial claim. The paper’s conclusions may not depend on it.
- Could not verify
The cited sources support only part of this claim — read each source’s verdict below.
In the paper
“Ninety-six multiple rate kinetics (MURK) genes previously shown to possess coordinated step-change in transcription and hence violate the assumptions behind scVelo were removed82.”
§ Single-cell multi-omics identifies chronic inflammation as a driver of TP53-mutant leukemic evolution > Methods > Velocyto analysis
What the sources say
- Partly supportedcites [82] Barile, M. et al. Coordinated changes in gene expression kinetics underlie both mouse and human erythroid maturation. Genome Biol. 22, 197 (2021). sourceExperimental — accuracy not yet measured
The Results section, “Analysis of unspliced reads reveals complex expression kinetics,” links MURK genes’ increased transcription rates to incorrect scVelo velocity predictions, and the Discussion says removing them can improve predictions. But the Methods section, “MURK gene identification,” reports 89 mouse genes and 97 human genes, not 96; the Discussion also notes that MURK genes can occur where scVelo predictions are correct. (LLM, conf=0.90)
plaindirect- Asserted: passes — The authors put it forward as true.
- Checkable: passes — It can be checked against evidence.
- Load-bearing: fails — The paper’s conclusions may not depend on it.
- Based: passes — The paper gives a reason why it holds.
Probably not a substantial claim. The paper’s conclusions may not depend on it. It may state two separate claims as one.
- Partly supported
The sources with a verdict support this claim; the rest weren’t checked yet, have no full text we could read, or their verdicts aren’t rated yet.
In the paper
“TP53-heterozygous HSPC from pre-TP53-sAML patients showed downregulation of TNFα- and TGFβ-associated gene signatures, both of which are known to be associated with HSC attrition32,33, with upregulated expression of oxidative phosphorylation, DNA repair and interferon (IFN) response genes (Supplementary Table 5 and Fig. 4c–e), without changes in IFN receptor expression levels or concurrent IFN”
§ Single-cell multi-omics identifies chronic inflammation as a driver of TP53-mutant leukemic evolution > Results > Inflammation promotes TP53-associated clonal dominance
What the sources say
- Supportedcites [32] Bryder, D. et al. Self-renewal of multipotent long-term repopulating hematopoietic stem cells is negatively regulated by Fas and tumor necrosis factor receptor activation. J. Exp. Med. 194, 941–952 (2001). source
Split into 2 atoms — 2 confirmed, 0 partially supported, 0 disputed, 0 misattributed, 0 unverifiable. Expand the claim to see per-atom verdicts.
- Not checked — no full text of the sourcecites [33] Jacobsen, F. W., Stokke, T. & Jacobsen, S. E. Transforming growth factor-beta potently inhibits the viability-promoting activity of stem cell factor and other cytokines and induces apoptosis of primitive murine hematopoietic progenitor cells. Blood 86, 2957–2966 (1995). source
plain- Asserted: passes — The authors put it forward as true.
- Checkable: passes — It can be checked against evidence.
- Load-bearing: passes — The paper’s conclusions depend on it.
- Based: passes — The paper gives a reason why it holds.
It may state two separate claims as one.
- Supported
The cited sources support only part of this claim — read each source’s verdict below.
In the paper
“Because TP53 is the most commonly mutated gene in human cancer3,52”
§ Single-cell multi-omics identifies chronic inflammation as a driver of TP53-mutant leukemic evolution > Discussion
What the sources say
- Supportedcites [3] Kastenhuber, E. R. & Lowe, S. W. Putting p53 in context. Cell 170, 1062–1078 (2017). source
In “The diversity of TP53 mutational events produces distinct functional consequences” (page not available), the paper says approximately half of all cancers harbor a TP53 mutation and describes TP53 alteration as “the most frequent event in human cancer.” Together, these support the citing sentence’s characterization of TP53 as the most commonly mutated gene. (LLM, conf=0.88)
- Partly supportedcites [52] The ICGC/TCGA Pan-Cancer Analysis of Whole Genomes Consortium Pan-cancer analysis of whole genomes. Nature 578, 82–93 (2020). sourceExperimental — accuracy not yet measured
The ‘Panorama of driver mutations in cancer’ section reports TP53 driver mutations in 954 tumours, supporting that TP53 is commonly mutated in the studied cohort. Our copy does not establish that it is the single most commonly mutated gene across human cancers. (LLM, conf=0.83)
plain- Asserted: passes — The authors put it forward as true.
- Checkable: passes — It can be checked against evidence.
- Load-bearing: fails — The paper’s conclusions may not depend on it.
- Based: passes — The paper gives a reason why it holds.
Probably not a substantial claim. The paper’s conclusions may not depend on it.
- Supported
The cited sources that could be checked couldn’t confirm or dispute this claim.
In the paper
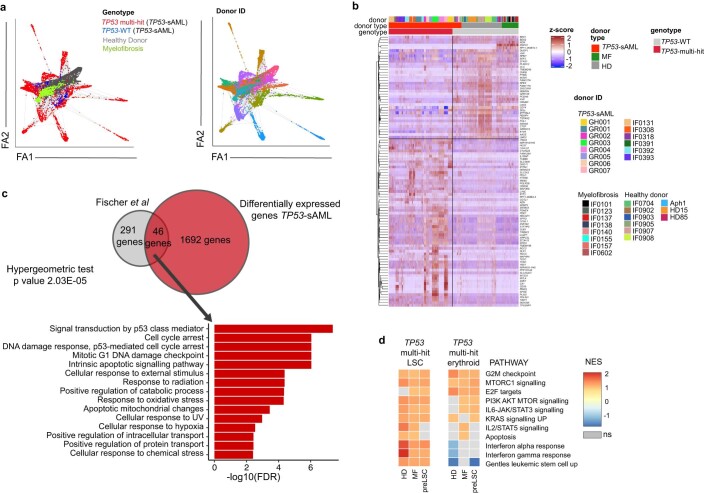
“TP53-sAML differed from de novo AML with an enrichment into HSC and early erythroid populations, whereas de novo AML was enriched in myeloid progenitors (Fig. 2c,d)25.”
§ Single-cell multi-omics identifies chronic inflammation as a driver of TP53-mutant leukemic evolution > Results > Molecular signatures of TP53-mutant-mediated transformation
What the sources say
- Could not verifycites [25] Van Galen, P. et al. Single-cell RNA-seq reveals AML hierarchies relevant to disease progression and immunity. Cell 176, 1265–1281 (2019). sourceExperimental — accuracy not yet measured
The Results section on AML cellular hierarchies links clusters enriched for TP53 mutations to differing cell compositions, but does not compare TP53-associated secondary AML with de novo AML. Searches for secondary AML, early erythroid populations, and de novo AML with myeloid progenitors found no passage establishing the claimed contrast. The indexed passages provide no page numbers. (LLM, conf=0.73)
plaincorrelational- Asserted: passes — The authors put it forward as true.
- Checkable: passes — It can be checked against evidence.
- Load-bearing: passes — The paper’s conclusions depend on it.
- Based: passes — The paper gives a reason why it holds.
It may state two separate claims as one.
- Could not verify
The sources with a verdict support this claim; the rest weren’t checked yet, have no full text we could read, or their verdicts aren’t rated yet.
In the paper
“There is emerging evidence that clonal HSCs can become inflammation-adapted47–49 and by altering the response to inflammatory challenges, mutations can thus confer a fitness advantage to HSCs.”
§ Single-cell multi-omics identifies chronic inflammation as a driver of TP53-mutant leukemic evolution > Discussion
What the sources say
- Supportedcites [47] Caiado, F., Pietras, E. M. & Manz, M. G. Inflammation as a regulator of hematopoietic stem cell function in disease, aging, and clonal selection. J. Exp. Med. 218, e20201541 (2021). source
The “Inflammation-adapted mutant HSCs” section reports evidence that CHIP-mutant HSPCs may adapt to sustained inflammatory cues. It also states that mutations making HSCs insensitive to inflammatory effects can confer a relative fitness advantage in an inflammatory environment. (LLM, conf=0.94)
- Supportedcites [48] Hormaechea-Agulla, D. et al. Chronic infection drives Dnmt3a-loss-of-function clonal hematopoiesis via IFNγ signaling. Cell Stem Cell 28, 1428–1442 (2021). source
The Discussion reports that Dnmt3a-loss-of-function HSCs resist stress-induced apoptosis and differentiation more than wild-type HSCs, conferring a selection advantage under inflammatory conditions. Its summary also states that chronic IFNγ signaling drives expansion of these clones in a mouse model, supporting the claim that mutations can alter inflammatory responses and confer HSC fitness advantages. (LLM, conf=0.94)
- Not checked — no full text of the sourcecites [49] Avagyan, S. et al. Resistance to inflammation underlies enhanced fitness in clonal hematopoiesis. Science 374, 768–772 (2021). source
hedgedconditional- Asserted: passes — The authors put it forward as true.
- Checkable: passes — It can be checked against evidence.
- Load-bearing: passes — The paper’s conclusions depend on it.
- Based: passes — The paper gives a reason why it holds.
Probably not a substantial claim. It may state two separate claims as one.
- Supported
Every source the paper cites for this claim was checked and supports it.
In the paper
“Notwithstanding the established role of TP53 mutation in MPN transformation, TP53-mutant subclones are also present in 16% of chronic phase MPN (CP-MPN), and in most cases, this does not herald the development of TP53-sAML (ref. 15).”
§ Single-cell multi-omics identifies chronic inflammation as a driver of TP53-mutant leukemic evolution > Main
What the sources say
- Supportedcites [15] Kubesova, B. et al. Low-burden TP53 mutations in chronic phase of myeloproliferative neoplasms: association with age, hydroxyurea administration, disease type and JAK2 mutational status. Leukemia 32, 450–461 (2018). source
The Results section on ultra-deep NGS reports TP53 mutations in 41 of 254 treated chronic-phase MPN patients (16.1%). The Results section on leukemic transformation reports AML in 3 of 50 patients with TP53 mutations, with TP53-mutated AML confirmed in one; this supports the claim that transformation to TP53-mutated AML did not occur in most observed cases. The finding is bounded by the study cohort and follow-up. (LLM, conf=0.92)
plain- Asserted: passes — The authors put it forward as true.
- Checkable: passes — It can be checked against evidence.
- Load-bearing: fails — The paper’s conclusions may not depend on it.
- Based: passes — The paper gives a reason why it holds.
Probably not a substantial claim. The paper’s conclusions may not depend on it. It may state two separate claims as one.
- Supported
Every source the paper cites for this claim was checked and supports it.
In the paper
“Trp53tm2Tyj (ref. 88), Commd10Tg(Vav1-icre)A2Kio (ref. 89; Jackson Laboratory, 008610) and Tg(Tal1-cre/ERT)42-056Jrg (ref. 90) have been previously described.”
§ Single-cell multi-omics identifies chronic inflammation as a driver of TP53-mutant leukemic evolution > Methods > Mouse bone marrow chimeras and ethical approval
What the sources say
- Supportedcites [89] De Boer, J. et al. Transgenic mice with hematopoietic and lymphoid specific expression of Cre. Eur. J. Immunol. 33, 314–325 (2003). source
Section 2.1 describes the generation of Vav-iCre transgenic mice and says one Vav-iCre line was selected for further analysis. This supports the citation’s use to identify a previously described Vav-iCre mouse line. (LLM, conf=0.88)
plain- Asserted: passes — The authors put it forward as true.
- Checkable: passes — It can be checked against evidence.
- Load-bearing: fails — The paper’s conclusions may not depend on it.
- Based: passes — The paper gives a reason why it holds.
Probably not a substantial claim. The paper’s conclusions may not depend on it.
- Supported
The sources with a verdict support this claim; the rest weren’t checked yet, have no full text we could read, or their verdicts aren’t rated yet.
In the paper
“Inflammation is a cardinal regulator of HSC function with many effects on HSC fate and function47, including proliferation-induced DNA-damage and depletion of HSCs41.”
§ Single-cell multi-omics identifies chronic inflammation as a driver of TP53-mutant leukemic evolution > Discussion
What the sources say
- Supportedcites [47] Caiado, F., Pietras, E. M. & Manz, M. G. Inflammation as a regulator of hematopoietic stem cell function in disease, aging, and clonal selection. J. Exp. Med. 218, e20201541 (2021). source
The citation attached to this source supports the broad claim that inflammation regulates HSC function and affects HSC fate. The Introduction describes HSCs integrating inflammatory cues and says inflammation impacts their function; the Concluding remarks describe the varied functional effects of inflammatory challenges. The more specific DNA-damage and depletion clause carries a different citation. (LLM, conf=0.92)
- Not checked — no full text of the sourcecites [41] Walter, D. et al. Exit from dormancy provokes DNA-damage-induced attrition in haematopoietic stem cells. Nature 520, 549–552 (2015). source
plaindirect- Asserted: passes — The authors put it forward as true.
- Checkable: passes — It can be checked against evidence.
- Load-bearing: passes — The paper’s conclusions depend on it.
- Based: passes — The paper gives a reason why it holds.
Probably not a substantial claim. It may state two separate claims as one.
- Supported
The cited sources that could be checked couldn’t confirm or dispute this claim.
In the paper
“Integration of single-cell transcriptomes and diffusion map analysis of HSPCs from TP53-sAML patients showed that TP53 multihit HSPCs clustered separately from TP53-WT pre-LSCs in two distinct populations with enrichment of LSC and erythroid-associated transcription, respectively (Fig. 2a and Supplementary Table 3), and a differentiation trajectory toward the erythroid-biased population (Fig. 2b),”
§ Single-cell multi-omics identifies chronic inflammation as a driver of TP53-mutant leukemic evolution > Results > Molecular signatures of TP53-mutant-mediated transformation
What the sources say
- Could not verifycites [22] Mesa, R. A. et al. Leukemic transformation in myelofibrosis with myeloid metaplasia: a single-institution experience with 91 cases. Blood 105, 973–977 (2005). sourceExperimental — accuracy not yet measured
The Methods and karyotypic-changes sections describe bone marrow histology and cytogenetic analysis in patients with myelofibrosis; no page numbers are available in our copy. Searches for TP53 multihit HSPCs, single-cell transcriptomes, diffusion maps, and an erythroid-biased differentiation trajectory found no passage addressing the claim. (LLM, conf=0.78)
- Could not verifycites [23] Passamonti, F. et al. Leukemic transformation of polycythemia vera: a single center study of 23 patients. Cancer 104, 1032–1036 (2005). sourceExperimental — accuracy not yet measured
The Cytogenetic Findings and Discussion passages (page numbers unavailable) report karyotypes and clinical outcomes in patients with leukemia following polycythemia vera. Searches for TP53 multihit HSPCs, single-cell transcriptomes, diffusion maps, and an erythroid-biased differentiation trajectory found no passage addressing the claimed populations or trajectory. (LLM, conf=0.76)
plaincorrelational- Asserted: passes — The authors put it forward as true.
- Checkable: passes — It can be checked against evidence.
- Load-bearing: passes — The paper’s conclusions depend on it.
- Based: passes — The paper gives a reason why it holds.
It may state two separate claims as one.
- Could not verify
A result the paper reports from its own data — it cites no other source for it, so there is none to check. The quote shows it is in the paper.
In the paper
“A similar enrichment was observed for TP53 multihit cells when mapped on a Lin-CD34+ MF cellular hierarchy (Extended Data Fig. 5d,e), with erythroid-biased populations being highly enriched in immunophenotypically defined MEPs (Extended Data Fig. 5f).”
§ Single-cell multi-omics identifies chronic inflammation as a driver of TP53-mutant leukemic evolution > Results > Molecular signatures of TP53-mutant-mediated transformation
plaincorrelational- Asserted: passes — The authors put it forward as true.
- Checkable: passes — It can be checked against evidence.
- Load-bearing: passes — The paper’s conclusions depend on it.
- Based: passes — The paper gives a reason why it holds.
It may state two separate claims as one.
A result the paper reports from its own data — it cites no other source for it, so there is none to check. The quote shows it is in the paper.
In the paper
“TP53 multihit LSCs showed enrichment of cell cycle, inflammatory, signaling pathways and LSC-associated transcription, whereas TP53 multihit erythroid cells were depleted of the latter (Extended Data Fig. 4d).”
§ Single-cell multi-omics identifies chronic inflammation as a driver of TP53-mutant leukemic evolution > Results > Molecular signatures of TP53-mutant-mediated transformation
plaincorrelational- Asserted: passes — The authors put it forward as true.
- Checkable: passes — It can be checked against evidence.
- Load-bearing: passes — The paper’s conclusions depend on it.
- Based: passes — The paper gives a reason why it holds.
It may state two separate claims as one.
In the paper
“Force-directed graph analysis revealed separate clustering of TP53-mutant HSPC in comparison with healthy and MF donor cells, with a high degree of interpatient heterogeneity (Extended Data Fig. 4a) as observed in other hematopoietic malignancies21.”
§ Single-cell multi-omics identifies chronic inflammation as a driver of TP53-mutant leukemic evolution > Results > Molecular signatures of TP53-mutant-mediated transformation
What the sources say
- Not checked — no full text of the sourcecites [21] Ledergor, G. et al. Single cell dissection of plasma cell heterogeneity in symptomatic and asymptomatic myeloma. Nat. Med. 24, 1867–1876 (2018). source
plaincorrelational- Asserted: passes — The authors put it forward as true.
- Checkable: passes — It can be checked against evidence.
- Load-bearing: unclear — It is unclear whether the paper’s conclusions depend on it.
- Based: passes — The paper gives a reason why it holds.
It may state two separate claims as one.
A result the paper reports from its own data — it cites no other source for it, so there is none to check. The quote shows it is in the paper.
In the paper
“TP53 knock-down led to increased erythroid (CD71+CD235a+) and decreased myeloid (CD14+/CD15+/CD11b+) differentiation in vitro (Fig. 2i), and consequently decreased CEBPA/GATA1 expression ratio (Fig. 2j), suggesting that p53 may directly contribute to the aberrant myelo-erythroid differentiation observed.”
§ Single-cell multi-omics identifies chronic inflammation as a driver of TP53-mutant leukemic evolution > Results > Molecular signatures of TP53-mutant-mediated transformation
plaindirect- Asserted: passes — The authors put it forward as true.
- Checkable: passes — It can be checked against evidence.
- Load-bearing: passes — The paper’s conclusions depend on it.
- Based: passes — The paper gives a reason why it holds.
It may state two separate claims as one.
A result the paper reports from its own data — it cites no other source for it, so there is none to check. The quote shows it is in the paper.
In the paper
“HSPC immunophenotype was similar for pre-TP53-sAML and CP TP53-MPN patients (Extended Data Fig. 9a–c), and clearly distinct from the TP53-sAML stage (Extended Data Fig. 9d).”
§ Single-cell multi-omics identifies chronic inflammation as a driver of TP53-mutant leukemic evolution > Results > Inflammation promotes TP53-associated clonal dominance
boostedn = 6- Asserted: passes — The authors put it forward as true.
- Checkable: passes — It can be checked against evidence.
- Load-bearing: passes — The paper’s conclusions depend on it.
- Based: passes — The paper gives a reason why it holds.
It may state two separate claims as one.
A result the paper reports from its own data — it cites no other source for it, so there is none to check. The quote shows it is in the paper.
In the paper
“Similar to the Vav-iCre model, poly(I:C) treatment promoted the selection of myeloid Trp53-mutant cells in the PB (Extended Data Fig. 10k), with a myeloid bias induced by the inflammatory stimulus in PB leukocytes specifically associated with Trp53-mutation (Fig. 5i,j and Extended Data Fig. 10l).”
§ Single-cell multi-omics identifies chronic inflammation as a driver of TP53-mutant leukemic evolution > Results > Inflammation promotes TP53-associated clonal dominance
plaindirect- Asserted: passes — The authors put it forward as true.
- Checkable: passes — It can be checked against evidence.
- Load-bearing: passes — The paper’s conclusions depend on it.
- Based: passes — The paper gives a reason why it holds.
It may state two separate claims as one.
A result the paper reports from its own data — it cites no other source for it, so there is none to check. The quote shows it is in the paper.
In the paper
“Multiple TP53 mutations were present in one-third (n = 11) of patients, including 2 patients with 3 TP53 mutations; 82% (18 of 22) of patients with a single TP53 mutation showed a high variant allelic frequency (VAF) of >50%.”
§ Single-cell multi-omics identifies chronic inflammation as a driver of TP53-mutant leukemic evolution > Results > Convergent clonal evolution in TP53 leukemic transformation
plainn = 11- Asserted: passes — The authors put it forward as true.
- Checkable: passes — It can be checked against evidence.
- Load-bearing: unclear — It is unclear whether the paper’s conclusions depend on it.
- Based: passes — The paper gives a reason why it holds.
It may state two separate claims as one.
A result the paper reports from its own data — it cites no other source for it, so there is none to check. The quote shows it is in the paper.
In the paper
“A second ‘TP53-sAML LSC’ cluster allowed us to identify a p53LSC-signature, which can predict outcomes in AML independently of TP53 status.”
§ Single-cell multi-omics identifies chronic inflammation as a driver of TP53-mutant leukemic evolution > Discussion
plaincorrelational- Asserted: passes — The authors put it forward as true.
- Checkable: passes — It can be checked against evidence.
- Load-bearing: passes — The paper’s conclusions depend on it.
- Based: passes — The paper gives a reason why it holds.
It may state two separate claims as one.
A result the paper reports from its own data — it cites no other source for it, so there is none to check. The quote shows it is in the paper.
In the paper
“Analysis of the BeatAML cohort revealed increased GATA1 and reduced CEBPA expression in association with TP53 mutation (Extended Data Fig. 5l), with consequent reduction in the CEBPA/GATA1 expression ratio (Fig. 2h).”
§ Single-cell multi-omics identifies chronic inflammation as a driver of TP53-mutant leukemic evolution > Results > Molecular signatures of TP53-mutant-mediated transformation
plaincorrelational- Asserted: passes — The authors put it forward as true.
- Checkable: passes — It can be checked against evidence.
- Load-bearing: passes — The paper’s conclusions depend on it.
- Based: passes — The paper gives a reason why it holds.
It may state two separate claims as one.
A result the paper reports from its own data — it cites no other source for it, so there is none to check. The quote shows it is in the paper.
In the paper
“Compared to TP53-sAML samples, CP TP53-MPN had a lower VAF and number of TP53 mutations (Extended Data Fig. 8a–d).”
§ Single-cell multi-omics identifies chronic inflammation as a driver of TP53-mutant leukemic evolution > Results > Inflammation promotes TP53-associated clonal dominance
plainn = 6- Asserted: passes — The authors put it forward as true.
- Checkable: passes — It can be checked against evidence.
- Load-bearing: passes — The paper’s conclusions depend on it.
- Based: passes — The paper gives a reason why it holds.
It may state two separate claims as one.
A result the paper reports from its own data — it cites no other source for it, so there is none to check. The quote shows it is in the paper.
In the paper
“Pre-LSC LTC-IC activity was similar to HDs and increased compared to MF patients, with preserved terminal differentiation capacity and confirmed TP53 WT genotype (Fig. 3i and Extended Data Fig. 7d–g).”
§ Single-cell multi-omics identifies chronic inflammation as a driver of TP53-mutant leukemic evolution > Results > TP53-WT cells display self-renewal and differentiation defects
plain- Asserted: passes — The authors put it forward as true.
- Checkable: passes — It can be checked against evidence.
- Load-bearing: passes — The paper’s conclusions depend on it.
- Based: passes — The paper gives a reason why it holds.
It may state two separate claims as one.
A result the paper reports from its own data — it cites no other source for it, so there is none to check. The quote shows it is in the paper.
In the paper
“In total, 9 and 44 genes were retained from the p53-all-cells and p53-LSC gene sets, respectively.”
§ Single-cell multi-omics identifies chronic inflammation as a driver of TP53-mutant leukemic evolution > Methods > Prognostic signatures and Cox-regression survival models
plain- Asserted: passes — The authors put it forward as true.
- Checkable: passes — It can be checked against evidence.
- Load-bearing: fails — The paper’s conclusions may not depend on it.
- Based: passes — The paper gives a reason why it holds.
Probably not a substantial claim. The paper’s conclusions may not depend on it. It may state two separate claims as one.
A result the paper reports from its own data — it cites no other source for it, so there is none to check. The quote shows it is in the paper.
In the paper
“In short-term liquid culture, pre-LSCs showed reduced clonogenicity, with retained CD34 expression and decreased proliferation (Fig. 3j and Extended Data Fig. 7h–i).”
§ Single-cell multi-omics identifies chronic inflammation as a driver of TP53-mutant leukemic evolution > Results > TP53-WT cells display self-renewal and differentiation defects
plaincorrelational- Asserted: passes — The authors put it forward as true.
- Checkable: passes — It can be checked against evidence.
- Load-bearing: passes — The paper’s conclusions depend on it.
- Based: passes — The paper gives a reason why it holds.
It may state two separate claims as one.
A result the paper reports from its own data — it cites no other source for it, so there is none to check. The quote shows it is in the paper.
In the paper
“Erythroid scores were increased in TP53 mutant compared to TP53-WT AML, whereas there was no significant difference in myeloid scores (Fig. 2e–f, Extended Data Fig. 5g–j and scores described in Supplementary Table 3).”
§ Single-cell multi-omics identifies chronic inflammation as a driver of TP53-mutant leukemic evolution > Results > Molecular signatures of TP53-mutant-mediated transformation
plain- Asserted: passes — The authors put it forward as true.
- Checkable: passes — It can be checked against evidence.
- Load-bearing: passes — The paper’s conclusions depend on it.
- Based: passes — The paper gives a reason why it holds.
It may state two separate claims as one.
A result the paper reports from its own data — it cites no other source for it, so there is none to check. The quote shows it is in the paper.
In the paper
“CNAs were present in all patients analyzed, and 87% (20 of 23) had a complex karyotype (≥3 CNAs; Extended Data Fig. 1a–g).”
§ Single-cell multi-omics identifies chronic inflammation as a driver of TP53-mutant leukemic evolution > Results > Convergent clonal evolution in TP53 leukemic transformation
plain- Asserted: passes — The authors put it forward as true.
- Checkable: passes — It can be checked against evidence.
- Load-bearing: unclear — It is unclear whether the paper’s conclusions depend on it.
- Based: passes — The paper gives a reason why it holds.
It may state two separate claims as one.
A result the paper reports from its own data — it cites no other source for it, so there is none to check. The quote shows it is in the paper.
In the paper
“Mice developed leukemia in 27–31 weeks with high numbers of human CD34+ myeloid blast cells in the bone marrow (BM; Extended Data Fig. 3b–d), with a progenitor phenotype, TP53 mutations and CNAs similar to the dominant clone from patients’ primary cells (Fig. 1i and Extended Data Fig. 3e–l).”
§ Single-cell multi-omics identifies chronic inflammation as a driver of TP53-mutant leukemic evolution > Results > Convergent clonal evolution in TP53 leukemic transformation
plaincorrelationaln = 2- Asserted: passes — The authors put it forward as true.
- Checkable: passes — It can be checked against evidence.
- Load-bearing: passes — The paper’s conclusions depend on it.
- Based: passes — The paper gives a reason why it holds.
It may state two separate claims as one.
A result the paper reports from its own data — it cites no other source for it, so there is none to check. The quote shows it is in the paper.
In the paper
“Crucially, the fitness advantage of Trp53-mutant HSCs and LSKs was exerted both through an increase in the numbers of Trp53R172H/+ HSPCs and a reduction in the numbers of WT competitors (Fig. 5d,e and Extended Data Fig. 10f,g).”
§ Single-cell multi-omics identifies chronic inflammation as a driver of TP53-mutant leukemic evolution > Results > Inflammation promotes TP53-associated clonal dominance
plaindirect- Asserted: passes — The authors put it forward as true.
- Checkable: passes — It can be checked against evidence.
- Load-bearing: passes — The paper’s conclusions depend on it.
- Based: passes — The paper gives a reason why it holds.
It may state two separate claims as one.
A result the paper reports from its own data — it cites no other source for it, so there is none to check. The quote shows it is in the paper.
In the paper
“Sorted CD34+ TP53-multi-hit cells exhibited potential for erythroid differentiation in vivo and in vitro, supporting that this occurs downstream of the LSC population (Extended Data Fig. 5a–c).”
§ Single-cell multi-omics identifies chronic inflammation as a driver of TP53-mutant leukemic evolution > Results > Molecular signatures of TP53-mutant-mediated transformation
plaindirect- Asserted: passes — The authors put it forward as true.
- Checkable: passes — It can be checked against evidence.
- Load-bearing: passes — The paper’s conclusions depend on it.
- Based: passes — The paper gives a reason why it holds.
It may state two separate claims as one.
A result the paper reports from its own data — it cites no other source for it, so there is none to check. The quote shows it is in the paper.
In the paper
“We next investigated the expression of key transcription factors for erythroid/granulomonocytic commitment and found increased GATA1 expression in Lin-CD34+ TP53 multihit HSPCs, whereas CEBPA was only expressed at low levels (Fig. 2g).”
§ Single-cell multi-omics identifies chronic inflammation as a driver of TP53-mutant leukemic evolution > Results > Molecular signatures of TP53-mutant-mediated transformation
plain- Asserted: passes — The authors put it forward as true.
- Checkable: passes — It can be checked against evidence.
- Load-bearing: passes — The paper’s conclusions depend on it.
- Based: passes — The paper gives a reason why it holds.
It may state two separate claims as one.
A result the paper reports from its own data — it cites no other source for it, so there is none to check. The quote shows it is in the paper.
In the paper
“High p53LSC-signature score (Extended Data Fig. 6a,b) was strongly associated with TP53 mutation status, although some TP53-WT patients also showed a high p53LSC score.”
§ Single-cell multi-omics identifies chronic inflammation as a driver of TP53-mutant leukemic evolution > Results > Molecular signatures of TP53-mutant-mediated transformation
boostedcorrelational- Asserted: passes — The authors put it forward as true.
- Checkable: passes — It can be checked against evidence.
- Load-bearing: passes — The paper’s conclusions depend on it.
- Based: passes — The paper gives a reason why it holds.
It may state two separate claims as one.
A result the paper reports from its own data — it cites no other source for it, so there is none to check. The quote shows it is in the paper.
In the paper
“Pre-LSCs were enriched in HSC-associated genes and mapped onto HSC clusters in healthy and MF donor hematopoietic hierarchies (Fig. 3a,b).”
§ Single-cell multi-omics identifies chronic inflammation as a driver of TP53-mutant leukemic evolution > Results > TP53-WT cells display self-renewal and differentiation defects
plaincorrelational- Asserted: passes — The authors put it forward as true.
- Checkable: passes — It can be checked against evidence.
- Load-bearing: passes — The paper’s conclusions depend on it.
- Based: passes — The paper gives a reason why it holds.
It may state two separate claims as one.
In the paper
“Numbers of WT competitor erythroid progenitors were reduced upon poly(I:C) treatment as expected38, whereas Trp53-mutation was associated with an increase in erythroid progenitors that was not impacted by inflammation (Fig. 5k and Extended Data Fig. 10n) in line with the erythroid bias detected in patient samples.”
§ Single-cell multi-omics identifies chronic inflammation as a driver of TP53-mutant leukemic evolution > Results > Inflammation promotes TP53-associated clonal dominance
What the sources say
- Not checked — no full text of the sourcecites [38] Libregts, S. F. et al. Chronic IFN-γ production in mice induces anemia by reducing erythrocyte life span and inhibiting erythropoiesis through an IRF-1/PU.1 axis. Blood 118, 2578–2588 (2011). source
plaindirect- Asserted: passes — The authors put it forward as true.
- Checkable: passes — It can be checked against evidence.
- Load-bearing: passes — The paper’s conclusions depend on it.
- Based: passes — The paper gives a reason why it holds.
It may state two separate claims as one.
A result the paper reports from its own data — it cites no other source for it, so there is none to check. The quote shows it is in the paper.
In the paper
“To explore this hypothesis, we carried out scVelo analysis, which showed the absence of a transcriptional differentiation trajectory in pre-LSCs, unlike HD HSCs (Fig. 3d).”
§ Single-cell multi-omics identifies chronic inflammation as a driver of TP53-mutant leukemic evolution > Results > TP53-WT cells display self-renewal and differentiation defects
plain- Asserted: passes — The authors put it forward as true.
- Checkable: passes — It can be checked against evidence.
- Load-bearing: passes — The paper’s conclusions depend on it.
- Based: passes — The paper gives a reason why it holds.
It may state two separate claims as one.
A result the paper reports from its own data — it cites no other source for it, so there is none to check. The quote shows it is in the paper.
In the paper
“Pre-LSCs showed increased expression of HSC and Wnt β-catenin genes and decreased cell cycle genes as compared to HD and MF cells (Fig. 3e–g and Supplementary Table 3).”
§ Single-cell multi-omics identifies chronic inflammation as a driver of TP53-mutant leukemic evolution > Results > TP53-WT cells display self-renewal and differentiation defects
plaincorrelational- Asserted: passes — The authors put it forward as true.
- Checkable: passes — It can be checked against evidence.
- Load-bearing: passes — The paper’s conclusions depend on it.
- Based: passes — The paper gives a reason why it holds.
It may state two separate claims as one.
A result the paper reports from its own data — it cites no other source for it, so there is none to check. The quote shows it is in the paper.
In the paper
“A minor homozygous TP53-mutated clone initially present in one CP TP53-MPN patient was undetectable after 4 years (Extended Data Fig. 9h).”
§ Single-cell multi-omics identifies chronic inflammation as a driver of TP53-mutant leukemic evolution > Results > Inflammation promotes TP53-associated clonal dominance
plainSingle case- Asserted: passes — The authors put it forward as true.
- Checkable: passes — It can be checked against evidence.
- Load-bearing: fails — The paper’s conclusions may not depend on it.
- Based: passes — The paper gives a reason why it holds.
Probably not a substantial claim. The paper’s conclusions may not depend on it.
A result the paper reports from its own data — it cites no other source for it, so there is none to check. The quote shows it is in the paper.
In the paper
“CNA analysis using single-cell transcriptomes showed that all TP53 multihit clones harbored at least one highly clonally-dominant CNA, with very few TP53-mutant cells without evidence of a CNA (3.4 ± 1.2%) and an additional 5 of 14 (36%) patients also showing cytogenetically-distinct subclones (Fig. 1f,g and Extended Data Fig. 2p,q).”
§ Single-cell multi-omics identifies chronic inflammation as a driver of TP53-mutant leukemic evolution > Results > Convergent clonal evolution in TP53 leukemic transformation
plaincorrelational- Asserted: passes — The authors put it forward as true.
- Checkable: passes — It can be checked against evidence.
- Load-bearing: passes — The paper’s conclusions depend on it.
- Based: passes — The paper gives a reason why it holds.
It may state two separate claims as one.
A result the paper reports from its own data — it cites no other source for it, so there is none to check. The quote shows it is in the paper.
In the paper
“Analysis of a large AML cohort also revealed overexpression of erythroid genes as a more widespread phenomenon in TP53-mutant AML, with disrupted balance of GATA1 and CEBPA expression.”
§ Single-cell multi-omics identifies chronic inflammation as a driver of TP53-mutant leukemic evolution > Discussion
plaincorrelational- Asserted: passes — The authors put it forward as true.
- Checkable: passes — It can be checked against evidence.
- Load-bearing: unclear — It is unclear whether the paper’s conclusions depend on it.
- Based: passes — The paper gives a reason why it holds.
It may state two separate claims as one.
What the paper did — it cites no source for this, so there is none to check. The quote shows it is in the paper.
In the paper
“CNAs identified by inferCNV were manually curated by removing those with size <10 kb, merging adjacent CNA calls with identical CNA status into larger CNA intervals and comparing them to SNP-Array bulk CNA calls.”
§ Single-cell multi-omics identifies chronic inflammation as a driver of TP53-mutant leukemic evolution > Methods > CNA inference from single-cell transcriptomes
plain- Asserted: passes — The authors put it forward as true.
- Checkable: passes — It can be checked against evidence.
- Load-bearing: passes — The paper’s conclusions depend on it.
- Based: passes — The paper gives a reason why it holds.
Probably not a substantial claim. It may state two separate claims as one.
What the paper did — it cites no source for this, so there is none to check. The quote shows it is in the paper.
In the paper
“Experiments involving the isolation of human HSPCs included single color stained controls (CompBeads, BD Biosciences) and Fluorescence Minus One controls (FMOs).”
§ Single-cell multi-omics identifies chronic inflammation as a driver of TP53-mutant leukemic evolution > Methods > Fluorescence-activated cell sorting (FACS) and single-cell isolation
plain- Asserted: passes — The authors put it forward as true.
- Checkable: passes — It can be checked against evidence.
- Load-bearing: fails — The paper’s conclusions may not depend on it.
- Based: passes — The paper gives a reason why it holds.
Probably not a substantial claim. The paper’s conclusions may not depend on it.
What the paper did — it cites no source for this, so there is none to check. The quote shows it is in the paper.
In the paper
“TARGET-seq analysis uniquely enabled the comparison of TP53 multihit HSPC to TP53-WT preleukemic stem cells (‘pre-LSCs’) from the same TP53-sAML patients as well as healthy and MF donors, to derive a specific TP53 multihit signature including known p53-pathway genes (Extended Data Fig. 4b,c).”
§ Single-cell multi-omics identifies chronic inflammation as a driver of TP53-mutant leukemic evolution > Results > Molecular signatures of TP53-mutant-mediated transformation
plaincorrelational- Asserted: passes — The authors put it forward as true.
- Checkable: passes — It can be checked against evidence.
- Load-bearing: passes — The paper’s conclusions depend on it.
- Based: passes — The paper gives a reason why it holds.
It may state two separate claims as one.
What the paper did — it cites no source for this, so there is none to check. The quote shows it is in the paper.
In the paper
“A series of stringent filtering steps were applied to reduce the rate of false positive calls.”
§ Single-cell multi-omics identifies chronic inflammation as a driver of TP53-mutant leukemic evolution > Methods > SNP array sample preparation, copy number variant and loss of heterozygosity analysis
plaindirect- Asserted: passes — The authors put it forward as true.
- Checkable: passes — It can be checked against evidence.
- Load-bearing: passes — The paper’s conclusions depend on it.
- Based: passes — The paper gives a reason why it holds.
Probably not a substantial claim.
A conclusion the paper draws from its own results — it cites no other source for it, so there is none to check. The quote shows it is in the paper.
In the paper
“In summary, the dominant leukemic clones in TP53-sAML were invariably characterized by multiple hits affecting TP53 (multihit state), indicating strong selective pressure for complete loss of WT TP53, together with the gain of CNAs and complex cytogenetic evolution, with very few TP53 multihit cells with a normal karyotype (Fig. 1j).”
§ Single-cell multi-omics identifies chronic inflammation as a driver of TP53-mutant leukemic evolution > Results > Convergent clonal evolution in TP53 leukemic transformation
boostedcorrelational- Asserted: passes — The authors put it forward as true.
- Checkable: passes — It can be checked against evidence.
- Load-bearing: passes — The paper’s conclusions depend on it.
- Based: passes — The paper gives a reason why it holds.
It may state two separate claims as one.
What the paper did — it cites no source for this, so there is none to check. The quote shows it is in the paper.
In the paper
“After these QC steps, 7,123 cells passed QC for batch 1, 5,779 for batch 2 and 6,319 for batch 3 (79.3%, 68.9% and 80.3% of cells processed, respectively).”
§ Single-cell multi-omics identifies chronic inflammation as a driver of TP53-mutant leukemic evolution > Methods > Single-cell 3′-biased RNA-sequencing data preprocessing
plain- Asserted: passes — The authors put it forward as true.
- Checkable: passes — It can be checked against evidence.
- Load-bearing: fails — The paper’s conclusions may not depend on it.
- Based: passes — The paper gives a reason why it holds.
Probably not a substantial claim. The paper’s conclusions may not depend on it. It may state two separate claims as one.
What the paper did — it cites no source for this, so there is none to check. The quote shows it is in the paper.
In the paper
“Run quality control included %DP_100X (>95%), %DP_200X (>90%), number of reads per sample and % reads q30 forward and reverse (>85%), read quality mean (>30) and percentage of mapped reads (>75%).”
§ Single-cell multi-omics identifies chronic inflammation as a driver of TP53-mutant leukemic evolution > Methods > Targeted bulk sequencing
plain- Asserted: passes — The authors put it forward as true.
- Checkable: passes — It can be checked against evidence.
- Load-bearing: fails — The paper’s conclusions may not depend on it.
- Based: passes — The paper gives a reason why it holds.
Probably not a substantial claim. The paper’s conclusions may not depend on it. It may state two separate claims as one.
A claim is checked only against the cited paper’s full text, never its abstract, and none is available for its sources.
In the paper
“CEBPA knockout or mutation is reported to cause a myeloid to erythroid lineage switch with increased expression of GATA1 (refs. 29,30) and, in addition, GATA1 interacts with and inhibits p53 (ref. 45).”
§ Single-cell multi-omics identifies chronic inflammation as a driver of TP53-mutant leukemic evolution > Discussion
What the sources say
- Not checked — no full text of the sourcecites [29] Wagner, K. et al. Absence of the transcription factor CCAAT enhancer binding protein α results in loss of myeloid identity in bcr/abl-induced malignancy. Proc. Natl Acad. Sci. USA 103, 6338–6343 (2006). source
- Not checked — no full text of the sourcecites [30] Bereshchenko, O. et al. Hematopoietic stem cell expansion precedes the generation of committed myeloid leukemia-initiating cells in C/EBPα mutant AML. Cancer Cell 16, 390–400 (2009). source
- Not checked — no full text of the sourcecites [45] Trainor, C. D., Mas, C., Archambault, P., di Lello, P. & Omichinski, J. G. GATA-1 associates with and inhibits p53. Blood 114, 165–173 (2009). source
plaindirect- Asserted: passes — The authors put it forward as true.
- Checkable: passes — It can be checked against evidence.
- Load-bearing: passes — The paper’s conclusions depend on it.
- Based: passes — The paper gives a reason why it holds.
Probably not a substantial claim. It may state two separate claims as one.
What the paper did — it cites no source for this, so there is none to check. The quote shows it is in the paper.
In the paper
“Quality control was performed using the following parameters: number of genes detected >500, percentage of ERCC-derived reads <35%, percentage of mitochondrial reads <0.25% and percentage of unmapped reads <75%. Cells with less than 2,000 reads in batch1, 5,000 reads in batch2 and 20,000 reads in batch3 were further excluded.”
§ Single-cell multi-omics identifies chronic inflammation as a driver of TP53-mutant leukemic evolution > Methods > Single-cell 3′-biased RNA-sequencing data preprocessing
plain- Asserted: passes — The authors put it forward as true.
- Checkable: passes — It can be checked against evidence.
- Load-bearing: fails — The paper’s conclusions may not depend on it.
- Based: passes — The paper gives a reason why it holds.
Probably not a substantial claim. The paper’s conclusions may not depend on it. It may state two separate claims as one.
A conclusion the paper draws from its own results — it cites no other source for it, so there is none to check. The quote shows it is in the paper.
In the paper
“Collectively, these results support a model whereby chronic inflammation promotes the survival and genetic evolution of TP53-mutated cells while suppressing WT hematopoiesis, ultimately promoting the clonal expansion of TP53-mutant HSPCs (Fig. 6e).”
§ Single-cell multi-omics identifies chronic inflammation as a driver of TP53-mutant leukemic evolution > Results > Inflammation promotes the genetic evolution of Trp53-mutant HSPC
plaindirect- Asserted: passes — The authors put it forward as true.
- Checkable: passes — It can be checked against evidence.
- Load-bearing: passes — The paper’s conclusions depend on it.
- Based: passes — The paper gives a reason why it holds.
It may state two separate claims as one.
In the paper
“Trp53tm2Tyj (ref. 88), Commd10Tg(Vav1-icre)A2Kio (ref. 89; Jackson Laboratory, 008610) and Tg(Tal1-cre/ERT)42-056Jrg (ref. 90) have been previously described.”
§ Single-cell multi-omics identifies chronic inflammation as a driver of TP53-mutant leukemic evolution > Methods > Mouse bone marrow chimeras and ethical approval
What the sources say
- Not checked — no full text of the sourcecites [88] Olive, K. P. et al. Mutant p53 gain of function in two mouse models of Li-Fraumeni syndrome. Cell 119, 847–860 (2004). source
plain- Asserted: passes — The authors put it forward as true.
- Checkable: passes — It can be checked against evidence.
- Load-bearing: fails — The paper’s conclusions may not depend on it.
- Based: passes — The paper gives a reason why it holds.
Probably not a substantial claim. The paper’s conclusions may not depend on it.
What the paper did — it cites no source for this, so there is none to check. The quote shows it is in the paper.
In the paper
“A minimum of ten reads was required for variant calling.”
§ Single-cell multi-omics identifies chronic inflammation as a driver of TP53-mutant leukemic evolution > Methods > Targeted bulk sequencing
plain- Asserted: passes — The authors put it forward as true.
- Checkable: passes — It can be checked against evidence.
- Load-bearing: fails — The paper’s conclusions may not depend on it.
- Based: passes — The paper gives a reason why it holds.
Probably not a substantial claim. The paper’s conclusions may not depend on it.
What the paper did — it cites no source for this, so there is none to check. The quote shows it is in the paper.
In the paper
“All cells were karyotyped, excluding metaphases severely damaged for technical reasons.”
§ Single-cell multi-omics identifies chronic inflammation as a driver of TP53-mutant leukemic evolution > Methods > M-FISH
plain- Asserted: passes — The authors put it forward as true.
- Checkable: passes — It can be checked against evidence.
- Load-bearing: fails — The paper’s conclusions may not depend on it.
- Based: passes — The paper gives a reason why it holds.
Probably not a substantial claim. The paper’s conclusions may not depend on it.
A conclusion the paper draws from its own results — it cites no other source for it, so there is none to check. The quote shows it is in the paper.
In the paper
“If TP53 mutations are bi-allelic, the expected number of WT/HOM and HOM/WT would be higher than HOM/HOM cells considering TARGET-seq expected ADO rates (1–5%).”
§ Single-cell multi-omics identifies chronic inflammation as a driver of TP53-mutant leukemic evolution > Methods > Computational validation of TP53 bi-allelic status from single-cell targeted genotyping datasets
hedgedn = 6- Asserted: passes — The authors put it forward as true.
- Checkable: passes — It can be checked against evidence.
- Load-bearing: passes — The paper’s conclusions depend on it.
- Based: passes — The paper gives a reason why it holds.
Probably not a substantial claim.
- The authors state this as an assumption: ADO is unbiased toward HOM or WT.
- The authors state this as an assumption: ADO events at each TP53 site are independent.
What the paper did — it cites no source for this, so there is none to check. The quote shows it is in the paper.
In the paper
“All pathogenic variants were manually checked using Integrative Genomics Viewer software.”
§ Single-cell multi-omics identifies chronic inflammation as a driver of TP53-mutant leukemic evolution > Methods > Targeted bulk sequencing
plain- Asserted: passes — The authors put it forward as true.
- Checkable: passes — It can be checked against evidence.
- Load-bearing: fails — The paper’s conclusions may not depend on it.
- Based: passes — The paper gives a reason why it holds.
Probably not a substantial claim. The paper’s conclusions may not depend on it.
What the paper did — it cites no source for this, so there is none to check. The quote shows it is in the paper.
In the paper
“Primary human samples (PB or BM; described in Supplementary Table 1) were analyzed with approvals from the Inserm Institutional Review Board Ethical Committee (project C19-73, agreement 21-794, CODECOH DC-2020-4324) and from the INForMeD Study (REC: 199833, 26 July 2016, University of Oxford).”
§ Single-cell multi-omics identifies chronic inflammation as a driver of TP53-mutant leukemic evolution > Methods > Ethical approval, banking and processing of human samples
plain- Asserted: passes — The authors put it forward as true.
- Checkable: passes — It can be checked against evidence.
- Load-bearing: fails — The paper’s conclusions may not depend on it.
- Based: passes — The paper gives a reason why it holds.
Probably not a substantial claim. The paper’s conclusions may not depend on it. It may state two separate claims as one.
A conclusion the paper draws from its own results — it cites no other source for it, so there is none to check. The quote shows it is in the paper.
In the paper
“Allelic resolution genotyping of leukemic HSPCs revealed a strong selective pressure for gain of TP53 missense mutation, loss of the TP53-WT allele and acquisition of complex CNAs, including cases with parallel genetic evolution during TP53-sAML LSC expansion.”
§ Single-cell multi-omics identifies chronic inflammation as a driver of TP53-mutant leukemic evolution > Discussion
boosteddirect- Asserted: passes — The authors put it forward as true.
- Checkable: passes — It can be checked against evidence.
- Load-bearing: passes — The paper’s conclusions depend on it.
- Based: passes — The paper gives a reason why it holds.
It may state two separate claims as one.
A conclusion the paper draws from its own results — it cites no other source for it, so there is none to check. The quote shows it is in the paper.
In the paper
“leading to the accumulation of HSCs that have acquired DNA damage, thus promoting genetic evolution that underlies disease progression.”
§ Single-cell multi-omics identifies chronic inflammation as a driver of TP53-mutant leukemic evolution > Discussion
plaindirect- Asserted: passes — The authors put it forward as true.
- Checkable: passes — It can be checked against evidence.
- Load-bearing: passes — The paper’s conclusions depend on it.
- Based: passes — The paper gives a reason why it holds.
It may state two separate claims as one.
What the paper did — it cites no source for this, so there is none to check. The quote shows it is in the paper.
In the paper
“Variants with ambiguous or low coverage assignments for a particular cell were excluded from the analysis.”
§ Single-cell multi-omics identifies chronic inflammation as a driver of TP53-mutant leukemic evolution > Methods > Targeted single-cell genotyping analysis
plain- Asserted: passes — The authors put it forward as true.
- Checkable: passes — It can be checked against evidence.
- Load-bearing: fails — The paper’s conclusions may not depend on it.
- Based: passes — The paper gives a reason why it holds.
Probably not a substantial claim. The paper’s conclusions may not depend on it.
What the paper did — it cites no source for this, so there is none to check. The quote shows it is in the paper.
In the paper
“The analysis of the M-FISH hybridized cells was blinded.”
§ Single-cell multi-omics identifies chronic inflammation as a driver of TP53-mutant leukemic evolution > Methods > M-FISH
plain- Asserted: passes — The authors put it forward as true.
- Checkable: passes — It can be checked against evidence.
- Load-bearing: fails — The paper’s conclusions may not depend on it.
- Based: passes — The paper gives a reason why it holds.
Probably not a substantial claim. The paper’s conclusions may not depend on it.
A conclusion the paper draws from its own results — it cites no other source for it, so there is none to check. The quote shows it is in the paper.
In the paper
“We propose that HSCs that would otherwise undergo inflammation-associated and DNA-damage-induced attrition are rescued by TP53 mutation, ultimately leading to the accumulation of HSCs that have acquired DNA damage, thus promoting genetic evolution that underlies disease progression.”
§ Single-cell multi-omics identifies chronic inflammation as a driver of TP53-mutant leukemic evolution > Discussion
hedgeddirect- Asserted: passes — The authors put it forward as true.
- Checkable: passes — It can be checked against evidence.
- Load-bearing: passes — The paper’s conclusions depend on it.
- Based: passes — The paper gives a reason why it holds.
It may state two separate claims as one.
In the paper
“The 17-gene LSC17 gene set was retrieved from ref. 31.”
§ Single-cell multi-omics identifies chronic inflammation as a driver of TP53-mutant leukemic evolution > Methods > Prognostic signatures and Cox-regression survival models
What the sources say
- Not checked — no full text of the sourcecites [31] Ng, S. W. et al. A 17-gene stemness score for rapid determination of risk in acute leukaemia. Nature 540, 433–437 (2016). source
plain- Asserted: passes — The authors put it forward as true.
- Checkable: passes — It can be checked against evidence.
- Load-bearing: fails — The paper’s conclusions may not depend on it.
- Based: passes — The paper gives a reason why it holds.
Probably not a substantial claim. The paper’s conclusions may not depend on it.
A conclusion the paper draws from its own results — it cites no other source for it, so there is none to check. The quote shows it is in the paper.
In the paper
“Through the integration of single-cell multi-omic analysis with in vitro and in vivo functional assays, we show that TP53-WT pre-LSCs are cell-extrinsically suppressed while chronic inflammation promotes the fitness advantage of TP53-mutant cells, ultimately leading to clonal selection (Fig. 6e).”
§ Single-cell multi-omics identifies chronic inflammation as a driver of TP53-mutant leukemic evolution > Discussion
boosteddirect- Asserted: passes — The authors put it forward as true.
- Checkable: passes — It can be checked against evidence.
- Load-bearing: passes — The paper’s conclusions depend on it.
- Based: passes — The paper gives a reason why it holds.
It may state two separate claims as one.
What the paper did — it cites no source for this, so there is none to check. The quote shows it is in the paper.
In the paper
“The quality of cDNA traces was checked using a high-sensitivity DNA kit in a Bioanalyzer instrument (Agilent Technologies).”
§ Single-cell multi-omics identifies chronic inflammation as a driver of TP53-mutant leukemic evolution > Methods > Single-cell TARGET-seq cDNA synthesis
plain- Asserted: passes — The authors put it forward as true.
- Checkable: passes — It can be checked against evidence.
- Load-bearing: fails — The paper’s conclusions may not depend on it.
- Based: passes — The paper gives a reason why it holds.
Probably not a substantial claim. The paper’s conclusions may not depend on it.
What the paper did — it cites no source for this, so there is none to check. The quote shows it is in the paper.
In the paper
“Only homozygous alternate genotype calls below this 0.05 cut-off were reported in Extended Data Figs. 2b–o and 9e–m; the results of the binomial test are reported for each patient and mutation in Supplementary Table 8.”
§ Single-cell multi-omics identifies chronic inflammation as a driver of TP53-mutant leukemic evolution > Methods > Computational reconstruction of clonal hierarchies
plain- Asserted: passes — The authors put it forward as true.
- Checkable: passes — It can be checked against evidence.
- Load-bearing: fails — The paper’s conclusions may not depend on it.
- Based: passes — The paper gives a reason why it holds.
Probably not a substantial claim. The paper’s conclusions may not depend on it.
- The authors state this as an assumption: ADO is unbiased toward HOM or WT.
- The authors state this as an assumption: ADO events at each TP53 site are independent.
In the paper
“Notably, our data do not distinguish whether this lineage-switch is primarily an instructive versus permissive effect of TP53-mutation46.”
§ Single-cell multi-omics identifies chronic inflammation as a driver of TP53-mutant leukemic evolution > Discussion
What the sources say
- Not checked — no full text of the sourcecites [46] Enver, T. & Jacobsen, S. E. Developmental biology: instructions writ in blood. Nature 461, 183–184 (2009). source
plain- Asserted: passes — The authors put it forward as true.
- Checkable: passes — It can be checked against evidence.
- Load-bearing: fails — The paper’s conclusions may not depend on it.
- Based: passes — The paper gives a reason why it holds.
Probably not a substantial claim. The paper’s conclusions may not depend on it.
What the paper did — it cites no source for this, so there is none to check. The quote shows it is in the paper.
In the paper
“Patients and normal donors provided written informed consent in accordance with the Declaration of Helsinki for sample collection and use in research.”
§ Single-cell multi-omics identifies chronic inflammation as a driver of TP53-mutant leukemic evolution > Methods > Ethical approval, banking and processing of human samples
plain- Asserted: passes — The authors put it forward as true.
- Checkable: passes — It can be checked against evidence.
- Load-bearing: fails — The paper’s conclusions may not depend on it.
- Based: passes — The paper gives a reason why it holds.
Probably not a substantial claim. The paper’s conclusions may not depend on it.
The authors state this as an assumption.
Little is known about the additional genetic and nongenetic determinants of clonal evolution following the acquisition of a TP53 mutation.
“However, little is known about the additional genetic and nongenetic determinants of clonal evolution following the acquisition of a TP53 mutation.”
The authors state this as an assumption.
ADO is unbiased toward HOM or WT.
“(1) ADO is unbiased toward HOM or WT”
The authors state this as an assumption.
ADO events at each TP53 site are independent.
“(2) ADO events at each TP53 site are independent.”
The authors state this as an assumption.
All possible mutation trees are equally likely a priori.
“where all possible mutation trees are equally likely a priori.”
The paper relies on this without support.
The proportional hazards assumption holds for the Cox regression models used to estimate hazard ratios.
“The Cox proportional hazards regression model implemented by the survival R package (version 3.5–5) was fitted to estimate the hazard ratio associated with each feature.”
Claims other papers make about this one
Each is checked against this paper’s own text: does it say what the citing paper says it does?
The source backs part of the claim, not all of it — or backs it for a different population, condition or comparison.
In the citing paper
“Previously, induction of IFNa in mice have yielded mixed results demonstrating either an upregulation 2 or downregulation 53 of TNFa.”
From Type 1 interferon perturbates clonal competition by reshaping human blood development (2026) · cites this paper as [53]
Experimental — accuracy not yet measuredThe check wasn’t confident either way, so it gives no verdict — never disputed.
In the citing paper
“TWIST1 has been implicated in mediating the downregulation of TNFa upon type 1 IFN treatment 53”
From Type 1 interferon perturbates clonal competition by reshaping human blood development (2026) · cites this paper as [53]
Experimental — accuracy not yet measured
Citations
Cites
The Sequence Alignment/Map format and SAMtools
Li, H., Handsaker, B., Wysoker, A., Fennell, T., Ruan, J., Homer, N., Marth, G., Abecasis, G., Durbin, R., & 1000 Genome Project Data Processing Subgroup (2009) · Bioinformatics · doi:10.1093/bioinformatics/btp352 · Cited by 62,041
STAR: ultrafast universal RNA-seq aligner
Dobin, A., Davis, C. A., Schlesinger, F., Drenkow, J., Zaleski, C., Jha, S., Batut, P., Chaisson, M., & Gingeras, T. R. (2013) · Bioinformatics · doi:10.1093/bioinformatics/bts635 · Cited by 51,709
The Genome Analysis Toolkit: A MapReduce framework for analyzing next-generation DNA sequencing data
McKenna, A., Hanna, M., Banks, E., Sivachenko, A., Cibulskis, K., Kernytsky, A., Garimella, K., Altshuler, D., Gabriel, S., Daly, M., et al. (2010) · Genome Research · doi:10.1101/gr.107524.110 · Cited by 27,895
BEDTools: a flexible suite of utilities for comparing genomic features
Quinlan, A. R., & Hall, I. M. (2010) · Bioinformatics · doi:10.1093/bioinformatics/btq033 · Cited by 27,437
Cerami, E., Gao, J., Dogrusoz, U., Gross, B. E., Sumer, S. O., Aksoy, B. A., Jacobsen, A., Byrne, C. J., Heuer, M. L., Larsson, E., et al. (2012) · Cancer Discovery · doi:10.1158/2159-8290.cd-12-0095 · Cited by 17,455
Spatial reconstruction of single-cell gene expression data
Satija, R., Farrell, J. A., Gennert, D., Schier, A. F., & Regev, A. (2015) · Nature Biotechnology · doi:10.1038/nbt.3192 · Cited by 7,055
Genomic and Epigenomic Landscapes of Adult De Novo Acute Myeloid Leukemia
The Cancer Genome Atlas Research Network (2013) · New England Journal of Medicine · doi:10.1056/nejmoa1301689 · Cited by 5,078
Reversed graph embedding resolves complex single-cell trajectories
Qiu, X., Mao, Q., Tang, Y., Wang, L., Chawla, R., Pliner, H. A., & Trapnell, C. (2017) · Nature Methods · doi:10.1038/nmeth.4402 · Cited by 5,070
Single-cell RNA-seq highlights intratumoral heterogeneity in primary glioblastoma
Patel, A. P., Tirosh, I., Trombetta, J. J., Shalek, A. K., Gillespie, S. M., Wakimoto, H., Cahill, D. P., Nahed, B. V., Curry, W. T., Martuza, R. L., et al. (2014) · Science · doi:10.1126/science.1254257 · Cited by 5,063
Hafemeister, C., & Satija, R. (2019) · Genome Biology · doi:10.1186/s13059-019-1874-1 · Cited by 4,479
Cited by
Sorted by citations
Understanding the complexity of p53 in a new era of tumor suppression
Liu, Y., Su, Z., Tavana, O., & Gu, W. J. (2024) · Cancer Cell · doi:10.1016/j.ccell.2024.04.009 · Cited by 538
Tumor initiation and early tumorigenesis: molecular mechanisms and interventional targets
Zhang, S., Xiao, X., Yi, Y., Wang, X., Zhu, L., Shen, Y., Lin, D., & Wu, C. H. (2024) · Signal Transduction and Targeted Therapy · doi:10.1038/s41392-024-01848-7 · Cited by 463
“131,132 135 Notably, expanding mutant clones in in fl ammation can play roles independent of tumorigenesis, such as the regeneration role of ARID1A , KMT2D and PKD1 in liver injury 136 and tumor-suppressive NFKBIZ mutation in colitis.”
BackgroundClonal hematopoiesis: Mutation-specific adaptation to environmental change
Florez, M. A., Tran, B. T., Wathan, T. K., DeGregori, J., Pietras, E. M., & King, K. Y. (2022) · Cell Stem Cell · doi:10.1016/j.stem.2022.05.006 · Cited by 129
Zeng, A. G. X., Iacobucci, I., Shah, S., Mitchell, A., Wong, G., Bansal, S., Chen, D., Gao, Q., Kim, H., Kennedy, J. A., et al. (2025) · Blood Cancer Discovery · doi:10.1158/2643-3230.bcd-24-0342 · Cited by 126
The micro(nano)plastics perspective: exploring cancer development and therapy
Deng, X., Gui, Y., & Zhao, L. (2025) · Molecular Cancer · doi:10.1186/s12943-025-02230-z · Cited by 115
“Long-term chronic inflammation can significantly alter the tumor microenvironment [62–64].”
Metadata
- Authors
- Rodriguez-Meira, A., Norfo, R., Wen, S., Chédeville, A. L., Rahman, H., O’Sullivan, J., Wang, G., Louka, E., Kretzschmar, W. W., Paterson, A., Brierley, C., Martin, J.-E., Demeule, C., Bashton, M., Sousos, N., Moralli, D., Subha Meem, L., Carrelha, J., Wu, B., Hamblin, A., Guermouche, H., Pasquier, F., Marzac, C., Girodon, F., Vainchenker, W., Drummond, M., Harrison, C., Chapman, J. R., Plo, I., Jacobsen, S. E. W., Psaila, B., Thongjuea, S., Antony-Debré, I., & Mead, A. J.
- Affiliations
- University of Modena and Reggio Emilia (IT)
- University of Oxford (GB)
- Inserm (FR)
- Karolinska University Hospital (SE)
- Memorial Sloan Kettering Cancer Center (US)
- CHU Dijon Bourgogne (FR)
- Northumbria University (GB)
- Centre for Human Genetics (GB)
- Beatson West of Scotland Cancer Centre (GB)
- Guy's and St Thomas' NHS Foundation Trust (GB)
- Corresponding author
- Mead, Adam J.
- ORCID
- Rodriguez-Meira, Alba
- Norfo, Ruggiero
- Chédeville, Agathe L.
- Rahman, Haseeb
- O’Sullivan, Jennifer
- Wang, Guanlin
- Louka, Eleni
- Kretzschmar, Warren W.
- Brierley, Charlotte
- Martin, Jean-Edouard
- Demeule, Caroline
- Bashton, Matthew
- Sousos, Nikolaos
- Moralli, Daniela
- Carrelha, Joana
- Hamblin, Angela
- Guermouche, Helene
- Pasquier, Florence
- Marzac, Christophe
- Girodon, François
- Vainchenker, William
- Harrison, Claire
- Chapman, J. Ross
- Plo, Isabelle
- Jacobsen, Sten Eirik W.
- Psaila, Bethan
- Thongjuea, Supat
- Antony-Debré, Iléana
- Mead, Adam J.
- Venue
- Nature Genetics
- Published
- 2023-09
- Volume
- 55
- Issue
- 9
- Pages
- 1531-1541
- ISSN
- 1061-4036 (ISSN-L)
- 1546-1718
- PMC
- PMC10484789
- OpenAlex
- W4386415929
- Cited by
- 158
- References
- 91
- Citations by year
- 2026: 43 · 2025: 62 · 2024: 44 · 2023: 8
- FWCI
- 32.40
- Type
- journal article
- Language
- en
- Open access
- hybrid
- doi.org
- Locations
- Nature Genetics (publishedVersion, cc-by)
- PubMed (publishedVersion)
- HAL (submittedVersion, other-oa)
- PubMed Central (submittedVersion, cc-by)
- IRIS UNIMORE (University of Modena and Reggio Emilia) (submittedVersion, cc-by)
- Funders
- Cancer Research UK (C42639/A26988, C5255/A20936)
- RCUK | Medical Research Council (MC_PC_19049)
- Wellcome Trust (222800/Z/21/Z)
- Emergence Canceropole Ile de France, Association pour la Recherche contre le cancer, Siric-Socrate, INCA-PLBIO
- Topics
- Health Sciences › Medicine › Hematology › Acute Myeloid Leukemia Research
- Life Sciences › Biochemistry, Genetics and Molecular Biology › Cancer Research › Cancer Genomics and Diagnostics
- Life Sciences › Biochemistry, Genetics and Molecular Biology › Molecular Biology › Single-cell and spatial transcriptomics
- Keywords
- TP53 mutation, secondary acute myeloid leukemia, myeloproliferative neoplasms, clonal evolution, chronic inflammation, hematopoietic stem and progenitor cells, leukemia stem cells, tumor suppressor inactivation, risk stratification, single-cell multi-omics
- MeSH terms
- Multiomics, Alleles, Humans, Inflammation, Leukemia, Neoplasm Proteins, Tumor Suppressor Protein p53
About these checks
Registry, retraction, Cites and statistics results are computed, not judged, with one exception: a printed reference that no index lists is read once by a model before it counts as a citation error. Claims are extracted by a model and kept only when their quote appears verbatim in the text; each cited source is then checked, with a model’s help, for whether it says what the claim relies on. Those verdicts can be wrong — read the claim’s quote and the cited source before relying on one.
A language model drew the claims from the paper on 2026-10-28, under version 3 of the claim definition (model deepseek-v4.1-flash, prompt extract-v3).
A second model labelled each claim on 2026-10-28 (model jev-1.13-20260917, definition revision gold-guideline-v0.2).
Cited sources are checked with a language model’s help (gpt-6-sol).
Statistics and arithmetic are recomputed, not judged.
Confidence bands are shown only for fields calibrated on our annotated test set. None is calibrated yet, so no band is shown.
What counts as a claim ›How we measure confidence ›How we check this ›
Are you an author, or do you see a problem with this page? Request a review
