

The DOI matches its Crossref record; 78 of the 85 references it cites were found in a registry or an index; 6 of the 86 sources its claims cite were checked for support.
A multimodal vision foundation model for clinical dermatology
Open accessAbstract
Diagnosing and treating skin diseases require advanced visual skills across domains and the ability to synthesize information from multiple imaging modalities. While current deep learning models excel at specific tasks such as skin cancer diagnosis from dermoscopic images, they struggle to meet the complex, multimodal requirements of clinical practice. Here we introduce PanDerm, a multimodal dermatology foundation model pretrained through self-supervised learning on over 2 million real-world skin disease images from 11 clinical institutions across 4 imaging modalities. We evaluated PanDerm on 28 diverse benchmarks, including skin cancer screening, risk stratification, differential diagnosis of common and rare skin conditions, lesion segmentation, longitudinal monitoring, and metastasis prediction and prognosis. PanDerm achieved state-of-the-art performance across all evaluated tasks, often outperforming existing models when using only 10% of labeled data. We conducted three reader studies to assess PanDerm’s potential clinical utility. PanDerm outperformed clinicians by 10.2% in early-stage melanoma detection through longitudinal analysis, improved clinicians’ skin cancer diagnostic accuracy by 11% on dermoscopy images and enhanced nondermatologist healthcare providers’ differential diagnosis by 16.5% across 128 skin conditions on clinical photographs. These results show PanDerm’s potential to improve patient care across diverse clinical scenarios and serve as a model for developing multimodal foundation models in other medical specialties, potentially accelerating the integration of artificial intelligence support in healthcare.
Overview
AI snapshot
Written from the paper’s full text.
TL;DR
PanDerm is a multimodal dermatology foundation model pretrained via self-supervised learning on over 2 million real-world skin images from 11 institutions across 4 imaging modalities. Across 28 benchmarks and 3 reader studies, it achieved state-of-the-art performance and improved clinician and nondermatologist diagnostic accuracy in several tasks.
Key findings
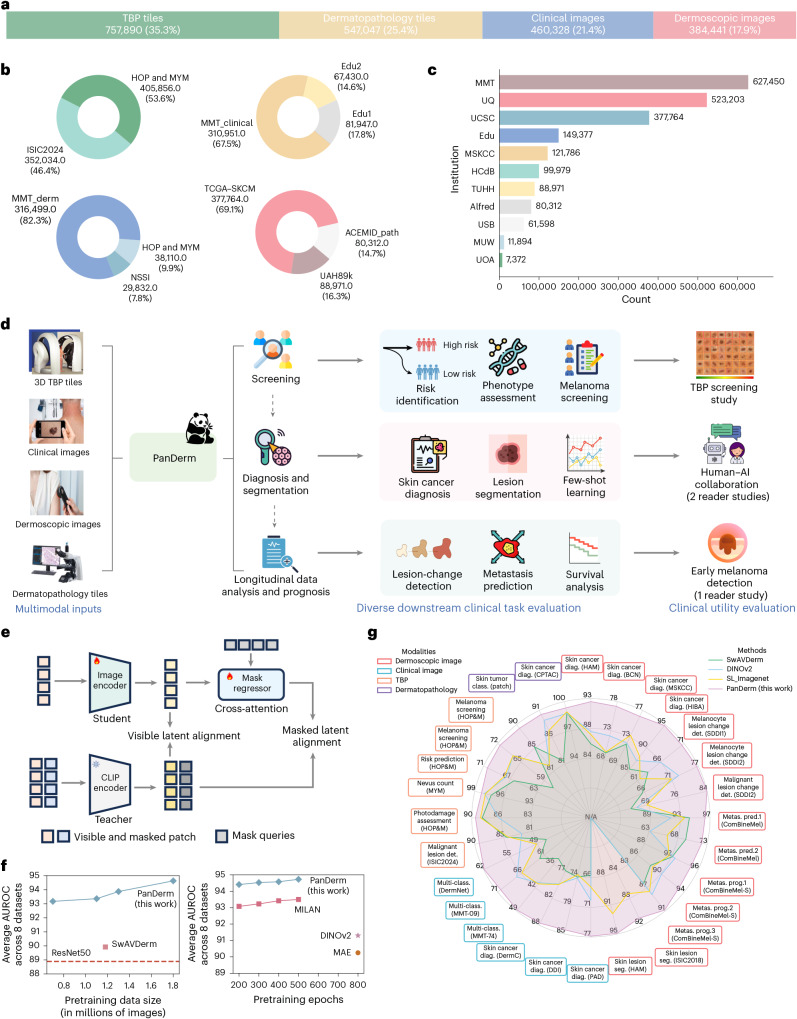
- Pretraining used 2,149,706 unlabeled multimodal skin images: 757,890 (35.3%) TBP tiles, 537,047 (25.4%) dermatopathology tiles, 460,328 (21.4%) clinical images and 384,441 (17.9%) dermoscopic images. PanDerm achieved state-of-the-art performance on all 28 evaluated tasks, often using only 5–10% of labeled training data; it outperformed SwAVDerm using 33% less training data and reached best performance in 200 epochs versus 500–800 for MILAN, DINOv2 and MAE.
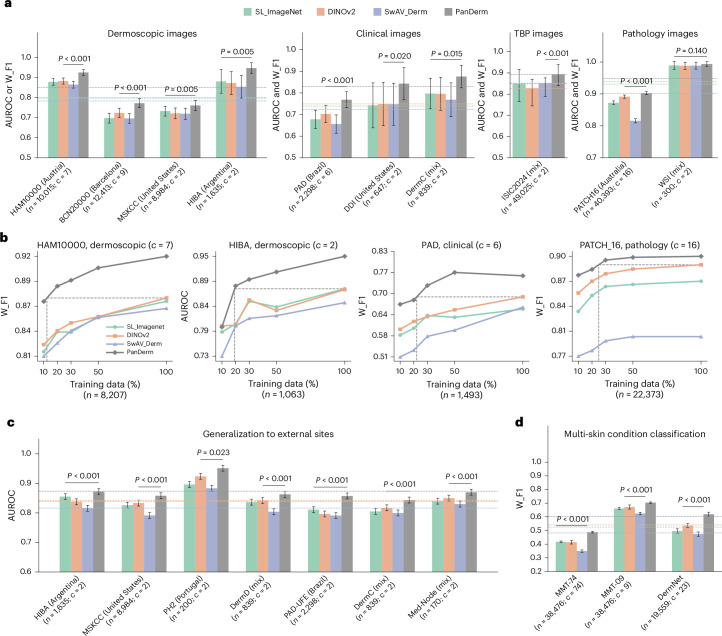
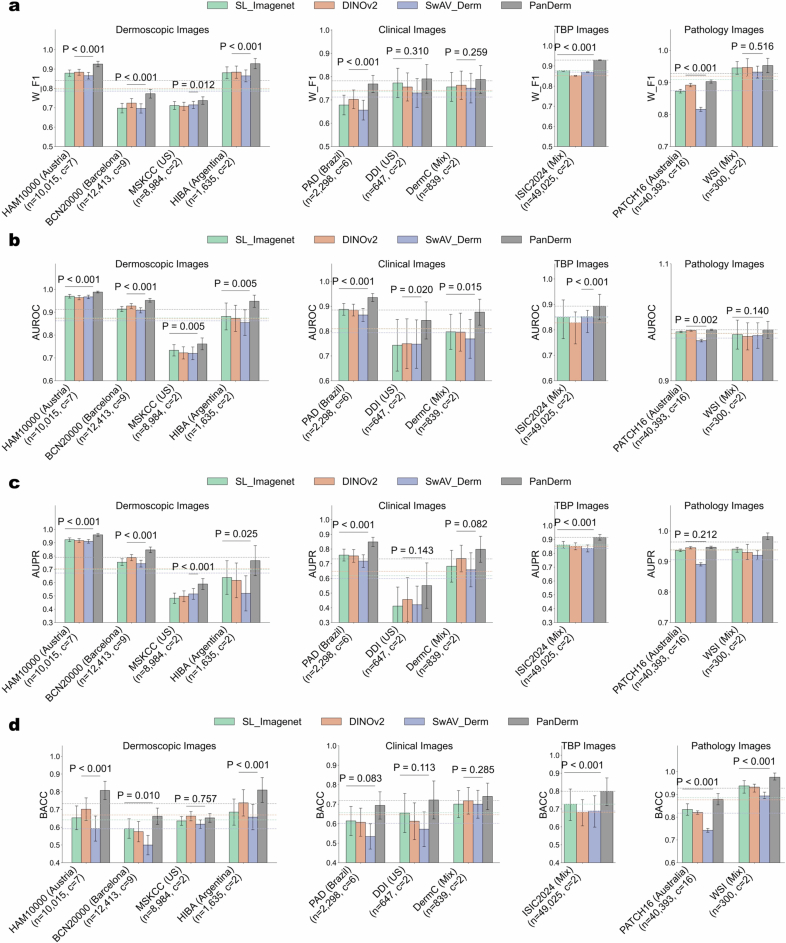
- Diagnostic gains averaged 5.1%, 8.0%, 4.2% and 0.9% on dermoscopic, clinical, TBP and pathology datasets, respectively. On HAM10000 and PAD-UFES-20, PanDerm surpassed the next-best models by 4.7% and 9.0% (both P < 0.001). For broader skin conditions, weighted F1 improvements were 3.2%, 7.1% and 8.2% on MMT-09, DermNet and MMT-74.
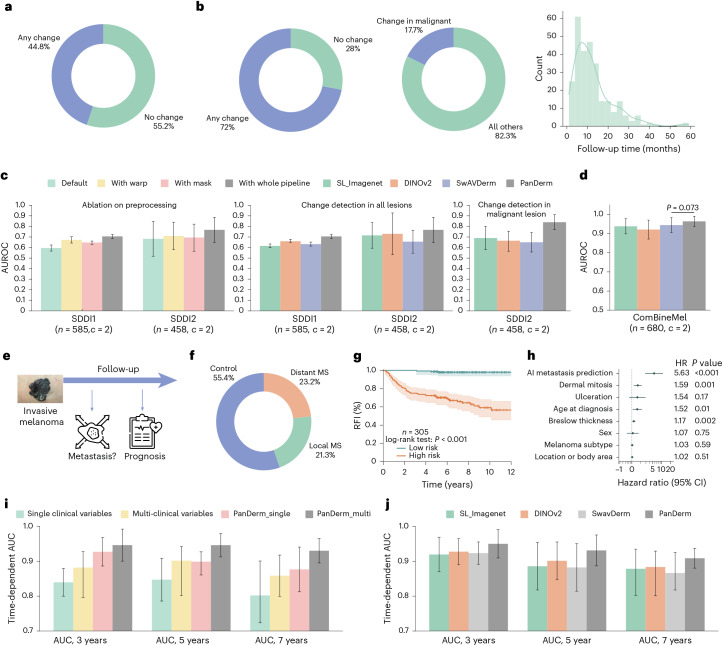
- In longitudinal tasks, change detection AUROC improved from 0.596 to 0.706 on SDDI1 and from 0.683 to 0.767 on SDDI2; for malignant lesions, PanDerm reached AUROC 0.840, surpassing the next-best model by 15.0%. Metastasis prediction reached AUROC 0.964, and high-risk patients had shorter recurrence-free intervals (HR 5.63; 95% CI 2.87–11.02, P < 0.001), with time-dependent AUCs of 0.950, 0.931 and 0.909 at 3, 5 and 7 years.
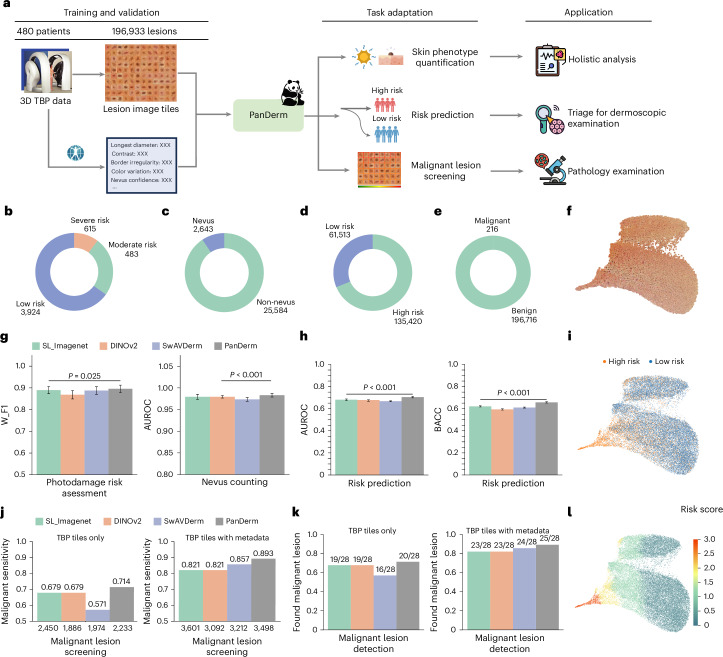
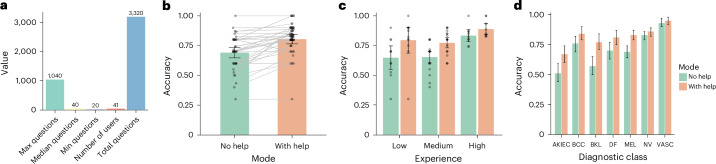
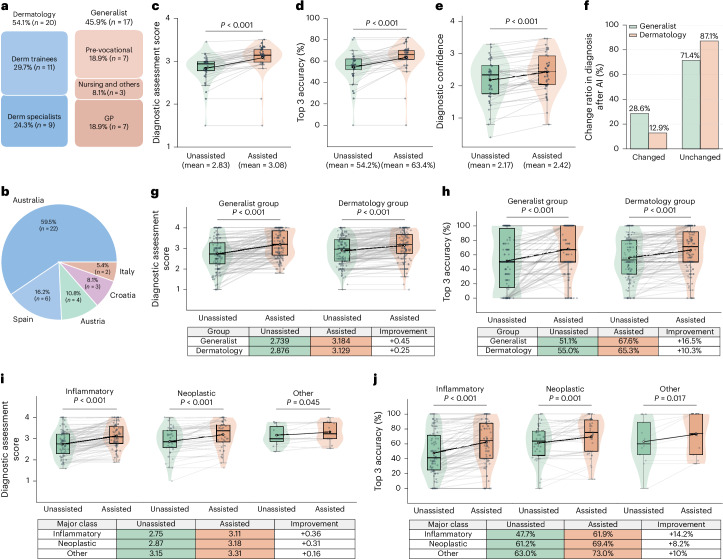
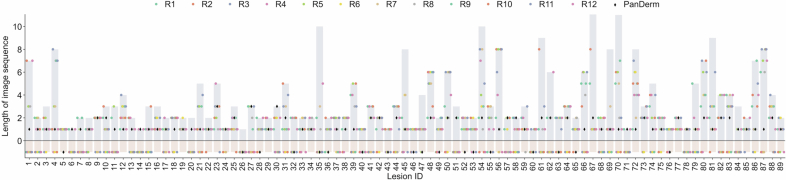
- TBP tasks: photodamage weighted F1 0.896, nevus counting AUROC 0.983, risk stratification AUROC 0.705 and BACC 0.657. Malignant lesion screening sensitivity was 0.893, detecting malignant lesions in 79 of 80 patients while reducing unnecessary examinations by 60.8% versus melanographers (3,498 versus 8,913 lesions). Reader studies showed PanDerm outperformed average human reviewers by 10.2% in early melanoma detection, identified 77.5% (69/89) of melanomas at the first imaging time point versus 32.6% (29) for humans, improved skin cancer diagnostic accuracy from 0.69 to 0.80, and improved generalists’ top-3 accuracy by 16.5% across 128 skin conditions.
Methods
- Design: PanDerm is a self-supervised multimodal foundation model with a ViT-Large visual encoder, a mask regressor and a CLIP-Large teacher model. Pretraining used masked latent modeling and CLIP feature alignment, with 50% mask ratio, 224 × 224-pixel inputs, 500 epochs, batch size 480 per GPU (effective 1,920), and 4 × 80-GB NVIDIA H100 GPUs for approximately 5 days and 7 hours.
- Data and evaluation: Pretraining data came from 11 sources across 4 modalities. Evaluation covered 28 benchmarks, including 10 public datasets from 4 imaging modalities and 7 international sites, plus internal datasets such as MMT-09, MMT-74, SD-128, SDDI1, SDDI2, ComBineMel and TBP cohorts. Three reader studies assessed early melanoma detection, human–AI collaboration for skin cancer diagnosis, and human–AI collaboration for 128 skin conditions.
- Analysis: Main metrics included AUROC, weighted F1, Dice similarity coefficient, Jaccard index, sensitivity, top-1/top-3 accuracy and diagnostic confidence. Statistical approaches included k-fold cross-validation, nonparametric bootstrapping with 1,000 replicates, two-sided t-tests, permutation tests, Kaplan–Meier analysis and Cox proportional hazards regression.
Limitations
- The paper states that validation covered approximately 200 skin conditions, only a fraction of over 1,000 known dermatological diagnoses and smaller than some prior work (for example, 445 conditions), with limited coverage of rare genetic disorders, complex systemic diseases and clinical variants.
- The paper states that robustness and fairness evaluations mainly reflect overall accuracy rather than disease-specific analysis, have varying disease coverage across anatomical locations, and focus primarily on single imaging modalities; comprehensive bias assessment requires metrics beyond overall accuracy, and equitable stand-alone performance may not translate to unbiased human–AI collaboration.
- Evident from the text: the evaluations are retrospective benchmark and reader studies, and the paper does not report prospective clinical deployment or patient-outcome trials.
Model-written summary. Check it against the paper before relying on it.
Integrity signals
Registry
Cites
Statistics
Figures
Verification
Claims the paper makes
66 Own result · 48 Not checked yet · 29 Own method · 14 Own interpretation · 4 No basis given · 2 Supported so far
A result the paper reports from its own data — it cites no other source for it, so there is none to check. The quote shows it is in the paper.
In the paper
“Here we introduce PanDerm, a multimodal dermatology foundation model pretrained through self-supervised learning on over 2 million real-world skin disease images from 11 clinical institutions across 4 imaging modalities.”
- Also stated in: § Main · plain
“Here we introduce PanDerm, a general-purpose, multimodal dermatology foundation model. Uniquely designed to integrate multiple imaging modalities, PanDerm is pretrained on over 2 million images sourced from 11 institutions across multiple countries, covering 4 imaging modalities spanning diverse dermatological conditions”
§ A multimodal vision foundation model for clinical dermatology > Abstract
plain- Asserted: passes — The authors put it forward as true.
- Checkable: passes — It can be checked against evidence.
- Load-bearing: passes — The paper’s conclusions depend on it.
- Based: passes — The paper gives a reason why it holds.
- Also stated in: § Main · plain
A result the paper reports from its own data — it cites no other source for it, so there is none to check. The quote shows it is in the paper.
In the paper
“PanDerm achieved state-of-the-art performance across all evaluated tasks, often outperforming existing models when using only 10% of labeled data.”
- Also stated in: § Main · plain
“PanDerm achieves state-of-the-art performance on all tasks, often using only 5–10% of the labeled training data typically required.”
§ A multimodal vision foundation model for clinical dermatology > Abstract
plaindirect- Asserted: passes — The authors put it forward as true.
- Checkable: passes — It can be checked against evidence.
- Load-bearing: passes — The paper’s conclusions depend on it.
- Based: passes — The paper gives a reason why it holds.
- Also stated in: § Main · plain
A result the paper reports from its own data — it cites no other source for it, so there is none to check. The quote shows it is in the paper.
In the paper
“PanDerm outperformed clinicians by 10.2% in early-stage melanoma detection through longitudinal analysis”
- Also stated in: § Reader studies · plain
“In terms of overall accuracy, PanDerm outperformed the average human reviewer by 10.2% and surpassed the best-performing human by 3.6%.”
§ A multimodal vision foundation model for clinical dermatology > Abstract
plaindirect- Asserted: passes — The authors put it forward as true.
- Checkable: passes — It can be checked against evidence.
- Load-bearing: passes — The paper’s conclusions depend on it.
- Based: passes — The paper gives a reason why it holds.
- Also stated in: § Reader studies · plain
A result the paper reports from its own data — it cites no other source for it, so there is none to check. The quote shows it is in the paper.
In the paper
“enhanced nondermatologist healthcare providers’ differential diagnosis by 16.5% across 128 skin conditions on clinical photographs”
- Also stated in: § Reader studies · plain
“greater improvements in both top 1 diagnostic scores (generalist group, +0.45; dermatology group, +0.25; Fig. 6g) and top 3 accuracy (generalist group, +16.5%; dermatology group, +10.3%; Fig. 6h).”
§ A multimodal vision foundation model for clinical dermatology > Abstract
plaindirect- Asserted: passes — The authors put it forward as true.
- Checkable: passes — It can be checked against evidence.
- Load-bearing: passes — The paper’s conclusions depend on it.
- Based: passes — The paper gives a reason why it holds.
- Also stated in: § Reader studies · plain
A result the paper reports from its own data — it cites no other source for it, so there is none to check. The quote shows it is in the paper.
In the paper
“PanDerm achieved state-of-the-art performance across all evaluated tasks, often outperforming existing models when using only 10% of labeled data.”
- Also stated in: § Main · plain
“PanDerm achieves state-of-the-art performance on all tasks, often using only 5–10% of the labeled training data typically required.”
§ A multimodal vision foundation model for clinical dermatology > Abstract
plain- Asserted: passes — The authors put it forward as true.
- Checkable: passes — It can be checked against evidence.
- Load-bearing: passes — The paper’s conclusions depend on it.
- Based: passes — The paper gives a reason why it holds.
- Also stated in: § Main · plain
A result the paper reports from its own data — it cites no other source for it, so there is none to check. The quote shows it is in the paper.
In the paper
“improved clinicians’ skin cancer diagnostic accuracy by 11% on dermoscopy images”
- Also stated in: § Reader studies · plain
“PanDerm’s assistance significantly increased overall diagnostic accuracy from 0.69 (95% CI 0.65–0.73) to 0.80 (95% CI 0.76–0.84, P < 0.001; Fig. 5b).”
§ A multimodal vision foundation model for clinical dermatology > Abstract
plaindirect- Asserted: passes — The authors put it forward as true.
- Checkable: passes — It can be checked against evidence.
- Load-bearing: passes — The paper’s conclusions depend on it.
- Based: passes — The paper gives a reason why it holds.
- Also stated in: § Reader studies · plain
A result the paper reports from its own data — it cites no other source for it, so there is none to check. The quote shows it is in the paper.
In the paper
“We evaluated PanDerm on 28 diverse benchmarks, including skin cancer screening, risk stratification, differential diagnosis of common and rare skin conditions, lesion segmentation, longitudinal monitoring, and metastasis prediction and prognosis.”
- Also stated in: § Main · plain
“We systematically evaluate PanDerm across 28 benchmarks (Fig. 1g), covering a diverse array of clinical tasks, including screening, risk stratification, phenotype assessment, nevus counting, longitudinal monitoring, lesion change detection, diagnosis of both common and rare skin conditions and skin lesion segmentation, as well as recurrence prediction and prognosis.”
§ A multimodal vision foundation model for clinical dermatology > Abstract
plain- Asserted: passes — The authors put it forward as true.
- Checkable: passes — It can be checked against evidence.
- Load-bearing: passes — The paper’s conclusions depend on it.
- Based: passes — The paper gives a reason why it holds.
- Also stated in: § Main · plain
None of the sources cited for this claim have been checked yet.
In the paper
“When compared with other self-supervised training techniques, PanDerm showed remarkable computational efficiency, requiring only 200 training epochs to achieve the best performance, compared with 500–800 epochs needed by leading methods such as MILAN37, DINOv2 (ref. 38) and MAE19 (Fig. 1f, right).”
§ A multimodal vision foundation model for clinical dermatology > Results > Ablation studies and training strategy comparisons
What the sources say
- Not checked yetcites [37] Hou, Z., Sun, F., Chen, Y.-K., Xie, Y. & Kung, S.-Y. Milan: masked image pretraining on language assisted representation. Preprint at https://arxiv.org/abs/2208.06049 (2022).
- Not checked yetcites [38] Oquab, M. et al. DINOv2: learning robust visual features without supervision. Trans. Mach. Learn. Res. https://openreview.net/forum?id=a68SUt6zFt (2024).
- Not checked yetcites [19] He, K. et al. Masked autoencoders are scalable vision learners. In Proc. IEEE/CVF Conference on Computer Vision and Pattern Recognition 16000–16009 (IEEE, 2022). source
plaindirect- Asserted: passes — The authors put it forward as true.
- Checkable: passes — It can be checked against evidence.
- Load-bearing: passes — The paper’s conclusions depend on it.
- Based: passes — The paper gives a reason why it holds.
The paper states this without a source or data behind it here, so there is nothing to check it against. The quote shows it is in the paper.
In the paper
“Here we introduce PanDerm, a general-purpose, multimodal dermatology foundation model.”
§ A multimodal vision foundation model for clinical dermatology > Main
plain- Asserted: passes — The authors put it forward as true.
- Checkable: passes — It can be checked against evidence.
- Load-bearing: passes — The paper’s conclusions depend on it.
- Based: passes — The paper gives a reason why it holds.
A result the paper reports from its own data — it cites no other source for it, so there is none to check. The quote shows it is in the paper.
In the paper
“In the DermNet dataset, PanDerm exceeded the next-best model’s area under the precision–recall curve (AUPR) by 14.7%.”
§ A multimodal vision foundation model for clinical dermatology > Results > Diagnostic performance and generalization ability across datasets
plain- Asserted: passes — The authors put it forward as true.
- Checkable: passes — It can be checked against evidence.
- Load-bearing: passes — The paper’s conclusions depend on it.
- Based: passes — The paper gives a reason why it holds.
- It may state two separate claims as one. 44
- Probably not a substantial claim. 44
The sources with a verdict support this claim; the rest weren’t checked yet, have no full text we could read, or their verdicts aren’t rated yet.
In the paper
“On representative dermoscopy and clinical benchmarks such as HAM10000 (ref. 34) and PAD-UFES-20 (ref. 43), PanDerm surpassed the next-best models by 4.7% (P < 0.001) and 9.0% (P < 0.001), respectively”
§ A multimodal vision foundation model for clinical dermatology > Results > Diagnostic performance and generalization ability across datasets
What the sources say
- Supportedcites [34] Tschandl, P., Rosendahl, C. & Kittler, H. The HAM10000 dataset, a large collection of multi-source dermatoscopic images of common pigmented skin lesions. Sci. Data 5, 180161 (2018). source
The citation is attached to HAM10000, identifying the dataset used as a dermoscopy benchmark, rather than to the PanDerm performance figures. The Methods section describes HAM10000 as a collection of 10,015 dermatoscopic images, and Data Records identifies it as a dataset. This source is not being cited for the 4.7% or 9.0% results. (LLM, conf=0.92)
- Not checked yetcites [43] Pacheco, A. G. et al. PAD-UFES-20: a skin lesion dataset composed of patient data and clinical images collected from smartphones. Data Brief 32, 106221 (2020). source
plaindirect- Asserted: passes — The authors put it forward as true.
- Checkable: passes — It can be checked against evidence.
- Load-bearing: passes — The paper’s conclusions depend on it.
- Based: passes — The paper gives a reason why it holds.
It may state two separate claims as one.
- Supported
The sources with a verdict support this claim; the rest weren’t checked yet, have no full text we could read, or their verdicts aren’t rated yet.
In the paper
“Built on rich knowledge representations, these models have shown impressive performance across medical fields such as ophthalmology20, radiology21 and pathology22–25.”
§ A multimodal vision foundation model for clinical dermatology > Main
What the sources say
- Not checked yetcites [20] Zhou, Y. et al. A foundation model for generalizable disease detection from retinal images. Nature 622, 156–163 (2023). source
- Supportedcites [21] Pai, S. et al. Foundation model for cancer imaging biomarkers. Nat. Mach. Intell. 6, 354–367 (2024). source
Citation 21 is attached to radiology, not to ophthalmology or pathology. The Discussion reports robust performance of the paper’s cancer-imaging foundation model across three tasks and four cohorts, including superiority over baseline approaches for anatomical-site classification and malignancy prediction. (LLM, conf=0.92)
- Supportedcites [22] Xu, H. et al. A whole-slide foundation model for digital pathology from real-world data. Nature 630, 181–188 (2024). source
The citation range 22–25 is attached to pathology, not ophthalmology or radiology. The Abstract reports that this pathology foundation model achieves state-of-the-art performance on various digital pathology tasks, supporting the attributed claim. (LLM, conf=0.93)
- Supportedcites [23] Chen, R. J. et al. Towards a general-purpose foundation model for computational pathology. Nat. Med. 30, 850–862 (2024). source
This source supports the pathology portion of the citing sentence. The Introduction reports that its foundation model outperformed previous state-of-the-art models across pathology tasks, and the Discussion describes competitive performance across diverse clinical applications in pathology. The citations attached to ophthalmology and radiology are separate. (LLM, conf=0.91)
- Supportedcites [24] Vorontsov, E. et al. A foundation model for clinical-grade computational pathology and rare cancers detection. Nat. Med. 30, 2949–2935 (2024). source
This source supports the pathology portion of the multi-citation sentence. In the Results and Discussion, it reports strong performance by a pathology foundation model in cancer detection, including performance close to clinical-grade specialist models and better performance on some rare cancer variants. The ophthalmology and radiology portions are attached to other citations. (LLM, conf=0.93)
- Supportedcites [25] Wang, X. et al. A pathology foundation model for cancer diagnosis and prognosis prediction. Nature 634, 970–978 (2024). source
This source is cited for pathology, not for the separately cited ophthalmology and radiology examples. Its Abstract reports that the CHIEF pathology foundation model outperformed state-of-the-art deep-learning methods by up to 36.1%, supporting the performance claim. (LLM, conf=0.92)
boostedcorrelational- Asserted: passes — The authors put it forward as true.
- Checkable: passes — It can be checked against evidence.
- Load-bearing: fails — The paper’s conclusions may not depend on it.
- Based: passes — The paper gives a reason why it holds.
Probably not a substantial claim. The paper’s conclusions may not depend on it.
A result the paper reports from its own data — it cites no other source for it, so there is none to check. The quote shows it is in the paper.
In the paper
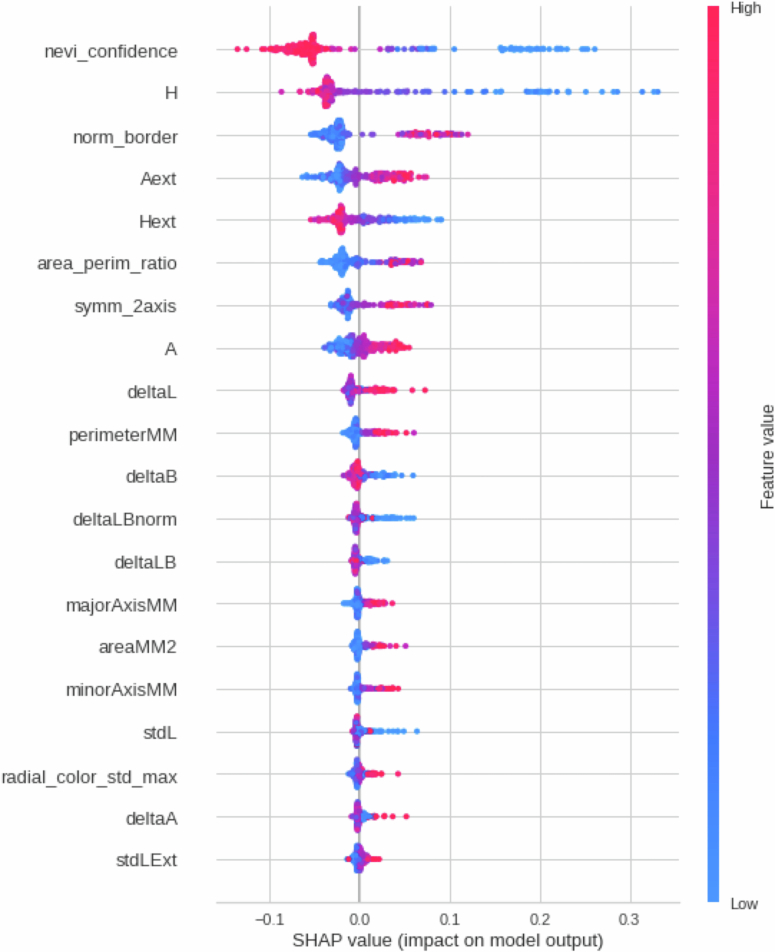
“Using TBP images alone, PanDerm achieved a sensitivity of 0.893, outperforming the next-best model by 4.2% (Fig. 4j, left).”
§ A multimodal vision foundation model for clinical dermatology > Results > Risk assessment and malignant lesion screening using TBP
plaindirect- Asserted: passes — The authors put it forward as true.
- Checkable: passes — It can be checked against evidence.
- Load-bearing: passes — The paper’s conclusions depend on it.
- Based: passes — The paper gives a reason why it holds.
It may state two separate claims as one.
A result the paper reports from its own data — it cites no other source for it, so there is none to check. The quote shows it is in the paper.
In the paper
“When clinical measurements were available for all models, PanDerm maintained its advantage with a 3.5% higher sensitivity (Fig. 4j, right), reaching a sensitivity of 0.893.”
§ A multimodal vision foundation model for clinical dermatology > Results > Risk assessment and malignant lesion screening using TBP
plaincorrelational- Asserted: passes — The authors put it forward as true.
- Checkable: passes — It can be checked against evidence.
- Load-bearing: passes — The paper’s conclusions depend on it.
- Based: passes — The paper gives a reason why it holds.
It may state two separate claims as one.
A result the paper reports from its own data — it cites no other source for it, so there is none to check. The quote shows it is in the paper.
In the paper
“PanDerm showed exceptional accuracy in distinguishing melanomas likely to metastasize, achieving an AUROC of 0.964 (95% CI 0.937–0.991), surpassing the next-best model by 2.0% (P = 0.073) (Fig. 3d).”
§ A multimodal vision foundation model for clinical dermatology > Results > Melanoma metastasis prediction and survival analysis
boostedcorrelationaln = 370 ·- Asserted: passes — The authors put it forward as true.
- Checkable: passes — It can be checked against evidence.
- Load-bearing: passes — The paper’s conclusions depend on it.
- Based: passes — The paper gives a reason why it holds.
It may state two separate claims as one.
A result the paper reports from its own data — it cites no other source for it, so there is none to check. The quote shows it is in the paper.
In the paper
“showing superior data scalability and training efficiency compared with existing self-supervised algorithms (Fig. 1f).”
§ A multimodal vision foundation model for clinical dermatology > Main
plain- Asserted: passes — The authors put it forward as true.
- Checkable: passes — It can be checked against evidence.
- Load-bearing: passes — The paper’s conclusions depend on it.
- Based: passes — The paper gives a reason why it holds.
It may state two separate claims as one.
A result the paper reports from its own data — it cites no other source for it, so there is none to check. The quote shows it is in the paper.
In the paper
“The model achieves unified representation learning across total-body photography (TBP) and clinical, dermoscopic and dermatopathology images, enabling comprehensive patient analysis throughout diverse clinical workflows (Fig. 1d).”
§ A multimodal vision foundation model for clinical dermatology > Main
plaindirect- Asserted: passes — The authors put it forward as true.
- Checkable: passes — It can be checked against evidence.
- Load-bearing: passes — The paper’s conclusions depend on it.
- Based: passes — The paper gives a reason why it holds.
It may state two separate claims as one.
A result the paper reports from its own data — it cites no other source for it, so there is none to check. The quote shows it is in the paper.
In the paper
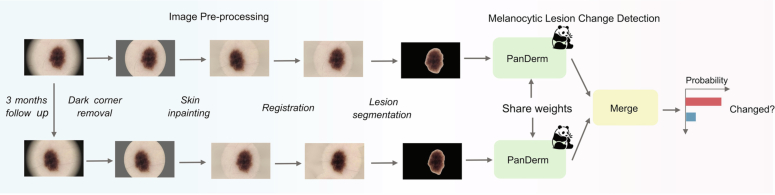
“Using the optimized pipeline for all models, PanDerm achieved AUROC improvements of 4.3% in SDDI1 (P < 0.001) and 3.7% in SDDI2 over the next-best model (Fig. 3c, middle).”
§ A multimodal vision foundation model for clinical dermatology > Results > Short-term lesion change detection in sequential dermoscopic images
plaindirect- Asserted: passes — The authors put it forward as true.
- Checkable: passes — It can be checked against evidence.
- Load-bearing: passes — The paper’s conclusions depend on it.
- Based: passes — The paper gives a reason why it holds.
It may state two separate claims as one.
A result the paper reports from its own data — it cites no other source for it, so there is none to check. The quote shows it is in the paper.
In the paper
“Even using computationally efficient methods, PanDerm maintained its advantages, outperforming both linear-probe and fine-tune versions of BiomedGPT by 14.3% and 5.1%, respectively, in linear probing (Supplementary Table 3).”
§ A multimodal vision foundation model for clinical dermatology > Results > Ablation studies and training strategy comparisons
plain- Asserted: passes — The authors put it forward as true.
- Checkable: passes — It can be checked against evidence.
- Load-bearing: passes — The paper’s conclusions depend on it.
- Based: passes — The paper gives a reason why it holds.
It may state two separate claims as one.
In the paper
“This processing system, combined with PanDerm’s advanced lesion change detection capabilities45, significantly improved change detection accuracy from 0.596 (95% confidence interval (CI) 0.567–0.624) to 0.706 (95% CI 0.686–0.725) in sequential digital dermoscopic imaging data (SDDI1) (Fig. 3a,c) (P < 0.001) and from 0.683 (95% CI 0.517–0.894) to 0.767 (95% CI 0.649–0.886) in SDDI2 (Fig. 3b,c, left”
§ A multimodal vision foundation model for clinical dermatology > Results > Short-term lesion change detection in sequential dermoscopic images
What the sources say
- Not checked yetcites [45] Zhang, B. et al. Short-term lesion change detection for melanoma screening with novel Siamese neural network. IEEE Trans. Med. Imaging 40, 840–851 (2020). source
plaindirect- Asserted: passes — The authors put it forward as true.
- Checkable: passes — It can be checked against evidence.
- Load-bearing: passes — The paper’s conclusions depend on it.
- Based: passes — The paper gives a reason why it holds.
It may state two separate claims as one.
A result the paper reports from its own data — it cites no other source for it, so there is none to check. The quote shows it is in the paper.
In the paper
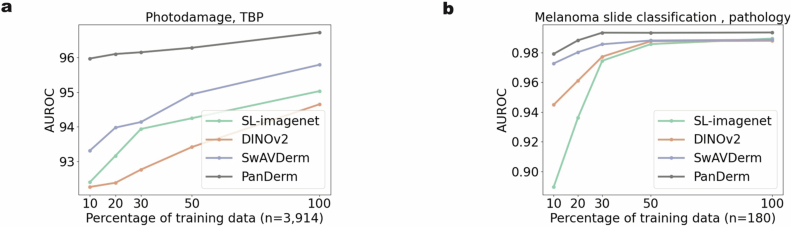
“PanDerm showed strong performance even with limited training data, achieving comparable results to other models while using only 10–30% of the labeled images (Fig. 2b and Supplementary Tables 5–10).”
§ A multimodal vision foundation model for clinical dermatology > Results > Diagnostic performance and generalization ability across datasets
boostedcorrelational- Asserted: passes — The authors put it forward as true.
- Checkable: passes — It can be checked against evidence.
- Load-bearing: passes — The paper’s conclusions depend on it.
- Based: passes — The paper gives a reason why it holds.
It may state two separate claims as one.
A result the paper reports from its own data — it cites no other source for it, so there is none to check. The quote shows it is in the paper.
In the paper
“It maintained high predictive accuracy over extended follow-up periods, with time-dependent areas under the curve (AUCs) of 0.950 (95% CI 0.910–0.991), 0.931 (95% CI 0.887–0.976) and 0.909 (95% CI 0.880–0.937) at 3 years, 5 years and 7 years, exceeding multi-clinical variables by 6.8%, 2.9% and 5.0%, respectively (Fig. 3i).”
§ A multimodal vision foundation model for clinical dermatology > Results > Melanoma metastasis prediction and survival analysis
plaincorrelational- Asserted: passes — The authors put it forward as true.
- Checkable: passes — It can be checked against evidence.
- Load-bearing: passes — The paper’s conclusions depend on it.
- Based: passes — The paper gives a reason why it holds.
It may state two separate claims as one.
A result the paper reports from its own data — it cites no other source for it, so there is none to check. The quote shows it is in the paper.
In the paper
“while showing emergent capabilities in dermatology similar to those of DINOv2 in natural images, with linear probing performance comparable to full-parameter fine-tuning (Supplementary Table 2).”
§ A multimodal vision foundation model for clinical dermatology > Results > Ablation studies and training strategy comparisons
plaincorrelational- Asserted: passes — The authors put it forward as true.
- Checkable: passes — It can be checked against evidence.
- Load-bearing: passes — The paper’s conclusions depend on it.
- Based: passes — The paper gives a reason why it holds.
It may state two separate claims as one.
A result the paper reports from its own data — it cites no other source for it, so there is none to check. The quote shows it is in the paper.
In the paper
“For lesions later diagnosed as malignant, PanDerm achieved an AUROC of 0.840 (95% CI 0.769–0.911), surpassing the next-best model by 15.0% (P < 0.01) (Fig. 3c, right).”
§ A multimodal vision foundation model for clinical dermatology > Results > Short-term lesion change detection in sequential dermoscopic images
plaincorrelational- Asserted: passes — The authors put it forward as true.
- Checkable: passes — It can be checked against evidence.
- Load-bearing: passes — The paper’s conclusions depend on it.
- Based: passes — The paper gives a reason why it holds.
It may state two separate claims as one.
A result the paper reports from its own data — it cites no other source for it, so there is none to check. The quote shows it is in the paper.
In the paper
“PanDerm achieved weighted F1 improvements of 3.2%, 7.1% and 8.2% on MMT-09, DermNet and MMT-74, respectively, compared with the next-best models (all P < 0.001).”
§ A multimodal vision foundation model for clinical dermatology > Results > Diagnostic performance and generalization ability across datasets
plaindirect- Asserted: passes — The authors put it forward as true.
- Checkable: passes — It can be checked against evidence.
- Load-bearing: passes — The paper’s conclusions depend on it.
- Based: passes — The paper gives a reason why it holds.
It may state two separate claims as one.
A result the paper reports from its own data — it cites no other source for it, so there is none to check. The quote shows it is in the paper.
In the paper
“PanDerm also consistently outperformed other AI approaches (Fig. 3j), showing improvements of 2.3%, 3.0% and 2.5% at 3 years, 5 years and 7 years, respectively.”
§ A multimodal vision foundation model for clinical dermatology > Results > Melanoma metastasis prediction and survival analysis
plaincorrelational- Asserted: passes — The authors put it forward as true.
- Checkable: passes — It can be checked against evidence.
- Load-bearing: passes — The paper’s conclusions depend on it.
- Based: passes — The paper gives a reason why it holds.
It may state two separate claims as one.
A result the paper reports from its own data — it cites no other source for it, so there is none to check. The quote shows it is in the paper.
In the paper
“In lesion-specific risk stratification, PanDerm also ranked first with an AUROC of 0.705 (95% CI 0.698–0.712) and balanced accuracy (BACC) of 0.657 (95% CI 0.6513–0.663), with all results statistically significant (P < 0.001; Fig. 4d,h).”
§ A multimodal vision foundation model for clinical dermatology > Results > Risk assessment and malignant lesion screening using TBP
plainn = 480 ·- Asserted: passes — The authors put it forward as true.
- Checkable: passes — It can be checked against evidence.
- Load-bearing: passes — The paper’s conclusions depend on it.
- Based: passes — The paper gives a reason why it holds.
It may state two separate claims as one.
A result the paper reports from its own data — it cites no other source for it, so there is none to check. The quote shows it is in the paper.
In the paper
“Significantly, it detected malignant lesions in 79 out of 80 patients while reducing unnecessary examinations by 60.8% compared with melanographers (3,498 versus 8,913 lesions recommended for detailed examination) (Fig. 4j,k and Supplementary Table 18).”
§ A multimodal vision foundation model for clinical dermatology > Results > Risk assessment and malignant lesion screening using TBP
boosteddirectn = 80- Asserted: passes — The authors put it forward as true.
- Checkable: passes — It can be checked against evidence.
- Load-bearing: passes — The paper’s conclusions depend on it.
- Based: passes — The paper gives a reason why it holds.
It may state two separate claims as one.
A result the paper reports from its own data — it cites no other source for it, so there is none to check. The quote shows it is in the paper.
In the paper
“Notably, it maintained high performance even on clinical photographs that were not used during training, with AUROC gains of 4.0%, 2.6% and 2.1% on the three external clinical datasets (all P < 0.001).”
§ A multimodal vision foundation model for clinical dermatology > Results > Diagnostic performance and generalization ability across datasets
plaincorrelational- Asserted: passes — The authors put it forward as true.
- Checkable: passes — It can be checked against evidence.
- Load-bearing: passes — The paper’s conclusions depend on it.
- Based: passes — The paper gives a reason why it holds.
It may state two separate claims as one.
A result the paper reports from its own data — it cites no other source for it, so there is none to check. The quote shows it is in the paper.
In the paper
“PanDerm consistently outperformed all other models, achieving significant improvements on 9 of 10 datasets, with average gains of 5.1%, 8.0%, 4.2% and 0.9% on dermoscopic, clinical, TBP and pathology datasets, respectively (Fig. 2a).”
§ A multimodal vision foundation model for clinical dermatology > Results > Diagnostic performance and generalization ability across datasets
plaincorrelational- Asserted: passes — The authors put it forward as true.
- Checkable: passes — It can be checked against evidence.
- Load-bearing: passes — The paper’s conclusions depend on it.
- Based: passes — The paper gives a reason why it holds.
It may state two separate claims as one.
A result the paper reports from its own data — it cites no other source for it, so there is none to check. The quote shows it is in the paper.
In the paper
“In a cohort of 480 patients with 196,933 lesions from Australia, PanDerm achieved a weighted F1 score of 0.896 (95% CI 0.879–0.913) for photodamage assessment and an AUROC of 0.983 (95% CI 0.979–0.987) for nevus counting, surpassing all other models (P < 0.05 and P < 0.001, respectively; Fig. 4b,c,g).”
§ A multimodal vision foundation model for clinical dermatology > Results > Risk assessment and malignant lesion screening using TBP
plainn = 480 ·- Asserted: passes — The authors put it forward as true.
- Checkable: passes — It can be checked against evidence.
- Load-bearing: passes — The paper’s conclusions depend on it.
- Based: passes — The paper gives a reason why it holds.
It may state two separate claims as one.
A result the paper reports from its own data — it cites no other source for it, so there is none to check. The quote shows it is in the paper.
In the paper
“PanDerm showed significant superiority over all pretrained models, achieving higher AUROC scores across all external datasets (Fig. 2c).”
§ A multimodal vision foundation model for clinical dermatology > Results > Diagnostic performance and generalization ability across datasets
plaincorrelational- Asserted: passes — The authors put it forward as true.
- Checkable: passes — It can be checked against evidence.
- Load-bearing: passes — The paper’s conclusions depend on it.
- Based: passes — The paper gives a reason why it holds.
It may state two separate claims as one.
None of the sources cited for this claim have been checked yet.
In the paper
“These advantages enabled PanDerm to improve upon both traditional models42,60 and recent generalist medical models such as BiomedGPT41.”
§ A multimodal vision foundation model for clinical dermatology > Discussion
What the sources say
- Not checked yetcites [42] Dosovitskiy, A. et al. An image is worth 16×16 words: transformers for image recognition at scale. In Proc. 9th International Conference on Learning Representations https://openreview.net/forum?id=YicbFdNTTy (OpenReview.net, 2021).
- Not checked yetcites [60] He, K., Zhang, X., Ren, S. & Sun, J. Deep residual learning for image recognition. In Proc. IEEE Conference on Computer Vision and Pattern Recognition 770–778 (IEEE, 2016). source
- Not checked yetcites [41] Zhang, K. et al. A generalist vision–language foundation model for diverse biomedical tasks. Nat. Med. 30, 3129–3141 (2024). source
plaindirect- Asserted: passes — The authors put it forward as true.
- Checkable: passes — It can be checked against evidence.
- Load-bearing: passes — The paper’s conclusions depend on it.
- Based: passes — The paper gives a reason why it holds.
It may state two separate claims as one.
A result the paper reports from its own data — it cites no other source for it, so there is none to check. The quote shows it is in the paper.
In the paper
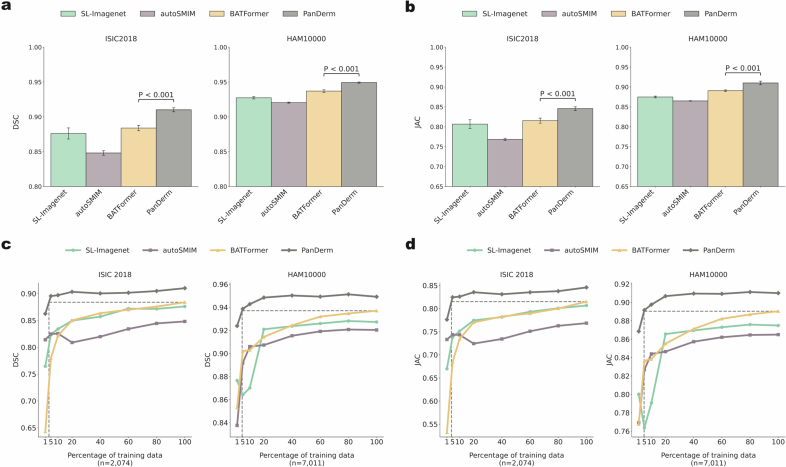
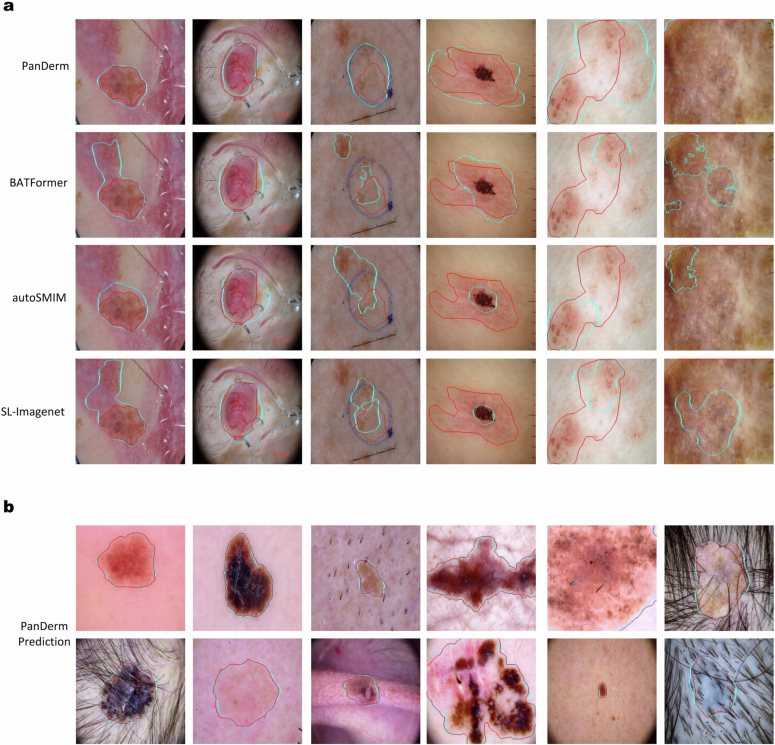
“In addition, PanDerm offers practical advantages in clinical settings, processing images about four to five times faster than MedSAM while using less computational resources (Supplementary Table 23).”
§ A multimodal vision foundation model for clinical dermatology > Results > Skin lesion segmentation
plaindirect- Asserted: passes — The authors put it forward as true.
- Checkable: passes — It can be checked against evidence.
- Load-bearing: unclear — It is unclear whether the paper’s conclusions depend on it.
- Based: passes — The paper gives a reason why it holds.
It may state two separate claims as one.
A result the paper reports from its own data — it cites no other source for it, so there is none to check. The quote shows it is in the paper.
In the paper
“In terms of overall accuracy, PanDerm outperformed the average human reviewer by 10.2% and surpassed the best-performing human by 3.6%.”
§ A multimodal vision foundation model for clinical dermatology > Results > Reader studies
plain- Asserted: passes — The authors put it forward as true.
- Checkable: passes — It can be checked against evidence.
- Load-bearing: passes — The paper’s conclusions depend on it.
- Based: passes — The paper gives a reason why it holds.
It may state two separate claims as one.
A result the paper reports from its own data — it cites no other source for it, so there is none to check. The quote shows it is in the paper.
In the paper
“Furthermore, when used independently, PanDerm achieved higher diagnostic accuracy than both unassisted readers (top 1 scores: 3.6 versus 2.83; P < 0.001) and human–AI collaboration (top 1 scores: 3.6 versus 3.08; P < 0.001).”
§ A multimodal vision foundation model for clinical dermatology > Results > Reader studies
plain- Asserted: passes — The authors put it forward as true.
- Checkable: passes — It can be checked against evidence.
- Load-bearing: passes — The paper’s conclusions depend on it.
- Based: passes — The paper gives a reason why it holds.
It may state two separate claims as one.
A result the paper reports from its own data — it cites no other source for it, so there is none to check. The quote shows it is in the paper.
In the paper
“Our model with CLIP-large teachers significantly improved performance and outperformed CLIP-large itself.”
§ A multimodal vision foundation model for clinical dermatology > Methods > Detail of model architecture and pretraining
plaindirect- Asserted: passes — The authors put it forward as true.
- Checkable: passes — It can be checked against evidence.
- Load-bearing: passes — The paper’s conclusions depend on it.
- Based: passes — The paper gives a reason why it holds.
It may state two separate claims as one.
A result the paper reports from its own data — it cites no other source for it, so there is none to check. The quote shows it is in the paper.
In the paper
“The model showed robust performance, achieving an 80.4% mean (macro-averaged) recall, with notably high recall rates for critical skin lesions: 87.2% for melanoma and 86.0% for BCC.”
§ A multimodal vision foundation model for clinical dermatology > Methods > Downstream evaluation details
boosted- Asserted: passes — The authors put it forward as true.
- Checkable: passes — It can be checked against evidence.
- Load-bearing: passes — The paper’s conclusions depend on it.
- Based: passes — The paper gives a reason why it holds.
It may state two separate claims as one.
The paper states this without a source or data behind it here, so there is nothing to check it against. The quote shows it is in the paper.
In the paper
“Notable diagnostic variability between pathologists was observed.”
§ A multimodal vision foundation model for clinical dermatology > Methods > Pretraining dataset for developing PanDerm
plainn = 54- Asserted: passes — The authors put it forward as true.
- Checkable: passes — It can be checked against evidence.
- Load-bearing: fails — The paper’s conclusions may not depend on it.
- Based: passes — The paper gives a reason why it holds.
Probably not a substantial claim. The paper’s conclusions may not depend on it.
None of the sources cited for this claim have been checked yet.
In the paper
“Recent advances in foundation models have emerged as a promising direction to address this challenge15,16.”
§ A multimodal vision foundation model for clinical dermatology > Main
What the sources say
- Not checked yetcites [15] Gui, H., Omiye, J. A., Chang, C. T. & Daneshjou, R. The promises and perils of foundation models in dermatology. J. Invest. Dermatol. 144, 1440–1448 (2024). source
- Not checked yetcites [16] Moor, M. et al. Foundation models for generalist medical artificial intelligence. Nature 616, 259–265 (2023). source
plainconditional- Asserted: passes — The authors put it forward as true.
- Checkable: passes — It can be checked against evidence.
- Load-bearing: passes — The paper’s conclusions depend on it.
- Based: passes — The paper gives a reason why it holds.
Probably not a substantial claim.
None of the sources cited for this claim have been checked yet.
In the paper
“In clinical practice, diagnosing and treating skin conditions involves a range of tasks, including total-body skin cancer detection and risk assessment2–5, differential diagnosis of hundreds of dermatological conditions such as inflammatory dermatoses and pigmentary disorders6, multimodal image analysis7,8, pathology interpretation9,10, monitoring lesion changes11,12 and predicting outcomes13,14.”
§ A multimodal vision foundation model for clinical dermatology > Main
What the sources say
- Not checked yetcites [2] Primiero, C. A. et al. A narrative review: opportunities and challenges in artificial intelligence skin image analyses using total body photography. J. Invest. Dermatol. 144, 1200–1207 (2024). source
- Not checked yetcites [3] Primiero, C. A. et al. A protocol for annotation of total body photography for machine learning to analyze skin phenotype and lesion classification. Front. Med. 11, 1380984 (2024). source
- Not checked yetcites [4] Olsen, C. M. et al. Risk stratification for melanoma: models derived and validated in a purpose-designed prospective cohort. J. Natl Cancer Inst. 110, 1075–1083 (2018). source
- Not checked yetcites [5] Usher-Smith, J. A., Emery, J., Kassianos, A. P. & Walter, F. M. Risk prediction models for melanoma: a systematic review. Cancer Epidemiol. Biomark. Prev. 23, 1450–1463 (2014). source
- Not checked yetcites [6] Liu, Y. et al. A deep learning system for differential diagnosis of skin diseases. Nat. Med. 26, 900–908 (2020). source
- Not checked yetcites [7] Yap, J., Yolland, W. & Tschandl, P. Multimodal skin lesion classification using deep learning. Exp. Dermatol. 27, 1261–1267 (2018). source
- Not checked yetcites [8] Luo, N. et al. Artificial intelligence-assisted dermatology diagnosis: from unimodal to multimodal. Comput. Biol. Med. https://doi.org/10.1016/j.compbiomed.2023.107413 (2023). source
plain- Asserted: passes — The authors put it forward as true.
- Checkable: passes — It can be checked against evidence.
- Load-bearing: passes — The paper’s conclusions depend on it.
- Based: passes — The paper gives a reason why it holds.
Probably not a substantial claim. It may state two separate claims as one.
A conclusion the paper draws from its own results — it cites no other source for it, so there is none to check. The quote shows it is in the paper.
In the paper
“These results show PanDerm’s potential to improve patient care across diverse clinical scenarios and serve as a model for developing multimodal foundation models in other medical specialties, potentially accelerating the integration of artificial intelligence support in healthcare.”
§ A multimodal vision foundation model for clinical dermatology > Abstract
hedgedconditional- Asserted: passes — The authors put it forward as true.
- Checkable: fails — It may be too vague to check against evidence.
- Load-bearing: passes — The paper’s conclusions depend on it.
- Based: passes — The paper gives a reason why it holds.
Probably not a substantial claim. It may be too vague to check against evidence. It may state two separate claims as one.
None of the sources cited for this claim have been checked yet.
In the paper
“Some efforts have focused on self-supervised learning specifically for dermatology using public datasets33,34 or web-sourced skin images35.”
§ A multimodal vision foundation model for clinical dermatology > Main
What the sources say
- Not checked yetcites [33] Wang, Z., Lyu, J. & Tang, X. autoSMIM: automatic superpixel-based masked image modeling for skin lesion segmentation. IEEE Trans. Med. Imaging 42, 3501–3511 (2023). source
- Not checked yetcites [34] Tschandl, P., Rosendahl, C. & Kittler, H. The HAM10000 dataset, a large collection of multi-source dermatoscopic images of common pigmented skin lesions. Sci. Data 5, 180161 (2018). source
- Not checked yetcites [35] Shen, Y. et al. Optimizing skin disease diagnosis: harnessing online community data with contrastive learning and clustering techniques. NPJ Digit. Med. 7, 28 (2024). source
plain- Asserted: passes — The authors put it forward as true.
- Checkable: passes — It can be checked against evidence.
- Load-bearing: fails — The paper’s conclusions may not depend on it.
- Based: passes — The paper gives a reason why it holds.
Probably not a substantial claim. The paper’s conclusions may not depend on it.
None of the sources cited for this claim have been checked yet.
In the paper
“In general computer vision, foundation models are pretrained on massive datasets such as ImageNet31 or JFT-300M (ref. 32) and most existing dermatology AI models still rely on these models for downstream adaptation.”
§ A multimodal vision foundation model for clinical dermatology > Main
What the sources say
- Not checked yetcites [31] Russakovsky, O. et al. ImageNet large scale visual recognition challenge. Int. J. Comput. Vis. 115, 211–252 (2015). source
- Not checked yetcites [32] Sun, C., Shrivastava, A., Singh, S. & Gupta, A. Revisiting unreasonable effectiveness of data in deep learning era. In Proc. IEEE International Conference on Computer Vision 843–852 (IEEE, 2017). source
plain- Asserted: passes — The authors put it forward as true.
- Checkable: passes — It can be checked against evidence.
- Load-bearing: passes — The paper’s conclusions depend on it.
- Based: passes — The paper gives a reason why it holds.
Probably not a substantial claim. It may state two separate claims as one.
None of the sources cited for this claim have been checked yet.
In the paper
“The performance of foundation models is inherently linked to the scale of their parameters and training data28–30.”
§ A multimodal vision foundation model for clinical dermatology > Main
What the sources say
- Not checked yetcites [28] Achiam, J. et al. Gpt-4 technical report. Preprint at https://arxiv.org/abs/2303.08774 (2023).
- Not checked yetcites [29] Zhai, X., Kolesnikov, A., Houlsby, N. & Beyer, L. Scaling vision transformers. In Proc. IEEE/CVF Conference on Computer Vision and Pattern Recognition 12104–12113 (IEEE, 2022). source
- Not checked yetcites [30] Kaplan, J. et al. Scaling laws for neural language models. Preprint at https://arxiv.org/abs/2001.08361 (2020).
plaincorrelational- Asserted: passes — The authors put it forward as true.
- Checkable: passes — It can be checked against evidence.
- Load-bearing: passes — The paper’s conclusions depend on it.
- Based: passes — The paper gives a reason why it holds.
Probably not a substantial claim.
In the paper
“Monitoring suspicious melanocytic lesions over a 3-month period is a widely accepted procedure for early melanoma detection, as changes often prompt excision to rule out melanoma, while stability can be reassuring12.”
§ A multimodal vision foundation model for clinical dermatology > Results > Short-term lesion change detection in sequential dermoscopic images
What the sources say
- Not checked yetcites [12] Altamura, D., Avramidis, M. & Menzies, S. W. Assessment of the optimal interval for and sensitivity of short-term sequential digital dermoscopy monitoring for the diagnosis of melanoma. Arch. Dermatol. 144, 502–506 (2008). source
plain- Asserted: passes — The authors put it forward as true.
- Checkable: passes — It can be checked against evidence.
- Load-bearing: passes — The paper’s conclusions depend on it.
- Based: passes — The paper gives a reason why it holds.
Probably not a substantial claim.
What the paper did — it cites no source for this, so there is none to check. The quote shows it is in the paper.
In the paper
“the evaluation mainly reflects overall accuracy rather than disease-specific analysis”
§ A multimodal vision foundation model for clinical dermatology > Discussion
plain- Asserted: passes — The authors put it forward as true.
- Checkable: passes — It can be checked against evidence.
- Load-bearing: fails — The paper’s conclusions may not depend on it.
- Based: passes — The paper gives a reason why it holds.
Probably not a substantial claim. The paper’s conclusions may not depend on it.
A conclusion the paper draws from its own results — it cites no other source for it, so there is none to check. The quote shows it is in the paper.
In the paper
“These findings suggest promising directions for developing foundation models in other medical specialties in which the integration of diverse imaging modalities and complex clinical workflows is crucial for patient care.”
§ A multimodal vision foundation model for clinical dermatology > Discussion
hedged- Asserted: passes — The authors put it forward as true.
- Checkable: fails — It may be too vague to check against evidence.
- Load-bearing: fails — The paper’s conclusions may not depend on it.
- Based: passes — The paper gives a reason why it holds.
Probably not a substantial claim. It may be too vague to check against evidence. The paper’s conclusions may not depend on it.
A conclusion the paper draws from its own results — it cites no other source for it, so there is none to check. The quote shows it is in the paper.
In the paper
“Our development approach, combining systematic data curation, advanced self-supervised learning and rigorous clinical validation, provides a framework for developing medical AI systems that can adapt to varying levels of clinical expertise and healthcare settings.”
§ A multimodal vision foundation model for clinical dermatology > Discussion
plaindirect- Asserted: passes — The authors put it forward as true.
- Checkable: passes — It can be checked against evidence.
- Load-bearing: passes — The paper’s conclusions depend on it.
- Based: passes — The paper gives a reason why it holds.
Probably not a substantial claim.
A conclusion the paper draws from its own results — it cites no other source for it, so there is none to check. The quote shows it is in the paper.
In the paper
“These capabilities stem from its rich knowledge representation, developed through pretraining on varied dermatological image modalities and conditions, leading to consistent and significant performance improvements across tasks and modalities.”
§ A multimodal vision foundation model for clinical dermatology > Discussion
plaindirect- Asserted: passes — The authors put it forward as true.
- Checkable: passes — It can be checked against evidence.
- Load-bearing: passes — The paper’s conclusions depend on it.
- Based: passes — The paper gives a reason why it holds.
It may state two separate claims as one.
A conclusion the paper draws from its own results — it cites no other source for it, so there is none to check. The quote shows it is in the paper.
In the paper
“our results suggest that specialty-specific foundation models designed with clinical workflows in mind may offer more practical solutions for specialties in which multiple imaging modalities are crucial.”
§ A multimodal vision foundation model for clinical dermatology > Discussion
hedgedconditional- Asserted: passes — The authors put it forward as true.
- Checkable: fails — It may be too vague to check against evidence.
- Load-bearing: passes — The paper’s conclusions depend on it.
- Based: passes — The paper gives a reason why it holds.
Probably not a substantial claim. It may be too vague to check against evidence.
What the paper did — it cites no source for this, so there is none to check. The quote shows it is in the paper.
In the paper
“Our strategy minimizes this risk, ensuring that benchmark evaluations accurately reflect real-world model performance.”
§ A multimodal vision foundation model for clinical dermatology > Discussion
plaindirect- Asserted: passes — The authors put it forward as true.
- Checkable: passes — It can be checked against evidence.
- Load-bearing: passes — The paper’s conclusions depend on it.
- Based: passes — The paper gives a reason why it holds.
It may state two separate claims as one.
A conclusion the paper draws from its own results — it cites no other source for it, so there is none to check. The quote shows it is in the paper.
In the paper
“comprehensive bias assessment requires metrics beyond overall accuracy.”
§ A multimodal vision foundation model for clinical dermatology > Discussion
plain- Asserted: passes — The authors put it forward as true.
- Checkable: fails — It may be too vague to check against evidence.
- Load-bearing: passes — The paper’s conclusions depend on it.
- Based: passes — The paper gives a reason why it holds.
Probably not a substantial claim. It may be too vague to check against evidence.
None of the sources cited for this claim have been checked yet.
In the paper
“This approach contrasts with previous efforts, such as SwAVDerm35, which relied on web-sourced skin data, inadvertently incorporating images from commonly used benchmarks such as ISIC55 and DermNet44, increasing the risk of data leakage and compromising evaluation validity.”
§ A multimodal vision foundation model for clinical dermatology > Discussion
What the sources say
- Not checked yetcites [35] Shen, Y. et al. Optimizing skin disease diagnosis: harnessing online community data with contrastive learning and clustering techniques. NPJ Digit. Med. 7, 28 (2024). source
- Not checked yetcites [55] Codella, N. C. et al. Skin lesion analysis toward melanoma detection: a challenge at the 2017 International Symposium on Biomedical Imaging (ISBI), hosted by the International Skin Imaging Collaboration (ISIC). In Proc. IEEE 15th International Symposium on Biomedical Imaging (eds Meijering, E. & Summers, R.) 168–172 (IEEE, 2018). source
- Not checked yetcites [44] Dermnet. Dermnet https://dermnet.com/ (2023).
plaindirect- Asserted: passes — The authors put it forward as true.
- Checkable: passes — It can be checked against evidence.
- Load-bearing: passes — The paper’s conclusions depend on it.
- Based: passes — The paper gives a reason why it holds.
It may state two separate claims as one.
In the paper
“The HIBA55 dataset is curated from the HIBA data from the ISIC archive55, containing 1,635 dermoscopic images with melanoma and other classes.”
§ A multimodal vision foundation model for clinical dermatology > Methods > Skin cancer and general skin condition classification datasets
What the sources say
- Not checked yetcites [55] Codella, N. C. et al. Skin lesion analysis toward melanoma detection: a challenge at the 2017 International Symposium on Biomedical Imaging (ISBI), hosted by the International Skin Imaging Collaboration (ISIC). In Proc. IEEE 15th International Symposium on Biomedical Imaging (eds Meijering, E. & Summers, R.) 168–172 (IEEE, 2018). source
plain- Asserted: passes — The authors put it forward as true.
- Checkable: passes — It can be checked against evidence.
- Load-bearing: fails — The paper’s conclusions may not depend on it.
- Based: passes — The paper gives a reason why it holds.
Probably not a substantial claim. The paper’s conclusions may not depend on it.
What the paper did — it cites no source for this, so there is none to check. The quote shows it is in the paper.
In the paper
“The HOP study has received approval from the Human Research Ethics Committee (HREC) from Metro South Health HREC (HREC/17/QPAH/816) and the University of Queensland HREC (2018000074).”
§ A multimodal vision foundation model for clinical dermatology > Methods > Ethics statement
plain- Asserted: passes — The authors put it forward as true.
- Checkable: passes — It can be checked against evidence.
- Load-bearing: fails — The paper’s conclusions may not depend on it.
- Based: passes — The paper gives a reason why it holds.
Probably not a substantial claim. The paper’s conclusions may not depend on it. It may state two separate claims as one.
What the paper did — it cites no source for this, so there is none to check. The quote shows it is in the paper.
In the paper
“The naevus surveillance study images (NSSI) dataset is part of the Brisbane Naevus Morphology Study, circa 2009–2014. The study followed the Declaration of Helsinki protocols and was approved by the Princess Alexandra Hospital human research ethics committee.”
§ A multimodal vision foundation model for clinical dermatology > Methods > Ethics statement
plain- Asserted: passes — The authors put it forward as true.
- Checkable: passes — It can be checked against evidence.
- Load-bearing: fails — The paper’s conclusions may not depend on it.
- Based: passes — The paper gives a reason why it holds.
Probably not a substantial claim. The paper’s conclusions may not depend on it. It may state two separate claims as one.
What the paper did — it cites no source for this, so there is none to check. The quote shows it is in the paper.
In the paper
“To compare models, we implement pairwise permutation tests, conducting 1,000 permutations per pair and recalculating performance metrics after each permutation.”
§ A multimodal vision foundation model for clinical dermatology > Methods > Downstream evaluation details
plain- Asserted: passes — The authors put it forward as true.
- Checkable: passes — It can be checked against evidence.
- Load-bearing: passes — The paper’s conclusions depend on it.
- Based: passes — The paper gives a reason why it holds.
Probably not a substantial claim.
What the paper did — it cites no source for this, so there is none to check. The quote shows it is in the paper.
In the paper
“In addition, we perform t-tests to assess the statistical significance of inter-model performance variations.”
§ A multimodal vision foundation model for clinical dermatology > Methods > Downstream evaluation details
plain- Asserted: passes — The authors put it forward as true.
- Checkable: passes — It can be checked against evidence.
- Load-bearing: fails — The paper’s conclusions may not depend on it.
- Based: passes — The paper gives a reason why it holds.
Probably not a substantial claim. The paper’s conclusions may not depend on it.
In the paper
“The dataset contains 647 clinical images from the United States.”
§ A multimodal vision foundation model for clinical dermatology > Methods > Skin cancer and general skin condition classification datasets
What the sources say
- Not checked yetcites [63] Daneshjou, R. et al. Disparities in dermatology AI performance on a diverse, curated clinical image set. Sci. Adv. 8, eabq6147 (2022). source
plain- Asserted: passes — The authors put it forward as true.
- Checkable: passes — It can be checked against evidence.
- Load-bearing: fails — The paper’s conclusions may not depend on it.
- Based: passes — The paper gives a reason why it holds.
Probably not a substantial claim. The paper’s conclusions may not depend on it.
In the paper
“The Med-Node82 dataset contains 170 clinical images.”
§ A multimodal vision foundation model for clinical dermatology > Methods > Skin cancer and general skin condition classification datasets
What the sources say
- Not checked yetcites [82] Giotis, I. et al. MED-NODE: a computer-assisted melanoma diagnosis system using non-dermoscopic images. Expert Syst. Appl. 42, 6578–6585 (2015). source
plain- Asserted: passes — The authors put it forward as true.
- Checkable: passes — It can be checked against evidence.
- Load-bearing: fails — The paper’s conclusions may not depend on it.
- Based: passes — The paper gives a reason why it holds.
Probably not a substantial claim. The paper’s conclusions may not depend on it.
What the paper did — it cites no source for this, so there is none to check. The quote shows it is in the paper.
In the paper
“We ensure robust evaluation through fivefold cross-validation, stratifying by both case and label attributes.”
§ A multimodal vision foundation model for clinical dermatology > Methods > Downstream evaluation details
plaindirect- Asserted: passes — The authors put it forward as true.
- Checkable: passes — It can be checked against evidence.
- Load-bearing: passes — The paper’s conclusions depend on it.
- Based: passes — The paper gives a reason why it holds.
Probably not a substantial claim.
In the paper
“The BCN20000 (ref. 79) dataset comprises 12,413 dermoscopic images in 9 categories: nevus, melanoma, basal cell carcinoma, seborrheic keratosis, actinic keratosis, solar lentigo, squamous cell carcinoma, dermatofibroma and vascular lesions, including lesions in hard-to-diagnose locations.”
§ A multimodal vision foundation model for clinical dermatology > Methods > Skin cancer and general skin condition classification datasets
What the sources say
- Not checked yetcites ref. 79
plain- Asserted: passes — The authors put it forward as true.
- Checkable: passes — It can be checked against evidence.
- Load-bearing: fails — The paper’s conclusions may not depend on it.
- Based: passes — The paper gives a reason why it holds.
Probably not a substantial claim. The paper’s conclusions may not depend on it.
In the paper
“The Fitzpatrick17K (ref. 62) dataset comprises 16,577 clinical images annotated with both dermatological diagnoses and Fitzpatrick skin types (I–VI). It encompasses 114 distinct conditions”
§ A multimodal vision foundation model for clinical dermatology > Methods > Skin cancer and general skin condition classification datasets
What the sources say
- Not checked yetcites ref. 62
plain- Asserted: passes — The authors put it forward as true.
- Checkable: passes — It can be checked against evidence.
- Load-bearing: unclear — It is unclear whether the paper’s conclusions depend on it.
- Based: passes — The paper gives a reason why it holds.
It may state two separate claims as one.
In the paper
“The HAM10000 (ref. 34) dataset contains 10,015 dermoscopic images across 7 classes: actinic keratoses, basal cell carcinoma, benign keratosis, dermatofibroma, melanocytic nevi, melanoma and vascular lesions.”
§ A multimodal vision foundation model for clinical dermatology > Methods > Skin cancer and general skin condition classification datasets
What the sources say
- Not checked yetcites ref. 34
plain- Asserted: passes — The authors put it forward as true.
- Checkable: passes — It can be checked against evidence.
- Load-bearing: fails — The paper’s conclusions may not depend on it.
- Based: passes — The paper gives a reason why it holds.
Probably not a substantial claim. The paper’s conclusions may not depend on it.
A conclusion the paper draws from its own results — it cites no other source for it, so there is none to check. The quote shows it is in the paper.
In the paper
“probably owing to the limited data scale of skin images in medical-domain CLIP models.”
§ A multimodal vision foundation model for clinical dermatology > Methods > Detail of model architecture and pretraining
hedgedconditional- Asserted: passes — The authors put it forward as true.
- Checkable: passes — It can be checked against evidence.
- Load-bearing: unclear — It is unclear whether the paper’s conclusions depend on it.
- Based: unclear — It is unclear why the paper says it holds.
It may state two separate claims as one.
What the paper did — it cites no source for this, so there is none to check. The quote shows it is in the paper.
In the paper
“For skin tumor patch classification, melanoma slide classification, reader studies, metastasis prediction and skin lesion segmentation, we conduct k-fold cross-validation owing to either a relatively small sample size or following conventional practice.”
§ A multimodal vision foundation model for clinical dermatology > Methods > Downstream evaluation details
plain- Asserted: passes — The authors put it forward as true.
- Checkable: passes — It can be checked against evidence.
- Load-bearing: fails — The paper’s conclusions may not depend on it.
- Based: passes — The paper gives a reason why it holds.
Probably not a substantial claim. The paper’s conclusions may not depend on it.
What the paper did — it cites no source for this, so there is none to check. The quote shows it is in the paper.
In the paper
“To assess statistical significance, we conduct two-sided t-tests comparing PanDerm’s performance against the baseline model for each task.”
§ A multimodal vision foundation model for clinical dermatology > Methods > Downstream evaluation details
plain- Asserted: passes — The authors put it forward as true.
- Checkable: passes — It can be checked against evidence.
- Load-bearing: passes — The paper’s conclusions depend on it.
- Based: passes — The paper gives a reason why it holds.
Probably not a substantial claim.
What the paper did — it cites no source for this, so there is none to check. The quote shows it is in the paper.
In the paper
“The SDDI2 dataset has been approved by the Ethics Review Board of the Medical University of Vienna.”
§ A multimodal vision foundation model for clinical dermatology > Methods > Ethics statement
plain- Asserted: passes — The authors put it forward as true.
- Checkable: passes — It can be checked against evidence.
- Load-bearing: fails — The paper’s conclusions may not depend on it.
- Based: passes — The paper gives a reason why it holds.
Probably not a substantial claim. The paper’s conclusions may not depend on it.
What the paper did — it cites no source for this, so there is none to check. The quote shows it is in the paper.
In the paper
“The ACEMID pathology (ACEMID_path) pilot study has received approval from the Alfred Hospital Ethics Committee (approval number: 746/23)”
§ A multimodal vision foundation model for clinical dermatology > Methods > Ethics statement
plain- Asserted: passes — The authors put it forward as true.
- Checkable: passes — It can be checked against evidence.
- Load-bearing: passes — The paper’s conclusions depend on it.
- Based: passes — The paper gives a reason why it holds.
Probably not a substantial claim.
In the paper
“PH2 (ref. 81) is a clinical image dataset from Portugal with 200 images and 3 classes.”
§ A multimodal vision foundation model for clinical dermatology > Methods > Skin cancer and general skin condition classification datasets
What the sources say
- Not checked yetcites ref. 81
plain- Asserted: passes — The authors put it forward as true.
- Checkable: passes — It can be checked against evidence.
- Load-bearing: fails — The paper’s conclusions may not depend on it.
- Based: passes — The paper gives a reason why it holds.
Probably not a substantial claim. The paper’s conclusions may not depend on it. It may state two separate claims as one.
What the paper did — it cites no source for this, so there is none to check. The quote shows it is in the paper.
In the paper
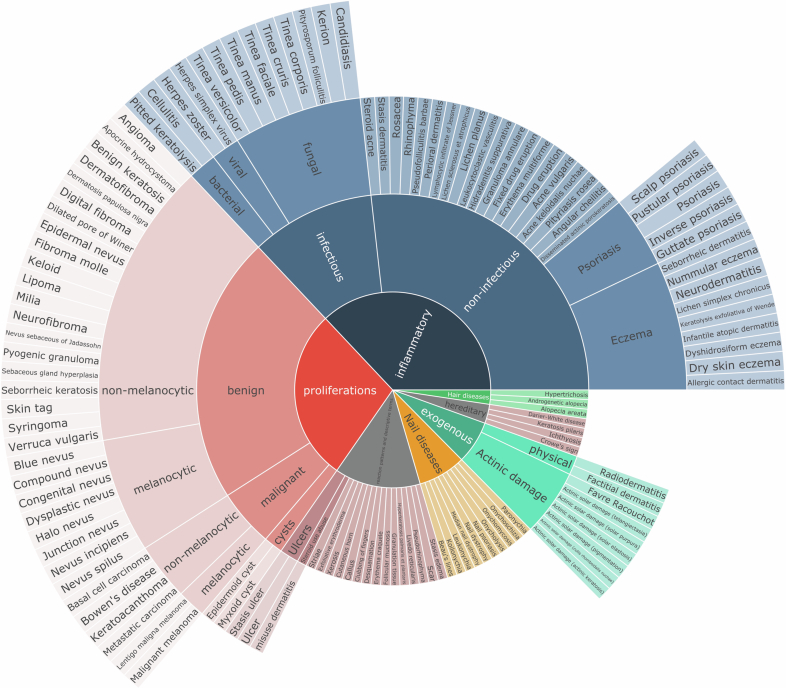
“Before the evaluation, four experienced dermatologists collaboratively developed a standard ontology to systematically categorize the 128 skin conditions and facilitate expert evaluation (Extended Data Fig. 8).”
§ A multimodal vision foundation model for clinical dermatology > Methods > Downstream evaluation details
plain- Asserted: passes — The authors put it forward as true.
- Checkable: passes — It can be checked against evidence.
- Load-bearing: passes — The paper’s conclusions depend on it.
- Based: passes — The paper gives a reason why it holds.
Probably not a substantial claim.
What the paper did — it cites no source for this, so there is none to check. The quote shows it is in the paper.
In the paper
“To ensure a fair comparison, all images are resized to 224 × 224.”
§ A multimodal vision foundation model for clinical dermatology > Methods > Downstream evaluation details
plain- Asserted: passes — The authors put it forward as true.
- Checkable: passes — It can be checked against evidence.
- Load-bearing: passes — The paper’s conclusions depend on it.
- Based: passes — The paper gives a reason why it holds.
Probably not a substantial claim.
What the paper did — it cites no source for this, so there is none to check. The quote shows it is in the paper.
In the paper
“For the remaining datasets, we use nonparametric bootstrapping with 1,000 replicates to estimate 95% CIs for each model’s performance.”
§ A multimodal vision foundation model for clinical dermatology > Methods > Downstream evaluation details
plain- Asserted: passes — The authors put it forward as true.
- Checkable: passes — It can be checked against evidence.
- Load-bearing: fails — The paper’s conclusions may not depend on it.
- Based: passes — The paper gives a reason why it holds.
Probably not a substantial claim. The paper’s conclusions may not depend on it.
What the paper did — it cites no source for this, so there is none to check. The quote shows it is in the paper.
In the paper
“Only de-identified retrospective data were used for research, without the active involvement of patients.”
§ A multimodal vision foundation model for clinical dermatology > Methods > Ethics statement
plain- Asserted: passes — The authors put it forward as true.
- Checkable: passes — It can be checked against evidence.
- Load-bearing: fails — The paper’s conclusions may not depend on it.
- Based: passes — The paper gives a reason why it holds.
Probably not a substantial claim. The paper’s conclusions may not depend on it. It may state two separate claims as one.
What the paper did — it cites no source for this, so there is none to check. The quote shows it is in the paper.
In the paper
“Subsequently, we fine-tuned these models using identical hyperparameter setups to ensure a fair comparison.”
§ A multimodal vision foundation model for clinical dermatology > Methods > Downstream evaluation details
plain- Asserted: passes — The authors put it forward as true.
- Checkable: passes — It can be checked against evidence.
- Load-bearing: passes — The paper’s conclusions depend on it.
- Based: passes — The paper gives a reason why it holds.
Probably not a substantial claim.
What the paper did — it cites no source for this, so there is none to check. The quote shows it is in the paper.
In the paper
“The ComBineMel dataset is part of the Computer Biomarkers Evaluation of Invasive Melanoma (ComBine Mel) study. The study was approved by the Alfred Hospital Ethics Committee on 8 August 2023 (approval number: HREC/98200/Alfred-2023).”
§ A multimodal vision foundation model for clinical dermatology > Methods > Ethics statement
plain- Asserted: passes — The authors put it forward as true.
- Checkable: passes — It can be checked against evidence.
- Load-bearing: fails — The paper’s conclusions may not depend on it.
- Based: passes — The paper gives a reason why it holds.
Probably not a substantial claim. The paper’s conclusions may not depend on it.
What the paper did — it cites no source for this, so there is none to check. The quote shows it is in the paper.
In the paper
“To mitigate bias, we included ten single time-point melanoma images, preventing reviewers from assuming that the first image in a series was benign.”
§ A multimodal vision foundation model for clinical dermatology > Methods > Downstream evaluation details
plaindirect- Asserted: passes — The authors put it forward as true.
- Checkable: passes — It can be checked against evidence.
- Load-bearing: passes — The paper’s conclusions depend on it.
- Based: passes — The paper gives a reason why it holds.
Probably not a substantial claim.
In the paper
“The melanoma slide classification task83 from the National Cancer Institute’s Clinical Proteomic Tumor Analysis Consortium Cutaneous Melanoma (CPTAC-CM) cohort consists of histopathology WSIs for cancer detection.”
§ A multimodal vision foundation model for clinical dermatology > Methods > Skin cancer and general skin condition classification datasets
What the sources say
- Not checked yetcites [83] Clark, K. et al. The Cancer Imaging Archive (TCIA): maintaining and operating a public information repository. J. Digit. Imaging 26, 1045–1057 (2013). source
plain- Asserted: passes — The authors put it forward as true.
- Checkable: passes — It can be checked against evidence.
- Load-bearing: fails — The paper’s conclusions may not depend on it.
- Based: passes — The paper gives a reason why it holds.
Probably not a substantial claim. The paper’s conclusions may not depend on it.
What the paper did — it cites no source for this, so there is none to check. The quote shows it is in the paper.
In the paper
“To enhance the robustness and mitigate potential data selection bias, we perform five iterations of dataset splitting into training and testing sets, stratified by melanoma stage.”
§ A multimodal vision foundation model for clinical dermatology > Methods > Downstream evaluation details
plaindirect- Asserted: passes — The authors put it forward as true.
- Checkable: passes — It can be checked against evidence.
- Load-bearing: passes — The paper’s conclusions depend on it.
- Based: passes — The paper gives a reason why it holds.
Probably not a substantial claim.
In the paper
“DermNet44 contains 19,559 clinical images; this dataset consists of images of 23 types of skin diseases and captures common clinical presentations including inflammatory conditions (eczema, psoriasis), infections (bacterial, viral, fungal) and neoplastic diseases.”
§ A multimodal vision foundation model for clinical dermatology > Methods > Skin cancer and general skin condition classification datasets
What the sources say
- Not checked yetcites [44] Dermnet. Dermnet https://dermnet.com/ (2023).
plain- Asserted: passes — The authors put it forward as true.
- Checkable: passes — It can be checked against evidence.
- Load-bearing: unclear — It is unclear whether the paper’s conclusions depend on it.
- Based: passes — The paper gives a reason why it holds.
It may state two separate claims as one.
In the paper
“The ISIC2018 dataset52 comprises 3,694 dermoscopic images with 2,594 images for training, 100 for validation and 1,000 for testing.”
§ A multimodal vision foundation model for clinical dermatology > Methods > Longitudinal and melanoma metastasis datasets
What the sources say
- Not checked yetcites [52] Milton, M. A. A. Automated skin lesion classification using ensemble of deep neural networks in ISIC 2018: skin lesion analysis towards melanoma detection challenge. Preprint at https://arxiv.org/abs/1901.10802 (2019).
plain- Asserted: passes — The authors put it forward as true.
- Checkable: passes — It can be checked against evidence.
- Load-bearing: unclear — It is unclear whether the paper’s conclusions depend on it.
- Based: passes — The paper gives a reason why it holds.
It may state two separate claims as one.
In the paper
“The Memorial Sloan Kettering Cancer Center (MSKCC)55 dataset is curated from the MSKCC data from the ISIC archive55, containing 8,984 dermoscopic images with melanoma and other classes.”
§ A multimodal vision foundation model for clinical dermatology > Methods > Skin cancer and general skin condition classification datasets
What the sources say
- Not checked yetcites [55] Codella, N. C. et al. Skin lesion analysis toward melanoma detection: a challenge at the 2017 International Symposium on Biomedical Imaging (ISBI), hosted by the International Skin Imaging Collaboration (ISIC). In Proc. IEEE 15th International Symposium on Biomedical Imaging (eds Meijering, E. & Summers, R.) 168–172 (IEEE, 2018). source
plain- Asserted: passes — The authors put it forward as true.
- Checkable: passes — It can be checked against evidence.
- Load-bearing: fails — The paper’s conclusions may not depend on it.
- Based: passes — The paper gives a reason why it holds.
Probably not a substantial claim. The paper’s conclusions may not depend on it.
What the paper did — it cites no source for this, so there is none to check. The quote shows it is in the paper.
In the paper
“The MMT data study is part of a research agreement study with Monash eResearch Centre and was approved through the Monash University Human Research Ethics Committee.”
§ A multimodal vision foundation model for clinical dermatology > Methods > Ethics statement
plain- Asserted: passes — The authors put it forward as true.
- Checkable: passes — It can be checked against evidence.
- Load-bearing: fails — The paper’s conclusions may not depend on it.
- Based: passes — The paper gives a reason why it holds.
Probably not a substantial claim. The paper’s conclusions may not depend on it.
In the paper
“All other experiments used the clean version from a previous study78, which prevents data leakage by ensuring that lesions from the same patient are not split across sets.”
§ A multimodal vision foundation model for clinical dermatology > Methods > Skin cancer and general skin condition classification datasets
What the sources say
- Not checked yetcites previous study78
plaindirect- Asserted: passes — The authors put it forward as true.
- Checkable: passes — It can be checked against evidence.
- Load-bearing: passes — The paper’s conclusions depend on it.
- Based: passes — The paper gives a reason why it holds.
It may state two separate claims as one.
In the paper
“The PAD-UFES-20 (ref. 43) dataset from Brazil contains 2,298 close-up clinical images with 6 classes, including actinic keratosis, basal cell carcinoma of the skin, malignant melanoma, melanocytic nevus of the skin, squamous cell carcinoma and seborrheic keratosis.”
§ A multimodal vision foundation model for clinical dermatology > Methods > Skin cancer and general skin condition classification datasets
What the sources say
- Not checked yetcites ref. 43
plain- Asserted: passes — The authors put it forward as true.
- Checkable: passes — It can be checked against evidence.
- Load-bearing: fails — The paper’s conclusions may not depend on it.
- Based: passes — The paper gives a reason why it holds.
Probably not a substantial claim. The paper’s conclusions may not depend on it.
What the paper did — it cites no source for this, so there is none to check. The quote shows it is in the paper.
In the paper
“The MYM study was approved by the Metro South Health Human Research Ethics Committee on 21 April 2016 (approval number: HREC/16/QPAH/125).”
§ A multimodal vision foundation model for clinical dermatology > Methods > Ethics statement
plain- Asserted: passes — The authors put it forward as true.
- Checkable: passes — It can be checked against evidence.
- Load-bearing: fails — The paper’s conclusions may not depend on it.
- Based: passes — The paper gives a reason why it holds.
Probably not a substantial claim. The paper’s conclusions may not depend on it.
What the paper did — it cites no source for this, so there is none to check. The quote shows it is in the paper.
In the paper
“The SDDI_Alfred study has received approval from the Alfred Hospital Ethics Committee (approval number: 198/19) for the use of sequential dermoscopic imaging data.”
§ A multimodal vision foundation model for clinical dermatology > Methods > Ethics statement
plain- Asserted: passes — The authors put it forward as true.
- Checkable: passes — It can be checked against evidence.
- Load-bearing: fails — The paper’s conclusions may not depend on it.
- Based: passes — The paper gives a reason why it holds.
Probably not a substantial claim. The paper’s conclusions may not depend on it.
What the paper did — it cites no source for this, so there is none to check. The quote shows it is in the paper.
In the paper
“To ensure robust assessment, each case was evaluated by three assessors, with cases showing significant scoring discordance (differences between 3/4 and 1/2) reviewed in consensus meetings to establish final scores.”
§ A multimodal vision foundation model for clinical dermatology > Methods > Downstream evaluation details
plaindirect- Asserted: passes — The authors put it forward as true.
- Checkable: passes — It can be checked against evidence.
- Load-bearing: passes — The paper’s conclusions depend on it.
- Based: passes — The paper gives a reason why it holds.
Probably not a substantial claim. It may state two separate claims as one.
In the paper
“ISIC2024 (ref. 47) is a multicenter dataset with skin lesion crops from TBP. We chose holdout data with 49,025 crop images with three institutions (FNQH Cairns, Alfred Hospital, Melanoma Institute Australia) as the evaluation dataset.”
§ A multimodal vision foundation model for clinical dermatology > Methods > Skin cancer and general skin condition classification datasets
What the sources say
- Not checked yetcites ref. 47
plain- Asserted: passes — The authors put it forward as true.
- Checkable: passes — It can be checked against evidence.
- Load-bearing: passes — The paper’s conclusions depend on it.
- Based: passes — The paper gives a reason why it holds.
It may state two separate claims as one.
The paper relies on this without support.
Current AI models for dermatology struggle to integrate various data types and imaging modalities, reducing their utility in different real-world clinical settings.
“These models struggle to integrate various data types and imaging modalities, reducing their utility in different real-world clinical settings.”
The paper relies on this without support.
The absence of integrated AI solutions capable of supporting various clinical workflows currently hampers the practical impact of AI in dermatology.
“The absence of integrated AI solutions capable of supporting these various workflows currently hampers the practical impact of AI in dermatology.”
The paper relies on this without support.
Through comprehensive pretraining on large and diverse data, foundation models develop versatile representations that can effectively adapt to various clinical scenarios, outperforming previous deep learning models in downstream tasks.
“Through comprehensive pretraining on large and diverse data, these models develop versatile representations that can effectively adapt to various clinical scenarios, outperforming previous deep learning models in downstream tasks.”
The paper relies on this without support.
Existing dermatology self-supervised approaches are often limited by dataset size, diversity or lack of real patient data.
“However, these approaches are often limited by dataset size, diversity or the lack of real patient data.”
The paper relies on this without support.
General biomedical foundation models struggle with domain-specific data scarcity and integrating heterogeneous modalities for comprehensive clinical analysis.
“while general biomedical models, despite their broad scope, struggle with domain-specific data scarcity and integrating heterogeneous modalities for comprehensive clinical analysis.”
The paper relies on this without support.
Current AI systems are often restricted to isolated tasks and unable to address diverse demands of medical decision-making.
“Current AI systems are often restricted to isolated tasks and are unable to address the diverse demands of medical decision-making.”
The paper relies on this without support.
There are over 1,000 known dermatological conditions.
“over 1,000 diagnoses”
The paper relies on this without support.
Biopsy serves as the reference standard for melanoma diagnosis.
“While biopsy serves as our reference standard”
The paper relies on this without support.
The DermaChallenge platform user base mean score is a valid measure of experience.
“The number of correct answers in the first iteration of these levels, normalized against the mean score of the entire DermaChallenge platform user base, served as a score of experience.”
The paper relies on this without support.
The 128 skin conditions ontology is a valid standard for evaluating diagnostic accuracy.
“four experienced dermatologists collaboratively developed a standard ontology to systematically categorize the 128 skin conditions”
Claims other papers make about this one
Each is checked against this paper’s own text: does it say what the citing paper says it does?
The source backs part of the claim, not all of it — or backs it for a different population, condition or comparison.
In the citing paper
“In oncology, transformer-based methods support clinical text processing, whole-slide and radiologic image interpretation (vision transformers), and genomic sequence modeling [24,25,26,27].”
From Artificial Intelligence in Clinical Oncology: From Productivity Enhancement to Creative Discovery (2025) · cites this paper as [26]
Experimental — accuracy not yet measuredThe source backs part of the claim, not all of it — or backs it for a different population, condition or comparison.
In the citing paper
“a foundation model such as PanDerm, trained on >2 million dermoscopic and clinical images, improved physicians’ diagnostic accuracy for skin cancer by >10%, with the greatest benefits observed for non-dermatologists [26].”
From Artificial Intelligence in Clinical Oncology: From Productivity Enhancement to Creative Discovery (2025) · cites this paper as [26]
Experimental — accuracy not yet measuredThe source backs part of the claim, not all of it — or backs it for a different population, condition or comparison.
In the citing paper
“Recent high-impact studies, such as (5), demonstrate the clinical utility of multimodal large language models in dermatology, combining visual and textual reasoning to improve diagnostic accuracy.”
From Revolutionizing dermatopathology using AI in skin diagnostics: scoping review (2026) · cites this paper as [5]
Experimental — accuracy not yet measuredThe source backs part of the claim, not all of it — or backs it for a different population, condition or comparison.
In the citing paper
“Most publicly available dermatology datasets are unimodal, limited in size, and composed mainly of dermoscopic or clinical images 3,4,13,20,21,42-47 , often photographs, paired with heterogeneous metadata or categorical labels that are lacking expressive textual information 48 .”
From Synthesized clinical notes enable training robust multimodal AI models from unimodal dermatology datasets (2026) · cites this paper as [4]
Experimental — accuracy not yet measuredThe cited source says what the claim attributes to it.
In the citing paper
“This supports the findings of (5), especially in emphasizing the practical relevance and significance of multimodal inputs in enhancing diagnostic precision and clinical generalizability.”
From Revolutionizing dermatopathology using AI in skin diagnostics: scoping review (2026) · cites this paper as [5]
The cited source says what the claim attributes to it.
In the citing paper
“The development of foundation models is also reshaping the dermatology domain, with multiple models such as SkinGPT4 2 , PanDerm 4 , Derm1M 3 , paving the way for an increased use of such models in the domain.”
From Synthesized clinical notes enable training robust multimodal AI models from unimodal dermatology datasets (2026) · cites this paper as [4]
Self-check
Percentages, sums and reported differences re-computed from the paper’s own numbers.
Each contradiction between two passages listed here was confirmed by an independent check.
Rated major: it would touch a result — a value a result rests on, reported and recomputed p-values on opposite sides of the significance level, two passages that conflict with no sign which is right, or a cited work retracted before this paper was published.
In the paper
§ A multimodal vision foundation model for clinical dermatology > Results > Risk assessment and malignant lesion screening using TBP
“Significantly, it detected malignant lesions in 79 out of 80 patients”
§ A multimodal vision foundation model for clinical dermatology > Methods > 3D TBP datasets
“80 patients for testing (30,698 images, including 28 malignant lesions).”
Rated minor: it would not touch a result — a value no result rests on, a p-value that stays on the same side of the significance level, or a conflict that is clerical, resolved elsewhere in the paper, or outside its own findings.
In the paper
§ A multimodal vision foundation model for clinical dermatology > Results > Reader studies
“the generalist group (n = 17; 7 pre-vocational trainees, 8 GPs, 1 nurse and 1 clinical trial assistant)”
§ A multimodal vision foundation model for clinical dermatology > Methods > Downstream evaluation details
“a generalist group (n = 17) including 7 GPs, 7 general medicine practitioners and 3 other healthcare professionals (nursing, clinical trial assistants)”
Citations
Cites
Deep Residual Learning for Image Recognition
He, K., Zhang, X., Ren, S., & Sun, J. (2016) · 2016 IEEE Conference on Computer Vision and Pattern Recognition (CVPR) · doi:10.1109/cvpr.2016.90 · Cited by 235,474 · cited 1×
“These advantages enabled PanDerm https://doi.org/10.1038/s41591-025-03747-y to improve upon both traditional models 42,60 and recent generalist medical models such as BiomedGPT 41 .”
InfluentialImageNet Large Scale Visual Recognition Challenge
Russakovsky, O., Deng, J., Su, H., Krause, J., Satheesh, S., Ma, S., Huang, Z., Karpathy, A., Khosla, A., Bernstein, M., et al. (2015) · International Journal of Computer Vision · doi:10.1007/s11263-015-0816-y · Cited by 39,380 · cited 5×
“In general computer vision, foundation models are pretrained on massive datasets such as ImageNet 31 or JFT-300M (ref.”
InfluentialLearning Transferable Visual Models From Natural Language Supervision
Radford, A., Kim, J. W., Hallacy, C., Ramesh, A., Goh, G., Agarwal, S., Sastry, G., Askell, A., Mishkin, P., Clark, J., et al. (2021) · arXiv · doi:10.48550/arxiv.2103.00020 · Cited by 15,293 · cited 13×
“Furthermore, PanDerm also surpassed vision-language models such as CLIP 36 , MONET 39 and biomedical-specific CLIP (BiomedCLIP) 40 in benchmark evaluations (Supplementary Table 1), while showing emergent capabilities in dermatology similar to those of DINOv2 in natural images, with linear probing performance comparabl…”
InfluentialScaling Laws for Neural Language Models
Kaplan, J., McCandlish, S., Henighan, T., Brown, T. B., Chess, B., Child, R., Gray, S., Radford, A., Wu, J., & Amodei, D. (2020) · arXiv · doi:10.48550/arxiv.2001.08361 · Cited by 9,550 · cited 9×
“2b and Supplementary Tables 5–10).”
InfluentialMasked Autoencoders Are Scalable Vision Learners
He, K., Chen, X., Xie, S., Li, Y., Dollar, P., & Girshick, R. (2022) · 2022 IEEE/CVF Conference on Computer Vision and Pattern Recognition (CVPR) · doi:10.1109/cvpr52688.2022.01553 · Cited by 8,489 · cited 4×
“Foundation models are large-scale neural networks pretrained on vast, diverse data using self-supervised learning techniques, often leveraging weakly labeled or unlabeled data 17–19 .”
InfluentialThe Cancer Imaging Archive (TCIA): Maintaining and Operating a Public Information Repository
Clark, K., Vendt, B., Smith, K., Freymann, J., Kirby, J., Koppel, P., Moore, S., Phillips, S., Maffitt, D., Pringle, M., et al. (2013) · Journal of Digital Imaging · doi:10.1007/s10278-013-9622-7 · Cited by 4,599
Tschandl, P., Rosendahl, C., & Kittler, H. (2018) · Scientific Data · doi:10.1038/sdata.2018.161 · Cited by 3,628 · cited 1×
“Some efforts have focused on self-supervised learning specifically for dermatology using public datasets 33,34 or web-sourced skin images 35 .”
Self-citationSegment anything in medical images
Ma, J., He, Y., Li, F., Han, L., You, C., & Wang, B. (2024) · Nature Communications · doi:10.1038/s41467-024-44824-z · Cited by 2,913
Codella, N. C. F., Gutman, D., Celebi, M. E., Helba, B., Marchetti, M. A., Dusza, S. W., Kalloo, A., Liopyris, K., Mishra, N., Kittler, H., et al. (2018) · 2018 IEEE 15th International Symposium on Biomedical Imaging (ISBI 2018) · doi:10.1109/isbi.2018.8363547 · Cited by 2,620 · cited 11×
“This approach contrasts with previous efforts, such as SwAVDerm 35 , which relied on web-sourced skin data, inad-vertently incorporating images from commonly used benchmarks such as ISIC 55 and DermNet 44 , increasing the risk of data leakage and compromising evaluation validity.”
InfluentialSelf-citationRevisiting Unreasonable Effectiveness of Data in Deep Learning Era
Sun, C., Shrivastava, A., Singh, S., & Gupta, A. (2017) · 2017 IEEE International Conference on Computer Vision (ICCV) · doi:10.1109/iccv.2017.97 · Cited by 2,484 · cited 1×
“32 ) and most existing dermatology AI models still rely on these models for downstream adaptation.”
Data-efficient and weakly supervised computational pathology on whole-slide images
Lu, M. Y., Williamson, D. F. K., Chen, T. Y., Chen, R. J., Barbieri, M., & Mahmood, F. (2021) · Nature Biomedical Engineering · doi:10.1038/s41551-020-00682-w · Cited by 2,282 · cited 1×
“For preprocessing, we use the CLAM toolbox 72 for tissue segmentation, partitioning regions into 256 × 256 nonoverlapping sections at ×20 magnification, then resizing to 224 × 224 and normalizing using ImageNet parameters.”
Foundation models for generalist medical artificial intelligence
Moor, M., Banerjee, O., Abad, Z. S. H., Krumholz, H. M., Leskovec, J., Topol, E. J., & Rajpurkar, P. (2023) · Nature · doi:10.1038/s41586-023-05881-4 · Cited by 2,028 · cited 8×
“2b and Supplementary Tables 5–10).”
InfluentialTowards a general-purpose foundation model for computational pathology
Chen, R. J., Ding, T., Lu, M. Y., Williamson, D. F. K., Jaume, G., Song, A. H., Chen, B., Zhang, A., Shao, D., Shaban, M., et al. (2024) · Nature Medicine · doi:10.1038/s41591-024-02857-3 · Cited by 1,560 · cited 3×
“Specialty-specific foundation models 20,21,23 typically focus on single imaging modalities, while general biomedical models, despite their broad scope, struggle with domain-specific data scarcity and integrating heterogeneous modalities for comprehensive clinical analysis.”
Diagnostic accuracy of dermoscopy
Kittler, H., Pehamberger, H., Wolff, K., & Binder, M. (2002) · The Lancet Oncology · doi:10.1016/s1470-2045(02)00679-4 · Cited by 1,349
Self-citationDINOv2: Learning Robust Visual Features without Supervision
Oquab, M., Darcet, T., Moutakanni, T., Vo, H., Szafraniec, M., Khalidov, V., Fernandez, P., Haziza, D., Massa, F., El-Nouby, A., et al. (2023) · arXiv · doi:10.48550/arxiv.2304.07193 · Cited by 1,078 · cited 4×
“38) (both widely used foundation models pretrained on natural images with a ViT-Large 42 backbone), and SwAVDerm 35 (a self-supervised model pretrained on a large skin image dataset from search engines).”
InfluentialHuman-computer collaboration for skin cancer recognition
Tschandl, P., Rinner, C., Apalla, Z., Argenziano, G., Codella, N., Halpern, A., Janda, M., Lallas, A., Longo, C., Malvehy, J., et al. (2020) · Nature Medicine · doi:10.1038/s41591-020-0942-0 · Cited by 1,024 · cited 1×
“The reader study was conducted using DermaChallenge, a web-based platform developed and hosted by the Medical University of Vienna for online education on dermatoscopy, as described in previous studies 76,77 .”
Self-citationA foundation model for generalizable disease detection from retinal images
Zhou, Y., Chia, M. A., Wagner, S. K., Ayhan, M. S., Williamson, D. J., Struyven, R. R., Liu, T., Xu, M., Lozano, M. G., Woodward-Court, P., et al. (2023) · Nature · doi:10.1038/s41586-023-06555-x · Cited by 1,014 · cited 3×
“Specialty-specific foundation models 20,21,23 typically focus on single imaging modalities, while general biomedical models, despite their broad scope, struggle with domain-specific data scarcity and integrating heterogeneous modalities for comprehensive clinical analysis.”
InfluentialA whole-slide foundation model for digital pathology from real-world data
Xu, H., Usuyama, N., Bagga, J., Zhang, S., Rao, R., Naumann, T., Wong, C., Gero, Z., González, J., Gu, Y., et al. (2024) · Nature · doi:10.1038/s41586-024-07441-w · Cited by 921 · cited 4×
“6 and Supplementary Tables 22–25.”
InfluentialZhai, X., Kolesnikov, A., Houlsby, N., & Beyer, L. (2022) · 2022 IEEE/CVF Conference on Computer Vision and Pattern Recognition (CVPR) · doi:10.1109/cvpr52688.2022.01179 · Cited by 891 · cited 1×
“9 and Supplementary Tables 26–29.”
A deep learning system for differential diagnosis of skin diseases
Liu, Y., Jain, A., Eng, C., Way, D. H., Lee, K., Bui, P., Kanada, K., de Oliveira Marinho, G., Gallegos, J., Gabriele, S., et al. (2020) · Nature Medicine · doi:10.1038/s41591-020-0842-3 · Cited by 853 · cited 1×
“…cancer detection and risk assessment 2–5 , differential diagnosis of hundreds of dermatological conditions such as inflammatory dermatoses and pigmentary disorders 6 , multimodal image analysis 7,8 , pathology interpretation 9,10 , monitoring lesion changes 11,12 and predicting outcomes 13,14 .”
Big Self-Supervised Models Advance Medical Image Classification
Azizi, S., Mustafa, B., Ryan, F., Beaver, Z., Freyberg, J., Deaton, J., Loh, A., Karthikesalingam, A., Kornblith, S., Chen, T., et al. (2021) · 2021 IEEE/CVF International Conference on Computer Vision (ICCV) · doi:10.1109/iccv48922.2021.00346 · Cited by 685 · cited 1×
“Their strong feature representations also enable data-efficient applications 26,27 , requiring fewer labeled samples, which is particularly crucial for medical domains in which expert-annotated data are often limited.”
Self-supervised learning in medicine and healthcare
Krishnan, R., Rajpurkar, P., & Topol, E. J. (2022) · Nature Biomedical Engineering · doi:10.1038/s41551-022-00914-1 · Cited by 605 · cited 2×
“Foundation models are large-scale neural networks pretrained on vast, diverse data using self-supervised learning techniques, often leveraging weakly labeled or unlabeled data 17–19 .”
Seven-point checklist and skin lesion classification using multitask multimodal neural nets
Kawahara, J., Daneshvar, S., Argenziano, G., & Hamarneh, G. (2019) · IEEE Journal of Biomedical and Health Informatics · doi:10.1109/jbhi.2018.2824327 · Cited by 584
A pathology foundation model for cancer diagnosis and prognosis prediction
Wang, X., Zhao, J., Marostica, E., Yuan, W., Jin, J., Zhang, J., Li, R., Tang, H., Wang, K., Li, Y., et al. (2024) · Nature · doi:10.1038/s41586-024-07894-z · Cited by 580 · cited 2×
“6 and Supplementary Tables 22–25.”
InfluentialA foundation model for clinical-grade computational pathology and rare cancers detection
Vorontsov, E., Bozkurt, A., Casson, A., Shaikovski, G., Zelechowski, M., Severson, K., Zimmermann, E., Hall, J., Tenenholtz, N., Fusi, N., et al. (2024) · Nature Medicine · doi:10.1038/s41591-024-03141-0 · Cited by 572
ImageNet Large Scale Visual Recognition Challenge
Russakovsky, O., Deng, J., Su, H., Krause, J., Satheesh, S., Ma, S., Huang, Z., Karpathy, A., Khosla, A., Bernstein, M., et al. (2014) · arXiv · doi:10.48550/arxiv.1409.0575 · Cited by 567
Disparities in dermatology AI performance on a diverse, curated clinical image set
Daneshjou, R., Vodrahalli, K., Novoa, R. A., Jenkins, M., Liang, W., Rotemberg, V., Ko, J., Swetter, S. M., Bailey, E. E., Gevaert, O., et al. (2022) · Science Advances · doi:10.1126/sciadv.abq6147 · Cited by 544 · cited 1×
“Although our evaluations show stable cross-skin-tone performance without explicitly balanced training data (as shown to be necessary in a previous study 63 ), comprehensive bias assessment”
BEiT v2: Masked Image Modeling with Vector-Quantized Visual TokenizersPreprint
Peng, Z., Dong, L., Bao, H., Ye, Q.-X., & Wei, F. (2022) · arXiv.org · doi:10.48550/arxiv.2208.06366 · Cited by 468 · cited 2×
“Following masked image modeling practices 68 , we used a 50% mask ratio.”
Pacheco, A. G. C., Lima, G. R., Salomão, A. D. S., Krohling, B., Biral, I. P., de Angelo, G. G., Alves, F. C. R., Esgario, J. G. M., Simora, A. C., Castro, P. B. C., et al. (2020) · Data in Brief · doi:10.1016/j.dib.2020.106221 · Cited by 426 · cited 1×
“43), PanDerm sur-passed the next-best models by 4.7% ( P 0.001) and 9.0% ( P 0.001), respectively (Fig.”
InfluentialGlobal Burden of Skin Disease: Inequities and Innovations
Seth, D., Cheldize, K., Brown, D., & Freeman, E. E. (2017) · Current Dermatology Reports · doi:10.1007/s13671-017-0192-7 · Cited by 366 · cited 1×
“Given limited specialist access in primary care settings where most skin conditions are initially evaluated 56,57 , these findings indicate PanDerm’s potential to address dermatological expertise gaps across healthcare settings through both its technical capabilities and clinical applications.”
MED-NODE: A computer-assisted melanoma diagnosis system using non-dermoscopic images
Giotis, I., Molders, N., Land, S., Biehl, M. L., Jonkman, M. F., & Petkov, N. (2015) · Expert Systems with Applications · doi:10.1016/j.eswa.2015.04.034 · Cited by 365
Artificial intelligence for digital and computational pathology
Song, A. H., Jaume, G., Williamson, D. F. K., Lu, M. Y., Vaidya, A., Miller, T. R., & Mahmood, F. (2023) · Nature Reviews Bioengineering · doi:10.1038/s44222-023-00096-8 · Cited by 356 · cited 1×
“…cancer detection and risk assessment 2–5 , differential diagnosis of hundreds of dermatological conditions such as inflammatory dermatoses and pigmentary disorders 6 , multimodal image analysis 7,8 , pathology interpretation 9,10 , monitoring lesion changes 11,12 and predicting outcomes 13,14 .”
A generalist vision-language foundation model for diverse biomedical tasks
Zhang, K., Zhou, R., Adhikarla, E., Yan, Z., Liu, Y., Yu, J., Liu, Z., Chen, X., Davison, B. D., Ren, H., et al. (2024) · Nature Medicine · doi:10.1038/s41591-024-03185-2 · Cited by 333 · cited 3×
“Compared with a representative model in this category, BiomedGPT 41 , PanDerm showed 20.9% better area under the receiver operating characteristic curve (AUROC) in melanoma detection, 34.7% higher weighted F1 score in differentiating between skin conditions and 19.6% improved weighted F1 in analyzing microscopic skin…”
InfluentialGrob, J. J., & Bonerandi, J. J. (1998) · Archives of Dermatology · doi:10.1001/archderm.134.1.103-a · Cited by 331
Multimodal skin lesion classification using deep learning
Yap, J., Yolland, W., & Tschandl, P. (2018) · Experimental Dermatology · doi:10.1111/exd.13777 · Cited by 326 · cited 1×
“…cancer detection and risk assessment 2–5 , differential diagnosis of hundreds of dermatological conditions such as inflammatory dermatoses and pigmentary disorders 6 , multimodal image analysis 7,8 , pathology interpretation 9,10 , monitoring lesion changes 11,12 and predicting outcomes 13,14 .”
Self-citationA Multimodal Biomedical Foundation Model Trained from Fifteen Million Image–Text Pairs
Zhang, S., Xu, Y., Usuyama, N., Xu, H., Bagga, J., Tinn, R., Preston, S., Rao, R., Wei, M., Valluri, N., et al. (2025) · NEJM AI · doi:10.1056/aioa2400640 · Cited by 283 · cited 2×
“Furthermore, PanDerm also surpassed vision-language models such as CLIP 36 , MONET 39 and biomedical-specific CLIP (BiomedCLIP) 40 in benchmark evaluations (Supplementary Table 1), while showing emergent capabilities in dermatology similar to those of DINOv2 in natural images, with linear probing…”
Groh, M., Harris, C., Soenksen, L. R., Lau, F., Han, R., Kim, A., Koochek, A., & Badri, O. (2021) · IEEE/CVF Conference on Computer Vision and Pattern Recognition Workshops (CVPRW) · doi:10.1109/cvprw53098.2021.00201 · Cited by 275 · cited 1×
“Furthermore, recent studies 62–64 have highlighted important challenges in dermatological AI systems, particularly in human–AI interactions.”
BCN20000: Dermoscopic Lesions in the Wild
Hernández-Pérez, C., Combalia, M., Podlipnik, S., Codella, N., Rotemberg, V. M., Halpern, A. C., Reiter, O., Carrera, C., Barreiro, A., Helba, B., et al. (2024) · Scientific Data · doi:10.1038/s41597-024-03387-w · Cited by 261
Robust and data-efficient generalization of self-supervised machine learning for diagnostic imaging
Azizi, S., Culp, L., Freyberg, J., Mustafa, B., Baur, S., Kornblith, S., Chen, T., Tomasev, N., Mitrović, J., Strachan, P., et al. (2023) · Nature Biomedical Engineering · doi:10.1038/s41551-023-01049-7 · Cited by 250 · cited 8×
“2b and Supplementary Tables 5–10).”
InfluentialIdentification of Clinically Featureless Incipient Melanoma Using Sequential Dermoscopy Imaging
Kittler, H., Guitera, P., Riedl, E., Avramidis, M., Teban, L., Fiebiger, M., Weger, R. A., Dawid, M., & Menzies, S. W. (2006) · Archives of Dermatology · doi:10.1001/archderm.142.9.1113 · Cited by 219 · cited 1×
“…cancer detection and risk assessment 2–5 , differential diagnosis of hundreds of dermatological conditions such as inflammatory dermatoses and pigmentary disorders 6 , multimodal image analysis 7,8 , pathology interpretation 9,10 , monitoring lesion changes 11,12 and predicting outcomes 13,14 .”
Self-citationGoh, E., Gallo, R. J., Strong, E., Weng, Y., Kerman, H. M., Freed, J. A., Cool, J. A., Kanjee, Z., Lane, K. P., Parsons, A. S., et al. (2025) · Nature Medicine · doi:10.1038/s41591-024-03456-y · Cited by 216 · cited 1×
“…to clinicians with PanDerm assistance in skin cancer diagnosis and even outperformed human–AI collaboration in differential diagnosis, similar to observations in a previous study 58 showing ‘no significant difference between large language model (LLM)-augmented physicians and LLM alone’.”
Foundation Model for Cancer Imaging Biomarkers
Pai, S., Bontempi, D., Hadzic, I., Prudente, V., Sokač, M., Chaunzwa, T. L., Bernatz, S., Hosny, A., Mak, R. H., Birkbak, N. J., et al. (2024) · Nature Machine Intelligence · doi:10.1038/s42256-024-00807-9 · Cited by 199 · cited 2×
“Specialty-specific foundation models 20,21,23 typically focus on single imaging modalities, while general biomedical models, despite their broad scope, struggle with domain-specific data scarcity and integrating heterogeneous modalities for comprehensive clinical analysis.”
Global burden of cutaneous melanoma attributable to ultraviolet radiation in 2012
Arnold, M., de Vries, E., Whiteman, D. C., Jemal, A., Bray, F., Parkin, D. M., & Soerjomataram, I. (2018) · International Journal of Cancer · doi:10.1002/ijc.31527 · Cited by 194 · cited 1×
“Unlike close-up imaging of individual lesions, TBP enables comprehensive patient-level analysis, particularly for critical melanoma risk factors such as photodamage and nevus count 4,5,48 .”
Deep learning-aided decision support for diagnosis of skin disease across skin tones
Groh, M., Badri, O., Daneshjou, R., Koochek, A., Harris, C., Soenksen, L. R., Doraiswamy, P. M., & Picard, R. (2024) · Nature Medicine · doi:10.1038/s41591-023-02728-3 · Cited by 160
A Survey on Contrastive Self-Supervised Learning
Jaiswal, A., Babu, A. R., Zadeh, M. Z., Banerjee, D., & Makedon, F. (2020) · Technologies · doi:10.3390/technologies9010002 · Cited by 154
Altamura, D., Avramidis, M., & Menzies, S. W. (2008) · Archives of Dermatology · doi:10.1001/archderm.144.4.502 · Cited by 148
Federman, D. G. (1999) · Archives of Family Medicine · doi:10.1001/archfami.8.2.170 · Cited by 136 · cited 1×
“Given limited specialist access in primary care settings where most skin conditions are initially evaluated 56,57 , these findings indicate PanDerm’s potential to address dermatological expertise gaps across healthcare settings through both its technical capabilities and clinical applications.”
A reinforcement learning model for AI-based decision support in skin cancer
Barata, C., Rotemberg, V. M., Codella, N., Tschandl, P., Rinner, C., Akay, B. N., Apalla, Z., Argenziano, G., Halpern, A. C., Lallas, A., et al. (2023) · Nature Medicine · doi:10.1038/s41591-023-02475-5 · Cited by 126 · cited 1×
“The reader study was conducted using DermaChallenge, a web-based platform developed and hosted by the Medical University of Vienna for online education on dermatoscopy, as described in previous studies 76,77 .”
Self-citationTransparent medical image AI via an image–text foundation model grounded in medical literature
Kim, C., Gadgil, S. U., DeGrave, A. J., Omiye, J. A., Cai, Z. R., Daneshjou, R., & Lee, S.-I. (2024) · Nature Medicine · doi:10.1038/s41591-024-02887-x · Cited by 125 · cited 3×
“Furthermore, PanDerm also surpassed vision-language models such as CLIP 36 , MONET 39 and biomedical-specific CLIP (BiomedCLIP) 40 in benchmark evaluations (Supplementary Table 1), while showing emergent capabilities in dermatology similar to those of DINOv2 in natural images, with linear probing performance comparabl…”
Risk Prediction Models for Melanoma: A Systematic Review
Usher‐Smith, J. A., Emery, J. D., Kassianos, A. P., & Walter, F. M. (2014) · Cancer Epidemiology Biomarkers & Prevention · doi:10.1158/1055-9965.epi-14-0295 · Cited by 122 · cited 2×
“…practice, diagnosing and treating skin conditions involves a range of tasks, including total-body skin cancer detection and risk assessment 2–5 , differential diagnosis of hundreds of dermatological conditions such as inflammatory dermatoses and pigmentary disorders 6 , multimodal image…”
Artificial intelligence-assisted dermatology diagnosis: From unimodal to multimodal
Luo, N., Zhong, X., Su, L., Cheng, Z., Ma, W., & Hao, P. (2023) · Computers in Biology and Medicine · doi:10.1016/j.compbiomed.2023.107413 · Cited by 101 · cited 1×
“…cancer detection and risk assessment 2–5 , differential diagnosis of hundreds of dermatological conditions such as inflammatory dermatoses and pigmentary disorders 6 , multimodal image analysis 7,8 , pathology interpretation 9,10 , monitoring lesion changes 11,12 and predicting outcomes 13,14 .”
Cancer systems biology of TCGA SKCM: Efficient detection of genomic drivers in melanoma
Guan, J., Gupta, R., & Filipp, F. V. (2015) · Scientific Reports · doi:10.1038/srep07857 · Cited by 99 · cited 1×
“The Cancer Genome Atlas—skin cutaneous melanoma (TCGA-SKCM) dataset 65 from The Cancer Genome Atlas project characterized the mutational landscape of human skin cutaneous melanoma.”
BATFormer: Towards Boundary-Aware Lightweight Transformer for Efficient Medical Image Segmentation
Lin, X., Yu, L. C., Cheng, K.-T. T., & Yan, Z. (2023) · IEEE Journal of Biomedical and Health Informatics · doi:10.1109/jbhi.2023.3266977 · Cited by 81 · cited 3×
“We benchmark PanDerm against three established models: ViT-Large 42 , autoSMIM 33 and BATFormer 75 .”
InfluentialEarly Melanoma Diagnosis With Sequential Dermoscopic Images
Yu, Z. T., Nguyen, J., Nguyen, T. D., Kelly, J., McLean, C., Bonnington, C. P., Zhang, L., Mar, V., & Ge, Z. (2021) · IEEE Transactions on Medical Imaging · doi:10.1109/tmi.2021.3120091 · Cited by 76 · cited 2×
“To examine PanDerm’s capability in early melanoma detection, we compared it with 12 human reviewers (7 experienced dermatologists and 5 dermatologist trainees) using sequential dermoscopic images from Alfred Hospital 54 , featuring multiple follow-up images of the same lesions over time.”
Self-citationOlsen, C. M., Pandeya, N., Thompson, B. S., Dusingize, J. C., Webb, P. M., Green, A. C., Neale, R. Ε., Whiteman, D. C., & Study, Q. (2018) · JNCI Journal of the National Cancer Institute · doi:10.1093/jnci/djy023 · Cited by 73 · cited 1×
“Unlike close-up imaging of individual lesions, TBP enables comprehensive patient-level analysis, particularly for critical melanoma risk factors such as photodamage and nevus count 4,5,48 .”
Kurtansky, N. R., D’Alessandro, B. M., Gillis, M. C., Betz‐Stablein, B., Cerminara, S. E., García, R. P., Girundi, M. A., Goessinger, E. V., Gottfrois, P., Guitera, P., et al. (2024) · Scientific Data · doi:10.1038/s41597-024-03743-w · Cited by 73 · cited 1×
“We next evaluated PanDerm’s capability in analyzing whole-body imaging (TBP) 2,3,47 (Fig.”
Self-citationMILAN: Masked Image Pretraining on Language Assisted RepresentationPreprint
Hou, Z., Sun, F., Chen, Y.-K., Xie, Y., & Kung, S. (2022) · arXiv (Cornell University) · doi:10.48550/arxiv.2208.06049 · Cited by 72
Primiero, C. A., McInerney-Leo, A. M., Betz-Stablein, B., Whiteman, D. C., Gordon, L., Caffery, L., Aitken, J. F., Eakin, E., Osborne, S., Gray, L., et al. (2019) · BMJ Open · doi:10.1136/bmjopen-2019-032969 · Cited by 57
Self-citationKriegsmann, K., Lobers, F., Zgorzelski, C., Kriegsmann, J., Janßen, C., Meliß, R. R., Muley, T., Sack, U., Steinbuss, G., & Kriegsmann, M. (2022) · Frontiers in Oncology · doi:10.3389/fonc.2022.1022967 · Cited by 50 · cited 1×
“The UAH89k dataset 66 includes 269 histopathology whole slide images from Heidelberg University, MVZ for Histology, Cytology and Molecular Diagnostics Trier, and the Institute for Dermatopathol-ogy, enriching the model’s understanding of skin conditions at the microscopic level.”
Short-Term Lesion Change Detection for Melanoma Screening With Novel Siamese Neural Network
Zhang, B., Wang, Z., Gao, J., Rutjes, C., Nufer, K. L., Tao, D., Feng, D. D., & Menzies, S. W. (2020) · IEEE Transactions on Medical Imaging · doi:10.1109/tmi.2020.3037761 · Cited by 49 · cited 2×
“Similar to a previous study 45 , we use a simple Siamese network architecture for change detection, in which two identical visual encoders with shared weights from our foundation model process a pair of sequential lesion images captured over a short time frame.”
InfluentialSelf-citation‘Mind your Moles’ study: protocol of a prospective cohort study of melanocytic naevi
Koh, U., Janda, M., Aitken, J. F., Duffy, D. L., Menzies, S., Sturm, R. A., Schaider, H., Betz-Stablein, B., Prow, T., Soyer, H. P., et al. (2018) · BMJ Open · doi:10.1136/bmjopen-2018-025857 · Cited by 36
Self-citationTowards Trustable Skin Cancer Diagnosis via Rewriting Model's Decision
Yan, S., Yu, Z. T., Zhang, X., Mahapatra, D., Chandra, S. S., Janda, M., Soyer, H. P., & Ge, Z. (2023) · IEEE Computer Society Conference on Computer Vision and Pattern Recognition/Proceedings - IEEE Computer Society Conference on Computer Vision and Pattern Recognition/Proceedings · doi:10.1109/cvpr52729.2023.01113 · Cited by 36 · cited 1×
“A more comprehensive evaluation framework 61 integrating these aspects will be necessary for further assessing PanDerm’s robustness.”
Self-citationauto SMIM: Automatic Superpixel-Based Masked Image Modeling for Skin Lesion Segmentation
Wang, Z., Lyu, J., & Tang, X. (2023) · IEEE Transactions on Medical Imaging · doi:10.1109/tmi.2023.3290700 · Cited by 35 · cited 3×
“We benchmark PanDerm against three established models: ViT-Large 42 , autoSMIM 33 and BATFormer 75 .”
InfluentialSelf-citationPrimiero, C. A., Rezze, G. G., Caffery, L. J., Carrera, C., Podlipnik, S., Espinosa, N., Puig, S., Janda, M., Soyer, H. P., & Malvehy, J. (2024) · Journal of Investigative Dermatology · doi:10.1016/j.jid.2023.11.007 · Cited by 30 · cited 2×
“…clinical practice, diagnosing and treating skin conditions involves a range of tasks, including total-body skin cancer detection and risk assessment 2–5 , differential diagnosis of hundreds of dermatological conditions such as inflammatory dermatoses and pigmentary disorders 6 , multimodal image…”
Self-citationTiodorović, D., Stojković‐Filipović, J., Marghoob, A. A., Argenziano, G., Puig, S., Malvehy, J., Tognetti, L., Rubegni, P., Akay, B. N., Zalaudek, I., et al. (2024) · Journal of the European Academy of Dermatology and Venereology · doi:10.1111/jdv.19962 · Cited by 29 · cited 2×
“…cancer detection and risk assessment 2–5 , differential diagnosis of hundreds of dermatological conditions such as inflammatory dermatoses and pigmentary disorders 6 , multimodal image analysis 7,8 , pathology interpretation 9,10 , monitoring lesion changes 11,12 and predicting outcomes 13,14 .”
Self-citationThe Promises and Perils of Foundation Models in Dermatology
Gui, H., Omiye, J. A., Chang, C. T., & Daneshjou, R. (2024) · Journal of Investigative Dermatology · doi:10.1016/j.jid.2023.12.019 · Cited by 28 · cited 1×
“Recent advances in foundation models have emerged as a promising direction to address this challenge 15,16 .”
Milton, A. A. (2019) · arXiv (Cornell University) · doi:10.48550/arxiv.1901.10802 · Cited by 27
Shen, Y., Li, H., Sun, C., Ji, H., Zhang, D., Hu, K., Tang, Y., Chen, Y., Wei, Z., & Lv, J. (2024) · npj Digital Medicine · doi:10.1038/s41746-024-01014-x · Cited by 21 · cited 4×
“38) (both widely used foundation models pretrained on natural images with a ViT-Large 42 backbone), and SwAVDerm 35 (a self-supervised model pretrained on a large skin image dataset from search engines).”
InfluentialSkin melanoma deaths within 1 or 3 years from diagnosis in Europe
Sacchetto, L., Rosso, S., Comber, H., Bouchardy, C., Broganelli, P., Galcerán, J., Hackl, M., Katalinic, A., Louwman, M. W. J., Robsahm, T. E., et al. (2021) · International Journal of Cancer · doi:10.1002/ijc.33479 · Cited by 18
Primiero, C., Betz‐Stablein, B., Ascott, N., D’Alessandro, B., Gaborit, S., Fricker, P., Goldsteen, A., González-Villà, S., Lee, K., Nazari, S., et al. (2024) · Frontiers in Medicine · doi:10.3389/fmed.2024.1380984 · Cited by 18 · cited 1×
“We next evaluated PanDerm’s capability in analyzing whole-body imaging (TBP) 2,3,47 (Fig.”
Self-citationYan, S., Hu, M., Jiang, Y., Li, X., Fei, H., Tschandl, P., Kittler, H., & Ge, Z. (2025) · arXiv · doi:10.48550/arxiv.2503.14911 · Cited by 13
Self-citationDark Corner on Skin Lesion Image Dataset: Does it matter?
Pewton, S. W., & Yap, M. H. (2022) · IEEE/CVF Conference on Computer Vision and Pattern Recognition Workshops (CVPRW) · doi:10.1109/cvprw56347.2022.00530 · Cited by 11 · cited 1×
“For the first two steps, we follow the approach outlined in a previous study 69 .”
Towards Reliable Dermatology Evaluation BenchmarksPreprint
Gröger, F., Lionetti, S., Gottfrois, P., et al. (2023) · arXiv (Cornell University) · doi:10.48550/arxiv.2309.06961 · Cited by 4
Towards Trustable Skin Cancer Diagnosis via Rewriting Model's DecisionPreprint
Yan, S., Yu, Z. T., Zhang, X., et al. (2023) · arXiv (Cornell University) · doi:10.48550/arxiv.2303.00885 · Cited by 2 · cited 1×
“A more comprehensive evaluation framework 61 integrating these aspects will be necessary for further assessing PanDerm’s robustness.”
Self-citationLallas, K., Spyridonos, P., Kittler, H., et al. (2024) · Journal of Clinical Oncology · doi:10.1200/jco.2024.42.16_suppl.9565 · Cited by 1
Self-citationOpenAI, Achiam, J., Adler, S., Agarwal, S., Ahmad, L., Akkaya, I., Aleman, F. L., Almeida, D., Altenschmidt, J., Altman, S., et al. (2023) · arXiv · doi:10.48550/arxiv.2303.08774
442 Towards Reliable Evaluation Benchmarks for Digital Dermatology
Gröger, F., Lionetti, S., Gottfrois, P., Gonzalez-Jimenez, A., Pouly, M., & Navarini, A. A. (2024) · Journal of Investigative Dermatology · doi:10.1016/j.jid.2024.10.452
A Survey on Contrastive Self-supervised Learning
Jaiswal, A., Babu, A. R., Zadeh, M. Z., et al. (2020) · arXiv · doi:10.48550/arxiv.2011.00362
Research works printed but not linked: 8
- Rapini, R. P. Practical Dermatopathology (Elsevier Health Sciences, 2021).
- Dosovitskiy, A. et al. An image is worth 16×16 words: transformers for image recognition at scale. In Proc. 9th International Conference on Learning Representations https://openreview.net/forum?id=YicbFdNTTy (OpenReview.net, 2021).
- Zhang, X. et al. Cae v2: context autoencoder with clip latent alignment. Trans. Mach. Learning Res. (2023).
- Alcantarilla, P. F. & Solutions, T. Fast explicit diffusion for accelerated features in nonlinear scale spaces. IEEE Trans. Pattern Anal. Mach. Intell. 34, 1281–1298 (2011).
- Ilse, M., Tomczak, J. & Welling, M. Attention-based deep multiple instance learning. In Proc. International Conference on Machine Learning (eds Dy, J. & Krause, A.) 2127–2136 (PMLR, 2018).
- Loshchilov, I. et al. Decoupled weight decay regularization. In Proc. 7th International Conference on Learning Representations https://openreview.net/forum?id=Bkg6RiCqY7 (OpenReview.net, 2019).
- Mendonça, T. et al. in Dermoscopy Image Analysis (eds Celebi, M. E. et al.) Ch. 13 420–438 (CRC Press, 2015).
- Kahler, S. et al. Automated photodamage assessment from 3D total body photography for an objective assessment of melanoma risk. Australas. J. Dermatol. 64, 8 (2023).
Cited by
Sorted by citations
Artificial Intelligence in Dermatology: A Review of Methods, Clinical Applications, and Perspectives
Zbrzezny, A. M., & Krzywicki, T. (2025) · Applied Sciences · doi:10.3390/app15147856 · Cited by 37
New approach methodologies for drug discovery
Liu, W., Pang, P. D., Wu, C. A., Tagle, D. A., & Wu, J. C. (2026) · Cell · doi:10.1016/j.cell.2026.02.012 · Cited by 38
Data-Centric Foundation Models in Computational Healthcare: A Survey
Zhang, Y., Gao, J. G., Tan, Z., Zhou, L., Ding, K., Zhou, M., Zhang, S., & Wang, D. (2026) · ACM Computing Surveys · doi:10.1145/3800677 · Cited by 65
Tjiu, J., & Lu, C. (2025) · Medicina · doi:10.3390/medicina61122186 · Cited by 31
A Clinical Perspective on Melanoma Overdiagnosis
Sheerin, J., Collgros, H., Chamberlain, A. J., et al. (2025) · Australasian Journal of Dermatology · doi:10.1111/ajd.14581 · Cited by 12
Self-citation
Metadata
- Authors
- Yan, S., Yu, Z., Primiero, C., Vico-Alonso, C., Wang, Z., Yang, L., Tschandl, P., Hu, M., Ju, L., Tan, G., Tang, V., Ng, A. B., Powell, D., Bonnington, P., See, S., Magnaterra, E., Ferguson, P., Nguyen, J., Guitera, P., Banuls, J., Janda, M., Mar, V., Kittler, H., Soyer, H. P., & Ge, Z.
- Affiliations
- Monash University (AU)
- The University of Queensland (AU)
- Medical University of Vienna (AT)
- Nvidia (United States) (US)
- University of Florence (IT)
- Royal Prince Alfred Hospital (AU)
- The Alfred Hospital (AU)
- Corresponding author
- Ge, Zongyuan
- ORCID
- Venue
- Nature Medicine
- Published
- 2025-06-06
- Volume
- 31
- Issue
- 8
- Pages
- 2691-2702
- ISSN
- 1078-8956 (ISSN-L)
- 1546-170X
- PMC
- PMC12353815
- OpenAlex
- W4411099958
- Semantic Scholar
- 38c437ccb98cda6fe3b7aa8a6351df8c87ea5472
- Cited by
- 117
- References
- 85
- Citations by year
- 2026: 85 · 2025: 32
- FWCI
- 48.05
- Type
- journal article
- Language
- en
- Open access
- hybrid
- doi.org
- Locations
- Nature Medicine (publishedVersion, cc-by)
- PubMed Central (publishedVersion, cc-by)
- PubMed (publishedVersion)
- arXiv (Cornell University) (submittedVersion)
- Archivio istituzionale della ricerca (Alma Mater Studiorum Università di Bologna) (submittedVersion, other-oa)
- arXiv (Cornell University)
- Topics
- Health Sciences › Medicine › Oncology › Cutaneous Melanoma Detection and Management
- Physical Sciences › Computer Science › Artificial Intelligence › AI in cancer detection
- Health Sciences › Medicine › Health Informatics › Artificial Intelligence in Healthcare and Education
- Keywords
- multimodal foundation models, skin diseases, skin cancer diagnosis, melanoma detection, dermoscopy, self-supervised pre-training, differential diagnosis, lesion segmentation, long-term monitoring, metastasis prediction, clinical photographs, reader study, clinical implementation of AI
- MeSH terms
- Deep Learning, Dermatology, Diagnosis, Differential, Humans, Melanoma, Skin Diseases, Skin Neoplasms, Dermoscopy
About these checks
Registry, retraction, Cites and statistics results are computed, not judged, with one exception: a printed reference that no index lists is read once by a model before it counts as a citation error. Claims are extracted by a model and kept only when their quote appears verbatim in the text; each cited source is then checked, with a model’s help, for whether it says what the claim relies on. Those verdicts can be wrong — read the claim’s quote and the cited source before relying on one.
A language model drew the claims from the paper on 2026-10-07, under version 3 of the claim definition (model deepseek-v4.1-flash, prompt extract-v3).
A second model labelled each claim on 2026-10-07 (model jev-1.13-20260917, definition revision gold-guideline-v0.2).
Cited sources are checked with a language model’s help (gpt-6-sol).
Statistics and arithmetic are recomputed, not judged.
Confidence bands are shown only for fields calibrated on our annotated test set. None is calibrated yet, so no band is shown.
What counts as a claim ›How we measure confidence ›How we check this ›
Are you an author, or do you see a problem with this page? Request a review
