Cited by 72

The DOI matches its Crossref record; 12 of the 12 references it cites were found in a registry or an index.

Astrocyte heterogeneity reveals region-specific astrogenesis in the white matter

Bocchi, Riccardo, Thorwirth, Manja, Simon-Ebert, Tatiana, Koupourtidou, Christina, Clavreul, Solène, Kolf, Keegan, Della Vecchia, Patrizia, Bottes, Sara, Jessberger, Sebastian, Zhou, Jiafeng, Wani, Gulzar, Pilz, Gregor-Alexander, Ninkovic, Jovica, Buffo, Annalisa, Sirko, Swetlana, Götz, Magdalena, Fischer-Sternjak, Judith·2025·Nature Neuroscience

Abstract

Astrocyte heterogeneity has been well explored, but our understanding of white matter (WM) astrocytes and their distinctions from gray matter (GM) astrocytes remains limited. Here, we compared astrocytes from cortical GM and WM/corpus callosum (WM/CC) using single-cell RNA sequencing and spatial transcriptomics of the murine forebrain. The comparison revealed similarities but also significant differences between WM and GM astrocytes, including cytoskeletal and metabolic hallmarks specific to WM astrocytes with molecular properties also shared with human WM astrocytes. When we compared murine astrocytes from two different WM regions, the cortex and cerebellum, we found that they exhibited distinct, region-specific molecular properties, with the cerebellum lacking, for example, a specific cluster of WM astrocytes expressing progenitor and proliferation genes. Functional experiments confirmed astrocyte proliferation in the WM/CC, but not in the cerebellar WM, suggesting that the WM/CC may be a source of continued astrogenesis.

Overview

The claims and statistics of this paper haven’t been checked yet.

Run the check — free, no account needed. It reads the open-access text and checks the sources it cites.

A few free checks a day · papers already verified open instantly · results are public

Integrity signals

Registry

Crossref · 10.1038/s41593-025-01878-6

Cites

12 of 12 references verified0 citation errors · 0 not checkable

Statistics

Figures

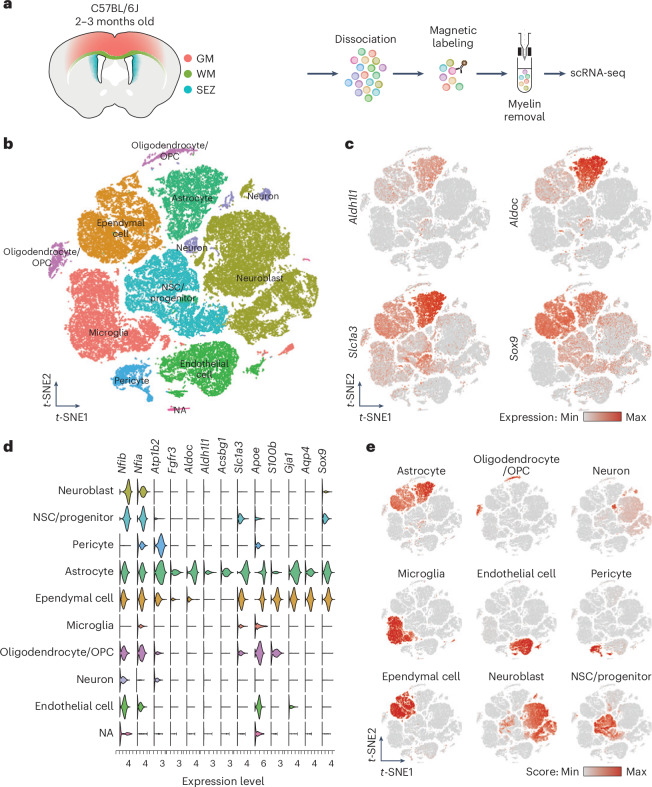
Fig. 1 Isolation of single cells from cortical GM, WM and the SEZ. a, Schematic representation of the workflow used to dissect all three regions from 2–3-month-old C57BL/6J mice to generate the single-cell suspension for scRNA-seq. b, t-distributed stochastic neighbor embedding (t-SNE) visualization of scRNA-seq data from the three regions, with cells color-coded based on their cell types. c, t-SNE visualization showing expression levels (normalized) of common markers for astrocytes. d, Gene expression profiles obtained from scRNA-seq data, segregated according to the cell types identified in b and representing genes used to calculate the astrocyte score. e, Cell type scores used to annotate the scRNA-seq dataset in b. For the complete list of genes used for each cell type, see Supplementary Table 1.
Fig. 1 Isolation of single cells from cortical GM, WM and the SEZ. a, Schematic representation of the workflow used to dissect all three regions from 2–3-month-old C57BL/6J mice to generate the single-cell suspension for scRNA-seq. b, t-distributed stochastic neighbor embedding (t-SNE) visualization of scRNA-seq data from the three regions, with cells color-coded based on their cell types. c, t-SNE visualization showing expression levels (normalized) of common markers for astrocytes. d, Gene expression profiles obtained from scRNA-seq data, segregated according to the cell types identified in b and representing genes used to calculate the astrocyte score. e, Cell type scores used to annotate the scRNA-seq dataset in b. For the complete list of genes used for each cell type, see Supplementary Table 1.CC BY · PubMed Central
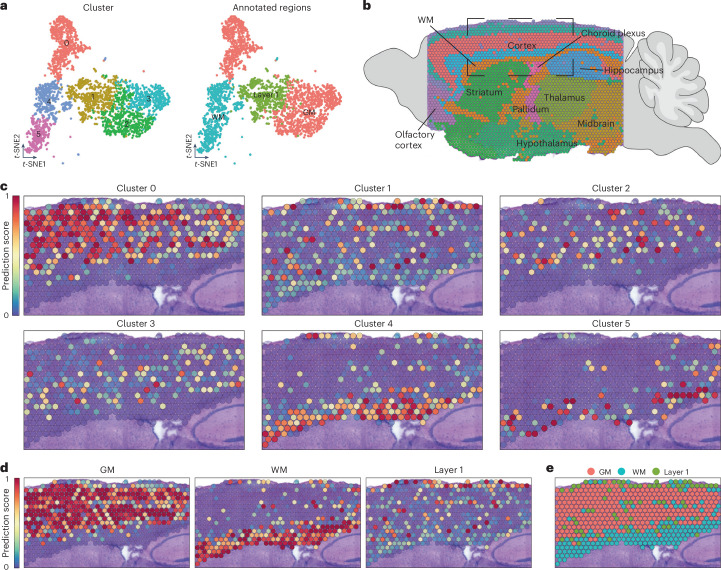
Fig. 2 Spatial distribution of different astrocyte clusters. a, t-SNE visualization of layer 1, GM and WM astrocytes merged (from Extended Data Fig. 2) and classified into six different clusters (left). Right, t-SNE visualization of the final classification. b, Annotation of the sagittal section used for spatial mapping depicting the main regions of the mouse brain. c, Spatial mapping of the six astrocyte clusters identified in a (t-SNE shown on the left), illustrating their predicted localization. d, Spatial mapping based on the regional annotations identified in a (t-SNE shown on the right). e, Predicted positioning of the regional annotations identified in a (t-SNE shown on the right).
Fig. 2 Spatial distribution of different astrocyte clusters. a, t-SNE visualization of layer 1, GM and WM astrocytes merged (from Extended Data Fig. 2) and classified into six different clusters (left). Right, t-SNE visualization of the final classification. b, Annotation of the sagittal section used for spatial mapping depicting the main regions of the mouse brain. c, Spatial mapping of the six astrocyte clusters identified in a (t-SNE shown on the left), illustrating their predicted localization. d, Spatial mapping based on the regional annotations identified in a (t-SNE shown on the right). e, Predicted positioning of the regional annotations identified in a (t-SNE shown on the right).CC BY · PubMed Central
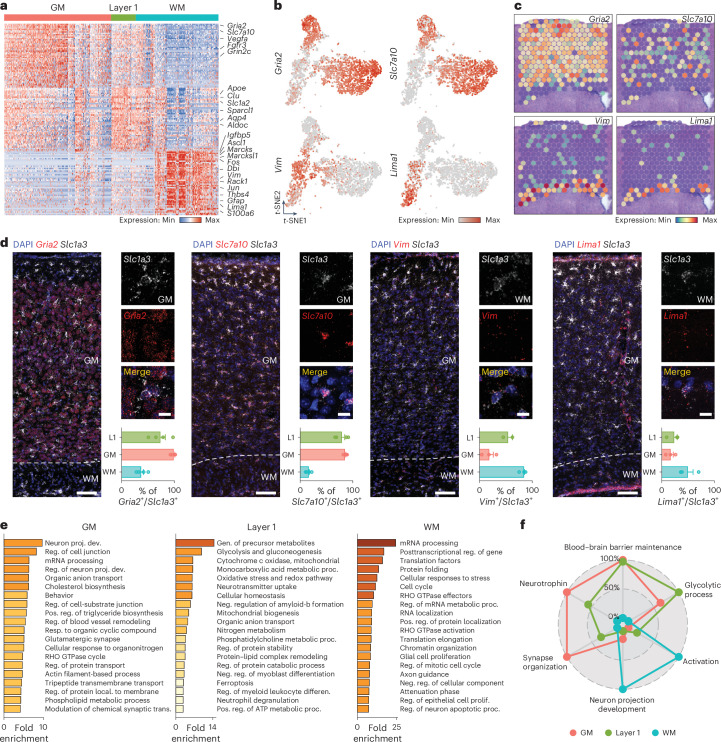
Fig. 3 Layer 1, GM and WM astrocytes display unique molecular features. a, Heatmap showing the expression of 150 DEGs between layer 1, GM and WM astrocytes (Pval < 0.05, log2 fold change > 1). Two-sided Mann–Whitney U-test with Bonferroni post-hoc test. b, t-SNE visualization showing the expression levels (normalized) of two genes highly expressed in GM (Gria2 and Slc7a10, top) and in WM astrocytes (Vim and Lima1, bottom). c, Expression levels of the same genes shown in b on the spatial dataset showing their expression (Gria2 and Slc7a10 in the GM, and Vim and Lima1 in the WM). d, RNAscope in situ hybridization of Gria2, Slc7a10, Vim and Lima1. These results show enriched expression of Gria2 and Slc7a10 in GM astrocytes and enriched expression of Vim and Lima1 in WM astrocytes. n = 4 animals (for Vim staining in layer 1 n = 2). Scale bars, 400 μm(overview) and 10 μm (insets). e, GO term (biological process) analysis using genes enriched in WM and GM astrocytes. f, Radar plot comparing gene scores for six chosen functions across layer 1, GM and WM astrocytes. The genes used to calculate these scores were obtained from six corresponding GO terms. The graphs display the mean ± s.e.m. Source data
Fig. 3 Layer 1, GM and WM astrocytes display unique molecular features. a, Heatmap showing the expression of 150 DEGs between layer 1, GM and WM astrocytes (Pval < 0.05, log2 fold change > 1). Two-sided Mann–Whitney U-test with Bonferroni post-hoc test. b, t-SNE visualization showing the expression levels (normalized) of two genes highly expressed in GM (Gria2 and Slc7a10, top) and in WM astrocytes (Vim and Lima1, bottom). c, Expression levels of the same genes shown in b on the spatial dataset showing their expression (Gria2 and Slc7a10 in the GM, and Vim and Lima1 in the WM). d, RNAscope in situ hybridization of Gria2, Slc7a10, Vim and Lima1. These results show enriched expression of Gria2 and Slc7a10 in GM astrocytes and enriched expression of Vim and Lima1 in WM astrocytes. n = 4 animals (for Vim staining in layer 1 n = 2). Scale bars, 400 μm(overview) and 10 μm (insets). e, GO term (biological process) analysis using genes enriched in WM and GM astrocytes. f, Radar plot comparing gene scores for six chosen functions across layer 1, GM and WM astrocytes. The genes used to calculate these scores were obtained from six corresponding GO terms. The graphs display the mean ± s.e.m. Source dataCC BY · PubMed Central
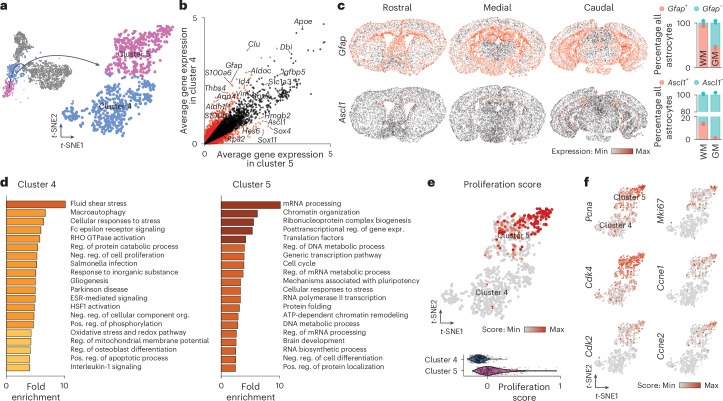
Fig. 4 A subset of WM astrocytes exhibit proliferative capacities. a, t-SNE visualization of the two WM clusters (clusters 4 and 5). b, DEGs between cluster 4 and 5. The red dots represent genes that are differentially expressed between the two clusters (Pval < 0.01, log2 fold change > 0.35), whereas genes expressed by both WM astrocyte subtypes are represented by black dots. Two-sided Mann–Whitney U-test with Bonferroni post-hoc test. c, The Vizgen MERSCOPE single-cell spatial dataset showing expression of Gfap and Ascl1 in astrocytes from three coronal sections (rostral, medial and caudal) in the WM. Right, Quantifications of the fraction of astrocytes positive for Gfap or Ascl1 in GM and WM. n = 3 sections (one rostral, one medial and one caudal). The graphs display the mean ± s.e.m. d, GO term (biological process) analysis using genes enriched in clusters 4 and 5. e, t-SNE visualization and violin plots of the proliferation score in both WM clusters. For the complete gene list used for the proliferation score, see Supplementary Table 1. f, t-SNE visualization of clusters 4 and 5 showing the expression levels (normalized) of some proliferation genes used for the proliferation score.
Fig. 4 A subset of WM astrocytes exhibit proliferative capacities. a, t-SNE visualization of the two WM clusters (clusters 4 and 5). b, DEGs between cluster 4 and 5. The red dots represent genes that are differentially expressed between the two clusters (Pval < 0.01, log2 fold change > 0.35), whereas genes expressed by both WM astrocyte subtypes are represented by black dots. Two-sided Mann–Whitney U-test with Bonferroni post-hoc test. c, The Vizgen MERSCOPE single-cell spatial dataset showing expression of Gfap and Ascl1 in astrocytes from three coronal sections (rostral, medial and caudal) in the WM. Right, Quantifications of the fraction of astrocytes positive for Gfap or Ascl1 in GM and WM. n = 3 sections (one rostral, one medial and one caudal). The graphs display the mean ± s.e.m. d, GO term (biological process) analysis using genes enriched in clusters 4 and 5. e, t-SNE visualization and violin plots of the proliferation score in both WM clusters. For the complete gene list used for the proliferation score, see Supplementary Table 1. f, t-SNE visualization of clusters 4 and 5 showing the expression levels (normalized) of some proliferation genes used for the proliferation score.CC BY · PubMed Central
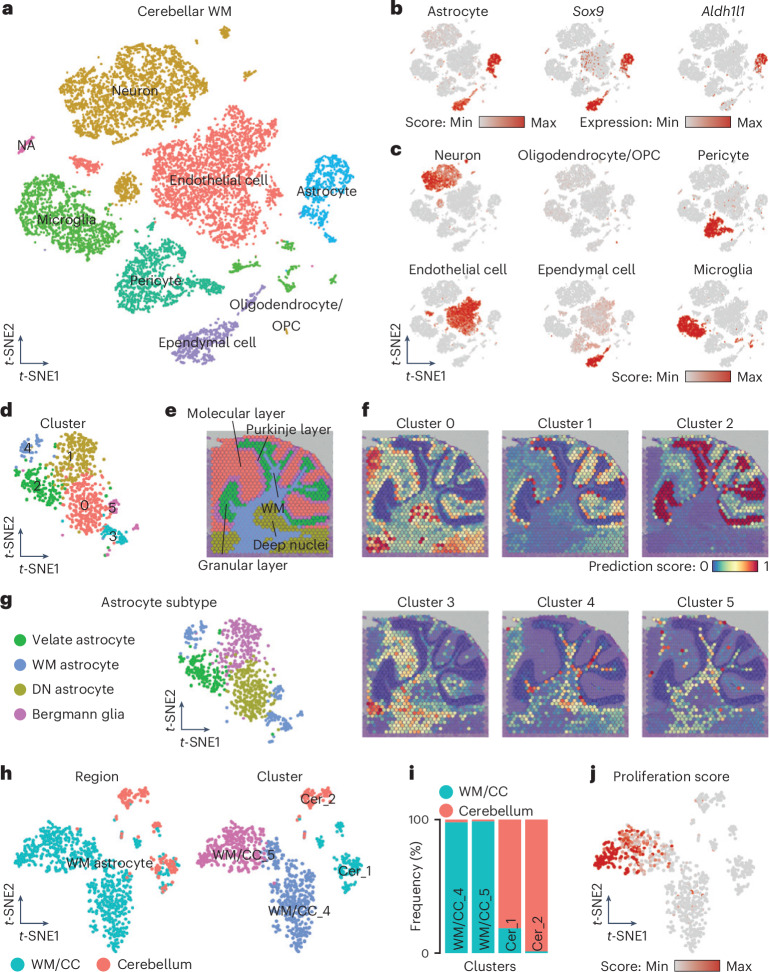
Fig. 5 Profile of cerebellar WM astrocytes shows region-specific hallmarks. a, t-SNE visualization of scRNA-seq data from the WM of the cerebellum visualized according to cell type. b, t-SNE visualization showing the astrocyte score and expression levels (normalized) of common markers for astrocytes. c, Cell type scores used to annotate the scRNA-seq dataset in a. For the complete gene list used for each cell type, see Supplementary Table 1. d, t-SNE visualization of the astrocytes identified and subset from a segregated in six different clusters. e–g, Annotation of the cerebellar layers on a sagittal brain section (e) and spatial mapping of the six cerebellar astrocyte clusters showing their predicted localization (f), which was used to annotate the six different clusters (g). h, t-SNE visualization of the integrated dataset of WM astrocytes from the WM/CC (Fig. 4a, clusters 4 and 5) and cerebellum (g), showing the region of origin (left) and the cluster analysis (right). i, Proportion of WM astrocytes in the clusters originating from the two regions (WM/CC versus cerebellum). j, t-SNE visualization of the integrated dataset showing the proliferation score.
Fig. 5 Profile of cerebellar WM astrocytes shows region-specific hallmarks. a, t-SNE visualization of scRNA-seq data from the WM of the cerebellum visualized according to cell type. b, t-SNE visualization showing the astrocyte score and expression levels (normalized) of common markers for astrocytes. c, Cell type scores used to annotate the scRNA-seq dataset in a. For the complete gene list used for each cell type, see Supplementary Table 1. d, t-SNE visualization of the astrocytes identified and subset from a segregated in six different clusters. e–g, Annotation of the cerebellar layers on a sagittal brain section (e) and spatial mapping of the six cerebellar astrocyte clusters showing their predicted localization (f), which was used to annotate the six different clusters (g). h, t-SNE visualization of the integrated dataset of WM astrocytes from the WM/CC (Fig. 4a, clusters 4 and 5) and cerebellum (g), showing the region of origin (left) and the cluster analysis (right). i, Proportion of WM astrocytes in the clusters originating from the two regions (WM/CC versus cerebellum). j, t-SNE visualization of the integrated dataset showing the proliferation score.CC BY · PubMed Central
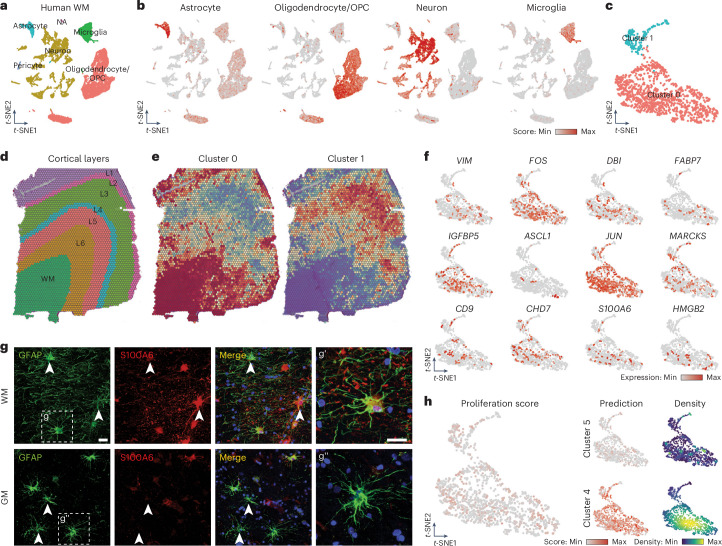
Fig. 6 Human WM astrocytes share gene expression pattern with their mouse counterparts. a, t-SNE visualization of snRNA-seq data from the human WM visualized according to cell type. b, t-SNE visualization showing the cell type scores used to annotate the snRNA-seq dataset. For the complete gene list used for each cell type, see Supplementary Table 1. c, t-SNE visualization of astrocytes identified and subset from a segregated into two different clusters. d, Annotation of a human section showing the localization of the WM and the different GM cortical layers. e, Spatial mapping of the two human astrocytes clusters (0 and 1) showing their predicted localization. f, t-SNE visualization showing expression levels (normalized) of some genes highly expressed by WM astrocytes identified in the mouse dataset. g, Confocal images of human WM and GM double-stained for S100A6 and GFAP. Scale bars, 50 μm (overview) and 20 μm (insets). h, t-SNE visualization showing the proliferation score (left) and the prediction score with density distribution (right) for murine clusters 4 and 5 of WM astrocytes. The density distribution plot highlights areas of higher and lower concentration of cells displaying high and low levels of prediction scores in the dataset.
Fig. 6 Human WM astrocytes share gene expression pattern with their mouse counterparts. a, t-SNE visualization of snRNA-seq data from the human WM visualized according to cell type. b, t-SNE visualization showing the cell type scores used to annotate the snRNA-seq dataset. For the complete gene list used for each cell type, see Supplementary Table 1. c, t-SNE visualization of astrocytes identified and subset from a segregated into two different clusters. d, Annotation of a human section showing the localization of the WM and the different GM cortical layers. e, Spatial mapping of the two human astrocytes clusters (0 and 1) showing their predicted localization. f, t-SNE visualization showing expression levels (normalized) of some genes highly expressed by WM astrocytes identified in the mouse dataset. g, Confocal images of human WM and GM double-stained for S100A6 and GFAP. Scale bars, 50 μm (overview) and 20 μm (insets). h, t-SNE visualization showing the proliferation score (left) and the prediction score with density distribution (right) for murine clusters 4 and 5 of WM astrocytes. The density distribution plot highlights areas of higher and lower concentration of cells displaying high and low levels of prediction scores in the dataset.CC BY · PubMed Central
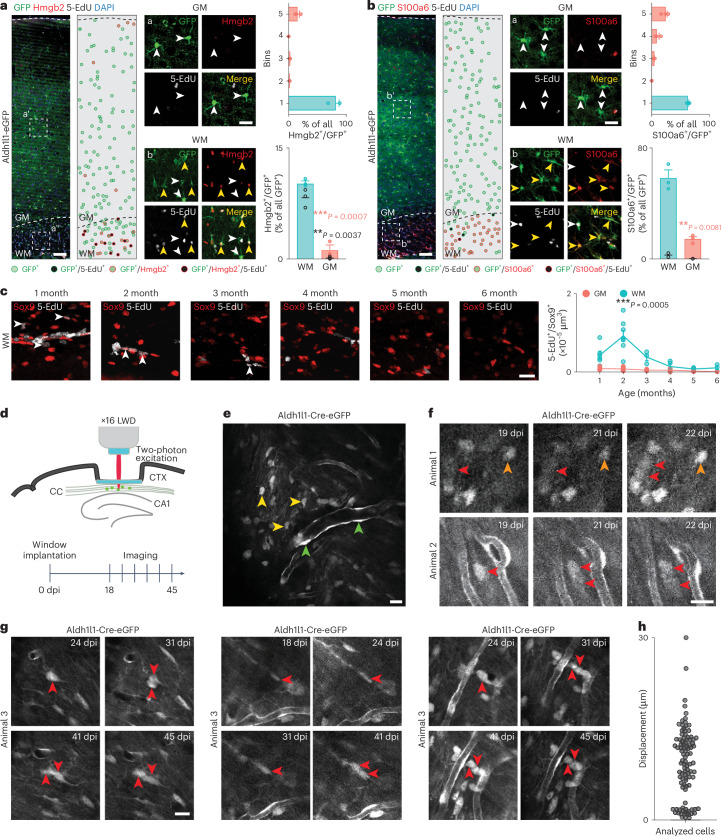
Fig. 7 WM/CC astrocytes proliferate in vivo. a,b, Confocal images of Aldh1l1-eGFP mice immunostained for Hmgb2 (a) and S100a6 (b) after 4 weeks of 5-EdU administration. The dots represent astrocytes (see the color code below the image). Quantifications showed Hmgb2+/GFP+ (a) or S100a6+/GFP+ (b) astrocytes in a column (top) and proportions in the WM/GM (bottom). The black dots represent the amount of Hmgb2+/5-EdU+/GFP+ (a) and S100a6+/5-EdU+/GFP+ (b) astrocytes. n = 3 animals. Two-sided Student’s t-test. Scale bars, 100 μm and 50 μm (insets), and 200 μm (overview), 50 μm (inset). c, Confocal images of Sox9+/5-EdU+ astrocytes in the WM of C57BL/6J mice at different ages (1–6 months) and their quantification (performed after 24 h 5-EdU administration and a subsequent 24 h chase). n ≥ 3 animals (for the details, see ‘Statistics and reproducibility’ in the Methods). Two-way analysis of variance (ANOVA) with Šídák’s post-hoc test. Scale bar, 20 μm. d, Schematic representation of the window implantation and workflow used for the chronic live imaging. e, Overview image of an exemplary field of view showing the vascular pattern, which was used as a landmark in repeated imaging sessions. Parenchymal (yellow arrowhead) and juxtavascular (green arrowhead) astrocytes are indicated. f,g, Two-photon images of Aldh1l1-Cre-eGFP mice WM astrocytes at different days after implantation. The red arrows indicate GFP+ astrocytes that underwent division. The orange arrow indicates a nondividing GFP+ astrocyte. n = 5 animals were analyzed. Scale bar, 20 μm. h, Migration of astrocytes between 18 and 31 days after implantation in µm. n = 100 cells. Graphs display the mean ± s.e.m. *P ≤ 0.05, **P ≤ 0.01, ***P ≤ 0.001. dpi, days after (post) implantation. Source data
Fig. 7 WM/CC astrocytes proliferate in vivo. a,b, Confocal images of Aldh1l1-eGFP mice immunostained for Hmgb2 (a) and S100a6 (b) after 4 weeks of 5-EdU administration. The dots represent astrocytes (see the color code below the image). Quantifications showed Hmgb2+/GFP+ (a) or S100a6+/GFP+ (b) astrocytes in a column (top) and proportions in the WM/GM (bottom). The black dots represent the amount of Hmgb2+/5-EdU+/GFP+ (a) and S100a6+/5-EdU+/GFP+ (b) astrocytes. n = 3 animals. Two-sided Student’s t-test. Scale bars, 100 μm and 50 μm (insets), and 200 μm (overview), 50 μm (inset). c, Confocal images of Sox9+/5-EdU+ astrocytes in the WM of C57BL/6J mice at different ages (1–6 months) and their quantification (performed after 24 h 5-EdU administration and a subsequent 24 h chase). n ≥ 3 animals (for the details, see ‘Statistics and reproducibility’ in the Methods). Two-way analysis of variance (ANOVA) with Šídák’s post-hoc test. Scale bar, 20 μm. d, Schematic representation of the window implantation and workflow used for the chronic live imaging. e, Overview image of an exemplary field of view showing the vascular pattern, which was used as a landmark in repeated imaging sessions. Parenchymal (yellow arrowhead) and juxtavascular (green arrowhead) astrocytes are indicated. f,g, Two-photon images of Aldh1l1-Cre-eGFP mice WM astrocytes at different days after implantation. The red arrows indicate GFP+ astrocytes that underwent division. The orange arrow indicates a nondividing GFP+ astrocyte. n = 5 animals were analyzed. Scale bar, 20 μm. h, Migration of astrocytes between 18 and 31 days after implantation in µm. n = 100 cells. Graphs display the mean ± s.e.m. *P ≤ 0.05, **P ≤ 0.01, ***P ≤ 0.001. dpi, days after (post) implantation. Source dataCC BY · PubMed Central
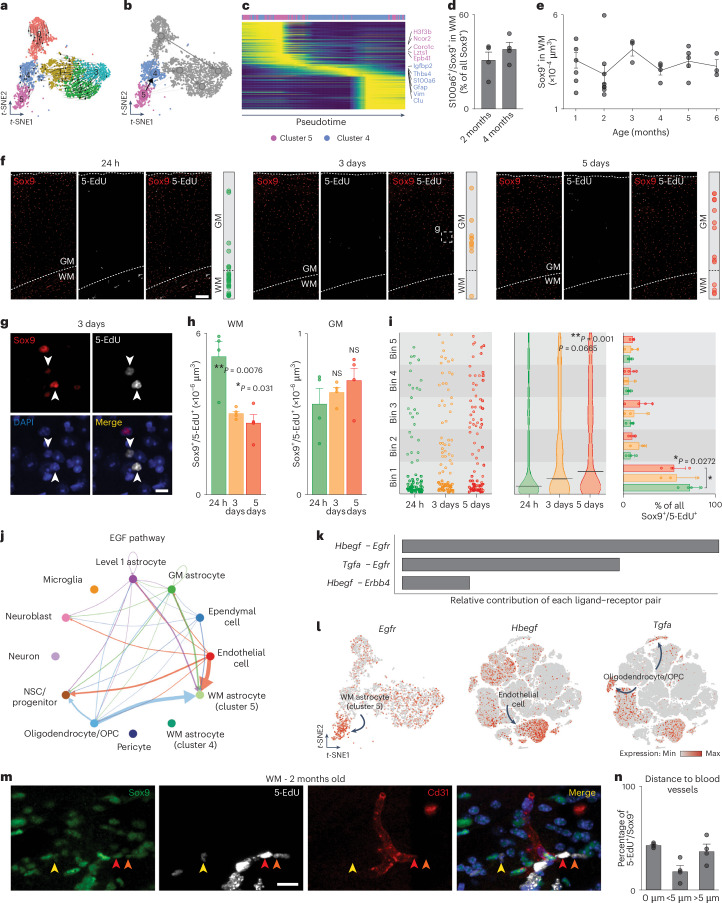
Fig. 8 Progeny of WM astrocytes and regulatory signals controlling their proliferation. a, t-SNE plot of the isolated astrocytes showing RNA velocities. b, PAGA analysis showing differentiation from cluster 5 to cluster 4. c, Pseudotime heatmap of the top 3,000 most variable genes along the differentiation axis. d, Analysis of S100a6+/Sox9+ astrocytes in the WM at 2 and 4 months. n = 4 animals. e, Quantifications of Sox9+ astrocytes over time in the WM. n ≥ 3 animals (for details, see ‘Statistics and reproducibility’ in the Methods). One-way ANOVA with Tukey post-hoc test. f, Confocal images immunostained for Sox9. 5-EdU was administered in drinking water for 24 h and staining was performed 24 h, 3 days and 5 days after 5-EdU administration. Scale bar, 100 μm. g, Closer view of Sox9+/5-EdU+ astrocytes in the GM after 3 days. Scale bar, 20 μm. h, Analysis of Sox9+/5-EdU+ astrocytes over time. n = 4 animals. One-way ANOVA with Tukey post-hoc test. i, Position of Sox9+/5-EdU+ astrocytes over time from the WM (bin 1) to the superficial layer of the cortex (bin 5). n = 3 animals. One-way (middle) and two-way (right) ANOVA with Tukey post-hoc test. j, Cell–cell communication mediated by the epidermal growth factor (EGF) pathway, with the arrow thickness indicating strength. k, Contribution of ligand–receptor pair in EGF signaling. l, t-SNE plots showing Egfr, Hbegf and Tgfa expression in astrocytes (left) and all cells (middle and right). m, Confocal images of WM immunostained for Sox9,5-EdU and Cd31. Scale bar, 20 μm. n, Analysis of Sox9+/5-EdU+ astrocytes in contact (0 µm), closer (<5 µm) and far away (>5 µm) from blood vessels (n = 4 animals). The graphs show the mean ± s.e.m. *P ≤ 0.05, **P ≤ 0.01, ***P ≤ 0.001. Source data
Fig. 8 Progeny of WM astrocytes and regulatory signals controlling their proliferation. a, t-SNE plot of the isolated astrocytes showing RNA velocities. b, PAGA analysis showing differentiation from cluster 5 to cluster 4. c, Pseudotime heatmap of the top 3,000 most variable genes along the differentiation axis. d, Analysis of S100a6+/Sox9+ astrocytes in the WM at 2 and 4 months. n = 4 animals. e, Quantifications of Sox9+ astrocytes over time in the WM. n ≥ 3 animals (for details, see ‘Statistics and reproducibility’ in the Methods). One-way ANOVA with Tukey post-hoc test. f, Confocal images immunostained for Sox9. 5-EdU was administered in drinking water for 24 h and staining was performed 24 h, 3 days and 5 days after 5-EdU administration. Scale bar, 100 μm. g, Closer view of Sox9+/5-EdU+ astrocytes in the GM after 3 days. Scale bar, 20 μm. h, Analysis of Sox9+/5-EdU+ astrocytes over time. n = 4 animals. One-way ANOVA with Tukey post-hoc test. i, Position of Sox9+/5-EdU+ astrocytes over time from the WM (bin 1) to the superficial layer of the cortex (bin 5). n = 3 animals. One-way (middle) and two-way (right) ANOVA with Tukey post-hoc test. j, Cell–cell communication mediated by the epidermal growth factor (EGF) pathway, with the arrow thickness indicating strength. k, Contribution of ligand–receptor pair in EGF signaling. l, t-SNE plots showing Egfr, Hbegf and Tgfa expression in astrocytes (left) and all cells (middle and right). m, Confocal images of WM immunostained for Sox9,5-EdU and Cd31. Scale bar, 20 μm. n, Analysis of Sox9+/5-EdU+ astrocytes in contact (0 µm), closer (<5 µm) and far away (>5 µm) from blood vessels (n = 4 animals). The graphs show the mean ± s.e.m. *P ≤ 0.05, **P ≤ 0.01, ***P ≤ 0.001. Source dataCC BY · PubMed Central
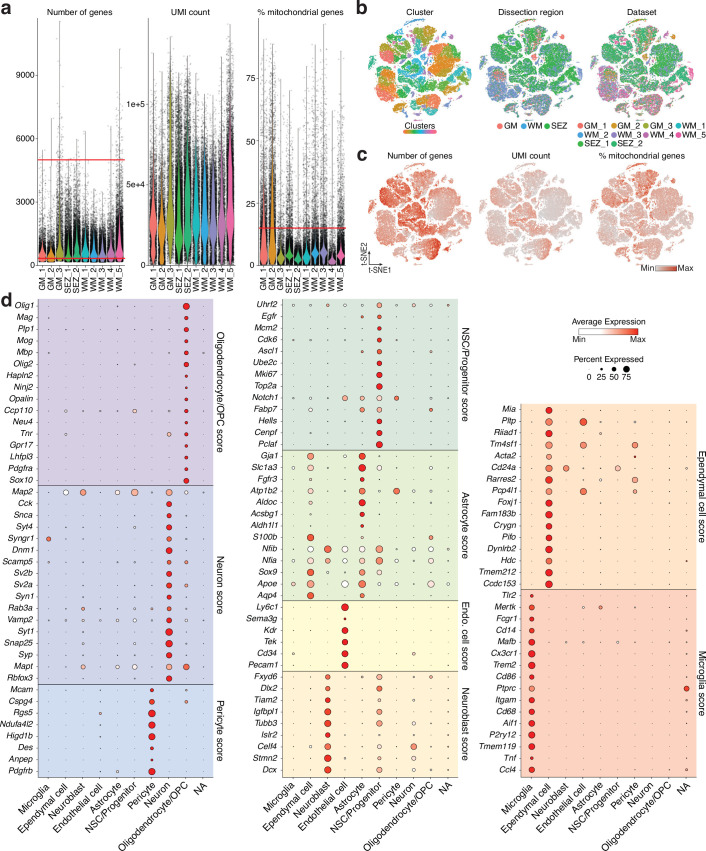
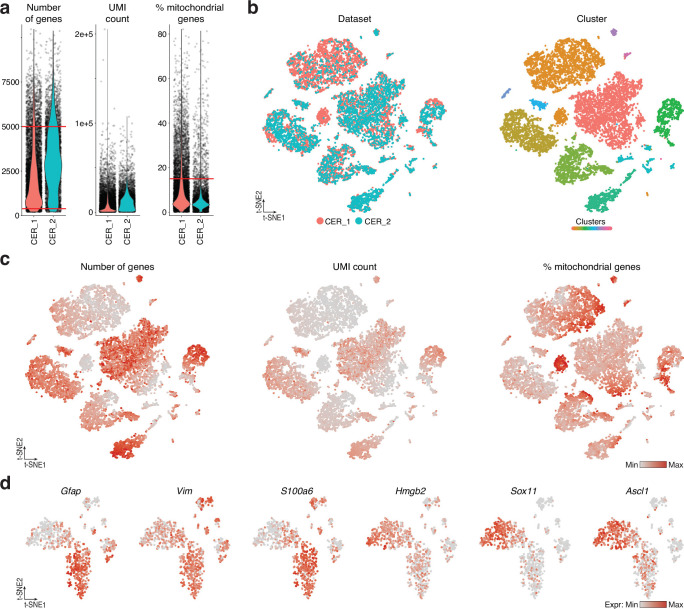
Extended Data Fig. 1 Quality control parameters of scRNA-seq samples and marker gene expression of the clusters. a, Violin plots showing the number of detected genes (left), UMI counts (middle), and mitochondrial gene percentages (right) for each sample. Red lines indicate thresholds: >350 and <5000 for number of genes, and <15% for mitochondrial genes. b, t-SNE visualization of selected cells, color-coded by clusters (left), dissected region (middle), and dataset (right). c, t-SNE visualization showing detected genes (left), UMI counts (middle), and mitochondrial gene percentages (right). d, Expression of genes used for cell type scores. Nine cell types were identified in gray matter, white matter, and subependymal zone.
Extended Data Fig. 1 Quality control parameters of scRNA-seq samples and marker gene expression of the clusters. a, Violin plots showing the number of detected genes (left), UMI counts (middle), and mitochondrial gene percentages (right) for each sample. Red lines indicate thresholds: >350 and <5000 for number of genes, and <15% for mitochondrial genes. b, t-SNE visualization of selected cells, color-coded by clusters (left), dissected region (middle), and dataset (right). c, t-SNE visualization showing detected genes (left), UMI counts (middle), and mitochondrial gene percentages (right). d, Expression of genes used for cell type scores. Nine cell types were identified in gray matter, white matter, and subependymal zone.CC BY · PubMed Central
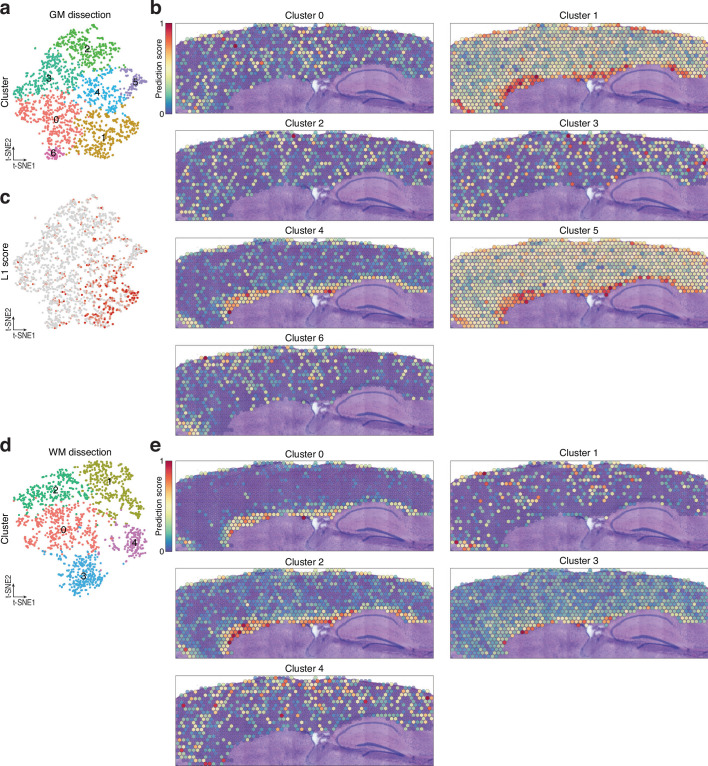
Extended Data Fig. 2 Identification of gray and white matter astrocytes using spatial transcriptomics. a, t-SNE visualization of gray matter astrocytes identified and subset from Fig. 1b. Cluster analysis revealed 7 distinct astrocyte clusters. b, Spatial mapping displaying the predicted position of gray matter astrocytes. c, t-SNE visualization of gray matter astrocytes showing layer 1 score. For the complete list of genes used, see Supplementary Table 1. d, t-SNE visualization of white matter astrocytes identified and subset from Fig. 1b. Cluster analysis unveiled 5 distinct astrocyte clusters. e, Spatial mapping illustrating the predicted position of white matter astrocytes.
Extended Data Fig. 2 Identification of gray and white matter astrocytes using spatial transcriptomics. a, t-SNE visualization of gray matter astrocytes identified and subset from Fig. 1b. Cluster analysis revealed 7 distinct astrocyte clusters. b, Spatial mapping displaying the predicted position of gray matter astrocytes. c, t-SNE visualization of gray matter astrocytes showing layer 1 score. For the complete list of genes used, see Supplementary Table 1. d, t-SNE visualization of white matter astrocytes identified and subset from Fig. 1b. Cluster analysis unveiled 5 distinct astrocyte clusters. e, Spatial mapping illustrating the predicted position of white matter astrocytes.CC BY · PubMed Central
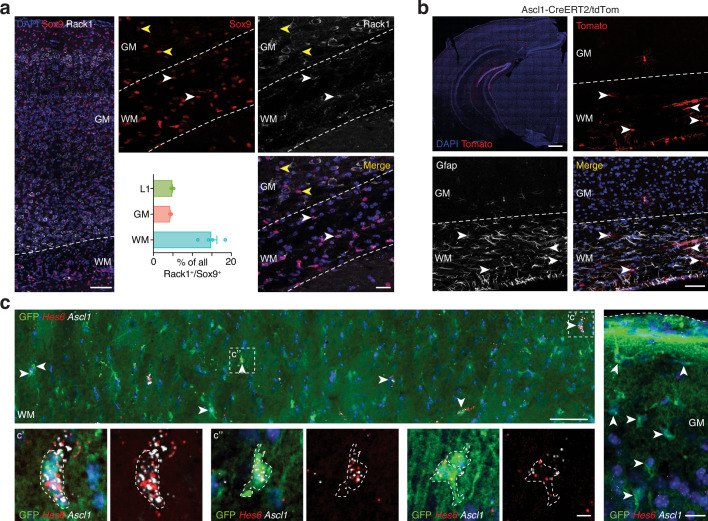
Extended Data Fig. 3 Molecular differences between layer 1, gray, and white matter astrocytes. a, Confocal images of sections immunostained for Sox9 and Rack1. Scale bars: 400 μm (overview), 50 μm (inset). Quantifications of Rack+/Sox9+ astrocytes in layer 1, white and gray matter. n = 4 animals. Graph display mean ± s.e.m. b, Confocal images from sections of Ascl1-CreERT2/tdTom mice immunostained for Gfap showing white matter astrocytes positive for both Gfap and tdTomato. Scale bars: 200 μm (overview), 50 μm (inset). c, RNAscope in situ hybridization of Ascl1 and Hes6 showing positive white matter astrocytes (on the left) and negative gray matter astrocytes (on the right) in Aldh1l1-eGFP mice. Scale bars: 50 μm (overview), 10 μm (inset). Source data
Extended Data Fig. 3 Molecular differences between layer 1, gray, and white matter astrocytes. a, Confocal images of sections immunostained for Sox9 and Rack1. Scale bars: 400 μm (overview), 50 μm (inset). Quantifications of Rack+/Sox9+ astrocytes in layer 1, white and gray matter. n = 4 animals. Graph display mean ± s.e.m. b, Confocal images from sections of Ascl1-CreERT2/tdTom mice immunostained for Gfap showing white matter astrocytes positive for both Gfap and tdTomato. Scale bars: 200 μm (overview), 50 μm (inset). c, RNAscope in situ hybridization of Ascl1 and Hes6 showing positive white matter astrocytes (on the left) and negative gray matter astrocytes (on the right) in Aldh1l1-eGFP mice. Scale bars: 50 μm (overview), 10 μm (inset). Source dataCC BY · PubMed Central
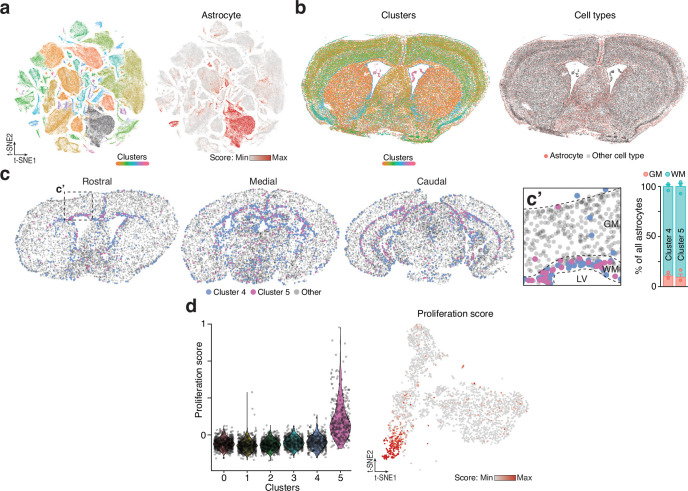
Extended Data Fig. 4 The ability to proliferate is restricted to a unique cluster of white matter astrocytes. a, t-SNE visualization of the single cell Vizgen MERSCOPE spatial dataset showing cluster analysis (on the left), and the astrocyte score (on the right) used to identify astrocytes. b, Spatial visualization of the clusters of the Vizgen MERSCOPE dataset (on the left) and the spatial distribution of the identified astrocytes (on the right). c, Predicted identity and localization of cluster 4 and 5 on the single cell Vizgen MERSCOPE spatial dataset confirming cluster 4 and 5 localization within the white matter. Graphs show the proportion of each cluster predicted in the white and gray matter. Graph display mean ± s.e.m. d, Violin plot (on the left) and t-SNE visualization (on the right) of the proliferation score in all 6 clusters of astrocytes.
Extended Data Fig. 4 The ability to proliferate is restricted to a unique cluster of white matter astrocytes. a, t-SNE visualization of the single cell Vizgen MERSCOPE spatial dataset showing cluster analysis (on the left), and the astrocyte score (on the right) used to identify astrocytes. b, Spatial visualization of the clusters of the Vizgen MERSCOPE dataset (on the left) and the spatial distribution of the identified astrocytes (on the right). c, Predicted identity and localization of cluster 4 and 5 on the single cell Vizgen MERSCOPE spatial dataset confirming cluster 4 and 5 localization within the white matter. Graphs show the proportion of each cluster predicted in the white and gray matter. Graph display mean ± s.e.m. d, Violin plot (on the left) and t-SNE visualization (on the right) of the proliferation score in all 6 clusters of astrocytes.CC BY · PubMed Central
Extended Data Fig. 5 Quality assessment for the cerebellar scRNA-seq datasets and gene expression of candidate genes. a, Violin plots for number of detected genes (left), number of UMI counts (middle), and percentages of mitochondrial genes detected (right) for both scRNA-seq samples. Red lines indicate the thresholds set at > 350 and < 5000 for the number of genes, and < 15 for the percentage of mitochondrial genes. b, t-SNE visualization of cerebellar scRNA-seq data including all selected cells, with cells color-coded based on the dataset (left), and cluster (right). c, t-SNE visualization showing the levels of number of detected genes (left), number of UMI counts (middle), and percentages of mitochondrial genes detected (right). d, t-SNE visualization showing expression levels (normalized) of some genes highly expressed by white matter/corpus callosum astrocytes.
Extended Data Fig. 5 Quality assessment for the cerebellar scRNA-seq datasets and gene expression of candidate genes. a, Violin plots for number of detected genes (left), number of UMI counts (middle), and percentages of mitochondrial genes detected (right) for both scRNA-seq samples. Red lines indicate the thresholds set at > 350 and < 5000 for the number of genes, and < 15 for the percentage of mitochondrial genes. b, t-SNE visualization of cerebellar scRNA-seq data including all selected cells, with cells color-coded based on the dataset (left), and cluster (right). c, t-SNE visualization showing the levels of number of detected genes (left), number of UMI counts (middle), and percentages of mitochondrial genes detected (right). d, t-SNE visualization showing expression levels (normalized) of some genes highly expressed by white matter/corpus callosum astrocytes.CC BY · PubMed Central
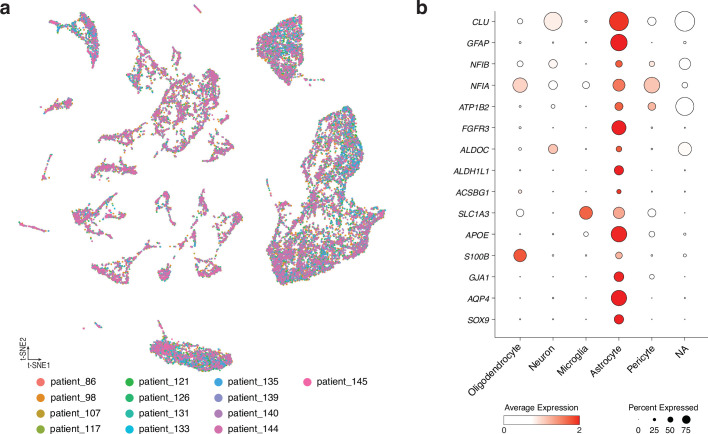
Extended Data Fig. 6 The human dataset. a, t-SNE visualization of snRNA-seq data from the human white matter, visualized by patient origin. Cells were collected from 13 different control patients. b, Cell type-specific expression of genes used to calculate the astrocyte score.
Extended Data Fig. 6 The human dataset. a, t-SNE visualization of snRNA-seq data from the human white matter, visualized by patient origin. Cells were collected from 13 different control patients. b, Cell type-specific expression of genes used to calculate the astrocyte score.CC BY · PubMed Central
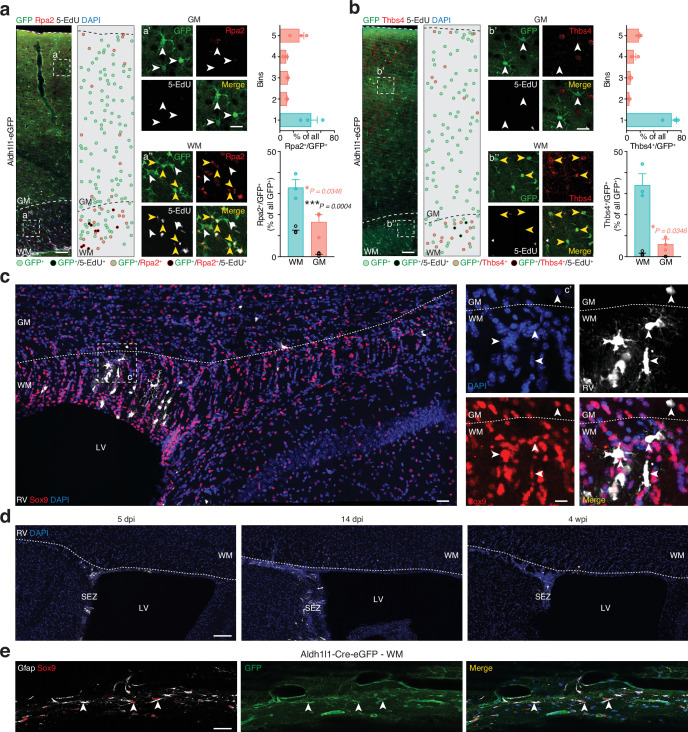
Extended Data Fig. 7 Characterization of proliferative white matter astrocytes. a,b, Confocal images of Aldh1l1-eGFP mice immunostained for Rpa2 (a) and Thbs4 (b) after 4 weeks of 5-EdU administration. Dots represent astrocytes in the images (see color code below the image). Scale bars: 100 μm and 50 μm (insets). Quantifications show Rpa2+/GFP+ (a) or Thbs4+/GFP+ (b) astrocytes in a column (top graphs) and proportions in white/gray matter (bottom graphs). Black dots indicate the amount of Rpa2+/5-EdU+/GFP+ (a) Thbs4+/5-EdU+/GFP+ (b) astrocytes. n = 3 animals. Two-sided Student’s t test. Scale bars: 200 μm (overview), 50 μm (inset). c, Confocal images of Sox9 and RFP from mice 14 days after retrovirus (RV) injection into the white matter to label dividing cells. Overview of the ventricular zone/white matter (on the left) and zoom (on the right). Scale bars: 50 μm and 10 μm (insets). d, Confocal images of mice 5 days, 14 days, and 4 weeks after RV injection into the SEZ. Scale bars: 100 μm. e, Confocal images of Aldh1l1-Cre-eGFP white matter stained for Sox9, Gfap, and GFP. Scale bars: 50 μm. Graphs display mean ± s.e.m. * p ≤ 0.05; ** p ≤ 0.01; *** p ≤ 0.001. Source data
Extended Data Fig. 7 Characterization of proliferative white matter astrocytes. a,b, Confocal images of Aldh1l1-eGFP mice immunostained for Rpa2 (a) and Thbs4 (b) after 4 weeks of 5-EdU administration. Dots represent astrocytes in the images (see color code below the image). Scale bars: 100 μm and 50 μm (insets). Quantifications show Rpa2+/GFP+ (a) or Thbs4+/GFP+ (b) astrocytes in a column (top graphs) and proportions in white/gray matter (bottom graphs). Black dots indicate the amount of Rpa2+/5-EdU+/GFP+ (a) Thbs4+/5-EdU+/GFP+ (b) astrocytes. n = 3 animals. Two-sided Student’s t test. Scale bars: 200 μm (overview), 50 μm (inset). c, Confocal images of Sox9 and RFP from mice 14 days after retrovirus (RV) injection into the white matter to label dividing cells. Overview of the ventricular zone/white matter (on the left) and zoom (on the right). Scale bars: 50 μm and 10 μm (insets). d, Confocal images of mice 5 days, 14 days, and 4 weeks after RV injection into the SEZ. Scale bars: 100 μm. e, Confocal images of Aldh1l1-Cre-eGFP white matter stained for Sox9, Gfap, and GFP. Scale bars: 50 μm. Graphs display mean ± s.e.m. * p ≤ 0.05; ** p ≤ 0.01; *** p ≤ 0.001. Source dataCC BY · PubMed Central
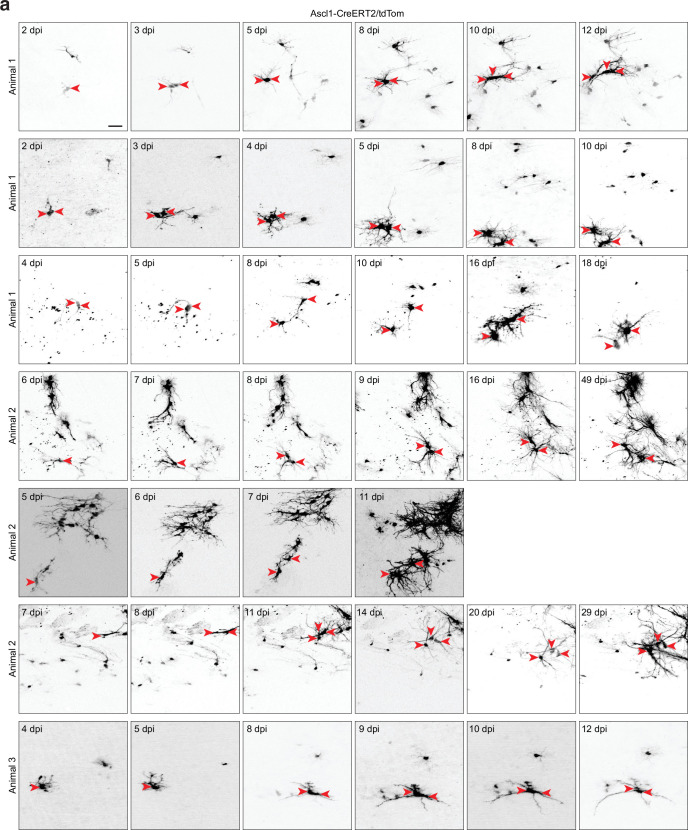
Extended Data Fig. 8 Live imaging of white matter astrocytes using Ascl1-CreERT2/tdTom mice. a, White matter astrocytes are detectable after recombination in Ascl1-CreERT2/tdTom mice. Recombination is induced by two injections of tamoxifen at 2 and 4 days after implantation of the window. In vivo 2-photon imaging starts earliest at 2 days and is carried out up to 49 days. Sequences of field views in the white matter indicate the proliferation of astrocytes (red arrowheads). The imaging time point, counted after the first tamoxifen injection, is displayed (dpi). Cells acquire astrocytic morphology over time. Note that in some examples, two closely associated cells seen in the first timeframe move apart and further develop more complex morphologies, indicative of two daughter cells after division. Examples from three different animals are displayed. Single images are collapsed z-stacks of in vivo imaging data. Scale bar: 20 μm.
Extended Data Fig. 8 Live imaging of white matter astrocytes using Ascl1-CreERT2/tdTom mice. a, White matter astrocytes are detectable after recombination in Ascl1-CreERT2/tdTom mice. Recombination is induced by two injections of tamoxifen at 2 and 4 days after implantation of the window. In vivo 2-photon imaging starts earliest at 2 days and is carried out up to 49 days. Sequences of field views in the white matter indicate the proliferation of astrocytes (red arrowheads). The imaging time point, counted after the first tamoxifen injection, is displayed (dpi). Cells acquire astrocytic morphology over time. Note that in some examples, two closely associated cells seen in the first timeframe move apart and further develop more complex morphologies, indicative of two daughter cells after division. Examples from three different animals are displayed. Single images are collapsed z-stacks of in vivo imaging data. Scale bar: 20 μm.CC BY · PubMed Central
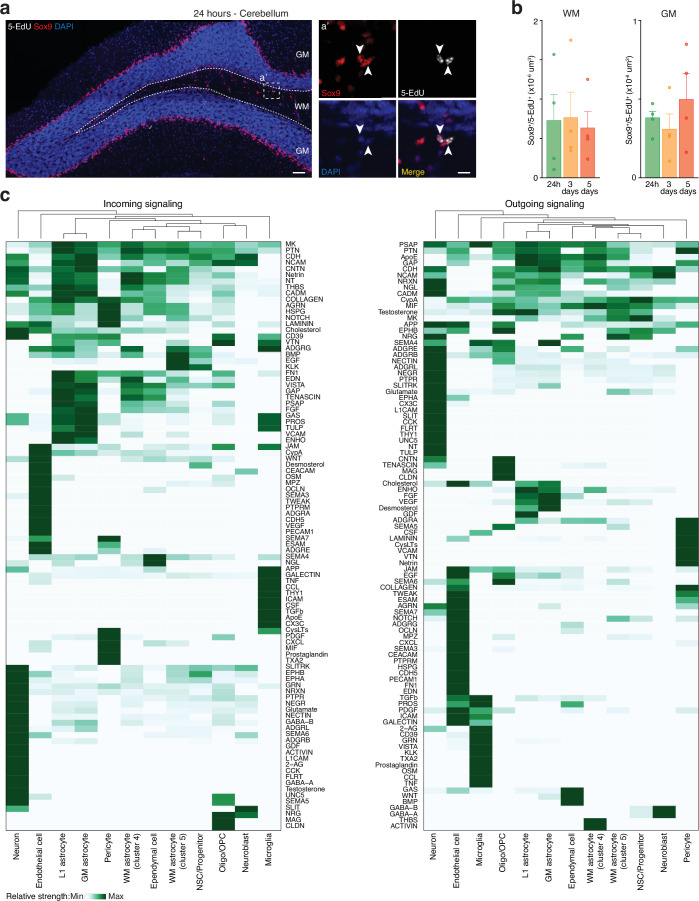
Extended Data Fig. 9 White matter astrocytes from the cerebellum do not proliferate. a, Confocal images of cerebellar sections immunostained for Sox9 and 5-EdU after 5-EdU administration in drinking water for 24 h. Staining was performed at 24 h, 3 days, and 5 days. Scale bars: 100 μm and 10 μm (insets). b, Quantifications of Sox9+/5-EdU+ astrocytes in cerebellar white and gray matter over time. n = 4 animals. One-way ANOVA with Tukey post-hoc test. Graphs display mean ± s.e.m. c, Heatmaps of signaling pathways showing relative strength of incoming (left) and outgoing (right) signals. Source data
Extended Data Fig. 9 White matter astrocytes from the cerebellum do not proliferate. a, Confocal images of cerebellar sections immunostained for Sox9 and 5-EdU after 5-EdU administration in drinking water for 24 h. Staining was performed at 24 h, 3 days, and 5 days. Scale bars: 100 μm and 10 μm (insets). b, Quantifications of Sox9+/5-EdU+ astrocytes in cerebellar white and gray matter over time. n = 4 animals. One-way ANOVA with Tukey post-hoc test. Graphs display mean ± s.e.m. c, Heatmaps of signaling pathways showing relative strength of incoming (left) and outgoing (right) signals. Source dataCC BY · PubMed Central

Verification

Claims the paper makes

The claims and statistics of this paper haven’t been checked yet.

Run the check — free, no account needed. It reads the open-access text and checks the sources it cites.

A few free checks a day · papers already verified open instantly · results are public

Claims other papers make about this one

Each is checked against this paper’s own text: does it say what the citing paper says it does?

Self-check

Percentages, sums and reported differences re-computed from the paper’s own numbers.

The self-check needs the paper’s full text.

Citations

Cites

Research works printed but not linked: 50

  1. Bass, N. H., Hess, H. H., Pope, A. & Thalheimer, C. Quantitative cytoarchitectonic distribution of neurons, glia, and DNA in rat cerebral cortex. J. Comp. Neurol. 143, 481–490 (1971). · DOI
  2. Barres, B. A. The mystery and magic of glia: a perspective on their roles in health and disease. Neuron 60, 430–440 (2008). · DOI · Paper page
  3. Chai, H. et al. Neural circuit-specialized astrocytes: transcriptomic, proteomic, morphological, and functional evidence. Neuron 95, 531–549 (2017). · DOI · Paper page
  4. Ramón y Cajal, S. Histology of the Nervous System of Man and Vertebrates (Oxford Univ. Press, 1995). · DOI
  5. Lanjakornsiripan, D. et al. Layer-specific morphological and molecular differences in neocortical astrocytes and their dependence on neuronal layers. Nat. Commun. 9, 1623 (2018). · DOI
  6. Matyash, V. & Kettenmann, H. Heterogeneity in astrocyte morphology and physiology. Brain Res. Rev. 63, 2–10 (2010). · DOI
  7. Miller, R. H. & Raff, M. C. Fibrous and protoplasmic astrocytes are biochemically and developmentally distinct. J. Neurosci. 4, 585–592 (1984). · DOI
  8. Köhler, S., Winkler, U. & Hirrlinger, J. Heterogeneity of astrocytes in grey and white matter. Neurochem. Res. 46, 3–14 (2021). · DOI · Paper page
  9. Bayraktar, O. A. et al. Astrocyte layers in the mammalian cerebral cortex revealed by a single-cell in situ transcriptomic map. Nat. Neurosci. 23, 500–509 (2020). · DOI · Paper page
  10. Lozzi, B., Huang, T.-W., Sardar, D., Huang, A. Y.-S. & Deneen, B. Regionally distinct astrocytes display unique transcription factor profiles in the adult brain. Front. Neurosci. 14, 61 (2020). · DOI · Paper page
  11. Morel, L. et al. Molecular and functional properties of regional astrocytes in the adult brain. J. Neurosci. 37, 8706–8717 (2017). · DOI · Paper page
  12. Ohlig, S. et al. Molecular diversity of diencephalic astrocytes reveals adult astrogenesis regulated by Smad4. EMBO J. 40, e107532 (2021). · DOI
  13. Schneider, J. et al. Astrogenesis in the murine dentate gyrus is a life-long and dynamic process. EMBO J. 41, e110409 (2022). · DOI
  14. Sohn, J. et al. The subventricular zone continues to generate corpus callosum and rostral migratory stream astroglia in normal adult mice. J. Neurosci. 35, 3756–3763 (2015). · DOI
  15. Fleming, S. J. et al. Unsupervised removal of systematic background noise from droplet-based single-cell experiments using CellBender. Nat. Methods 20, 1323–1335 (2023). · DOI · Paper page
  16. Beckervordersandforth, R. et al. In vivo fate mapping and expression analysis reveals molecular hallmarks of prospectively isolated adult neural stem cells. Cell Stem Cell 7, 744–758 (2010). · DOI · Paper page
  17. Mizrak, D. et al. Single-cell analysis of regional differences in adult V-SVZ neural stem cell lineages. Cell Rep. 26, 394–406(2019). · DOI · Paper page
  18. Kalamakis, G. et al. Quiescence modulates stem cell maintenance and regenerative capacity in the aging brain. Cell 176, 1407–1419 (2019). · DOI · Paper page
  19. El Amri, M., Fitzgerald, U. & Schlosser, G. MARCKS and MARCKS-like proteins in development and regeneration. J. Biomed. Sci. 25, 43 (2018). · DOI
  20. Zhang, Y.-Y. et al. A LIMA1 variant promotes low plasma LDL cholesterol and decreases intestinal cholesterol absorption. Science 360, 1087–1092 (2018). · DOI
  21. Köhler, S. et al. Gray and white matter astrocytes differ in basal metabolism but respond similarly to neuronal activity. Glia 71, 229–244 (2023). · DOI
  22. Koupourtidou, C. et al. Shared inflammatory glial cell signature after stab wound injury, revealed by spatial, temporal, and cell-type-specific profiling of the murine cerebral cortex. Nat. Commun. 15, 2866 (2024). · DOI · Paper page
  23. Farioli-Vecchioli, S. et al. Tis21 is required for adult neurogenesis in the subventricular zone and for olfactory behavior regulating cyclins, BMP4, Hes1/5 and Ids. Front. Cell. Neurosci. 8, 98 (2014). · DOI
  24. Maynard, K. R. et al. Transcriptome-scale spatial gene expression in the human dorsolateral prefrontal cortex. Nat. Neurosci. 24, 425–436 (2021). · DOI · Paper page
  25. Heinrich, C. et al. Generation of subtype-specific neurons from postnatal astroglia of the mouse cerebral cortex. Nat. Protoc. 6, 214–228 (2011). · DOI
  26. Pilz, G.-A. et al. Live imaging of neurogenesis in the adult mouse hippocampus. Science 359, 658–662 (2018). · DOI
  27. Bottes, S. & Jessberger, S. Live imaging of remyelination in the adult mouse corpus callosum. Proc. Natl Acad. Sci. USA 118, e2025795118 (2021). · DOI
  28. Di Bella, D. J. et al. Molecular logic of cellular diversification in the mouse cerebral cortex. Nature 595, 554–559 (2021). · DOI · Paper page
  29. Endo, F. et al. Molecular basis of astrocyte diversity and morphology across the CNS in health and disease. Science 378, eadc9020 (2022). · DOI
  30. Hamilton, N. et al. Mechanisms of ATP- and glutamate-mediated calcium signaling in white matter astrocytes. Glia 56, 734–749 (2008). · DOI
  31. Lezmy, J. et al. Astrocyte Ca2+-evoked ATP release regulates myelinated axon excitability and conduction speed. Science 374, eabh2858 (2021). · DOI
  32. Werkman, I. L. et al. Transcriptional heterogeneity between primary adult grey and white matter astrocytes underlie differences in modulation of in vitro myelination. J. Neuroinflammation 17, 373 (2020). · DOI
  33. Hassel, B., Boldingh, K. A., Narvesen, C., Iversen, E. G. & Skrede, K. K. Glutamate transport, glutamine synthetase and phosphate-activated glutaminase in rat CNS white matter. A quantitative study. J. Neurochem. 87, 230–237 (2003). · DOI
  34. Li, D., Ropert, N., Koulakoff, A., Giaume, C. & Oheim, M. Lysosomes are the major vesicular compartment undergoing Ca2+-regulated exocytosis from cortical astrocytes. J. Neurosci. 28, 7648–7658 (2008). · DOI
  35. De León Reyes, N. S., Bragg-Gonzalo, L. & Nieto, M. Development and plasticity of the corpus callosum. Development 147, dev189738 (2020). · DOI
  36. García-Martinez, Y., Sánchez-Huerta, K. B. & Pacheco-Rosado, J. Quantitative characterization of proliferative cells subpopulations in the hilus of the hippocampus of adult Wistar rats: an integrative study. J. Mol. Histol. 51, 437–453 (2020). · DOI
  37. Karpf, J. et al. Dentate gyrus astrocytes exhibit layer-specific molecular, morphological and physiological features. Nat. Neurosci. 25, 1626–1638 (2022). · DOI
  38. Seeker, L. A. et al. Brain matters: unveiling the distinct contributions of region, age, and sex to glia diversity and CNS function. Acta Neuropathol. Commun. 11, 84 (2023). · DOI
  39. Tien, A.-C. et al. Regulated temporal-spatial astrocyte precursor cell proliferation involves BRAF signalling in mammalian spinal cord. Development 139, 2477–2487 (2012). · DOI
  40. Nakamura, T., Colbert, M. C. & Robbins, J. Neural crest cells retain multipotential characteristics in the developing valves and label the cardiac conduction system. Circ. Res. 98, 1547–1554 (2006). · DOI
  41. Kim, E. J., Ables, J. L., Dickel, L. K., Eisch, A. J. & Johnson, J. E. Ascl1 (Mash1) defines cells with long-term neurogenic potential in subgranular and subventricular zones in adult mouse brain. PLoS ONE 6, e18472 (2011). · DOI
  42. Madisen, L. et al. A robust and high-throughput Cre reporting and characterization system for the whole mouse brain. Nat. Neurosci. 13, 133–140 (2010). · DOI · Paper page
  43. Tinevez, J.-Y. et al. TrackMate: an open and extensible platform for single-particle tracking. Methods 115, 80–90 (2017). · DOI
  44. Ershov, D. et al. TrackMate 7: integrating state-of-the-art segmentation algorithms into tracking pipelines. Nat. Methods 19, 829–832 (2022). · DOI
  45. Stuart, T. et al. Comprehensive integration of single-cell data. Cell 177, 1888–1902 (2019). · DOI · Paper page
  46. Luecken, M. D. & Theis, F. J. Current best practices in single-cell RNA-seq analysis: a tutorial. Mol. Syst. Biol. 15, e8746 (2019). · DOI · Paper page
  47. Korsunsky, I. et al. Fast, sensitive and accurate integration of single-cell data with Harmony. Nat. Methods 16, 1289–1296 (2019). · DOI · Paper page
  48. La Manno, G. et al. RNA velocity of single cells. Nature 560, 494–498 (2018). · DOI · Paper page
  49. Svensson, V. & Pachter, L. RNA velocity: molecular kinetics from single-cell RNA-seq. Mol. Cell 72, 7–9 (2018). · DOI
  50. Jin, S. et al. Inference and analysis of cell–cell communication using CellChat. Nat. Commun. 12, 1088 (2021).

Cited by

Sorted by citations

See all 72

Metadata

Authors
Bocchi, R., Thorwirth, M., Simon-Ebert, T., Koupourtidou, C., Clavreul, S., Kolf, K., Della Vecchia, P., Bottes, S., Jessberger, S., Zhou, J., Wani, G., Pilz, G.-A., Ninkovic, J., Buffo, A., Sirko, S., Götz, M., & Fischer-Sternjak, J.
Venue
Nature Neuroscience
Published
2025-02-24
Volume
28
Issue
3
Pages
457-469
ISSN
  • 1097-6256
  • 1546-1726
Cited by
72
References
12
Language
en
Funders
Schweizerischer Nationalfonds zur Förderung der Wissenschaftlichen Forschung (P2GEP3_174900, P400PB_183826, PZ00P3_201995)

About these checks

Registry, retraction, Cites and statistics results are computed, not judged, with one exception: a printed reference that no index lists is read once by a model before it counts as a citation error. Claims are extracted by a model and kept only when their quote appears verbatim in the text; each cited source is then checked, with a model’s help, for whether it says what the claim relies on. Those verdicts can be wrong — read the claim’s quote and the cited source before relying on one.

Statistics and arithmetic are recomputed, not judged.

Confidence bands are shown only for fields calibrated on our annotated test set. None is calibrated yet, so no band is shown.

What counts as a claim ›How we measure confidence ›How we check this ›

Are you an author, or do you see a problem with this page? Request a review