

The DOI matches its Crossref record; 61 of the 61 references it cites were found in a registry or an index.
Comparative profiling of cortical gene expression in Alzheimer’s disease patients and mouse models demonstrates a link between amyloidosis and neuroinflammation
Open accessAbstract
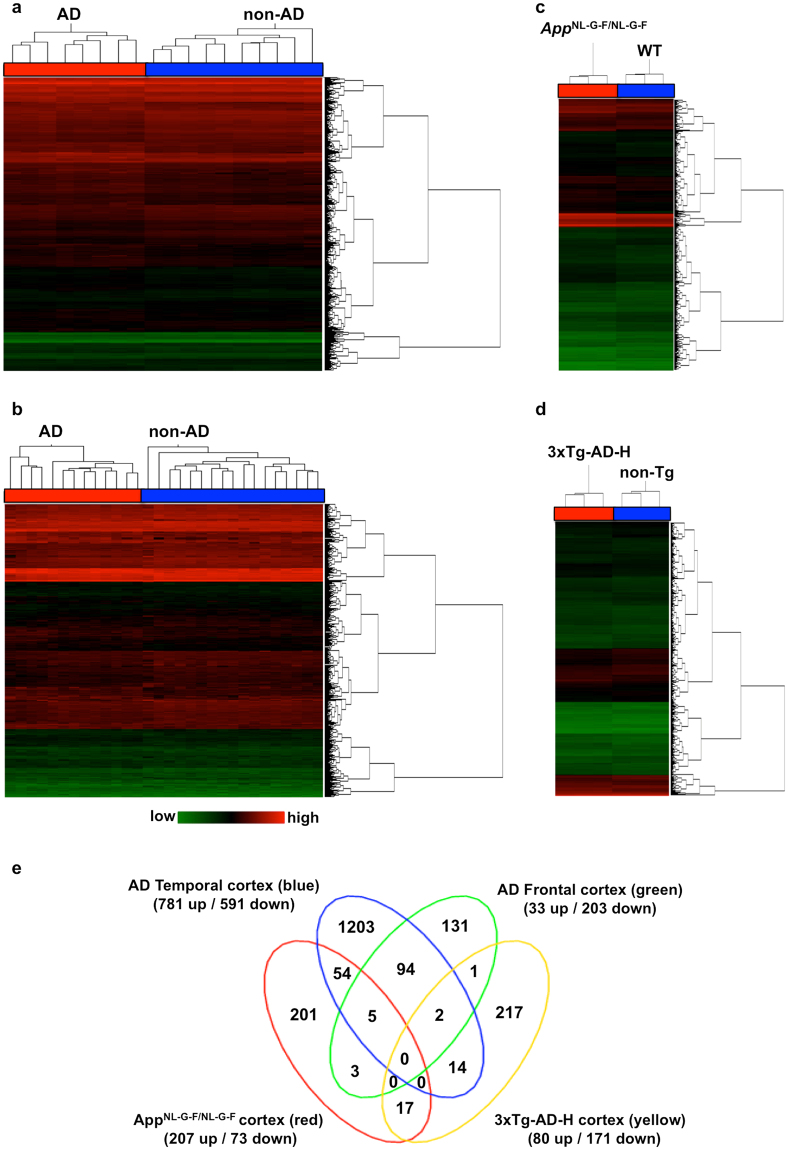
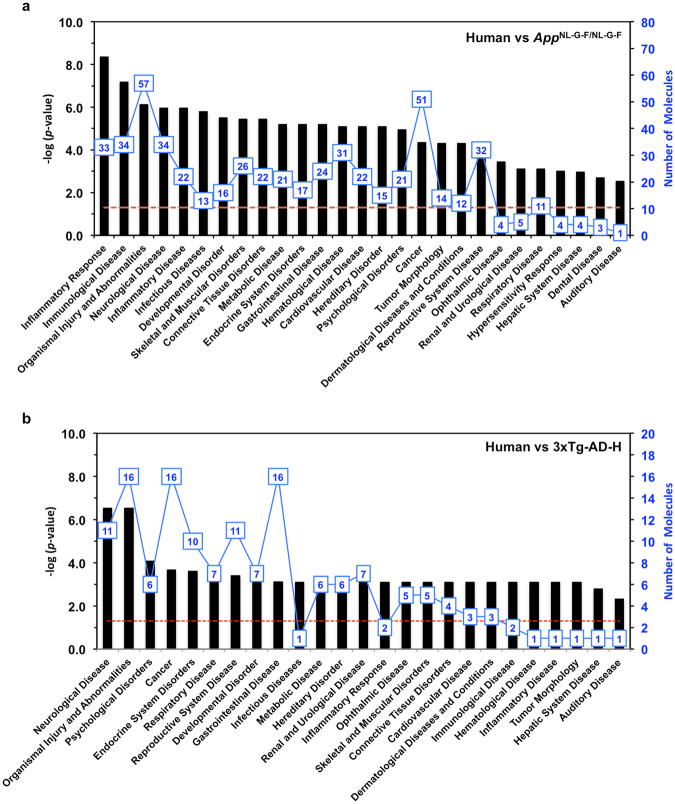
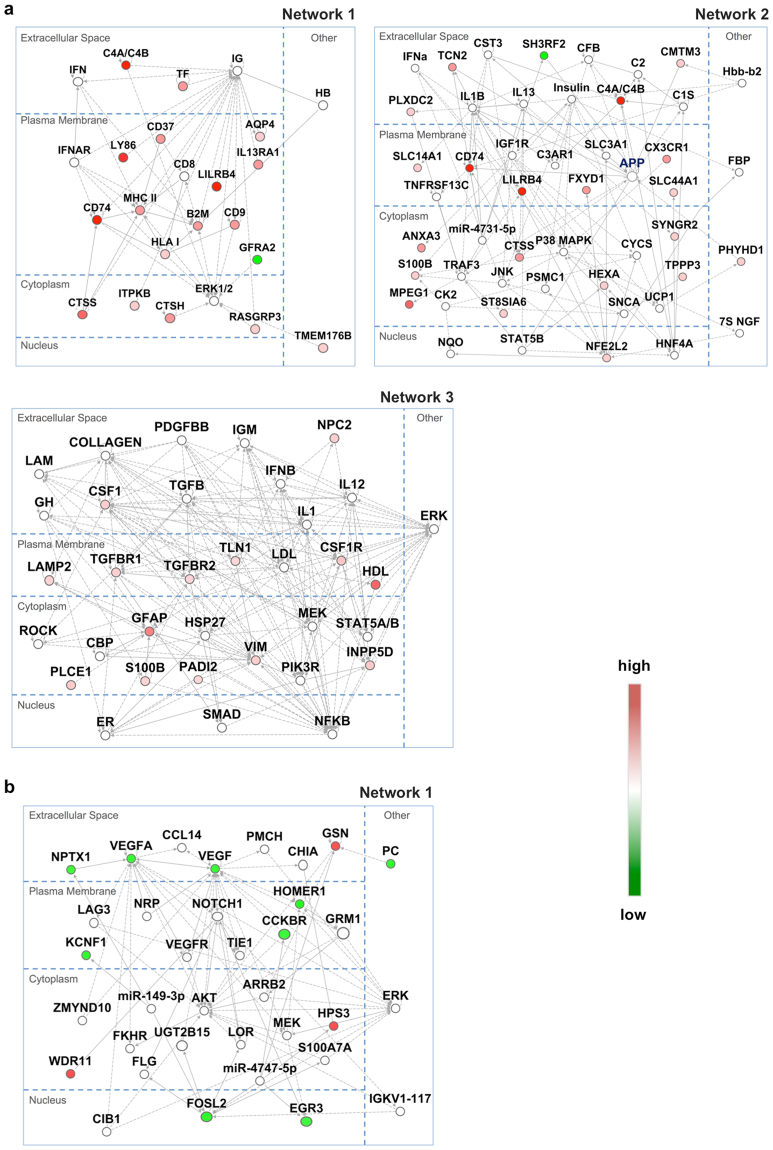
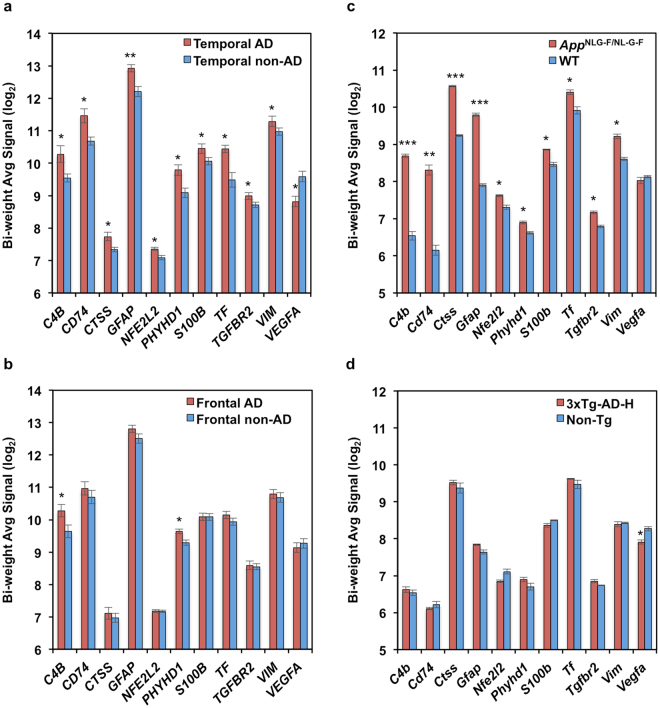
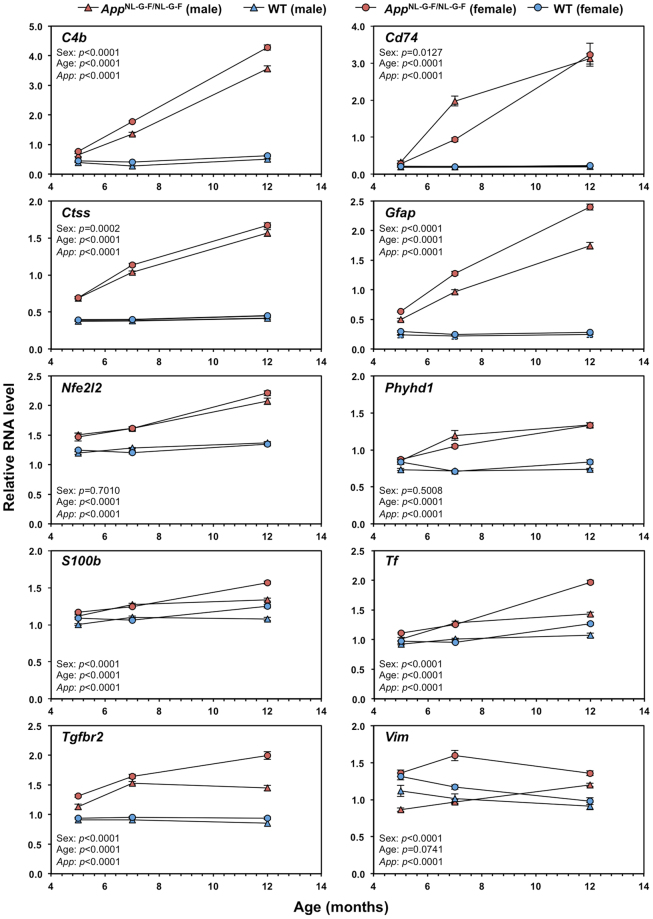
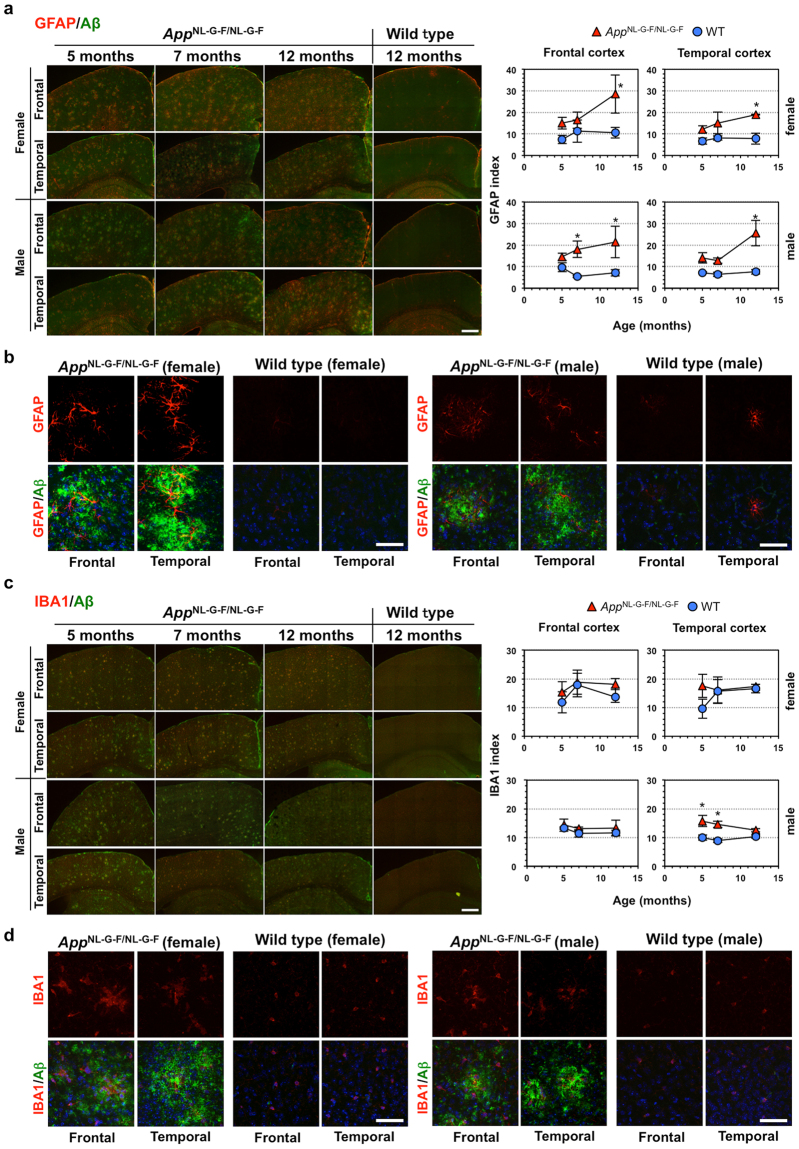
Abstract Alzheimer’s disease (AD) is the most common form of dementia, characterized by accumulation of amyloid β (Aβ) and neurofibrillary tangles. Oxidative stress and inflammation are considered to play an important role in the development and progression of AD. However, the extent to which these events contribute to the Aβ pathologies remains unclear. We performed inter-species comparative gene expression profiling between AD patient brains and theAppNL-G-F/NL-G-Fand 3xTg-AD-H mouse models. Genes commonly altered inAppNL-G-F/NL-G-Fand human AD cortices correlated with the inflammatory response or immunological disease. Among them, expression of AD-related genes (C4a/C4b,Cd74,Ctss,Gfap,Nfe2l2,Phyhd1,S100b,Tf,Tgfbr2, andVim) was increased in theAppNL-G-F/NL-G-Fcortex as Aβ amyloidosis progressed with exacerbated gliosis, while genes commonly altered in the 3xTg-AD-H and human AD cortices correlated with neurological disease. TheAppNL-G-F/NL-G-Fcortex also had altered expression of genes (Abi3,Apoe,Bin2,Cd33,Ctsc,Dock2,Fcer1g,Frmd6,Hck,Inpp5D,Ly86,Plcg2,Trem2,Tyrobp) defined as risk factors for AD by genome-wide association study or identified as genetic nodes in late-onset AD. These results suggest a strong correlation between cortical Aβ amyloidosis and the neuroinflammatory response and provide a better understanding of the involvement of gender effects in the development of AD.
Overview
The claims and statistics of this paper haven’t been checked yet.
Run the check — free, no account needed. It reads the open-access text and checks the sources it cites.
Integrity signals
Registry
Cites
Statistics
Figures
Verification
Claims the paper makes
The claims and statistics of this paper haven’t been checked yet.
Run the check — free, no account needed. It reads the open-access text and checks the sources it cites.
Claims other papers make about this one
Each is checked against this paper’s own text: does it say what the citing paper says it does?
The source backs part of the claim, not all of it — or backs it for a different population, condition or comparison.
In the citing paper
“and in transgenic mice carrying mutations associated with early AD (APP KM670/671 NL, PNSEN1 M146V) or overexpressing the human tau-4R/2N isoform (P301L) [34, 35].”
From Alzheimer’s disease phospholipase C-gamma-2 (PLCG2) protective variant is a functional hypermorph (2019) · cites this paper as [34]
Experimental — accuracy not yet measuredThe cited source says what the claim attributes to it.
In the citing paper
“Although some studies have identified selected overlaps in expression changes between AD mouse models and human brains (Bennett et al., 2018; Castillo et al., 2017; Mostafavi et al., 2018; Neuner et al., 2019; Rojo et al., 2017), other studies have questioned the overall degree of conservation (Burns et al., 2015; Galatro et al., 2017; Hargis and Blalock, 2017).”
From Meta-Analysis of the Alzheimer’s Disease Human Brain Transcriptome and Functional Dissection in Mouse Models (2020) · cites this paper as Castillo et al., 2017
The cited source says what the claim attributes to it.
In the citing paper
“Another study similarly found an upregulation of INPP5D RNA expression in both human AD patients and an App knock-in mouse model [170].”
From Microglial function, INPP5D/SHIP1 signaling, and NLRP3 inflammasome activation: implications for Alzheimer’s disease (2023) · cites this paper as [170]
The cited source says what the claim attributes to it.
In the citing paper
“Comparative gene expression profiling of known genetic risk factors in AD revealed an increase of PLCG2 gene expression in the cortex of AppNL-G-F/NL-G-F mice (165).”
From The role of PLCγ2 in immunological disorders, cancer, and neurodegeneration (2021) · cites this paper as [165]
In the citing paper
“LILRB4 (leukocyte immunoglobulin-like receptor, subfamily B, member 4), orthologues have also been shown to be increased with amyloid deposition and specifically associated with amyloid plaques (Wirz et al., 2013; Kamphuis et al., 2016; Castillo et al., 2017).”
From Genetic variability in response to amyloid beta deposition influences Alzheimer’s disease risk (2019) · cites this paper as Castillo et al., 2017
Self-check
Percentages, sums and reported differences re-computed from the paper’s own numbers.
The self-check needs the paper’s full text.
Citations
Cites
1 retracted
Bialas, A. R., & Stevens, B. (2013) · Nature Neuroscience · doi:10.1038/nn.3560 · Cited by 519
RetractedQuerfurth, H. W., & LaFerla, F. M. (2010) · New England Journal of Medicine · doi:10.1056/nejmra0909142 · Cited by 4,569
Self-citationMeta-Analysis of 74,046 Individuals Identifies 11 New Susceptibility Loci for Alzheimer’s Disease
(EADI), E. A. D. I., Lambert, J.-C., (GERAD), G. A. E. R. I. A. D., Alzheimer's Disease Genetic Consortium (ADGC), (CHARGE), C. F. H. A. A. R. I. G. E., Ibrahim-Verbaas, C. A., Harold, D., Naj, A. C., Sims, R., Bellenguez, C., et al. (2013) · Nature Genetics · doi:10.1038/ng.2802 · Cited by 4,336
Triple-Transgenic Model of Alzheimer’s Disease with Plaques and Tangles
Oddo, S., Caccamo, A., Shepherd, J. D., Murphy, M. P., Golde, T. E., Kayed, R., Metherate, R., Mattson, M. P., Akbari, Y., & LaFerla, F. M. (2003) · Neuron · doi:10.1016/s0896-6273(03)00434-3 · Cited by 4,126
Self-citationComplement and microglia mediate early synapse loss in Alzheimer mouse models
Hong, S., Beja-Glasser, V. F., Nfonoyim, B. M., Frouin, A., Li, S., Ramakrishnan, S., Merry, K. M., Shi, Q., Rosenthal, A., Barres, B. A., et al. (2016) · Science · doi:10.1126/science.aad8373 · Cited by 3,343
Immune attack: the role of inflammation in Alzheimer disease
Heppner, F. L., Ransohoff, R. M., & Becher, B. (2015) · Nature Reviews Neuroscience · doi:10.1038/nrn3880 · Cited by 2,134
Neuroinflammation in Alzheimer's disease: current evidence and future directions
Calsolaro, V., & Edison, P. (2016) · Alzheimer's & Dementia · doi:10.1016/j.jalz.2016.02.010 · Cited by 1,726
Integrated Systems Approach Identifies Genetic Nodes and Networks in Late-Onset Alzheimer’s Disease
Zhang, B., Gaiteri, C., Bodea, L.-G., Wang, Z., McElwee, J., Podtelezhnikov, A. A., Zhang, C., Xie, T., Tran, L., Dobrin, R., et al. (2013) · Cell · doi:10.1016/j.cell.2013.03.030 · Cited by 1,657
Single App knock-in mouse models of Alzheimer’s disease
Saito, T., Matsuba, Y., Mihira, N., Takano, J., Nilsson, P., Itohara, S., Iwata, N., & Saido, T. C. (2014) · Nature Neuroscience · doi:10.1038/nn.3697 · Cited by 1,366
Self-citationBillings, L. M., Oddo, S., Green, K. N., McGaugh, J. L., & LaFerla, F. M. (2005) · Neuron · doi:10.1016/j.neuron.2005.01.040 · Cited by 1,294
Self-citation
Research works printed but not linked: 1
- Pfaffi, M. W. Relative quantification, in real-time PCR (ed. Dorak M. T), Taylor & Francis Group, NY, pp63–82, 2006.
Cited by
Sorted by citations
Spatial Transcriptomics and In Situ Sequencing to Study Alzheimer’s Disease
Chen, W.-T., Lu, A., Craessaerts, K., Pavie, B., Sala Frigerio, C., Corthout, N., Qian, X., Laláková, J., Kühnemund, M., Voytyuk, I., et al. (2020) · Cell · doi:10.1016/j.cell.2020.06.038 · Cited by 949
Self-citationInflammation: the link between comorbidities, genetics, and Alzheimer’s disease
Newcombe, E. A., Camats-Perna, J., Silva, M. L., Valmas, N., Huat, T. J., & Medeiros, R. (2018) · Journal of Neuroinflammation · doi:10.1186/s12974-018-1313-3 · Cited by 532
Metal Toxicity Links to Alzheimer's Disease and Neuroinflammation
Huat, T. J., Camats‐Perna, J., Newcombe, E. A., Valmas, N., Kitazawa, M., & Medeiros, R. (2019) · Journal of Molecular Biology · doi:10.1016/j.jmb.2019.01.018 · Cited by 501
Chan, J. M., Quintanal-Villalonga, À., Gao, V. R., Xie, Y., Allaj, V., Chaudhary, O., Masilionis, I., Egger, J. V., Chow, A. T., Walle, T., et al. (2021) · Cancer Cell · doi:10.1016/j.ccell.2021.09.008 · Cited by 464
Wan, Y.-W., Al-Ouran, R., Mangleburg, C. G., Perumal, T. M., Lee, T. V., Allison, K., Swarup, V., Funk, C. C., Gaiteri, C., Allen, M., et al. (2020) · Cell Reports · doi:10.1016/j.celrep.2020.107908 · Cited by 295
“Although some studies have identified selected overlaps in expression changes between AD mouse models and human brains (Bennett et al., 2018; Castillo et al., 2017; Mostafavi et al., 2018; Neuner et al., 2019; Rojo et al., 2017), other studies have questioned the overall degree of conservation (Burns et al.”
ResultSobue, A., Komine, O., Hara, Y., Endo, F., Mizoguchi, H., Watanabe, S., Murayama, S., Saito, T., Saido, T. C., Sahara, N., et al. (2021) · Acta Neuropathologica Communications · doi:10.1186/s40478-020-01099-x · Cited by 253
Self-citationAging, Frailty, and the Microbiome—How Dysbiosis Influences Human Aging and Disease
Haran, J. P., & McCormick, B. A. (2020) · Gastroenterology · doi:10.1053/j.gastro.2020.09.060 · Cited by 225
Nrf2 Suppresses Oxidative Stress and Inflammation in App Knock-In Alzheimer’s Disease Model Mice
Uruno, A., Matsumaru, D., Ryoke, R., Saito, R., Kadoguchi, S., Saigusa, D., Saito, T., Saido, T. C., Kawashima, R., & Yamamoto, M. P. (2020) · Molecular and Cellular Biology · doi:10.1128/mcb.00467-19 · Cited by 168
Self-citationFerroptosis and NRF2: an emerging battlefield in the neurodegeneration of Alzheimer's disease
Lane, D. J. R., Metselaar, B., Greenough, M., Bush, A. I., & Ayton, S. (2021) · Essays in Biochemistry · doi:10.1042/ebc20210017 · Cited by 160
Flores-Dorantes, M. T., Díaz‐López, Y. E., & Gutiérrez‐Aguilar, R. (2020) · Frontiers in Neuroscience · doi:10.3389/fnins.2020.00863 · Cited by 170
Copper Toxicity Links to Pathogenesis of Alzheimer’s Disease and Therapeutics Approaches
Ijaz, H. W., Wang, W., & Lang, M. (2020) · International Journal of Molecular Sciences · doi:10.3390/ijms21207660 · Cited by 146
Chen, S., Chang, Y., Li, L., Acosta, D., Li, Y., Guo, Q., Wang, C., Turkes, E., Morrison, C., Julian, D., et al. (2022) · Acta Neuropathologica Communications · doi:10.1186/s40478-022-01494-6 · Cited by 144
Alzheimer’s disease phospholipase C-gamma-2 (PLCG2) protective variant is a functional hypermorph
Magno, L., Lessard, C. B., Martins, M., Lang, V., Cruz, P., Asi, Y., Katan, M., Bilsland, J., Lashley, T., Chakrabarty, P., et al. (2019) · Alzheimer's Research & Therapy · doi:10.1186/s13195-019-0469-0 · Cited by 143
A Neuron-Optimized CRISPR/dCas9 Activation System for Robust and Specific Gene Regulation
Savell, K. E., Bach, S. V., Zipperly, M. E., Revanna, J. S., Goska, N. A., Tuscher, J. J., Duke, C. G., Sultan, F. A., Burke, J. N., Williams, D., et al. (2019) · eNeuro · doi:10.1523/eneuro.0495-18.2019 · Cited by 137
Neuroinflammation in mouse models of Alzheimer's disease
Saito, T., & Saido, T. C. (2018) · Clinical and Experimental Neuroimmunology · doi:10.1111/cen3.12475 · Cited by 118
Self-citationThe role of PLCγ2 in immunological disorders, cancer, and neurodegeneration
Jackson, J. T., Mulazzani, E., Nutt, S. L., & Masters, S. L. (2021) · Journal of Biological Chemistry · doi:10.1016/j.jbc.2021.100905 · Cited by 113
“Human genetic data were further corroborated by using well-studied animal models of AD (165, 166).”
BackgroundMethodGenetic variability in response to amyloid beta deposition influences Alzheimer’s disease risk
Salih, D. A., Bayram, S., Guelfi, S., Reynolds, R. H., Shoai, M., Ryten, M., Brenton, J. W., Zhang, D., Matarin, M., Botia, J. A., et al. (2019) · Brain Communications · doi:10.1093/braincomms/fcz022 · Cited by 110
The KEAP1-NRF2 System and Neurodegenerative Diseases
Uruno, A., & Yamamoto, M. P. (2023) · Antioxidants and Redox Signaling · doi:10.1089/ars.2023.0234 · Cited by 113
Microglial activation in early Alzheimer trajectory is associated with higher gray matter volume
Femminella, G. D., Dani, M., Wood, M., Fan, Z., Calsolaro, V., Atkinson, R., Edginton, T. L., Hinz, R., Brooks, D. J., & Edison, P. (2019) · Neurology · doi:10.1212/wnl.0000000000007133 · Cited by 109
Terzioglu, G., & Young-Pearse, T. L. (2023) · Molecular Neurodegeneration · doi:10.1186/s13024-023-00674-9 · Cited by 91
The KEAP1-NRF2 System in Healthy Aging and Longevity
Matsumaru, D., & Motohashi, H. (2021) · Antioxidants · doi:10.3390/antiox10121929 · Cited by 103
Swanson, M. E. V., Scotter, E. L., Smyth, L. C. D., Murray, H. C., Ryan, B., Turner, C. P., Faull, R. L. M., Dragunow, M., & Curtis, M. A. (2020) · Acta Neuropathologica Communications · doi:10.1186/s40478-020-01047-9 · Cited by 91
A Pivotal Role of Nrf2 in Neurodegenerative Disorders: A New Way for Therapeutic Strategies
Süzen, S., Tucci, P., Profumo, E., Buttari, B., & Saso, L. (2022) · Pharmaceuticals · doi:10.3390/ph15060692 · Cited by 90
Naia, L., Shimozawa, M., Bereczki, E., Li, X., Liu, J., Jiang, R., Giraud, R., Leal, N. S., Pinho, C. M., Berger, E., et al. (2023) · Molecular Psychiatry · doi:10.1038/s41380-023-02289-4 · Cited by 79
Williams, G. H., Gatt, A. P., Clarke, E. E., Corcoran, J. P. T., Doherty, P., Chambers, D. J., & Ballard, C. G. (2019) · Translational Psychiatry · doi:10.1038/s41398-019-0555-x · Cited by 66
The three-dimensional landscape of cortical chromatin accessibility in Alzheimer’s disease
Bendl, J., Hauberg, M. E., Girdhar, K., Im, E., Vicari, J. M., Rahman, S., Fernando, M. B., Townsley, K. G., Dong, P., Misir, R., et al. (2022) · Nature Neuroscience · doi:10.1038/s41593-022-01166-7 · Cited by 65
Transcriptional signatures of tau and amyloid neuropathology
Castanho, I., Murray, T. K., Hannon, E., Jeffries, A., Walker, E., Laing, E., Baulf, H., Harvey, J., Bradshaw, L., Randall, A., et al. (2020) · Cell Reports · doi:10.1016/j.celrep.2020.01.063 · Cited by 62
Hassan, M., Raza, H., Abbasi, M. A., Moustafa, A. A., & Seo, S. (2018) · Biomedicine & Pharmacotherapy · doi:10.1016/j.biopha.2018.11.115 · Cited by 62
Swartzlander, D. B., Propson, N. E., Roy, E. R., Saito, T., Saido, T. C., Wang, B., & Zheng, H. (2018) · JCI Insight · doi:10.1172/jci.insight.121109 · Cited by 55
Self-citationSacher, C., Blume, T., Beyer, L., Peters, F., Eckenweber, F., Sgobio, C., Deußing, M., Albert, N. L., Unterrainer, M., Lindner, S., et al. (2019) · Journal of Nuclear Medicine · doi:10.2967/jnumed.119.227322 · Cited by 51
Self-citationAll Together Now: Modeling the Interaction of Neural With Non-neural Systems Using Organoid Models
Chukwurah, E., Osmundsen, A. M., Davis, S. W., & Lizarraga, S. B. (2019) · Frontiers in Neuroscience · doi:10.3389/fnins.2019.00582 · Cited by 51
Garofalo, M., Pandini, C., Bordoni, M., Pansarasa, O., Rey, F., Costa, A. C., Minafra, B., Diamanti, L., Zucca, S., Carelli, S., et al. (2020) · International Journal of Molecular Sciences · doi:10.3390/ijms21249500 · Cited by 54
Samuels, J. D., Moore, K. A., Ennerfelt, H. E., Johnson, A. M., Walsh, A. E., Price, R. J., & Lukens, J. R. (2023) · Alzheimer's & Dementia · doi:10.1002/alz.13089 · Cited by 46
Transcriptional Networks of Microglia in Alzheimer’s Disease and Insights into Pathogenesis
Chew, G., & Petretto, E. G. (2019) · Genes · doi:10.3390/genes10100798 · Cited by 46
Computational Approach to Identifying Universal Macrophage Biomarkers
Dang, D., Taheri, S., Das, S., Ghosh, P., Prince, L. S., & Sahoo, D. (2020) · Frontiers in Physiology · doi:10.3389/fphys.2020.00275 · Cited by 44
Urinary metabolic phenotyping for Alzheimer’s disease
Kurbatova, N., Garg, M., Whiley, L., Chekmeneva, E., Jiménez, B., Gómez-Romero, M., Pearce, J., Kimhofer, T., D’Hondt, E., Soininen, H., et al. (2020) · Scientific Reports · doi:10.1038/s41598-020-78031-9 · Cited by 44
Mazzei, G., Ikegami, R., Abolhassani, N., Haruyama, N., Sakumi, K., Saito, T., Saido, T. C., & Nakabeppu, Y. (2021) · Aging Cell · doi:10.1111/acel.13429 · Cited by 40
Self-citationMizuno, Y., Abolhassani, N., Mazzei, G., Sakumi, K., Saito, T., Saido, T. C., Ninomiya, T., Iwaki, T., Yamasaki, R., Kira, J., et al. (2021) · Oxidative Medicine and Cellular Longevity · doi:10.1155/2021/8635088 · Cited by 42
Self-citationRole of NRF2 in Pathogenesis of Alzheimer’s Disease
Chu, C., Uruno, A., Katsuoka, F., & Yamamoto, M. (2024) · Antioxidants · doi:10.3390/antiox13121529 · Cited by 43
A retrotransposon storm marks clinical phenoconversion to late-onset Alzheimer’s disease
Macciardi, F., Giulia Bacalini, M., Miramontes, R., Boattini, A., Taccioli, C., Modenini, G., Malhas, R., Anderlucci, L., Gusev, Y., Gross, T. J., et al. (2022) · GeroScience · doi:10.1007/s11357-022-00580-w · Cited by 37
Striking a NRF2: The Rusty and Rancid Vulnerabilities Toward Ferroptosis in Alzheimer's Disease
Lane, D. J. R., Alves, F. M., Ayton, S., & Bush, A. I. (2023) · Antioxidants and Redox Signaling · doi:10.1089/ars.2023.0318 · Cited by 36
Transferrin Biosynthesized in the Brain Is a Novel Biomarker for Alzheimer’s Disease
Hoshi, K., Ito, H., Abe, E., Fuwa, T. J., Kanno, M., Murakami, Y., Abe, M., Murakami, T., Yoshihara, A., Ugawa, Y., et al. (2021) · Metabolites · doi:10.3390/metabo11090616 · Cited by 34
Self-citationWang, Y., Sun, Y., Wang, Y., Jia, S., Qiao, Y., Zhou, Z., Shao, W., Zhang, X., Guo, J., Zhang, B., et al. (2023) · Alzheimer's Research & Therapy · doi:10.1186/s13195-023-01324-4 · Cited by 34
“CTSC was defined as a risk factor for AD by GWAS which was significantly upregulated in the App NL − G − F/NL − G − F cortex [42, 43].”
BackgroundAberrant accrual of BIN1 near Alzheimer’s disease amyloid deposits in transgenic models
Rossi, P. D., Andrew, R. J., Musial, T. F., Buggia-Prévot, V., Xu, G. M., Ponnusamy, M., Ly, H., Krause, S. V., Rice, R. C., de l’Estoile, V., et al. (2018) · Brain Pathology · doi:10.1111/bpa.12687 · Cited by 36
Circular RNAs in Alzheimer’s Disease: A New Perspective of Diagnostic and Therapeutic Targets
Vakili, O., Asili, P., Babaei, Z., Mirahmad, M., Keshavarzmotamed, A., Asemi, Z., & Mafi, A. (2022) · CNS & Neurological Disorders - Drug Targets · doi:10.2174/1871527321666220829164211 · Cited by 34
Roles of TREM2 in Alzheimer’s disease
Qi, X., Zhu, K., Ke, W., Wang, J., Mao, S., & Chen, G. (2025) · Translational Neurodegeneration · doi:10.1186/s40035-025-00515-3 · Cited by 38
Liu, J., Jiao, L., Zhong, X., Yao, W., Du, K., Lu, S., Wu, Y., Ma, T., Tong, J., Xu, M., et al. (2022) · Frontiers in Aging Neuroscience · doi:10.3389/fnagi.2022.856628 · Cited by 31
Role of TET1-mediated epigenetic modulation in Alzheimer's disease
Armstrong, M. J., Jin, Y., Vattathil, S., Huang, Y., Schroeder, J. P., Bennet, D. A., Qin, Z. S., Wingo, T. S., & Jin, P. (2023) · Neurobiology of Disease · doi:10.1016/j.nbd.2023.106257 · Cited by 32
A systematic review and meta-analysis on the transcriptomic signatures in alcohol use disorder
Friske, M. M., Torrico, E. C., Haas, M. J. W., Borruto, A. M., Giannone, F., Hade, A.-C., Yu, Y., Gao, L., Sutherland, G. T., HITZEMANN, R. J., et al. (2024) · Molecular Psychiatry · doi:10.1038/s41380-024-02719-x · Cited by 33
Asymmetry of Fibrillar Plaque Burden in Amyloid Mouse Models
Sacher, C., Blume, T., Beyer, L., Biechele, G., Sauerbeck, J., Eckenweber, F., Deußing, M., Focke, C., Parhizkar, S., Lindner, S., et al. (2020) · Journal of Nuclear Medicine · doi:10.2967/jnumed.120.242750 · Cited by 29
Bi, X.-A., Zhou, W., Luo, S., Mao, Y., Hu, X., Zeng, B., & Xu, L. (2022) · Briefings in Bioinformatics · doi:10.1093/bib/bbac137 · Cited by 30
Orchestration of synaptic functions by WAVE regulatory complex‐mediated actin reorganization
Han, K. A., & Ko, J. (2023) · Experimental & Molecular Medicine · doi:10.1038/s12276-023-01004-1 · Cited by 31
Aging and Alzheimer’s disease connection: Nuclear Tau and lamin A
Gil, L., Niño, S. A., Capdeville, G., & Jiménez-Capdeville, M. E. (2021) · Neuroscience Letters · doi:10.1016/j.neulet.2021.135741 · Cited by 31
Changes in the brain transcriptome after DNA Aβ42 trimer immunization in a 3xTg-AD mouse model
Lambracht‐Washington, D., Fu, M., Hynan, L. S., & Rosenberg, R. N. (2020) · Neurobiology of Disease · doi:10.1016/j.nbd.2020.105221 · Cited by 27
Kim, S.-H., Yang, S., Lim, K., Ko, E., Jang, H., Kang, M., Suh, P., & Joo, J. (2021) · Proceedings of the National Academy of Sciences · doi:10.1073/pnas.2011250118 · Cited by 27
Xie, L., & Xie, L. (2023) · PLOS Computational Biology · doi:10.1371/journal.pcbi.1010974 · Cited by 26
Dietary phytochemicals: As a potential natural source for treatment of Alzheimer's Disease
Ren, Z., Yang, H., Zhu, C., Fan, D., & Deng, J. (2023) · Food Innovation and Advances · doi:10.48130/fia-2023-0007 · Cited by 27
Aging, NRF2, and TAU: A Perfect Match for Neurodegeneration?
Brackhan, M., Arribas-Blázquez, M., & Lastres‐Becker, I. (2023) · Antioxidants · doi:10.3390/antiox12081564 · Cited by 28
CD8+ T cells exacerbate AD-like symptoms in mouse model of amyloidosis
Wang, X., Campbell, B., Bodogai, M., McDevitt, R. A., Patrikeev, A., Gusev, F. E., Ragonnaud, E., Kumaraswami, K., Shirenova, S. D., Vardy, K., et al. (2024) · Brain Behavior and Immunity · doi:10.1016/j.bbi.2024.08.045 · Cited by 30
Jones, A. C., Pinki, F., Stewart, G. S., & Costello, D. A. (2021) · Neurochemical Research · doi:10.1007/s11064-021-03283-4 · Cited by 22
Pauls, E., Bayod, S., Mateo, L., Alcalde, V., Juan-Blanco, T., Sánchez‐Soto, M., Saido, T. C., Saito, T., Berenguer, A., Attolini, C. S., et al. (2021) · Genome Medicine · doi:10.1186/s13073-021-00983-y · Cited by 23
Self-citationRodent Modeling of Alzheimer's Disease in Down Syndrome: In vivo and ex vivo Approaches
Farrell, C., Mumford, P., & Wiseman, F. K. (2022) · Frontiers in Neuroscience · doi:10.3389/fnins.2022.909669 · Cited by 22
Tang, L., Wang, Y., Xiang, J., Yang, D., Zhang, Y., Qin, X., & Li, J. (2023) · Experimental and Therapeutic Medicine · doi:10.3892/etm.2023.12125 · Cited by 22
Willin/FRMD6: A Multi-Functional Neuronal Protein Associated with Alzheimer’s Disease
Chen, D., Yu, W., Aitken, L., & Gunn‐Moore, F. J. (2021) · Cells · doi:10.3390/cells10113024 · Cited by 21
Kim, J., Selvaraji, S., Kang, S. W., Lee, W. T., Chen, C. L.-H., Choi, H., Koo, E. H., Jo, D.-G., Leong Lim, K., Lim, Y.-A., et al. (2019) · Brain, Behavior, and Immunity · doi:10.1016/j.bbi.2019.04.011 · Cited by 20
Nakabeppu, Y. (2019) · Advances in experimental medicine and biology · doi:10.1007/978-981-13-3540-2_3 · Cited by 20
Self-citationSun, Y., Zhou, D., Rahman, M. R., Zhu, J., Ghoneim, D. H., Cox, N. J., Beach, T. G., Wu, C., Gamazon, E. R., & Wu, L. (2021) · Human Molecular Genetics · doi:10.1093/hmg/ddab229 · Cited by 18
Basha, S. C., Ramaiah, M. J., & Rao, K. S. J. (2023) · Journal of Alzheimer s Disease · doi:10.3233/jad-221070 · Cited by 23
Górska, A. M., Santos‐García, I., Eiriz, I., Brüning, T., Nyman, T. A., & Pahnke, J. (2024) · Journal of Neuroscience Methods · doi:10.1016/j.jneumeth.2024.110239 · Cited by 20
Li, K., Ran, B., Wang, Y., Liu, L., & Li, W. (2022) · Frontiers in Cell and Developmental Biology · doi:10.3389/fcell.2022.999061 · Cited by 18
Dysregulation of Phosphoinositide 5-Phosphatases and Phosphoinositides in Alzheimer's Disease
Ando, K., Erneux, C., Homa, M., Houben, S., de Fisenne, M.-A., Brion, J., & Leroy, K. (2021) · Frontiers in Neuroscience · doi:10.3389/fnins.2021.614855 · Cited by 18
Babygirija, R., Han, J. H., Sonsalla, M. M., Matoska, R., Calubag, M. F., Green, C. L., Tobon, A., Yeh, C., Vertein, D., Schlorf, S., et al. (2025) · Nature Communications · doi:10.1038/s41467-025-62416-3 · Cited by 16
Ito, T. K., Degawa, T., & Okumura, N. (2023) · BMC Complementary Medicine and Therapies · doi:10.1186/s12906-023-04247-7 · Cited by 17
Altered Gene Expression in Prefrontal Cortex of a Fabry Disease Mouse Model
Kummer, K. K., Kalpachidou, T., Mitrić, M. M., Langeslag, M., & Kress, M. (2018) · Frontiers in Molecular Neuroscience · doi:10.3389/fnmol.2018.00201 · Cited by 17
Emerging Role of Oligodendrocytes Malfunction in the Progression of Alzheimer's Disease
Tylek, K., & Basta‐Kaim, A. (2025) · Journal of Neuroimmune Pharmacology · doi:10.1007/s11481-025-10236-z · Cited by 19
Ramos‐Campoy, O., Lladó, A., Bosch, B., Ferrer, M., Pérez‐Millan, A., Vergara, M., Molina‐Porcel, L., Fort‐Aznar, L., Gonzalo, R., Moreno, F., et al. (2022) · Molecular Neurobiology · doi:10.1007/s12035-022-02969-2 · Cited by 16
ELKAHLOUN, A. G., & Saavedra, J. M. (2019) · Molecular Neurobiology · doi:10.1007/s12035-019-01800-9 · Cited by 16
Cope, Z. A., Murai, T., & Rizzo, S. J. S. (2022) · Frontiers in Aging Neuroscience · doi:10.3389/fnagi.2022.805063 · Cited by 18
Zhang, W., Liu, T., Li, J., Singh, J., Chan, A., Islam, A., Petrache, A. L., Peng, Y., Harvey, K., & Ali, A. B. (2024) · British Journal of Pharmacology · doi:10.1111/bph.16441 · Cited by 15
Urea cycle dysregulation drives metabolic stress and neurodegeneration in Parkinson’s disease
Zhang, S., Wan, G., Qiu, Y. L., Zhang, M., Deng, H., Wang, Q., Hu, J., Gui, J., Chen, D., Huang, B., et al. (2025) · npj Parkinson s Disease · doi:10.1038/s41531-025-01099-5 · Cited by 14
Liu, X., Zhou, Q., Zhang, J.-H., Wang, K., Saito, T., Saido, T. C., Wang, X., Gao, X., & Azuma, K. (2021) · Cells · doi:10.3390/cells10113261 · Cited by 15
Self-citationOverexpression of fibroblast growth factor 13 ameliorates amyloid-β-induced neuronal damage
Zhu, H., Li, R., Xiao, L., Zhang, T., & Ren, D. (2022) · Neural Regeneration Research · doi:10.4103/1673-5374.357902 · Cited by 14
Michaud, S. A., Pětrošová, H., Sinclair, N. J. T., Kinnear, A. L., Jackson, A., McGuire, J. C., Hardie, D. B., Bhowmick, P., Ganguly, M., Flenniken, A. M., et al. (2024) · Communications Biology · doi:10.1038/s42003-023-05687-0 · Cited by 13
Barthelson, K., Newman, M., & Lardelli, M. T. (2021) · Disease Models & Mechanisms · doi:10.1242/dmm.049187 · Cited by 14
Cancer and Alzheimer’s Inverse Correlation: an Immunogenetic Analysis
Bhardwaj, A., Liyanage, S. I., & Weaver, D. F. (2023) · Molecular Neurobiology · doi:10.1007/s12035-023-03260-8 · Cited by 15
Mizuno, Y., Abolhassani, N., Mazzei, G., Saito, T., Saido, T. C., Yamasaki, R., Kira, J., & Nakabeppu, Y. (2021) · Neuroscience Research · doi:10.1016/j.neures.2021.11.009 · Cited by 12
Self-citationExploring links between 2‐oxoglutarate‐dependent oxygenases and Alzheimer's disease
Liu, H., Xie, Y., Wang, X., Abboud, M. I., Ma, C., Ge, W., & Schofield, C. J. (2022) · Alzheimer s & Dementia · doi:10.1002/alz.12733 · Cited by 14
Killick, R., Elliott, C., Ribé, E. M., Broadstock, M., Ballard, C. G., Aarsland, D., & Williams, G. H. (2023) · International Journal of Molecular Sciences · doi:10.3390/ijms241311219 · Cited by 14
Genetic variability in response to Aβ deposition influences Alzheimer’s riskPreprint
Salih, D. A. M., Bayram, S., Guelfi, M. S., Reynolds, R. H., Shoai, M., Ryten, M., Brenton, J., Zhang, D., Matarín, M., Botía, J. A., et al. (2018) · bioRxiv (Cold Spring Harbor Laboratory) · doi:10.1101/437657 · Cited by 13
Oktavianawati, I., Santoso, M., & Fatmawati, S. (2023) · Scientific Reports · doi:10.1038/s41598-023-41494-7 · Cited by 11
Russo-Savage, L., Rao, V. K. S., Eipper, B. A., & Mains, R. E. (2020) · Neurobiology of Aging · doi:10.1016/j.neurobiolaging.2020.07.006 · Cited by 12
Patel, K. R., Zhu, K., Henrion, M., Beckmann, N. D., Moein, S., Alamprese, M. L., Allen, M., Wang, X., Chan, G., Pertel, T., et al. (2020) · bioRxiv (Cold Spring Harbor Laboratory) · doi:10.1101/2020.06.09.143529 · Cited by 9
The Hippo signaling pathway as a therapeutic target in Alzheimer’s disease
Chen, D., Wigglesworth-Littlewood, S., & Gunn‐Moore, F. J. (2025) · Molecular Neurodegeneration · doi:10.1186/s13024-025-00891-4 · Cited by 10
Single-Cell RNA-seq reveals transcriptomic modulation of Alzheimer’s disease by activated protein C
Fatmi, M. K., Wang, H., Slotabec, L. A., Wen, C., Seale, B. C., Zhao, B., & Li, J. (2024) · Aging · doi:10.18632/aging.205624 · Cited by 10
Microglial Responses to Alzheimer's Disease Pathology: Insights From “Omics” Studies
Reid, A. N., Jayadev, S., & Prater, K. E. (2025) · Glia · doi:10.1002/glia.24666 · Cited by 10
Zhang, J., Yao, P., Han, W., Luo, Y., Li, Y., Yang, Y., Xia, H., Chen, Z., Chen, Q., Wang, H., et al. (2022) · International Journal of Molecular Sciences · doi:10.3390/ijms23116142 · Cited by 10
Kronenberg, N. M., Tilston-Lünel, A., Thompson, F. E., Chen, D., Yu, W., Dholakia, K., Gather, M. C., & Gunn‐Moore, F. J. (2020) · Frontiers in Cellular Neuroscience · doi:10.3389/fncel.2020.552213 · Cited by 10
Chomyk, A., Kucinski, R., Kim, J., Christie, E., Cyncynatus, K., Gossman, Z., Chen, Z., Richardson, B., Cameron, M., Turner, T., et al. (2024) · Annals of Neurology · doi:10.1002/ana.26877 · Cited by 9
Integrated single-cell analyses decode the developmental landscape of the human fetal spine
Yu, H., Tang, D., Wu, H., Li, C., Lu, Y., He, F., Zhang, X., Yang, Y., Shi, W., Hu, W., et al. (2022) · iScience · doi:10.1016/j.isci.2022.104679 · Cited by 10
Transcriptomic Analyses of Exercise Training in Alzheimer’s Disease Cerebral Cortex
Widjaya, M. A., Cheng, Y., Kuo, Y., Liu, C.-H., Cheng, W., & Lee, S. (2023) · Journal of Alzheimer s Disease · doi:10.3233/jad-221139 · Cited by 8
Metadata
- Authors
- Castillo, E., Leon, J., Mazzei, G., Abolhassani, N., Haruyama, N., Saito, T., Saido, T., Hokama, M., Iwaki, T., Ohara, T., Ninomiya, T., Kiyohara, Y., Sakumi, K., LaFerla, F. M., & Nakabeppu, Y.
- Affiliations
- Kyushu University (JP)
- RIKEN (JP)
- Hisayama Research Institute For Lifestyle Diseases (JP)
- University of California, Irvine (US)
- Corresponding author
- Nakabeppu, Yusaku
- ORCID
- Venue
- Scientific Reports
- Published
- 2017-12-19
- Volume
- 7
- Issue
- 1
- Pages
- 17762-17762
- ISSN
- 2045-2322 (ISSN-L)
- PMC
- PMC5736730
- OpenAlex
- W2771127066
- Cited by
- 158
- References
- 61
- Citations by year
- 2026: 5 · 2025: 12 · 2024: 16 · 2023: 29 · 2022: 21 · 2021: 24 · 2020: 23 · 2019: 18 · 2018: 10
- FWCI
- 10.31
- Type
- journal article
- Language
- en
- Update notices
- correction (2021-09-09)
- Open access
- gold
- doi.org
- Locations
- Scientific Reports (publishedVersion, cc-by)
- Europe PMC (PubMed Central) (publishedVersion, cc-by)
- PubMed Central (publishedVersion, cc-by)
- PubMed (publishedVersion)
- Kyushu University Institutional Repository (QIR) (Kyushu University) (submittedVersion, cc-by)
- DOAJ (DOAJ: Directory of Open Access Journals) (submittedVersion)
- eScholarship (California Digital Library) (submittedVersion, cc-by)
- Funders
- Japan Agency for Medical Research and Development (H25-ninchisho-ippann-004)
- Ministry of Health, Labour and Welfare (H20-ninchisho-ippan-004)
- Fakultet Medicinskih Nauka, Univerziteta U Kragujevcu
- Japan Society for the Promotion of Science (26290017, 22221004, 15K15085, 17H01391)
- Topics
- Life Sciences › Neuroscience › Cellular and Molecular Neuroscience › Alzheimer's disease research and treatments
- Life Sciences › Neuroscience › Neurology › Neuroinflammation and Neurodegeneration Mechanisms
- Health Sciences › Medicine › Psychiatry and Mental health › Dementia and Cognitive Impairment Research
- Keywords
- Alzheimer's disease, neuroinflammation, cortical gene expression, gliosis, oxidative stress, sex differences
- MeSH terms
- Aged, Aged, 80 and over, Alzheimer Disease, Amyloidosis, Animals, Brain, Disease Models, Animal, Female, Gliosis, Humans, Inflammation, Male, Middle Aged, Gene Expression, Amyloid beta-Peptides, Gene Expression Profiling, Mice, Genome-Wide Association Study
About these checks
Registry, retraction, Cites and statistics results are computed, not judged, with one exception: a printed reference that no index lists is read once by a model before it counts as a citation error. Claims are extracted by a model and kept only when their quote appears verbatim in the text; each cited source is then checked, with a model’s help, for whether it says what the claim relies on. Those verdicts can be wrong — read the claim’s quote and the cited source before relying on one.
Statistics and arithmetic are recomputed, not judged.
Confidence bands are shown only for fields calibrated on our annotated test set. None is calibrated yet, so no band is shown.
What counts as a claim ›How we measure confidence ›How we check this ›
Are you an author, or do you see a problem with this page? Request a review
