

The DOI matches its Crossref record; 15 of the 15 references it cites were found in a registry or an index.
Differential preservation of endogenous human and microbial DNA in dental calculus and dentin
Abstract
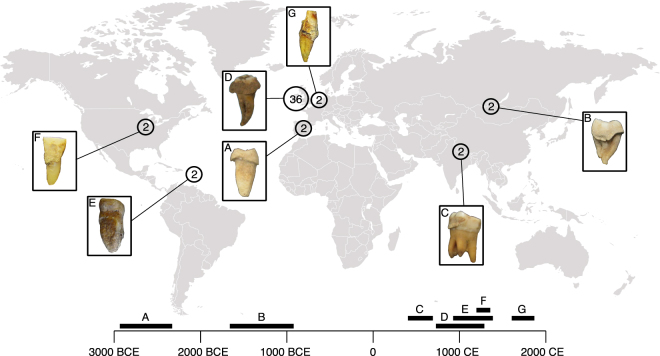
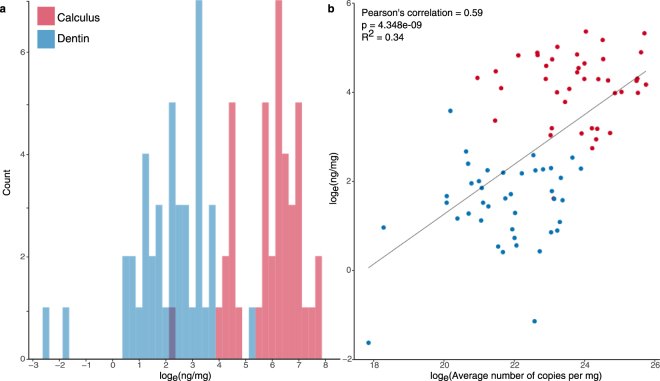
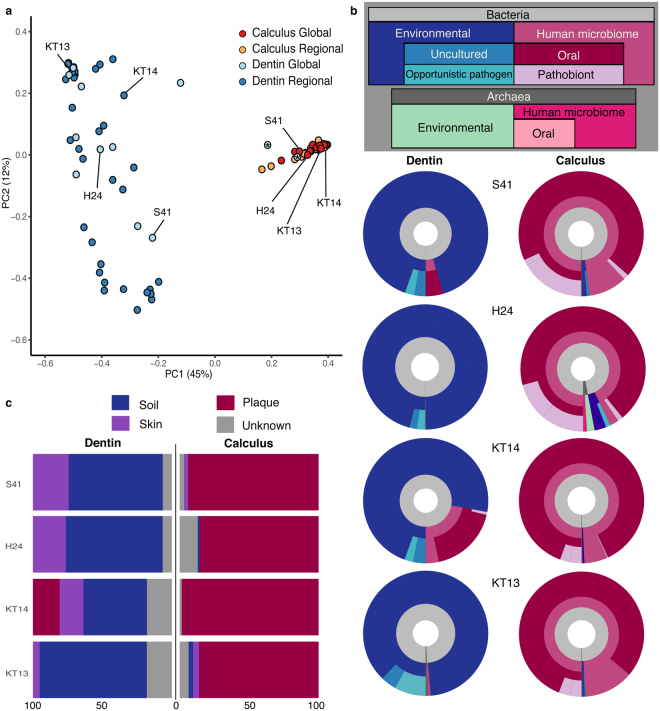
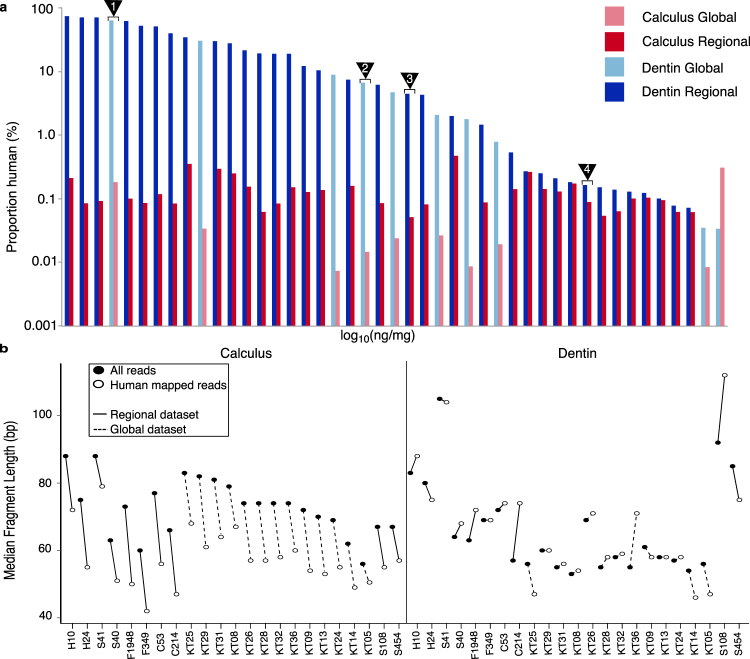
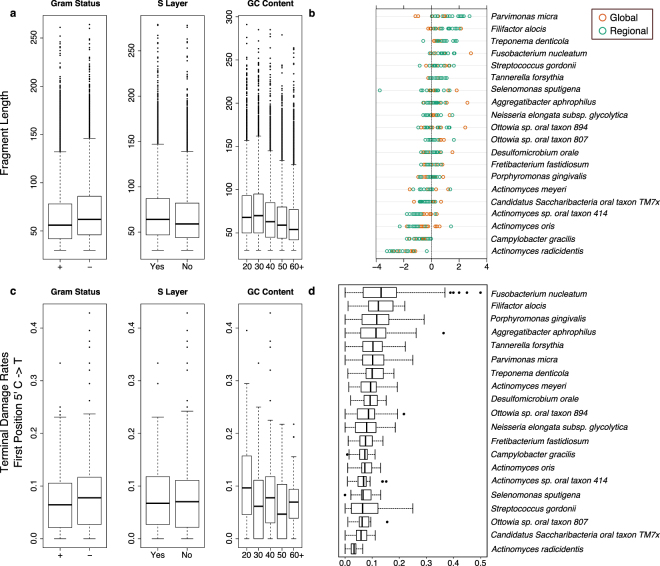
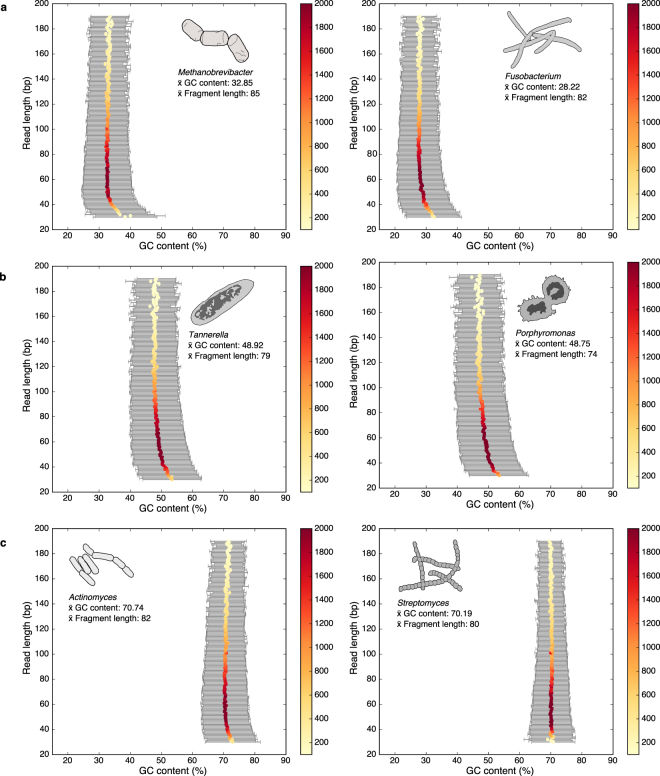
Dental calculus (calcified dental plaque) is prevalent in archaeological skeletal collections and is a rich source of oral microbiome and host-derived ancient biomolecules. Recently, it has been proposed that dental calculus may provide a more robust environment for DNA preservation than other skeletal remains, but this has not been systematically tested. In this study, shotgun-sequenced data from paired dental calculus and dentin samples from 48 globally distributed individuals are compared using a metagenomic approach. Overall, we find DNA from dental calculus is consistently more abundant and less contaminated than DNA from dentin. The majority of DNA in dental calculus is microbial and originates from the oral microbiome; however, a small but consistent proportion of DNA (mean 0.08 ± 0.08%, range 0.007–0.47%) derives from the host genome. Host DNA content within dentin is variable (mean 13.70 ± 18.62%, range 0.003–70.14%), and for a subset of dentin samples (15.21%), oral bacteria contribute > 20% of total DNA. Human DNA in dental calculus is highly fragmented, and is consistently shorter than both microbial DNA in dental calculus and human DNA in paired dentin samples. Finally, we find that microbial DNA fragmentation patterns are associated with guanine-cytosine (GC) content, but not aspects of cellular structure.
Overview
The claims and statistics of this paper haven’t been checked yet.
Run the check — free, no account needed. It reads the open-access text and checks the sources it cites.
Integrity signals
Registry
Cites
Statistics
Figures
Verification
Claims the paper makes
The claims and statistics of this paper haven’t been checked yet.
Run the check — free, no account needed. It reads the open-access text and checks the sources it cites.
Claims other papers make about this one
Each is checked against this paper’s own text: does it say what the citing paper says it does?
In the citing paper
“Genomic DNA extraction and Illumina double-stranded DNA (dsDNA) sequencing library preparation were performed for all samples in a dedicated ancient DNA clean room facility at the MPI-SHH, following published protocols (Dabney et al., 2013) with slight modifications (Mann et al., 2018).”
From A Dynamic 6,000-Year Genetic History of Eurasia’s Eastern Steppe (2020) · cites this paper as Mann et al., 2018
Self-check
Percentages, sums and reported differences re-computed from the paper’s own numbers.
The self-check needs the paper’s full text.
Citations
Cites
Novel cell death program leads to neutrophil extracellular traps
Fuchs, T. A., Abed, U., Goosmann, C., Hurwitz, R., Schulze, I., Wahn, V., Weinrauch, Y., Brinkmann, V., & Zychlinsky, A. (2007) · The Journal of Cell Biology · doi:10.1083/jcb.200606027 · Cited by 3,197
A framework for human microbiome research
The Human Microbiome Project Consortium (2012) · Nature · doi:10.1038/nature11209 · Cited by 2,650
Huson, D. H., Beier, S., Flade, I., Górska, A., El-Hadidi, M., Mitra, S., Ruscheweyh, H.-J., & Tappu, R. (2016) · PLOS Computational Biology · doi:10.1371/journal.pcbi.1004957 · Cited by 1,761
mapDamage2.0: fast approximate Bayesian estimates of ancient DNA damage parameters
Jónsson, H., Ginolhac, A., Schubert, M., Johnson, P. L. F., & Orlando, L. (2013) · Bioinformatics · doi:10.1093/bioinformatics/btt193 · Cited by 1,669
Dabney, J., Knapp, M., Glocke, I., Gansauge, M.-T., Weihmann, A., Nickel, B., Valdiosera, C., García, N., Pääbo, S., Arsuaga, J.-L., et al. (2013) · Proceedings of the National Academy of Sciences · doi:10.1073/pnas.1314445110 · Cited by 1,443
Chen, T., Yu, W.-H., Izard, J., Baranova, O. V., Lakshmanan, A., & Dewhirst, F. E. (2010) · Database · doi:10.1093/database/baq013 · Cited by 1,162
Double indexing overcomes inaccuracies in multiplex sequencing on the Illumina platform
Kircher, M., Sawyer, S., & Meyer, M. (2012) · Nucleic Acids Research · doi:10.1093/nar/gkr771 · Cited by 1,106
Temporal Stability of the Human Skin Microbiome
Oh, J., Byrd, A. L., Park, M., Kong, H. H., & Segre, J. A. (2016) · Cell · doi:10.1016/j.cell.2016.04.008 · Cited by 1,036
Hofreiter, M. (2001) · Nucleic Acids Research · doi:10.1093/nar/29.23.4793 · Cited by 684
Genome flux and stasis in a five millennium transect of European prehistory
Gamba, C., Jones, E. R., Teasdale, M. D., McLaughlin, R. L., Gonzalez-Fortes, G., Mattiangeli, V., Domboróczki, L., Kővári, I., Pap, I., Anders, A., et al. (2014) · Nature Communications · doi:10.1038/ncomms6257 · Cited by 667
Adler, C. J., Dobney, K., Weyrich, L. S., Kaidonis, J., Walker, A. W., Haak, W., Bradshaw, C. J. A., Townsend, G., Sołtysiak, A., Alt, K. W., et al. (2013) · Nature Genetics · doi:10.1038/ng.2536 · Cited by 621
Temporal patterns of nucleotide misincorporations and DNA fragmentation in ancient DNA
Sawyer, S., Krause, J., Guschanski, K., Savolainen, V., & Pääbo, S. (2012) · PLoS ONE · doi:10.1371/journal.pone.0034131 · Cited by 489
Self-citationAncient DNA from a pre‐Columbian Amerindian population
Stone, A. C., & Stoneking, M. (1993) · American Journal of Physical Anthropology · doi:10.1002/ajpa.1330920405 · Cited by 187
Self-citationSuccessful enrichment and recovery of whole mitochondrial genomes from ancient human dental calculus
Ozga, A. T., Nieves‐Colón, M. A., Honap, T. P., Sankaranarayanan, K., Hofman, C. A., Milner, G. R., Lewis, C. M., Stone, A. C., & Warinner, C. (2016) · American Journal of Physical Anthropology · doi:10.1002/ajpa.22960 · Cited by 79
Self-citationObservations of the surface of dental calculus using scanning electron microscopy.
SHIRATO, M., KAMISHIKIRYO, K., ITOH, A., KADO, H., MAEDA, Y., SEKIGUCHI, T., FUKUI, K., & TAKEZAWA, T. (1981) · The Journal of Nihon University School of Dentistry · doi:10.2334/josnusd1959.23.179 · Cited by 8
Research works printed but not linked: 69
- White, D. J. Processes contributing to the formation of dental calculus. Biofouling 4, 209–218 (1991). · DOI
- Marsh, P. D. Dental plaque as a biofilm and microbial community - implications for health and disease. BMC Oral Health 6, https://doi.org/10.1186/1472-6831-6-S1-S14 (2006). · DOI · Paper page
- Warinner, C., Speller, C. & Collins, M. J. A new era in palaeomicrobiology: prospects for ancient dental calculus as a long-term record of the human oral microbiome. Phil. Trans. R. Soc. B 370, 20130376 (2015). · DOI
- Marsh, P. D. & Bradshaw, D. J. Dental plaque as a biofilm. Journal of Industrial Microbiology 15, 169–175, https://doi.org/10.1007/bf01569822 (1995). · DOI
- Power, R. C., Salazar-García, D. C., Wittig, R. M., Freiberger, M. & Henry, A. G. Dental calculus evidence of plant diet and life history transitions in the chimpanzees of the Taï Forest. Scientific Reports 5, 15161 (2015). · DOI
- Power, R. C., Salazar-García, D. C., Wittig, R. M. & Henry, A. G. Assesing use and suitability of scanning electron microscopy in the analysis of micro remains in dental calculus. Journal of Archaeological Science 49, 160–169 (2014). · DOI
- Armitage, P. L. The extraction and identification of opal phytoliths from the teeth of ungulates. Journal of Archaeological Science 2, 187–197, https://doi.org/10.1016/0305-4403(75)90056-4 (1975). · DOI
- Fox, C. L., Pérez-Pérez, A. & Juan, J. Dietary Information through the Examination of Plant Phytoliths on the Enamel Surface of Human Dentition. Journal of Archaeological Science 21, 29–34, https://doi.org/10.1006/jasc.1994.1005 (1994). · DOI
- Henry, A. G., Brooks, A. S. & Piperno, D. R. Microfossils in calculus demonstrate consumption of plants and cooked foods in Neanderthal diets (Shanidar III, Iraq; Spy I and II, Belgium). Proceedings of the National Academy of Sciences 108, 486 (2011). · DOI
- Dudgeon John, V. & Tromp, M. Diet, Geography and Drinking Water in Polynesia: Microfossil Research from Archaeological Human Dental Calculus, Rapa Nui (Easter Island). International Journal of Osteoarchaeology 24, 634–648, https://doi.org/10.1002/oa.2249 (2012). · DOI
- King, D. J., Searcy, M. T., Yost, C. L. & Waller, K. Corn, Beer, and Marine Resources at Casas Grandes, Mexico: An Analysis of Prehistoric Diets Using Microfossils Recovered from Dental Calculus. Journal of Archaeological Science: Reports 16, 365–379, https://doi.org/10.1016/j.jasrep.2017.10.013 (2017). · DOI
- de la Fuente, C., Flores, S. & Moraga, M. DNA from human ancient bacteria: A novel source of genetic evidence from archaeological dental calculus. Archaeometry 55, 767–778 (2013). · DOI · Paper page
- Warinner, C. et al. Pathogens and host immunity in the ancient human oral cavity. Nat. Genet. 46, 336–344 (2014). · DOI · Paper page
- Weyrich, L. S. et al. Neanderthal behaviour, diet, and disease inferred from ancient DNA in dental calculus. Nature 544, 357 (2017). · DOI
- Price, S. D. R., Keenleyside, A. & Schwarcz, H. P. Testing the validity of stable isotope analyses of dental calculus as a proxy in paleodietary studies. Journal of Archaeological Science 91, 92–103 (2018). · DOI
- Paabo, S. et al. Genetic analyses from ancient DNA. Annual review of genetics 38, 645–679, https://doi.org/10.1146/annurev.genet.37.110801.143214 (2004). · DOI · Paper page
- Dabney, J., Meyer, M. & Pääbo, S. Ancient DNA damage. Cold Spring Harbor perspectives in biology 5, a012567 (2013). · DOI · Paper page
- Damgaard, P. B. et al. Improving access to endogenous DNA in ancient bones and teeth. Scientific Reports 5, 11184 (2015). · DOI · Paper page
- Pinhasi, R. et al. Optimal ancient DNA yields from the inner ear part of the human petrous bone. PloS one 10, e0129102 (2015). · DOI · Paper page
- Hansen, H. B. et al. Comparing ancient DNA preservation in petrous bone and tooth cementum. PLoS One 12, e0170940 (2017). · DOI
- Ziesemer, K. A. et al. Intrinsic challenges in ancient microbiome reconstruction using 16S rRNA gene amplification. Sci Rep 5, 16498, https://doi.org/10.1038/srep16498 (2015). · DOI · Paper page
- Kemp, B. M., Winters, M., Monroe, C. & Barta, J. L. How much DNA is lost? Measuring DNA loss of short-tandem-repeat length fragments targeted by the PowerPlex 16 System using the Qiagen MinElute Purification Kit. Human Biology 86, 1–18 (2014). · DOI
- Vågene, Å. J. et al. Salmonella enterica genomes from victims of a major sixteenth-century epidemic in Mexico. Nature Ecology & Evolution, https://doi.org/10.1038/s41559-017-0446-6 (2018). · DOI
- Segata, N. et al. Metagenomic biomarker discovery and explanation. Genome biology 12, R60 (2011). · DOI · Paper page
- Ondov, B. D., Bergman, N. H. & Phillippy, A. M. Interactive metagenomic visualization in a Web browser. BMC Bioinformatics 12, 385 (2011). · DOI
- Coordinators, N. R. Database resources of the National Center for Biotechnology Information. Nucleic Acids Res 46, D8–D13, https://doi.org/10.1093/nar/gkx1095 (2018). · DOI
- Knights, D. et al. Bayesian community-wide culture-independent microbial source tracking. Nat Meth 8, 761–763, http://www.nature.com/nmeth/journal/v8/n9/abs/nmeth.1650.html - supplementary-information (2011). · DOI
- Huttenhower, C. et al. Structure, function and diversity of the healthy human microbiome. Nature 486, 207 (2012). · DOI · Paper page
- Johnston, E. R. et al. Metagenomics reveals pervasive bacterial populations and reduced community diversity across the Alaska tundra ecosystem. Frontiers in microbiology 7, 579 (2016). · DOI
- Belda-Ferre, P. et al. The oral metagenome in health and disease. The ISME journal 6, 46 (2012). · DOI
- Jiang, W. et al. Pyrosequencing analysis of oral microbiota shifting in various caries states in childhood. Microbial ecology 67, 962–969 (2014). · DOI
- Schuenemann, V. J. et al. Genome-Wide Comparison of Medieval and Modern Mycobacterium leprae. Science 341, 179 (2013). · DOI · Paper page
- Socransky, S. S. & Haffajee, A. D. Dental biofilms: difficult therapeutic targets. Periodontology 2000 28, 2–55 (2002). · DOI · Paper page
- Marshall, G. W., Marshall, S. J., Kinney, J. H. & Balooch, M. The dentin substrate: structure and properties related to bonding. Journal of Dentistry 25, 441–458, https://doi.org/10.1016/S0300-5712(96)00065-6 (1997). · DOI
- Palmer, L., Chapple, I., Wright, H., Roberts, A. & Cooper, P. Extracellular deoxyribonuclease production by periodontal bacteria. Journal of periodontal research 47, 439–445 (2012). · DOI · Paper page
- Warinner, C., Speller, C., Collins, M. J. & C. M., L. Jr. Ancient human microbiomes. Journal of Human Evolution 79, 125–136 (2015). · DOI
- Watson, P. et al. Penetration of fluoride into natural plaque biofilms. Journal of dental research 84, 451–455 (2005). · DOI
- Velsko, I. M. et al. The dental calculus metabolome in modern and historic samples. Metabolomics 13 (2017). · DOI
- Linde, A. & Goldberg, M. Dentinogenesis. Critical Reviews in Oral Biology and Medicine 4, 679–728 (1993). · DOI
- Lekic, P., Rojas, J., Birek, C., Tenenbaum, H. & McCulloch, C. A. G. Phenotypic comparison of periodontal ligament cells in vivo and in vitro. Journal of Periodontal Research 36, 71–79 (2001). · DOI
- Provenza, D. V. The Blood Vascular Supply of the Dental Pulp with Emphasis on Capillary Circulation. Circulation Research 6, 213 (1958). · DOI
- Philips, A. et al. Comprehensive analysis of microorganisms accompanying human archaeological remains. GigaScience (2017). · DOI
- Seper, A. et al. Vibrio cholerae evades neutrophil extracellular traps by the activity of two extracellular nucleases. PLoS pathogens 9, e1003614 (2013). · DOI
- Ryder, M. I. Comparison of neutrophil functions in aggressive and chronic periodontitis. Periodontology 2000 53, 124–137 (2010). · DOI · Paper page
- Branzk, N. et al. Neutrophils sense microbe size and selectively release neutrophil extracellular traps in response to large pathogens. Nature immunology 15, 1017 (2014). · DOI · Paper page
- von Köckritz-Blickwede, M., Blodkamp, S. & Nizet, V. Interaction of bacterial exotoxins with neutrophil extracellular traps: impact for the infected host. Frontiers in microbiology 7, 402 (2016). · DOI
- Bhongir, R. K. et al. DNA-fragmentation is a source of bactericidal activity against Pseudomonas aeruginosa. Biochemical Journal 474, 411–425 (2017). · DOI
- Majewski, P. et al. Inhibitors of serine proteases in regulating the production and function of neutrophil extracellular traps. Frontiers in immunology 7, 261 (2016). · DOI
- Brinkmann, V. & Zychlinsky, A. Neutrophil extracellular traps: is immunity the second function of chromatin? J Cell Biol 198, 773–783 (2012). · DOI · Paper page
- Palmer, L. J., Damgaard, C., Holmstrup, P. & Nielsen, C. H. Influence of complement on neutrophil extracellular trap release induced by bacteria. Journal of periodontal research 51, 70–76 (2016). · DOI
- Dang, G. et al. Characterization of Rv0888, a novel extracellular nuclease from Mycobacterium tuberculosis. Scientific reports 6, 19033 (2016). · DOI
- Warinner, C. et al. A Robust Framework for Microbial Archaeology. Annual Review of Genomics and Human Genetics 18, 321–356, https://doi.org/10.1146/annurev-genom-091416-035526 (2017). · DOI
- Panjkovich, A., Norambuena, T. & Melo, F. dnaMATE: a consensus melting temperature prediction server for short DNA sequences. Nucleic Acids Research 33, W570–W572, https://doi.org/10.1093/nar/gki379 (2005). · DOI
- Foerstner, K. U., Von Mering, C., Hooper, S. D. & Bork, P. Environments shape the nucleotide composition of genomes. EMBO reports 6, 1208–1213 (2005). · DOI
- Gansauge, M.-T. et al. Single-stranded DNA library preparation from highly degraded DNA using T4 DNA ligase. Nucleic Acids Research 45, e79–e79, https://doi.org/10.1093/nar/gkx033 (2017). · DOI
- Waters-Rist, A. L. & Hoogland, M. L. P. Osteological evidence of short-limbed dwarfism in a nineteenth century Dutch family: Achondroplasia or hypochondroplasia. Int J Pathology 3, 243–256 (2013).
- Maurandi, J. L., Martinex, M. L., Martinez, F. R. & Fernandez, A. A. The collective Chalcolithic burial of Camino del Molino (Caravaca de la Cruz, Murcia, Spain). Methodology and the first results of an exceptional archaeological site. Trabajos Prehist 66, 143–159 (2009). · DOI
- Aldenderfer, M. Variation in mortuary practice on the early Tibetan plateau and the high Himalayas. Journal of the International Association for Bon Research 1, 293–318 (2013).
- Jeong, C. et al. Long-term genetic stability and a high-altitude East Asian origin for the peoples of the high valleys of the Himalayan arc. Proc Natl Acad Sci USA 113, 7485–7490, https://doi.org/10.1073/pnas.1520844113 (2016). · DOI
- Littleton, J. et al. Taphonomic analysis of Bronze Age burials in Mongolian khirigsuurs. Journal of Archaeological Science 39, 3361–3370 (2012). · DOI
- Read, C. In Medieval Lough Cé: history, archaeology, and landscape (ed. Thomas Finan) (Four Courts Press, 2010).
- Meyer, M. & Kircher, M. Illumina sequencing library preparation for highly multiplexed target capture and sequencing. Cold Spring Harbor Protocols 2010, pdb. prot5448 (2010). · DOI
- Peltzer, A. et al. EAGER: efficient ancient genome reconstruction. Genome biology 17, 60 (2016). · DOI · Paper page
- Wickham, H. ggplot2: Elegant Graphics for Data Analysis. (Springer-Verlag, 2009). · DOI · Paper page
- Sarkar, D. Lattice: multivariate data visualization with R. (Springer Science & Business Media, 2008). · DOI
- Li, H. & Durbin, R. Fast and accurate short read alignment with Burrows-Wheeler Transform. Bioinformatics 25, 1754–1760 (2009). · DOI · Paper page
- Paradis, E., Claude, J. & Strimmer, K. APE: analyses of phylogenetics and evolution in R language. Bioinformatics 20, 289–290 (2004). · DOI · Paper page
- Sabin, S. Ancient DNA analysis of dental remains from Kilteasheen: a case study in metagenomics and an exploration of dental calculus M.Sc. thesis, Eberhard-Karls-Universität Tübingen, (2016).
- Tange, O. In The USENIX Magazine 42-47 (2011). · DOI
Cited by
A Dynamic 6,000-Year Genetic History of Eurasia’s Eastern Steppe
Jeong, C., Wang, K., Wilkin, S., Taylor, W. T. T., Miller, B. K., Bemmann, J. H., Stahl, R., Chiovelli, C., Knolle, F., Ulziibayar, S., et al. (2020) · Cell · doi:10.1016/j.cell.2020.10.015 · Cited by 328
Self-citationVelsko, I. M., Fellows Yates, J. A., Aron, F., Hagan, R. W., Frantz, L. A. F., Loe, L., Martinez, J. B. R., Chaves, E., Gosden, C., Larson, G., et al. (2019) · Microbiome · doi:10.1186/s40168-019-0717-3 · Cited by 170
Self-citationBravo-Lopez, M., Villa-Islas, V., Rocha Arriaga, C., Villaseñor-Altamirano, A. B., Guzmán-Solís, A., Sandoval-Velasco, M., Wesp, J. K., Alcantara, K., López-Corral, A., Gómez-Valdés, J., et al. (2020) · Philosophical Transactions of the Royal Society B: Biological Sciences · doi:10.1098/rstb.2019.0580 · Cited by 40
Metadata
- Authors
- Mann, A. E., Sabin, S., Ziesemer, K., Vågene, Å. J., Schroeder, H., Ozga, A. T., Sankaranarayanan, K., Hofman, C. A., Fellows Yates, J. A., Salazar-García, D. C., Frohlich, B., Aldenderfer, M., Hoogland, M., Read, C., Milner, G. R., Stone, A. C., Lewis, C. M., Krause, J., Hofman, C., Bos, K. I., & Warinner, C.
- ORCID
- Venue
- Scientific Reports
- Published
- 2018-06-29
- Volume
- 8
- Issue
- 1
- ISSN
- 2045-2322
- PMC
- PMC6026117
- Cited by
- 130
- References
- 15
- Language
- en
About these checks
Registry, retraction, Cites and statistics results are computed, not judged, with one exception: a printed reference that no index lists is read once by a model before it counts as a citation error. Claims are extracted by a model and kept only when their quote appears verbatim in the text; each cited source is then checked, with a model’s help, for whether it says what the claim relies on. Those verdicts can be wrong — read the claim’s quote and the cited source before relying on one.
Statistics and arithmetic are recomputed, not judged.
Confidence bands are shown only for fields calibrated on our annotated test set. None is calibrated yet, so no band is shown.
What counts as a claim ›How we measure confidence ›How we check this ›
Are you an author, or do you see a problem with this page? Request a review
