

The DOI matches its Crossref record; 77 of the 77 references it cites were found in a registry or an index.
Selective USP7 inhibition elicits cancer cell killing through a p53-dependent mechanism.
Open accessAbstract
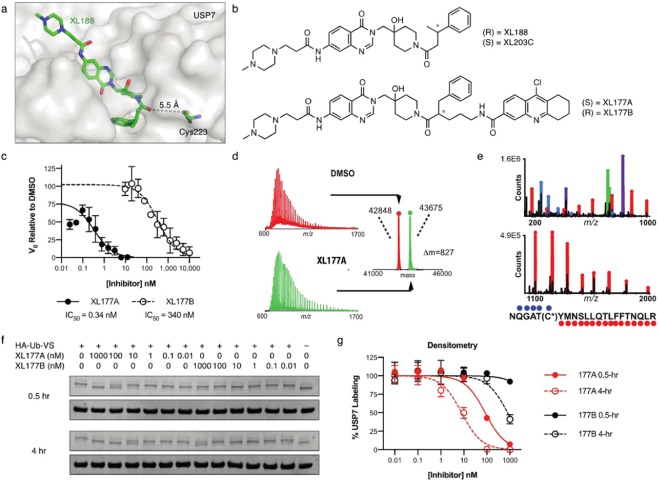
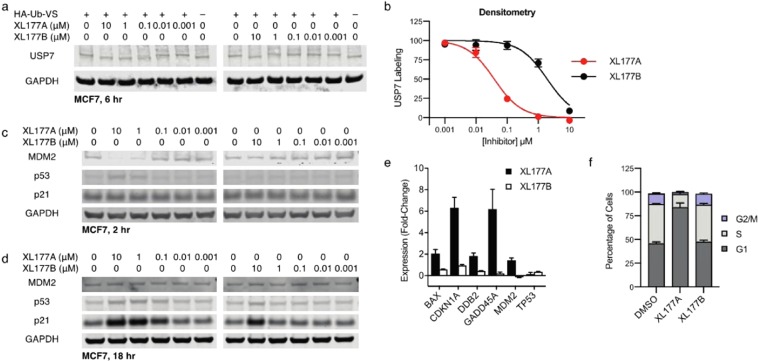
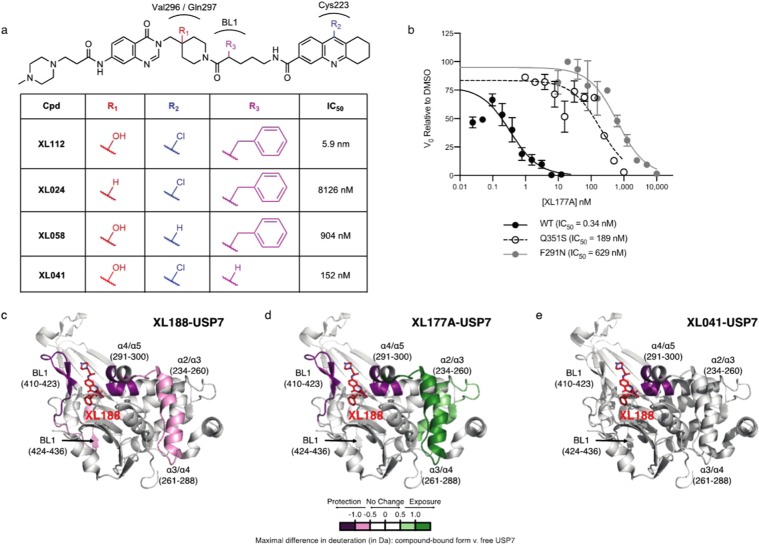
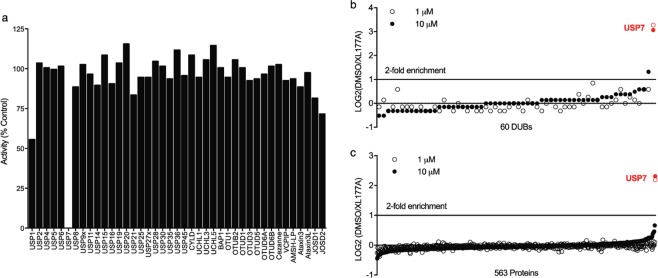
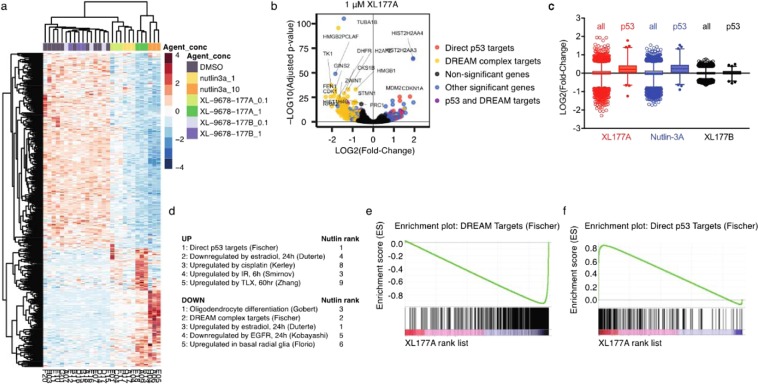
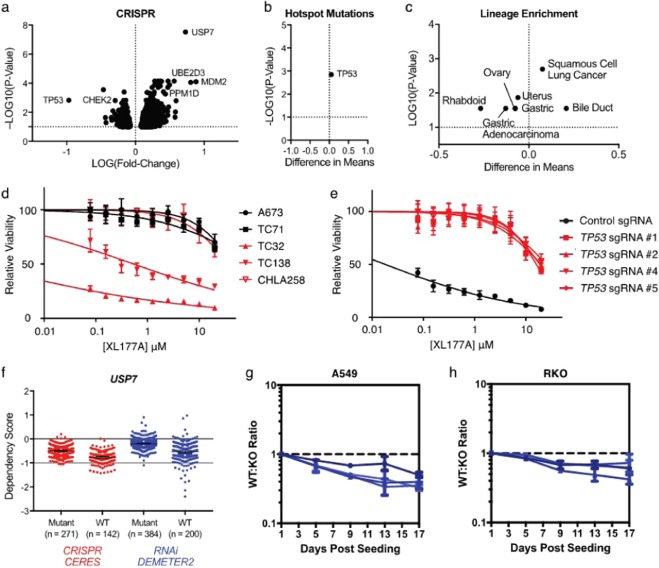
Ubiquitin specific peptidase 7 (USP7) is a deubiquitinating enzyme (DUB) that removes ubiquitin tags from specific protein substrates in order to alter their degradation rate and sub-cellular localization. USP7 has been proposed as a therapeutic target in several cancers because it has many reported substrates with a role in cancer progression, including FOXO4, MDM2, N-Myc, and PTEN. The multi-substrate nature of USP7, combined with the modest potency and selectivity of early generation USP7 inhibitors, has presented a challenge in defining predictors of response to USP7 and potential patient populations that would benefit most from USP7-targeted drugs. Here, we describe the structure-guided development of XL177A, which irreversibly inhibits USP7 with sub-nM potency and selectivity across the human proteome. Evaluation of the cellular effects of XL177A reveals that selective USP7 inhibition suppresses cancer cell growth predominantly through a p53-dependent mechanism: XL177A specifically upregulates p53 transcriptional targets transcriptome-wide, hotspot mutations in TP53 but not any other genes predict response to XL177A across a panel of ~500 cancer cell lines, and TP53 knockout rescues XL177A-mediated growth suppression of TP53 wild-type (WT) cells. Together, these findings suggest TP53 mutational status as a biomarker for response to USP7 inhibition. We find that Ewing sarcoma and malignant rhabdoid tumor (MRT), two pediatric cancers that are sensitive to other p53-dependent cytotoxic drugs, also display increased sensitivity to XL177A.
Overview
The claims and statistics of this paper haven’t been checked yet.
Run the check — free, no account needed. It reads the open-access text and checks the sources it cites.
Integrity signals
Registry
Cites
Statistics
Figures
Verification
Claims the paper makes
The claims and statistics of this paper haven’t been checked yet.
Run the check — free, no account needed. It reads the open-access text and checks the sources it cites.
Claims other papers make about this one
Each is checked against this paper’s own text: does it say what the citing paper says it does?
In the citing paper
“USP7 inhibitors predominantly kill cancer cells by inducing p53-dependent apoptosis (Schauer et al., 2020).”
From USP7 Is a Master Regulator of Genome Stability (2020) · cites this paper as Schauer et al., 2020
Self-check
Percentages, sums and reported differences re-computed from the paper’s own numbers.
The self-check needs the paper’s full text.
Citations
Cites
Moderated estimation of fold change and dispersion for RNA-seq data with DESeq2
Love, M. I., Huber, W., & Anders, S. (2014) · Genome Biology · doi:10.1186/s13059-014-0550-8 · Cited by 95,106
VMD: visual molecular dynamics
Humphrey, W., Dalke, A., & Schulten, K. (1996) · Journal of Molecular Graphics · doi:10.1016/0263-7855(96)00018-5 · Cited by 66,952
Subramanian, A., Tamayo, P., Mootha, V. K., Mukherjee, S., Ebert, B. L., Gillette, M. A., Paulovich, A., Pomeroy, S. L., Golub, T. R., Lander, E. S., et al. (2005) · Proceedings of the National Academy of Sciences · doi:10.1073/pnas.0506580102 · Cited by 53,625
limma powers differential expression analyses for RNA-sequencing and microarray studies
Ritchie, M. E., Phipson, B., Wu, D., Hu, Y., Law, C. W., Shi, W., & Smyth, G. K. (2015) · Nucleic Acids Research · doi:10.1093/nar/gkv007 · Cited by 40,458
Ror2 signaling regulates Golgi structure and transport through IFT20 for tumor invasiveness
Nishita, M., Park, S.-Y., Nishio, T., Kamizaki, K., Wang, Z., Tamada, K., Takumi, T., Hashimoto, R., Otani, H., Pazour, G. J., et al. (2017) · Scientific Reports · doi:10.1038/s41598-016-0028-x · Cited by 15,947
The Molecular Signatures Database Hallmark Gene Set Collection
Liberzon, A., Birger, C., Thorvaldsdóttir, H., Ghandi, M., Mesirov, J. P., & Tamayo, P. (2015) · Cell Systems · doi:10.1016/j.cels.2015.12.004 · Cited by 13,807
Molecular signatures database (MSigDB) 3.0
Liberzon, A., Subramanian, A., Pinchback, R., Thorvaldsdóttir, H., Tamayo, P., & Mesirov, J. P. (2011) · Bioinformatics · doi:10.1093/bioinformatics/btr260 · Cited by 7,111
Scalable Algorithms for Molecular Dynamics Simulations on Commodity Clusters
Bowers, K., Chow, E., Xu, H.-G., Dror, R., Eastwood, M., Gregersen, B. A., Klepeis, J., Kolossváry, I., Moraes, M. A., Sacerdoti, F. D., et al. (2006) · International Conference on Software Composition · doi:10.1145/1188455.1188544 · Cited by 3,905
Defining a Cancer Dependency Map
Tsherniak, A., Vazquez, F., Montgomery, P. G., Weir, B. A., Kryukov, G., Cowley, G. S., Gill, S., Harrington, W. F., Pantel, S., Krill-Burger, J. M., et al. (2017) · Cell · doi:10.1016/j.cell.2017.06.010 · Cited by 3,276
Self-citationOPLS3: A Force Field Providing Broad Coverage of Drug-like Small Molecules and Proteins
Harder, E. D., Damm, W., Maple, J. R., Wu, C., Reboul, M., Xiang, J. Y., Wang, L., Lupyan, D., Dahlgren, M. K., Knight, J. L., et al. (2015) · Journal of Chemical Theory and Computation · doi:10.1021/acs.jctc.5b00864 · Cited by 3,104
TP53 mutations in human cancers: origins, consequences, and clinical use.
Olivier, M., Hollstein, M., & Hainaut, P. (2010) · Cold Spring Harbor Perspectives in Biology · doi:10.1101/cshperspect.a001008 · Cited by 2,199
Ultrasensitive proteome analysis using paramagnetic bead technology
Hughes, C. S., Föehr, S., Garfield, D. A., Furlong, E. E. M., Steinmetz, L. M., & Krijgsveld, J. (2014) · Molecular Systems Biology · doi:10.15252/msb.20145625 · Cited by 1,226
Cost-effective, high-throughput DNA sequencing libraries for multiplexed target capturePreprint
Rohland, N., & Reich, D. (2012) · Genome Research · doi:10.1101/gr.128124.111 · Cited by 1,153
Shilatifard, A. (2006) · Annual Review of Biochemistry · doi:10.1146/annurev.biochem.75.103004.142422 · Cited by 1,145
Proteasome inhibitors in cancer therapy
Manasanch, E. E., & Orlowski, R. Z. (2017) · Nature Reviews Clinical Oncology · doi:10.1038/nrclinonc.2016.206 · Cited by 1,024
The Ubiquitin Proteasome System in Neurodegenerative Diseases
Ciechanover, A. J., & Brundin, P. (2003) · Neuron · doi:10.1016/s0896-6273(03)00606-8 · Cited by 1,000
Hydrogen exchange mass spectrometry for the analysis of protein dynamics
Wales, T. E., & Engen, J. R. (2005) · Mass Spectrometry Reviews · doi:10.1002/mas.20064 · Cited by 864
Self-citationThe evolution of thalidomide and its IMiD derivatives as anticancer agents
Bartlett, J. B., Dredge, K. S., & Dalgleish, A. G. (2004) · Nature reviews. Cancer · doi:10.1038/nrc1323 · Cited by 817
The ubiquitin-proteasome system
Nandi, D., Tahiliani, P., Kumar, A., & Chandu, D. (2006) · Journal of Biosciences · doi:10.1007/bf02705243 · Cited by 787
Chang, Y. S., Graves, B. J., Guerlavais, V., Tovar, C., Packman, K. E., To, K.-H., Olson, K. A., Kesavan, K. P., Gangurde, P., Mukherjee, A., et al. (2013) · Proceedings of the National Academy of Sciences · doi:10.1073/pnas.1303002110 · Cited by 681
A dynamic role of HAUSP in the p53-Mdm2 pathway
Li, M., Brooks, C. L., Kon, N., & Gu, W. (2004) · Molecular Cell · doi:10.1016/s1097-2765(04)00157-1 · Cited by 679
T-Cell Signaling Regulated by the Tec Family Kinase, ItkPreprint
Andreotti, A. H., Schwartzberg, P. L., Joseph, R. E., & Berg, L. J. (2010) · Cold Spring Harbor Perspectives in Biology · doi:10.1101/cshperspect.a002287 · Cited by 606
Regulation of DNA Damage Responses by Ubiquitin and SUMO
Jackson, S. P., & Durocher, D. (2013) · Molecular Cell · doi:10.1016/j.molcel.2013.01.017 · Cited by 601
Discovery of RG7388, a Potent and Selective p53–MDM2 Inhibitor in Clinical Development
Ding, Q., Zhang, Z., Liu, J.-J., Jiang, N., Zhang, J., Ross, T. M., Chu, X.-J., Bartkovitz, D., Podlaski, F., Janson, C., et al. (2013) · Journal of Medicinal Chemistry · doi:10.1021/jm400487c · Cited by 595
Chauhan, D., Tian, Z., Nicholson, B., Kumar, K. G. S., Zhou, B., Carrasco, R., McDermott, J. L., Leach, C. A., Fulcinniti, M., Kodrasov, M. P., et al. (2012) · Cancer Cell · doi:10.1016/j.ccr.2012.08.007 · Cited by 589
Self-citationMutational processes shape the landscape of TP53 mutations in human cancer
Giacomelli, A. O., Yang, X., Lintner, R. E., McFarland, J. M., Duby, M., Kim, J., Howard, T. P., Takeda, D. Y., Ly, S. H., Kim, E., et al. (2018) · Nature Genetics · doi:10.1038/s41588-018-0204-y · Cited by 556
Self-citationThe deubiquitinylation and localization of PTEN are regulated by a HAUSP-PML network
Song, M. S., Salmena, L., Carracedo, A., Egia, A., Lo-Coco, F., Teruya-Feldstein, J., & Pandolfi, P. P. (2008) · Nature · doi:10.1038/nature07290 · Cited by 548
Zhang, Z., & Marshall, A. G. (1998) · Journal of the American Society for Mass Spectrometry · doi:10.1016/s1044-0305(97)00284-5 · Cited by 511
Ubiquitin ligases in oncogenic transformation and cancer therapy
Senft, D., Qi, J., & Ronai, Z. A. (2017) · Nature reviews. Cancer · doi:10.1038/nrc.2017.105 · Cited by 499
Everett, R. D., Meredith, M., Orr, A., Cross, A., Kathoria, M., & Parkinson, J. (1997) · The EMBO Journal · doi:10.1093/emboj/16.7.1519 · Cited by 491
FOXO4 transcriptional activity is regulated by monoubiquitination and USP7/HAUSP
van der Horst, A., de Vries-Smits, A. M. M., Brenkman, A. B., van Triest, M. H., van den Broek, N. J. F., Colland, F., Maurice, M. M., & Burgering, B. M. T. (2006) · Nature Cell Biology · doi:10.1038/ncb1469 · Cited by 489
Molecular basis of USP7 inhibition by selective small-molecule inhibitors.
Turnbull, A. P., Ioannidis, S., Krajewski, W. W., Pinto-Fernandez, A., Heride, C., Martin, A. C. L., Tonkin, L. M., Townsend, E. C., Buker, S. M., Lancia, D. R., et al. (2017) · Nature · doi:10.1038/nature24451 · Cited by 463
Frye, S. V. (2010) · Nature Chemical Biology · doi:10.1038/nchembio.296 · Cited by 375
Yu, C., Mannan, A. M., Yvone, G. M., Ross, K. N., Zhang, Y.-L., Marton, M. A., Taylor, B. R., Crenshaw, A., Gould, J. Z., Tamayo, P., et al. (2016) · Nature Biotechnology · doi:10.1038/nbt.3460 · Cited by 362
Cho, V., Mei, Y., Sanny, A., Chan, S., Enders, A., Bertram, E. M., Tan, A. H., Goodnow, C. C., & Andrews, T. D. (2014) · Genome biology · doi:10.1186/gb-2014-15-1-r26 · Cited by 343
USP7 small-molecule inhibitors interfere with ubiquitin binding.
Kategaya, L., Di Lello, P., Rougé, L., Pastor, R., Clark, K. R., Drummond, J., Kleinheinz, T., Lin, E., Upton, J.-P., Prakash, S., et al. (2017) · Nature · doi:10.1038/nature24006 · Cited by 333
Probing the Probes: Fitness Factors For Small Molecule Tools
Workman, P., & Collins, I. (2010) · Chemistry & Biology · doi:10.1016/j.chembiol.2010.05.013 · Cited by 304
Ubiquitination, Ubiquitin-like Modifiers, and Deubiquitination in Viral Infection
Isaacson, M. K., & Ploegh, H. L. (2009) · Cell Host & Microbe · doi:10.1016/j.chom.2009.05.012 · Cited by 285
UV-sensitive syndrome protein UVSSA recruits USP7 to regulate transcription-coupled repair
Schwertman, P., Lagarou, A., Dekkers, D. H. W., Raams, A., van der Hoek, A. C., Laffeber, C., Hoeijmakers, J. H. J., Demmers, J. A. A., Fousteri, M., Vermeulen, W., et al. (2012) · Nature Genetics · doi:10.1038/ng.2230 · Cited by 279
Hussain, S., Zhang, Y., & Galardy, P. J. (2009) · Cell Cycle · doi:10.4161/cc.8.11.8739 · Cited by 261
A Noncommercial Dual Luciferase Enzyme Assay System for Reporter Gene Analysis
Dyer, B. W., Ferrer, F. A., Klinedinst, D. K., & Rodríguez, R. (2000) · Analytical Biochemistry · doi:10.1006/abio.2000.4605 · Cited by 238
Characterization of directed differentiation by high-throughput single-cell RNA-SeqPreprint
Soumillon, M., Cacchiarelli, D., Semrau, S., van Oudenaarden, A., & Mikkelsen, T. S. (2014) · bioRxiv (Cold Spring Harbor Laboratory) · doi:10.1101/003236 · Cited by 217
Felle, M., Joppien, S., Németh, A., Diermeier, S. D., Thalhammer, V., Dobner, T., Kremmer, E., Kappler, R., & Längst, G. (2011) · Nucleic Acids Research · doi:10.1093/nar/gkr528 · Cited by 208
HAUSP deubiquitinates and stabilizes N-Myc in neuroblastoma
Tavana, O., Li, D., Dai, C., López, G., Banerjee, D., Kon, N., Chen, C., Califano, A., Yamashiro, D. J., Sun, H., et al. (2016) · Nature Medicine · doi:10.1038/nm.4180 · Cited by 202
Structure-guided development of a potent and selective non-covalent active-site inhibitor of USP7.
Lamberto, I., Liu, X., Seo, H.-S., Schauer, N. J., Iacob, R. E., Hu, W., Das, D., Mikhailova, T., Weisberg, E. L., Engen, J. R., et al. (2017) · Cell Chemical Biology · doi:10.1016/j.chembiol.2017.09.003 · Cited by 192
Self-citationTargeted inhibition of the COP9 signalosome for treatment of cancer
Schlierf, A., Altmann, E., Quancard, J., Jefferson, A. B., Assenberg, R., Renatus, M., Jones, M. D., Hassiepen, U., Schaefer, M., Kiffe, M., et al. (2016) · Nature Communications · doi:10.1038/ncomms13166 · Cited by 188
Semrau, S., Goldmann, J. E., Soumillon, M., Mikkelsen, T. S., Jaenisch, R., & van Oudenaarden, A. (2017) · Nature Communications · doi:10.1038/s41467-017-01076-4 · Cited by 182
Ubiquitin‐specific proteases 7 and 11 modulate Polycomb regulation of the INK4a tumour suppressor
Maertens, G. N., Messaoudi, S. E., Elderkin, S., Hiom, K. J., & Peters, G. G. (2010) · The EMBO Journal · doi:10.1038/emboj.2010.129 · Cited by 161
Campos, M. D., Nogales, A., Cardoso, H. G., Kumar, S. R., Nobre, T., Sathishkumar, R., & Arnholdt-Schmitt, B. (2016) · Frontiers in Genetics · doi:10.3389/fgene.2016.00001 · Cited by 152
Cai, J., Shi, G., Dong, Z., Ke, A., Ma, H., Gao, Q., Shen, Z., Huang, X., Chen, H., Yu, D., et al. (2014) · Hepatology · doi:10.1002/hep.27682 · Cited by 125
EPOP Interacts with Elongin BC and USP7 to Modulate the Chromatin Landscape
Liefke, R., Karwacki-Neisius, V., & Shi, Y. (2016) · Molecular Cell · doi:10.1016/j.molcel.2016.10.019 · Cited by 115
USP7 counteracts SCFβTrCP- but not APCCdh1-mediated proteolysis of Claspin
Faustrup, H., Bekker-Jensen, S., Bartek, J., Lukas, J., & Mailand, N. (2009) · The Journal of Cell Biology · doi:10.1083/jcb.200807137 · Cited by 113
RapMap: a rapid, sensitive and accurate tool for mapping RNA-seq reads to transcriptomes
Srivastava, A., Sarkar, H., Gupta, N., & Patro, R. (2016) · Bioinformatics · doi:10.1093/bioinformatics/btw277 · Cited by 112
Ficarro, S. B., Zhang, Y., Lu, Y., Moghimi, A. R., Askenazi, M., Hyatt, E., Smith, E. D., Boyer, L. F., Schlaeger, T. M., Luckey, C. J., et al. (2009) · Analytical Chemistry · doi:10.1021/ac802720e · Cited by 108
Self-citationUSP7: Target Validation and Drug Discovery for Cancer Therapy
Zhou, J., Wang, J., Chen, C., Yuan, H., Wen, X., & Sun, H. (2018) · Medicinal Chemistry · doi:10.2174/1573406413666171020115539 · Cited by 100
USP7 Cooperates with NOTCH1 to Drive the Oncogenic Transcriptional Program in T-Cell Leukemia
Jin, Q., Martinez, C. A., Arcipowski, K. M., Zhu, Y., Gutierrez-Diaz, B. T., Wang, K. K., Johnson, M. R., Volk, A. G., Wang, F., Wu, J., et al. (2018) · Clinical Cancer Research · doi:10.1158/1078-0432.ccr-18-1740 · Cited by 98
Noncanonical regulation of alkylation damage resistance by the OTUD4 deubiquitinase
Zhao, Y. J., Majid, M. C., Soll, J. M., Brickner, J. R., Dango, S., & Mosammaparast, N. (2015) · The EMBO Journal · doi:10.15252/embj.201490497 · Cited by 97
Regulation of USP7: A High Incidence of E3 Complexes
Kim, R. Q., & Sixma, T. K. (2017) · Journal of Molecular Biology · doi:10.1016/j.jmb.2017.05.028 · Cited by 97
Molecular Mechanisms of Ubiquitin-Dependent Membrane Traffic
Hurley, J. H., & Stenmark, H. (2011) · Annual Review of Biophysics · doi:10.1146/annurev-biophys-042910-155404 · Cited by 93
Deubiquitination of Tip60 by USP7 determines the activity of the p53-dependent apoptotic pathway.
Dar, A., Shibata, E., & Dutta, A. (2013) · Molecular and Cellular Biology · doi:10.1128/mcb.00358-13 · Cited by 83
USP7 is essential for maintaining Rad18 stability and DNA damage tolerance.
Zlatanou, A., Sabbioneda, S., Miller, E. S., Greenwalt, A., Aggathanggelou, A., Maurice, M. M., Lehmann, A. R., Stankovic, T., Reverdy, C., Colland, F., et al. (2016) · Oncogene · doi:10.1038/onc.2015.149 · Cited by 77
Mutation analysis of p53 gene in childhood malignant solid tumors
Kusafuka, T., Fukuzawa, M., Oue, T., Komoto, Y., Yoneda, A., & Okada, A. (1997) · Journal of Pediatric Surgery · doi:10.1016/s0022-3468(97)90677-1 · Cited by 77
Pinto-Fernández, A., & Kessler, B. M. (2016) · Frontiers in Genetics · doi:10.3389/fgene.2016.00133 · Cited by 73
USP7 is a suppressor of PCNA ubiquitination and oxidative-stress-induced mutagenesis in human cells.
Kashiwaba, S.-I., Kanao, R., Masuda, Y., Kusumoto-Matsuo, R., Hanaoka, F., & Masutani, C. (2015) · Cell Reports · doi:10.1016/j.celrep.2015.11.014 · Cited by 71
Genome-scale CRISPR-Cas9 screen identifies druggable dependencies in TP53 wild-type Ewing sarcoma
Stolte, B., Iniguez, A. B., Dharia, N. V., Robichaud, A. L., Conway, A. S., Morgan, A. M., Alexe, G., Schauer, N. J., Liu, X., Bird, G. H., et al. (2018) · The Journal of Experimental Medicine · doi:10.1084/jem.20171066 · Cited by 69
Self-citationmzAPI: a new strategy for efficiently sharing mass spectrometry data
Askenazi, M., Parikh, J. R., & Marto, J. A. (2009) · Nature Methods · doi:10.1038/nmeth0409-240 · Cited by 62
Self-citationHou, H., Liao, Y., Hsiao, S., Shyue, S., & Lee, T. (2017) · Scientific Reports · doi:10.1038/srep46877 · Cited by 52
Alexander, W. M., Ficarro, S. B., Adelmant, G., & Marto, J. A. (2017) · PROTEOMICS · doi:10.1002/pmic.201700091 · Cited by 45
Self-citationLee, G., Oh, T.-I., Um, K. B., Yoon, H., Son, J., Kim, B. M., Kim, H.-I., Kim, H., Kim, Y. J., Lee, C., et al. (2016) · Biochemical and Biophysical Research Communications · doi:10.1016/j.bbrc.2016.01.021 · Cited by 40
Targeting ubiquitin specific protease 7 in cancer: A deubiquitinase with great prospects
Khusbu, F. Y., Chen, F., & Chen, H. (2018) · Cell Biochemistry and Function · doi:10.1002/cbf.3336 · Cited by 36
Liao, C., Zhao, X., Brewer, M., May, V., & Li, J. (2017) · Scientific Reports · doi:10.1038/s41598-017-05815-x · Cited by 28
Self-citationmzStudio: A Dynamic Digital Canvas for User-Driven Interrogation of Mass Spectrometry Data
Ficarro, S. B., Alexander, W., & Marto, J. A. (2017) · Proteomes · doi:10.3390/proteomes5030020 · Cited by 25
Self-citationPAC1 Receptors: Shapeshifters in Motion
Liao, C., May, V., & Li, J. (2018) · Journal of Molecular Neuroscience · doi:10.1007/s12031-018-1132-0 · Cited by 24
Self-citationThe complete peptide dictionary – A meta‐proteomics resource
Askenazi, M., Marto, J. A., & Linial, M. (2010) · PROTEOMICS · doi:10.1002/pmic.201000270 · Cited by 21
Self-citationLawson, A. P., Bak, D. W., Shannon, D. A., Long, M. J. C., Vijaykumar, T., Yu, R., Oualid, F. E., Weerapana, E., & Hedstrom, L. (2017) · Oncotarget · doi:10.18632/oncotarget.17261 · Cited by 19
Liao, C., Zhao, X., Liu, J., Schneebeli, S. T., Shelley, J. C., & Li, J. (2017) · Physical Chemistry Chemical Physics · doi:10.1039/c7cp00200a · Cited by 17
Self-citationSelective Covalent Protein Modification by 4‐Halopyridines through Catalysis
Schardon, C. L., Tuley, A., Er, J. A. V., Swartzel, J. C., & Fast, W. L. (2017) · ChemBioChem · doi:10.1002/cbic.201700104 · Cited by 15
Research works printed but not linked: 1
- Rohland, N. & Reich, D. Cost-effective, high-throughput DNA sequencing. Genome Res. 939–946, https://doi.org/10.1101/gr.128124.111.22 (2011). · DOI
Cited by
Sorted by citations
Therapeutic targeting of “undruggable” MYC
Llombart, V., & Mansour, M. R. (2021) · EBioMedicine · doi:10.1016/j.ebiom.2021.103756 · Cited by 499
The emerging role of mass spectrometry-based proteomics in drug discovery
Meissner, F., Geddes‐McAlister, J., Mann, M., & Bantscheff, M. (2022) · Nature Reviews Drug Discovery · doi:10.1038/s41573-022-00409-3 · Cited by 364
Targeted protein degradation for cancer therapy
Hinterndorfer, M., Spiteri, V. A., Ciulli, A., & Winter, G. E. (2025) · Nature reviews. Cancer · doi:10.1038/s41568-025-00817-8 · Cited by 245
Advances in Deubiquitinating Enzyme Inhibition and Applications in Cancer Therapeutics
Antao, A. M., Tyagi, A., Kim, K.-S., & Ramakrishna, S. (2020) · Cancers · doi:10.3390/cancers12061579 · Cited by 153
USP7 Is a Master Regulator of Genome Stability
Valles, G. J., Bezsonova, I., Woodgate, R., & Ashton, N. W. (2020) · Frontiers in Cell and Developmental Biology · doi:10.3389/fcell.2020.00717 · Cited by 114
“USP7 inhibitors predominantly kill cancer cells by inducing p53-dependent apoptosis (Schauer et al., 2020).”
Background
Metadata
- Authors
- Schauer, N. J., Liu, X., Magin, R. S., Doherty, L. M., Chan, W. C., Ficarro, S. B., Hu, W., Roberts, R. M., Iacob, R. E., Stolte, B., Giacomelli, A. O., Perera, S., McKay, K., Boswell, S. A., Weisberg, E. L., Ray, A., Chauhan, D., Dhe-Paganon, S., Anderson, K. C., Griffin, J. D., Li, J., Hahn, W. C., Sorger, P. K., Engen, J. R., Stegmaier, K., Marto, J. A., & Buhrlage, S. J.
- Affiliations
- Harvard University (US)
- Brigham and Women's Hospital (US)
- Dana-Farber Cancer Institute (US)
- Northeastern University (US)
- Broad Institute (US)
- University of Vermont (US)
- Corresponding author
- Buhrlage, Sara J.
- ORCID
- Schauer, Nathan J.
- Liu, Xiaoxi
- Magin, Robert S.
- Doherty, Laura M.
- Chan, Wai Cheung
- Ficarro, Scott B.
- Hu, Wanyi
- Iacob, Roxana E.
- Giacomelli, Andrew O.
- Boswell, Sarah A.
- Weisberg, Ellen L.
- Ray, Arghya
- Chauhan, Dharminder
- Griffin, James D.
- Li, Jianing
- Hahn, William C.
- Sorger, Peter K.
- Engen, John R.
- Stegmaier, Kimberly
- Marto, Jarrod A.
- Buhrlage, Sara J.
- Venue
- Scientific Reports
- Published
- 2020-03-24
- Volume
- 10
- Issue
- 1
- Pages
- 5324-5324
- ISSN
- 2045-2322 (ISSN-L)
- PMC
- PMC7093416
- OpenAlex
- W3013382443
- Cited by
- 125
- References
- 77
- Citations by year
- 2026: 18 · 2025: 26 · 2024: 18 · 2023: 15 · 2022: 22 · 2021: 21 · 2020: 5
- FWCI
- 5.19
- Type
- journal article
- Language
- en
- Open access
- gold
- doi.org
- Locations
- Scientific Reports (publishedVersion, cc-by)
- PubMed Central (publishedVersion, cc-by)
- PubMed (publishedVersion)
- Open access LMU (Ludwid Maxmilian's Universitat Munchen) (submittedVersion, cc-by)
- Funders
- U.S. Department of Health & Human Services | National Institutes of Health
- St. Baldrick's Foundation
- Topics
- Life Sciences › Biochemistry, Genetics and Molecular Biology › Molecular Biology › Ubiquitin and proteasome pathways
- Health Sciences › Medicine › Oncology › Cancer-related Molecular Pathways
- Life Sciences › Biochemistry, Genetics and Molecular Biology › Molecular Biology › Protein Degradation and Inhibitors
- Keywords
- USP7, p53, TP53 mutation, predictive biomarkers, structure-based drug design, tumor cell growth inhibition, Ewing sarcoma, malignant rhabdoid tumor, childhood cancer, MDM2, FOXO4, PTEN, MYCN
- MeSH terms
- Ubiquitin-Specific Peptidase 7, Antineoplastic Agents, Humans, Protease Inhibitors, Tumor Suppressor Protein p53, Apoptosis, Cell Line, Tumor, Cell Proliferation, Ubiquitination, MCF-7 Cells
About these checks
Registry, retraction, Cites and statistics results are computed, not judged, with one exception: a printed reference that no index lists is read once by a model before it counts as a citation error. Claims are extracted by a model and kept only when their quote appears verbatim in the text; each cited source is then checked, with a model’s help, for whether it says what the claim relies on. Those verdicts can be wrong — read the claim’s quote and the cited source before relying on one.
Statistics and arithmetic are recomputed, not judged.
Confidence bands are shown only for fields calibrated on our annotated test set. None is calibrated yet, so no band is shown.
What counts as a claim ›How we measure confidence ›How we check this ›
Are you an author, or do you see a problem with this page? Request a review
