

The DOI matches its Crossref record; 40 of the 41 references it cites were found in a registry or an index.
Differentiation and Death of Premyelinating Oligodendrocytes in Developing Rodent Brain
Open accessAbstract
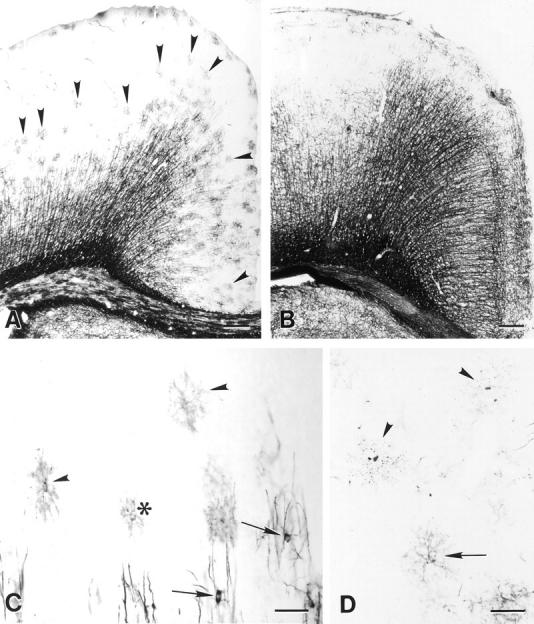
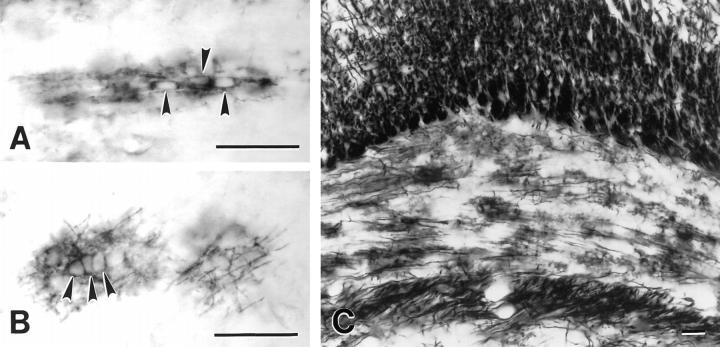
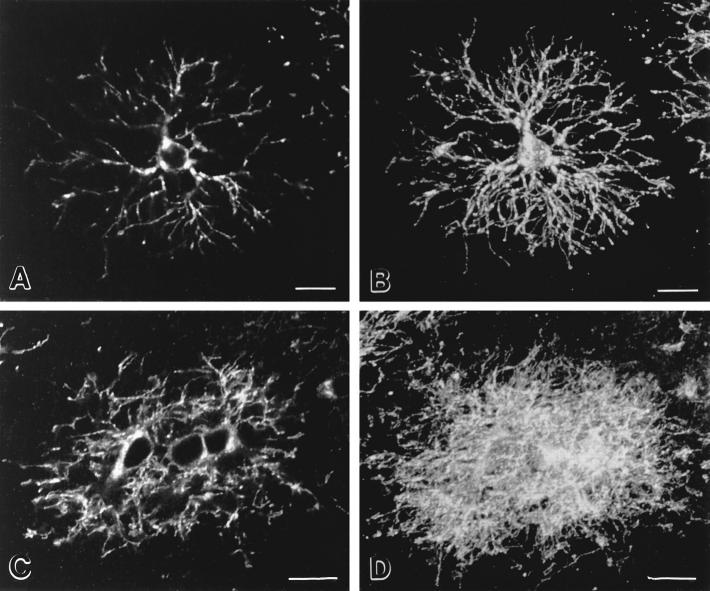
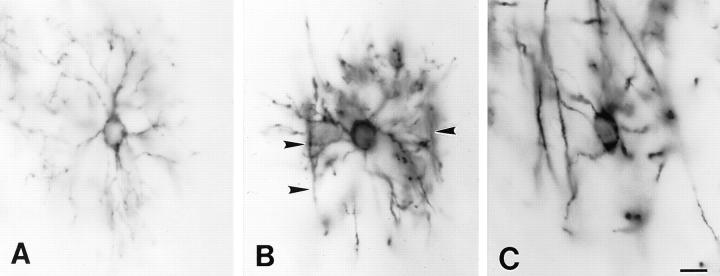
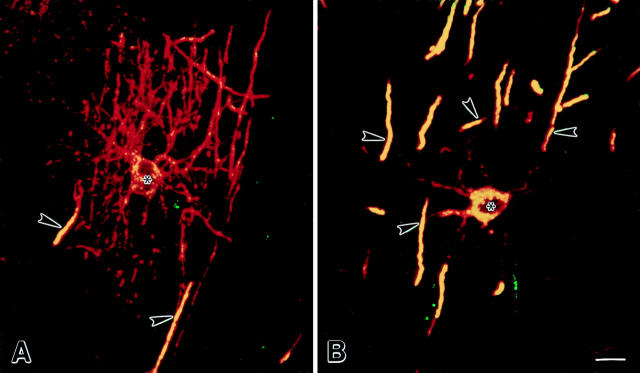
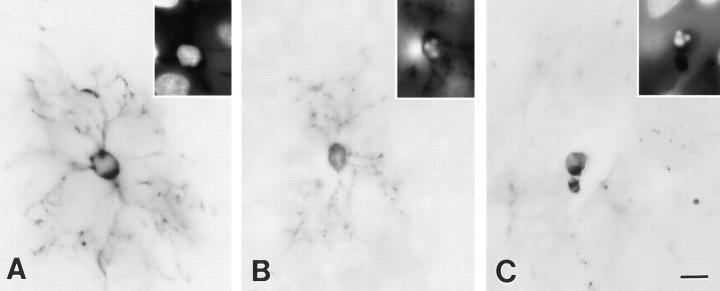
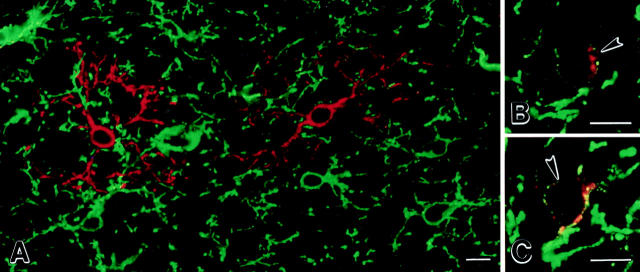
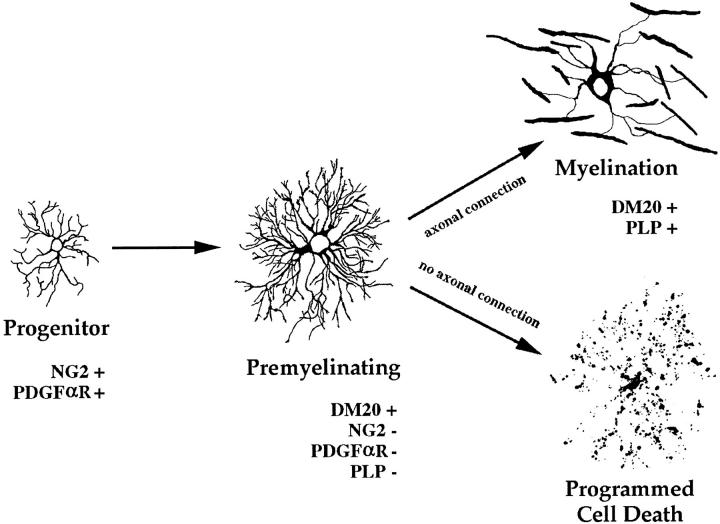
Previous studies have indicated that newly formed oligodendrocytes are dynamic cells whose production, survival, and differentiation depend upon axonal influences. This study has characterized the appearance and fate of newly formed oligodendrocytes in developing rat brain. Oligodendrocytes appear in predictable locations and radially extend DM-20-positive processes that cover 80-microm domains in the cortex and 40-microm domains in the corpus callosum. These premyelinating oligodendrocytes have one of two fates: they myelinate axons or degenerate. Between 7 and 21 d after birth, approximately 20% of premyelinating oligodendrocytes identified in the cerebral cortex were degenerating. Oligodendrocytes that ensheathed axons expressed and selectively targeted proteolipid protein to compact myelin and did not degenerate. These observations support the hypothesis that axonal influences affect oligodendrocyte survival, differentiation, and expression of proteolipid protein gene products.
Overview
The claims and statistics of this paper haven’t been checked yet.
Run the check — free, no account needed. It reads the open-access text and checks the sources it cites.
Integrity signals
Registry
Cites
Statistics
Figures
Verification
Claims the paper makes
The claims and statistics of this paper haven’t been checked yet.
Run the check — free, no account needed. It reads the open-access text and checks the sources it cites.
Claims other papers make about this one
Each is checked against this paper’s own text: does it say what the citing paper says it does?
The source backs part of the claim, not all of it — or backs it for a different population, condition or comparison.
In the citing paper
“In the developing neocortex, ∼20% of premyelinating OLs die between P7 and P11 (Trapp et al., 1997).”
From Oligodendrocyte Dynamics in the Healthy Adult CNS: Evidence for Myelin Remodeling (2013) · cites this paper as Trapp et al., 1997
Experimental — accuracy not yet measuredIn the citing paper
“The timing of their appearance coincides with the onset of myelination, during which large numbers of newly formed oligodendrocytes die (Barres et al., 1992; Trapp et al., 1997).”
From Developmental Heterogeneity of Microglia and Brain Myeloid Cells Revealed by Deep Single-Cell RNA Sequencing (2019) · cites this paper as Trapp et al., 1997
Self-check
Percentages, sums and reported differences re-computed from the paper’s own numbers.
The self-check needs the paper’s full text.
Citations
Cites
RAFF, M. C., Miller, R. H., & Noble, M. (1983) · Nature · doi:10.1038/303390a0 · Cited by 2,030
Programmed Cell Death and the Control of Cell Survival: Lessons from the Nervous System
RAFF, M. C., Barres, B. A., Burne, J. F., Coles, H., Ishizaki, Y., & Jacobson, M. D. (1993) · Science · doi:10.1126/science.8235590 · Cited by 1,450
Cell death and control of cell survival in the oligodendrocyte lineage
Barres, B. A., Hart, I. K., Coles, H. S. R., Burne, J. F., Voyvodic, J. T., Richardson, W. D., & Raff, M. C. (1992) · Cell · doi:10.1016/0092-8674(92)90531-g · Cited by 1,345
A role for platelet-derived growth factor in normal gliogenesis in the central nervous system
Richardson, W. D., Pringle, N. P., Mosley, M. J., Westermark, B., & Dubois-Dalcg, M. (1988) · Cell · doi:10.1016/0092-8674(88)90392-3 · Cited by 774
The oligodendrocyte and its many cellular processes
PFEIFFER, S., WARRINGTON, A., & BANSAL, R. (1993) · Trends in Cell Biology · doi:10.1016/0962-8924(93)90213-k · Cited by 737
Levison, S. W., & Goldman, J. E. (1993) · Neuron · doi:10.1016/0896-6273(93)90311-e · Cited by 725
Proliferation of oligodendrocyte precursor cells depends on electrical activity in axons
Barres, B. A., & Raff, M. C. (1993) · Nature · doi:10.1038/361258a0 · Cited by 673
Pringle, N. P., & Richardson, W. D. (1993) · Development · doi:10.1242/dev.117.2.525 · Cited by 510
Pringle, N. P., Mudhar, H. S., Collarini, E. J., & Richardson, W. D. (1992) · Development · doi:10.1242/dev.115.2.535 · Cited by 443
Polarity of Epithelial and Neuronal Cells
Rodriguez-Boulan, E. J., & Powell, S. K. (1992) · Annual Review of Cell Biology · doi:10.1146/annurev.cb.08.110192.002143 · Cited by 430
Research works printed but not linked: 1
- Nishiyama, 1996, Interaction between NG2 proteoglycan and PDGF α receptor on 02A progenitor cells is required for optimal response to PDGF, J Neurosci Res, 43, 315, 10.1002/(SICI)1097-4547(19960201)43:3<315::AID-JNR6>3.0.CO;2-M · DOI
Cited by
Sorted by citations
Axonal transection in the lesions of multiple sclerosis
Trapp, B. D., Peterson, J., Ransohoff, R. M., Rudick, R., Mörk, S., & Bö, L. (1998) · New England Journal of Medicine · doi:10.1056/nejm199801293380502 · Cited by 4,029
Self-citationBiology of Oligodendrocyte and Myelin in the Mammalian Central Nervous System
Baumann, N., & Pham-Dinh, D. (2001) · Physiological Reviews · doi:10.1152/physrev.2001.81.2.871 · Cited by 1,828
Li, Q., Cheng, Z., Zhou, L., Darmanis, S., Neff, N. F., Okamoto, J., Gulati, G., Bennett, M. L., Sun, L. O., Clarke, L. E., et al. (2019) · Neuron · doi:10.1016/j.neuron.2018.12.006 · Cited by 1,129
Premyelinating Oligodendrocytes in Chronic Lesions of Multiple Sclerosis
Chang, A., Tourtellotte, W. W., Rudick, R., & Trapp, B. D. (2002) · New England Journal of Medicine · doi:10.1056/nejmoa010994 · Cited by 991
Self-citationOligodendrocyte Dynamics in the Healthy Adult CNS: Evidence for Myelin Remodeling
Young, K. M., Psachoulia, K., Tripathi, R. B., Dunn, S.-J., Cossell, L., Attwell, D., Tohyama, K., & Richardson, W. D. (2013) · Neuron · doi:10.1016/j.neuron.2013.01.006 · Cited by 919
“Therefore, if the main function of adult-born OLs is to myelinate previously unmyelinated axons, then we should not expect much OL genesis in the optic nerve after P112 because there should be almost no naked axons available to myelinate.”
BackgroundOligodendrocytes: Myelination and Axonal SupportPreprint
Simons, M., & Nave, K. (2015) · Cold Spring Harbor Perspectives in Biology · doi:10.1101/cshperspect.a020479 · Cited by 929
Hughes, E. G., Kang, S. H., Fukaya, M., & Bergles, D. E. (2013) · Nature Neuroscience · doi:10.1038/nn.3390 · Cited by 808
NG2-Positive Oligodendrocyte Progenitor Cells in Adult Human Brain and Multiple Sclerosis Lesions
Chang, A., Nishiyama, A., Peterson, J. W., Prineas, J. W., & Trapp, B. D. (2000) · Journal of Neuroscience · doi:10.1523/jneurosci.20-17-06404.2000 · Cited by 711
Self-citationLehnardt, S., Lachance, C., Patrizi, S., Lefebvre, S., Follett, P. L., Jensen, F. E., Rosenberg, P. A., Volpe, J. J., & Vartanian, T. K. (2002) · Journal of Neuroscience · doi:10.1523/jneurosci.22-07-02478.2002 · Cited by 684
NG2 cells generate both oligodendrocytes and gray matter astrocytes
Zhu, X., Bergles, D. E., & Nishiyama, A. (2007) · Development · doi:10.1242/dev.004895 · Cited by 699
Self-citationThe oligodendrocyte precursor cell in health and disease
Levine, J. M., Reynolds, R., & Fawcett, J. W. (2001) · Trends in Neurosciences · doi:10.1016/s0166-2236(00)01691-x · Cited by 673
Regenerating CNS myelin — from mechanisms to experimental medicines
Franklin, R. J. M., & ffrench-Constant, C. (2017) · Nature Reviews Neuroscience · doi:10.1038/nrn.2017.136 · Cited by 647
Oligodendrocytes in development, myelin generation and beyond
Kuhn, S., Gritti, L., Crooks, D., & Dombrowski, Y. (2019) · Cells · doi:10.3390/cells8111424 · Cited by 625
Myelin remodeling through experience-dependent oligodendrogenesis in the adult somatosensory cortex
Hughes, E. G., Orthmann-Murphy, J. L., Langseth, A. J., & Bergles, D. E. (2018) · Nature Neuroscience · doi:10.1038/s41593-018-0121-5 · Cited by 540
Myelin gene regulatory factor is a critical transcriptional regulator required for CNS myelination
Emery, B., Agalliu, D., Cahoy, J. D., Watkins, T. A., Dugas, J. C., Mulinyawe, S. B., Ibrahim, A., Ligon, K. L., Rowitch, D. H., & Barres, B. A. (2009) · Cell · doi:10.1016/j.cell.2009.04.031 · Cited by 559
Rapid production of new oligodendrocytes is required in the earliest stages of motor-skill learning
Xiao, L., Ohayon, D., McKenzie, I. A., Sinclair-Wilson, A., Wright, J. L., Fudge, A. D., Emery, B., Li, H., & Richardson, W. D. (2016) · Nature Neuroscience · doi:10.1038/nn.4351 · Cited by 507
Oligodendrocyte Population Dynamics and the Role of PDGF In Vivo
Calver, A. R., Hall, A. C., Yu, W., Walsh, F. S., Heath, J. K., Betsholtz, C., & Richardson, W. D. (1998) · Neuron · doi:10.1016/s0896-6273(00)80469-9 · Cited by 516
Vesicular glutamate release from axons in white matter
Kukley, M., Capetillo‐Zarate, E., & Dietrich, D. (2007) · Nature Neuroscience · doi:10.1038/nn1850 · Cited by 472
Praet, J., Guglielmetti, C., Berneman, Z., Van der Linden, A., & Ponsaerts, P. (2014) · Neuroscience & Biobehavioral Reviews · doi:10.1016/j.neubiorev.2014.10.004 · Cited by 435
Regulation of oligodendrocyte development in the vertebrate CNS
Miller, R. H. (2002) · Progress in Neurobiology · doi:10.1016/s0301-0082(02)00058-8 · Cited by 426
van der Knaap, M. S., & Bugiani, M. (2017) · Acta Neuropathologica · doi:10.1007/s00401-017-1739-1 · Cited by 403
Mallon, B. S., Shick, H. E., Kidd, G. J., & Macklin, W. B. (2002) · Journal of Neuroscience · doi:10.1523/jneurosci.22-03-00876.2002 · Cited by 382
Self-citationConstitutively active Akt induces enhanced myelination in the CNS
Flores, A. I., Narayanan, S. P., Morse, E. N., Shick, H. E., Yin, X., Kidd, G., Avila, R. L., Kirschner, D. A., & Macklin, W. B. (2008) · The Journal of Neuroscience · doi:10.1523/jneurosci.0150-08.2008 · Cited by 361
Self-citationAxonal Control of Oligodendrocyte Development
Barres, B. A., & Raff, M. C. (1999) · The Journal of Cell Biology · doi:10.1083/jcb.147.6.1123 · Cited by 360
Akt Signals through the Mammalian Target of Rapamycin Pathway to Regulate CNS Myelination
Narayanan, S. P., Flores, A. I., Wang, F., & Macklin, W. B. (2009) · Journal of Neuroscience · doi:10.1523/jneurosci.0232-09.2009 · Cited by 328
Self-citationNeuronal activity regulates remyelination via glutamate signalling to oligodendrocyte progenitors
Gautier, H. O. B., Evans, K. A., Volbracht, K., James, R., Sitnikov, S., Lundgaard, I., James, F., Lao‐Peregrín, C., Reynolds, R., Franklin, R. J. M., et al. (2015) · Nature Communications · doi:10.1038/ncomms9518 · Cited by 316
Phagocytosis in the Brain: Homeostasis and Disease
Galloway, D. A., Phillips, A. E. M., Owen, D. R., & Moore, C. S. (2019) · Frontiers in Immunology · doi:10.3389/fimmu.2019.00790 · Cited by 319
The NG2 proteoglycan: Past insights and future prospects
Stallcup, W. B. (2002) · Journal of Neurocytology · doi:10.1023/a:1025731428581 · Cited by 296
Differentiation of proliferated NG2-positive glial progenitor cells in a remyelinating lesion
Watanabe, M., Toyama, Y., & Nishiyama, A. (2002) · Journal of Neuroscience Research · doi:10.1002/jnr.10338 · Cited by 261
Self-citationReticulon family members modulate BACE1 activity and amyloid-β peptide generation
He, W., Lu, Y., Qahwash, I. M., Hu, X., Chang, A., & Yan, R. (2004) · Nature Medicine · doi:10.1038/nm1088 · Cited by 257
Inhibition of Myelin Membrane Sheath Formation by Oligodendrocyte-derived Exosome-like Vesicles
Bakhti, M., Winter, C., & Simons, M. (2010) · Journal of Biological Chemistry · doi:10.1074/jbc.m110.190009 · Cited by 265
Mechanisms regulating the development of oligodendrocytes and central nervous system myelin
Mitew, S., Hay, C. M., Peckham, H., Xiao, J., Koenning, M., & Emery, B. (2013) · Neuroscience · doi:10.1016/j.neuroscience.2013.11.029 · Cited by 268
Sbardella, D., Fasciglione, G. F., Gioia, M., Ciaccio, C., Tundo, G. R., Marini, S., & Coletta, M. (2011) · Molecular Aspects of Medicine · doi:10.1016/j.mam.2011.10.015 · Cited by 251
Fard, M. K., van der Meer, F., Sánchez, P., Cantuti-Castelvetri, L., Mandad, S., Jäkel, S., Fornasiero, E. F., Schmitt, S., Ehrlich, M., Starost, L., et al. (2017) · Science Translational Medicine · doi:10.1126/scitranslmed.aam7816 · Cited by 249
“Oligodendrocytes that radially extend processes are reminiscent of previously described premyelinating oligodendrocytes at an early stage of the oligodendrocyte differentiation (24, 25).”
BackgroundBuschbeck, E. K., & Hoy, R. R. (1998) · Journal of Neurobiology · doi:10.1002/(sici)1097-4695(19981115)37:3 · Cited by 29
Simpson, J. E., Fernando, M. S., Clark, L., Ince, P. G., Matthews, F., Forster, G., O'Brien, J. T., Barber, R., Kalaria, R. N., Brayne, C., et al. (2007) · Neuropathology and Applied Neurobiology · doi:10.1111/j.1365-2990.2007.00828.x · Cited by 215
Neuron-glia communication in the control of oligodendrocyte function and myelin biogenesis
Simons, M., & Trajković, K. (2006) · Journal of Cell Science · doi:10.1242/jcs.03242 · Cited by 233
Cortical remyelination: A new target for repair therapies in multiple sclerosis
Chang, A., Staugaitis, S. M., Dutta, R., Batt, C. E., Easley, K. E., Chomyk, A. M., Yong, V. W., Fox, R. J., Kidd, G. J., & Trapp, B. D. (2012) · Annals of Neurology · doi:10.1002/ana.23693 · Cited by 216
Self-citationSpaas, J., van Veggel, L., Schepers, M., Tiane, A., van Horssen, J., Wilson, D. M., Moya, P. R., Piccart, E., Hellings, N., Eijnde, B. O., et al. (2021) · Cellular and Molecular Life Sciences · doi:10.1007/s00018-021-03802-0 · Cited by 224
Notch1 control of oligodendrocyte differentiation in the spinal cord
Genoud, S., Lappe-Siefke, C., Goebbels, S., Radtke, F., Aguet, M., Scherer, S. S., Suter, U., Nave, K.-A., & Mantei, N. (2002) · The Journal of Cell Biology · doi:10.1083/jcb.200202002 · Cited by 211
Identity, distribution, and development of polydendrocytes: NG2-expressing glial cells
Nishiyama, A., Watanabe, M., Yang, Z., & Bu, J. (2002) · Journal of Neurocytology · doi:10.1023/a:1025783412651 · Cited by 219
Self-citationReconstruction of neocortex: Organelles, compartments, cells, circuits, and activity
Turner, N. L., Macrina, T., Bae, J. A., Yang, R., Wilson, A. M., Schneider-Mizell, C., Lee, K., Lu, R., Wu, J., Bodor, A. L., et al. (2022) · Cell · doi:10.1016/j.cell.2022.01.023 · Cited by 206
Programmed cell death in the developing human telencephalon
Rakić, S., & Zečević, N. (2000) · European Journal of Neuroscience · doi:10.1046/j.1460-9568.2000.00153.x · Cited by 209
Back, S. A., Luo, N. L., Borenstein, N. S., Volpe, J. J., & Kinney, H. C. (2002) · Journal of Neuropathology & Experimental Neurology · doi:10.1093/jnen/61.2.197 · Cited by 196
Nemes-Baran, A. D., White, D. R., & DeSilva, T. M. (2020) · Cell Reports · doi:10.1016/j.celrep.2020.108047 · Cited by 196
Shoshan, Y., Nishiyama, A., Chang, A., Mørk, S. J., Barnett, G. H., Cowell, J. K., Trapp, B. D., & Staugaitis, S. M. (1999) · Proceedings of the National Academy of Sciences · doi:10.1073/pnas.96.18.10361 · Cited by 189
Self-citationModulation of oligodendrocyte generation during a critical temporal window after NG2 cell division
Hill, R., Patel, K. D., Gonçalves, C. M., Grutzendler, J., & Nishiyama, A. (2014) · Nature Neuroscience · doi:10.1038/nn.3815 · Cited by 198
Self-citationCadavid, D., Mellion, M. L., Hupperts, R., Edwards, K. R., Calabresi, P. A., Drulovic, J. S., Giovannoni, G., Hartung, H., Arnold, D. L., Fisher, E., et al. (2019) · The Lancet Neurology · doi:10.1016/s1474-4422(19)30137-1 · Cited by 186
Myelin: A gatekeeper of activity-dependent circuit plasticity?
Bonetto, G., Belin, D., & Káradóttir, R. T. (2021) · Science · doi:10.1126/science.aba6905 · Cited by 195
Fernandez, P.-A., Tang, D. G., Cheng, L., Prochiantz, A., Mudge, A. W., & RAFF, M. C. (2000) · Neuron · doi:10.1016/s0896-6273(00)00087-8 · Cited by 174
Kukley, M., Nishiyama, A., & Dietrich, D. (2010) · Journal of Neuroscience · doi:10.1523/jneurosci.0854-10.2010 · Cited by 177
Self-citationBjartmar, C., Battistuta, J., Terada, N., Dupree, E., & Trapp, B. D. (2001) · Annals of Neurology · doi:10.1002/ana.10052 · Cited by 169
Self-citationPolydendrocytes: NG2 Cells with Many Roles in Development and Repair of the CNS
Nishiyama, A. (2007) · The Neuroscientist · doi:10.1177/1073858406295586 · Cited by 166
Self-citationDe Biase, L. M., Kang, S. H., Baxi, E. G., Fukaya, M., Pucak, M. L., Mishina, M., Calabresi, P. A., & Bergles, D. E. (2011) · The Journal of Neuroscience · doi:10.1523/jneurosci.2455-11.2011 · Cited by 161
Bercury, K. K., Dai, J., Sachs, H. H., Ahrendsen, J. T., Wood, T. L., & Macklin, W. B. (2014) · Journal of Neuroscience · doi:10.1523/jneurosci.4314-13.2014 · Cited by 167
Self-citationNotch-1 activation by familial Alzheimer's disease (FAD)-linked mutant forms of presenilin-1
Nakajima, M., Shimizu, T., & Shirasawa, T. (2000) · Journal of Neuroscience Research · doi:10.1002/1097-4547(20001015)62:2 · Cited by 27
Proteolipid Protein Is Necessary in Peripheral as Well as Central Myelin
Garbern, J. Y., Cambi, F., Tang, X.-M., Sima, A. A. F., Vallat, J. M., Bosch, E. P., Lewis, R. A., Shy, M. E., Sohi, J., Kraft, G. H., et al. (1997) · Neuron · doi:10.1016/s0896-6273(00)80360-8 · Cited by 154
Regulation of Integrin Growth Factor Interactions in Oligodendrocytes by Lipid Raft Microdomains
Baron, W., Decker, L., Colognato, H., & ffrench‐Constant, C. (2003) · Current Biology · doi:10.1016/s0960-9822(02)01437-9 · Cited by 152
Kougioumtzidou, E., Shimizu, T., Hamilton, N. B., Tohyama, K., Sprengel, R., Monyer, H., Attwell, D., & Richardson, W. D. (2017) · eLife · doi:10.7554/elife.28080 · Cited by 154
Evolution of a neuroprotective function of central nervous system myelin
Yin, X., Baek, R. C., Kirschner, D. A., Peterson, A. C., Fujii, Y., Nave, K., Macklin, W. B., & Trapp, B. D. (2006) · The Journal of Cell Biology · doi:10.1083/jcb.200509174 · Cited by 147
Self-citationCurrent concepts of PLP and its role in the nervous system
Griffiths, I. R., Klugmann, M., Anderson, T. J., Vouyiouklis, D. A., & Nave, K. (1998) · Microscopy Research and Technique · doi:10.1002/(sici)1097-0029(19980601)41:5 · Cited by 143
Functional identification of pathogenic autoantibody responses in patients with multiple sclerosis
Elliott, C., Lindner, M., Arthur, A. T., Brennan, K., Jarius, S., Hussey, J., Chan, A., Salmen, A., Olsson, T. P., Willison, H. J., et al. (2012) · Brain · doi:10.1093/brain/aws105 · Cited by 138
Larsen, P. H., DaSilva, A. G., Conant, K. E., & Yong, V. W. (2006) · Journal of Neuroscience · doi:10.1523/jneurosci.1880-05.2006 · Cited by 143
AXONAL TRANSECTION IN THE LESIONS OF MULTIPLE SCLEROSIS
Rapp, D., Eterson, J. O. P., Ansohoff, R. I. M. R., Udick, R. I. R., & Örk, S. V. M. (1998) · Cited by 141
The Pathobiology of Myelin Mutants Reveal Novel Biological Functions of the MBP and PLP Genes
Campagnoni, A. T., & Skoff, R. P. (2001) · Brain Pathology · doi:10.1111/j.1750-3639.2001.tb00383.x · Cited by 138
Semaphorins in Adult Nervous System Plasticity and Disease
Carulli, D., de Winter, F., & Verhaagen, J. (2021) · Frontiers in Synaptic Neuroscience · doi:10.3389/fnsyn.2021.672891 · Cited by 137
Regulation of myelination by microglia
Santos, E. N., & Fields, R. D. (2021) · Science Advances · doi:10.1126/sciadv.abk1131 · Cited by 137
Bigio, M. R. D., & Zhang, Y. W. (1998) · Experimental Neurology · doi:10.1006/exnr.1998.6922 · Cited by 135
Sequence of oligodendrocyte development in the human fetal telencephalon
Jakovčevski, I., & Zečević, N. (2004) · Glia · doi:10.1002/glia.20134 · Cited by 140
Sun, L. O., Mulinyawe, S. B., Collins, H. Y., Ibrahim, A., Li, Q., Simon, D. J., Tessier‐Lavigne, M., & Barres, B. A. (2018) · Cell · doi:10.1016/j.cell.2018.10.044 · Cited by 133
Developmental Cell Death in the Cerebral Cortex
Wong, F. K., & Marín, Ó. (2019) · Annual Review of Cell and Developmental Biology · doi:10.1146/annurev-cellbio-100818-125204 · Cited by 139
Central nervous system myelination in mice with deficient expression of Notch1 receptor
Givogri, M. I., Costa, R. M., Schonmann, V., Silva, A. J., Campagnoni, A. T., & Bongarzone, E. R. (2002) · Journal of Neuroscience Research · doi:10.1002/jnr.10128 · Cited by 140
An Integrin–Contactin Complex Regulates CNS Myelination by Differential Fyn Phosphorylation
Laursen, L. S., Chan, C. W., & ffrench‐Constant, C. (2009) · Journal of Neuroscience · doi:10.1523/jneurosci.5942-08.2009 · Cited by 133
Bu, J., Akhtar, N. D., & Nishiyama, A. (2001) · Glia · doi:10.1002/glia.1063 · Cited by 133
Self-citationA role for the NG2 proteoglycan in glioma progression
Stallcup, W. B., & Huang, F.-J. (2008) · Cell Adhesion & Migration · doi:10.4161/cam.2.3.6279 · Cited by 134
Fuss, B., Mallon, B. S., Phan, T., Ohlemeyer, C., Kirchhoff, F., Nishiyama, A., & Macklin, W. B. (2000) · Developmental Biology · doi:10.1006/dbio.1999.9574 · Cited by 133
Self-citationGlial cells are born with synapses
Kukley, M., Kiladze, M., Tognatta, R., Hans, M., Swandulla, D., Schramm, J., & Dietrich, D. (2008) · The FASEB Journal · doi:10.1096/fj.07-090985 · Cited by 137
Olig1 Function Is Required for Oligodendrocyte Differentiation in the Mouse Brain
Dai, J., Bercury, K. K., Ahrendsen, J. T., & Macklin, W. B. (2015) · Journal of Neuroscience · doi:10.1523/jneurosci.4962-14.2015 · Cited by 141
Self-citationA New Model of Cuprizone-Mediated Demyelination/Remyelination
Sachs, H. H., Bercury, K. K., Popescu, D. C., Narayanan, S. P., & Macklin, W. B. (2014) · ASN NEURO · doi:10.1177/1759091414551955 · Cited by 128
Self-citationWerner, H. B., Krämer‐Albers, E., Strenzke, N., Saher, G., Tenzer, S., Ohno‐Iwashita, Y., de Monasterio‐Schrader, P., Möbius, W., Moser, T., Griffiths, I. R., et al. (2013) · Glia · doi:10.1002/glia.22456 · Cited by 133
BDNF+/− mice exhibit deficits in oligodendrocyte lineage cells of the basal forebrain
VonDran, M. W., Clinton‐Luke, P., Honeywell, J. Z., & Dreyfus, C. F. (2010) · Glia · doi:10.1002/glia.20969 · Cited by 120
Oligodendrocytes in a Nutshell
Michalski, J., & Kothary, R. (2015) · Frontiers in Cellular Neuroscience · doi:10.3389/fncel.2015.00340 · Cited by 124
Autophagy is essential for oligodendrocyte differentiation, survival, and proper myelination
Bankston, A. N., Forston, M. D., Howard, R. M., Andres, K. R., Smith, A. E., Ohri, S. S., Bates, M. L., Bunge, M. B., & Whittemore, S. R. (2019) · Glia · doi:10.1002/glia.23646 · Cited by 112
Life-long oligodendrocyte development and plasticity
Nishiyama, A., Shimizu, T., Sherafat, A., & Richardson, W. D. (2021) · Seminars in Cell and Developmental Biology · doi:10.1016/j.semcdb.2021.02.004 · Cited by 126
Self-citationOrduz, D., Maldonado, P. P., Balia, M., Vélez‐Fort, M., de Sars, V., Yanagawa, Y., Emiliani, V., & Angulo, M. C. (2015) · eLife · doi:10.7554/elife.06953 · Cited by 115
Endogenous GABA controls oligodendrocyte lineage cell number, myelination, and CNS internode length
Hamilton, N. B., Clarke, L. E., Arancibia‐Cárcamo, I. L., Kougioumtzidou, E., Matthey, M., Káradóttir, R. T., Whiteley, L., Bergersen, L. H., Richardson, W. D., & Attwell, D. (2016) · Glia · doi:10.1002/glia.23093 · Cited by 123
Contact with Central Nervous System Myelin Inhibits Oligodendrocyte Progenitor Maturation
Robinson, S., & Miller, R. H. (1999) · Developmental Biology · doi:10.1006/dbio.1999.9466 · Cited by 120
Soane, L., Cho, H.-J., Niculescu, F. I., Rus, H., & Shin, M. L. (2001) · The Journal of Immunology · doi:10.4049/jimmunol.167.4.2305 · Cited by 115
Generation of oligodendroglial progenitors from neural stem cells
Zhang, S., Lundberg, C. G., Lipsitz, D., O’Connor, L. T., & Duncan, I. D. (1998) · Journal of Neurocytology · doi:10.1023/a:1006953023845 · Cited by 112
Remyelination alters the pattern of myelin in the cerebral cortex
Orthmann-Murphy, J., Call, C. L., Molina-Castro, G. C., Hsieh, Y. C., Rasband, M. N., Calabresi, P. A., & Bergles, D. E. (2020) · eLife · doi:10.7554/elife.56621 · Cited by 111
Forbes, T. A., Goldstein, E. Z., Dupree, J. L., Jablonska, B., Scafidi, J., Adams, K. L., Kawasawa, Y. I., Hashimoto‐Torii, K., & Gallo, V. (2020) · Nature Communications · doi:10.1038/s41467-020-14762-7 · Cited by 108
Interaction of mTOR and Erk1/2 signaling to regulate oligodendrocyte differentiation
Dai, J., Bercury, K. K., & Macklin, W. B. (2014) · Glia · doi:10.1002/glia.22729 · Cited by 106
Self-citationGarwood, J., Garcion, E., Dobbertin, A., Heck, N., Calco, V., ffrench‐Constant, C., & Faissner, A. (2004) · European Journal of Neuroscience · doi:10.1111/j.1460-9568.2004.03727.x · Cited by 104
Platelet-Derived Growth Factor Promotes Repair of Chronically Demyelinated White Matter
Vana, A. C., Flint, N. C., Harwood, N. E., Le, T. Q., Fruttiger, M., & Armstrong, R. C. (2007) · Journal of Neuropathology & Experimental Neurology · doi:10.1097/nen.0b013e3181587d46 · Cited by 101
Membrane traffic in myelinating oligodendrocytes
Krämer‐Albers, E., Schardt, A., & Nave, K. (2001) · Microscopy Research and Technique · doi:10.1002/jemt.1050 · Cited by 101
Cloutier, F., Siegenthaler, M. M., Nistor, G., & Keirstead, H. S. (2006) · Regenerative Medicine · doi:10.2217/17460751.1.4.469 · Cited by 101
Sox10 is necessary for oligodendrocyte survival following axon wrapping
Takada, N., Kucenas, S., & Appel, B. (2010) · Glia · doi:10.1002/glia.20981 · Cited by 91
NG2‐positive cells generate A2B5‐positive oligodendrocyte precursor cells
Baracskay, K. L., Kidd, G. J., Miller, R. H., & Trapp, B. D. (2007) · Glia · doi:10.1002/glia.20519 · Cited by 100
Self-citationIntegrins mediate a neuronal survival signal for oligodendrocytes
Frost, E. E., Buttery, P. C., Milner, R., & ffrench‐Constant, C. (1999) · Current Biology · doi:10.1016/s0960-9822(99)80506-5 · Cited by 99
Premyelinating Oligodendrocytes: Mechanisms Underlying Cell Survival and Integration
Hughes, E. G., & Stockton, M. E. (2021) · Frontiers in Cell and Developmental Biology · doi:10.3389/fcell.2021.714169 · Cited by 98
Metadata
- Authors
- Trapp, B. D., Nishiyama, A., Cheng, D., & Macklin, W.
- Affiliations
- Cleveland Clinic (US)
- Venue
- The Journal of Cell Biology
- Publisher
- Rockefeller University Press
- Published
- 1997-04-21
- Volume
- 137
- Issue
- 2
- Pages
- 459-468
- ISSN
- 0021-9525 (ISSN-L)
- 1540-8140
- PMC
- PMC2139778
- OpenAlex
- W2097849969
- Cited by
- 395
- References
- 41
- Citations by year
- 2026: 7 · 2025: 10 · 2024: 9 · 2023: 16 · 2022: 14 · 2021: 23 · 2020: 26 · 2019: 16 · 2018: 13 · 2017: 15 · 2016: 12 · 2015: 13 · 2014: 13 · 2013: 10 · 2012: 7
- FWCI
- 4.80
- Type
- journal article
- Language
- en
- Open access
- bronze
- doi.org
- Locations
- The Journal of Cell Biology (publishedVersion)
- Europe PMC (PubMed Central) (publishedVersion, cc-by-nc-sa)
- PubMed Central (publishedVersion, cc-by-nc-sa)
- PubMed (publishedVersion)
- Funders
- National Multiple Sclerosis Society
- Multiple Sclerosis Society
- National Institutes of Health
- National Institute of Neurological Disorders and Stroke (NS25304, R01NS029818, R01NS025304, NS 29818)
- Topics
- Life Sciences › Neuroscience › Developmental Neuroscience › Neurogenesis and neuroplasticity mechanisms
- Health Sciences › Medicine › Pediatrics, Perinatology and Child Health › Neonatal and fetal brain pathology
- Health Sciences › Medicine › Clinical Neurology › Multiple Sclerosis Research Studies
- Keywords
- oligodendrocyte differentiation, oligodendrocyte death, myelination, proteolipid protein, DM20, oligodendrocyte survival, cerebral cortex, corpus callosum, postnatal brain development
- MeSH terms
- Animals, Axons, Brain, Cell Differentiation, Cerebral Cortex, Chromatin, Corpus Callosum, Nerve Tissue Proteins, Oligodendroglia, Cell Death, Rats, Sprague-Dawley, Myelin Proteolipid Protein, Rats
About these checks
Registry, retraction, Cites and statistics results are computed, not judged, with one exception: a printed reference that no index lists is read once by a model before it counts as a citation error. Claims are extracted by a model and kept only when their quote appears verbatim in the text; each cited source is then checked, with a model’s help, for whether it says what the claim relies on. Those verdicts can be wrong — read the claim’s quote and the cited source before relying on one.
Statistics and arithmetic are recomputed, not judged.
Confidence bands are shown only for fields calibrated on our annotated test set. None is calibrated yet, so no band is shown.
What counts as a claim ›How we measure confidence ›How we check this ›
Are you an author, or do you see a problem with this page? Request a review
