

The DOI matches its Crossref record; 73 of the 73 references it cites were found in a registry or an index; 16 of the 46 sources its claims cite were checked for support.
VPS35 haploinsufficiency increases Alzheimer’s disease neuropathology
Open accessAbstract
VPS35, a major component of the retromer complex, is important for endosome-to-Golgi retrieval of membrane proteins. Although implicated in Alzheimer’s disease (AD), how VPS35 regulates AD-associated pathology is unknown. In this paper, we show that hemizygous deletion of Vps35 in the Tg2576 mouse model of AD led to earlier-onset AD-like phenotypes, including cognitive memory deficits, defective long-term potentiation, and impaired postsynaptic glutamatergic neurotransmission in young adult age. These deficits correlated well with an increase of β-amyloid peptide (Aβ) level in the mutant hippocampus. We further demonstrate that VPS35 is predominantly expressed in pyramidal neurons of young adult hippocampus and interacts with BACE1, a protease responsible for Aβ production. Loss of VPS35 function in the mouse hippocampus increased BACE1 activity. Suppression of VPS35 expression in culture decreased BACE1 trans-Golgi localization but enriched it in endosomes. These results demonstrate an essential role for VPS35 in suppression of AD neuropathology and in inhibition of BACE1 activation and Aβ production by promoting BACE1 endosome-to-Golgi retrieval.
Overview
AI snapshot
Written from the paper’s full text.
TL;DR
VPS35 haploinsufficiency accelerates Alzheimer’s disease–like neuropathology in Tg2576 mice by impairing endosome-to-Golgi retrieval of BACE1, increasing BACE1 activity and Aβ production. The double mutant mice show earlier cognitive, synaptic, and amyloid phenotypes than Tg2576 mice alone.
Key findings
- Vps35+/m;Tg2576+/− mice showed earlier spatial learning/memory deficits at 3 and 6 mo, impaired LTP in CA1 and dentate gyrus, and reduced AMPA/NMDA receptor–mediated mEPSC amplitudes and frequencies, with no change in GABAergic transmission.
- Aβ deposits were more numerous and larger in 6- and 12-mo-old Vps35+/m;Tg2576+/− brains than in Tg2576 brains; human Aβ40 was higher in 2-mo-old double mutant hippocampus and cortex by 30% and 15%, respectively, and mouse Aβ40 was also increased in Vps35+/m and double mutants. Aβ42 increased, but the Aβ40/Aβ42 ratio was unchanged.
- VPS35 interacted with BACE1, with a BACE1-binding site at VPS35 amino acids 390–606; loss of VPS35 increased BACE1 localization to Rab5/Rab7/LAMP1-positive endosomal compartments and reduced Rab11 recycling endosome localization.
- BACE1 activity increased by ∼50% in Vps35+/m hippocampus and ∼20% in cortex versus WT, with further increases in double mutants; C99 and sAPPβ were increased in Tg2576+/−;Vps35+/m hippocampus.
Methods
- Vps35 mutant mice were generated by gene trapping; homozygotes died before E10, while heterozygotes expressed Vps35 at ∼50% of WT and were crossed with Tg2576 APPswe mice to produce WT, Tg2576+/−, Vps35+/m, and Tg2576+/−;Vps35+/m littermates.
- Behavioral testing used the Morris water maze at 1–2, 3, and 6 mo; electrophysiology measured fEPSPs, LTP, mEPSCs, eEPSCs, mIPSCs, and eIPSCs in hippocampal slices; biochemistry included Aβ40/42 ELISAs, BACE1 activity assays, Western blots for APP cleavage products, immunohistochemistry, coimmunoprecipitation, and GST pull-down.
- Data were analyzed with one-way or repeated measures ANOVA, post hoc tests, or t tests, with significance at P < 0.05.
Limitations
- The paper states that it remains to be investigated whether Golgi/endosome-associated BACE1 activity is altered by loss of Vps35, where Aβ is produced in Vps35-deficient neurons, and whether APP and APPswe trafficking are differentially regulated by VPS35; it also notes that an Aβ-independent mechanism for synapse/synaptic activity loss cannot be excluded.
- Evident from the text: the study relies on mouse and cultured-cell models, with no human tissue validation; some supporting results are described as “unpublished data” or “not depicted,” and several biochemical/plaque quantifications use small n values (e.g., n = 4 for ELISA and plaque analyses).
Model-written summary. Check it against the paper before relying on it.
Integrity signals
Registry
Cites
Statistics
Figures
Verification
Claims the paper makes
66 Own result · 27 Own interpretation · 9 No full text of the sources · 6 Own method · 5 Partly supported · 5 Not checked yet · 4 Supported · 3 Supported so far · 3 No basis given · accuracy not yet measured
The cited sources support only part of this claim — read each source’s verdict below.
In the paper
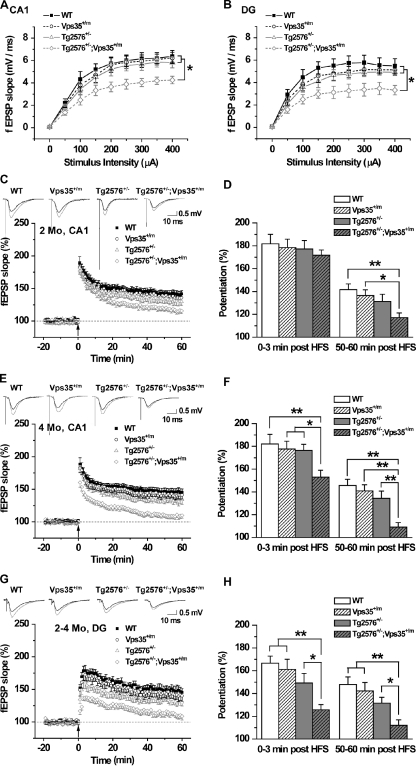
“Note that posttetanic potentiation and LTP in the CA1 area were apparently normal in Tg2576 hippocampal slices at both ages, which is in agreement with previous reports that LTP was not impaired until at the age of >12 mo old (Chapman et al., 1999; Fitzjohn et al., 2001).”
§ VPS35 haploinsufficiency increases Alzheimer’s disease neuropathology > Results > Acceleration of Tg2576-associated synaptic plasticity and glutamatergic transmission phenotypes by loss of VPS35 function
What the sources say
- Not checked — no full text of the sourcecites Chapman et al., 1999 source
- Partly supportedcites Fitzjohn et al., 2001 sourceExperimental — accuracy not yet measured
The CA1 synaptic-plasticity results (page unavailable) report normal LTP in transgenic slices at both 12 and 18 months. The paper does not report posttetanic potentiation; it measures paired-pulse facilitation instead. Its finding of normal LTP at 18 months also does not support the sentence’s implication that LTP becomes impaired after 12 months. (LLM, conf=0.87)
hedged- Asserted: passes — The authors put it forward as true.
- Checkable: passes — It can be checked against evidence.
- Load-bearing: passes — The paper’s conclusions depend on it.
- Based: passes — The paper gives a reason why it holds.
A result the paper reports from its own data — it cites no other source for it, so there is none to check. The quote shows it is in the paper.
In the paper
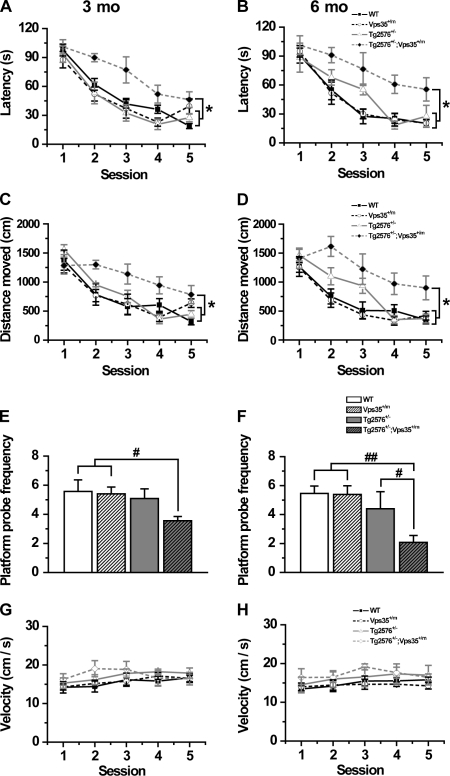
“Tg2576 and Vps35+/m mice had normal spatial learning and memory response as compared with the age-matched WT control in viewing their learning the location of the submerged platform with repeated testing (Fig. 1).”
§ VPS35 haploinsufficiency increases Alzheimer’s disease neuropathology > Results > Genetic enhancement and earlier onset of Tg2576-associated cognitive deficit by loss of VPS35 function
plain- Asserted: passes — The authors put it forward as true.
- Checkable: passes — It can be checked against evidence.
- Load-bearing: passes — The paper’s conclusions depend on it.
- Based: passes — The paper gives a reason why it holds.
A result the paper reports from its own data — it cites no other source for it, so there is none to check. The quote shows it is in the paper.
In the paper
“Homozygotes, named Vps35m/m, were lethal at an early embryonic stage (under embryonic day 10 [E10]), but heterozygotes, named Vps35+/m, whose expression of Vps35 was ∼50% of that in wild type (WT; Fig. S1 B), survived to adulthood.”
§ VPS35 haploinsufficiency increases Alzheimer’s disease neuropathology > Results > Genetic enhancement and earlier onset of Tg2576-associated cognitive deficit by loss of VPS35 function
plain- Asserted: passes — The authors put it forward as true.
- Checkable: passes — It can be checked against evidence.
- Load-bearing: unclear — It is unclear whether the paper’s conclusions depend on it.
- Based: passes — The paper gives a reason why it holds.
A result the paper reports from its own data — it cites no other source for it, so there is none to check. The quote shows it is in the paper.
In the paper
“Homozygotes, named Vps35m/m, were lethal at an early embryonic stage (under embryonic day 10 [E10]), but heterozygotes, named Vps35+/m, whose expression of Vps35 was ∼50% of that in wild type (WT; Fig. S1 B), survived to adulthood.”
§ VPS35 haploinsufficiency increases Alzheimer’s disease neuropathology > Results > Genetic enhancement and earlier onset of Tg2576-associated cognitive deficit by loss of VPS35 function
plain- Asserted: passes — The authors put it forward as true.
- Checkable: passes — It can be checked against evidence.
- Load-bearing: passes — The paper’s conclusions depend on it.
- Based: passes — The paper gives a reason why it holds.
A result the paper reports from its own data — it cites no other source for it, so there is none to check. The quote shows it is in the paper.
In the paper
“Homozygotes, named Vps35m/m, were lethal at an early embryonic stage (under embryonic day 10 [E10]), but heterozygotes, named Vps35+/m, whose expression of Vps35 was ∼50% of that in wild type (WT; Fig. S1 B), survived to adulthood.”
§ VPS35 haploinsufficiency increases Alzheimer’s disease neuropathology > Results > Genetic enhancement and earlier onset of Tg2576-associated cognitive deficit by loss of VPS35 function
plain- Asserted: passes — The authors put it forward as true.
- Checkable: passes — It can be checked against evidence.
- Load-bearing: passes — The paper’s conclusions depend on it.
- Based: passes — The paper gives a reason why it holds.
A result the paper reports from its own data — it cites no other source for it, so there is none to check. The quote shows it is in the paper.
In the paper
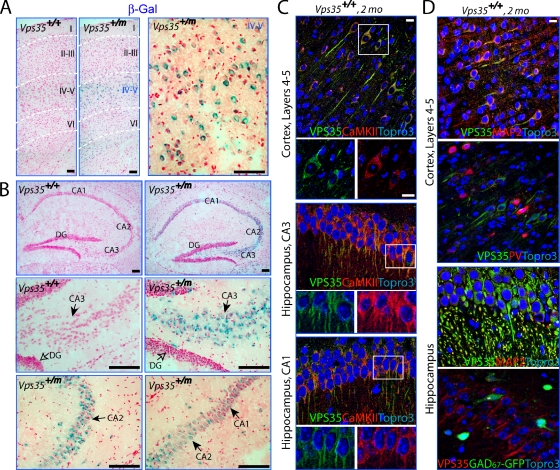
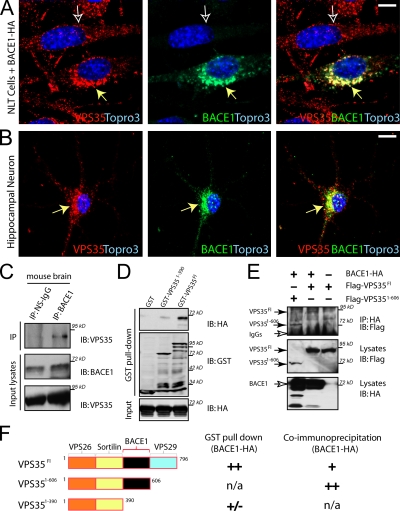
“BACE1 and VPS35 were colocalized largely at perinuclear compartments in NLT cells, a cell line derived from GnRH neurons, and in mouse cortical neurons (Fig. 6, A and B).”
§ VPS35 haploinsufficiency increases Alzheimer’s disease neuropathology > Results > Expression of VPS35 in hippocampal and layer IV–V cortical pyramidal neurons and interaction of VPS35 with BACE1
plaincorrelational- Asserted: passes — The authors put it forward as true.
- Checkable: passes — It can be checked against evidence.
- Load-bearing: passes — The paper’s conclusions depend on it.
- Based: passes — The paper gives a reason why it holds.
A result the paper reports from its own data — it cites no other source for it, so there is none to check. The quote shows it is in the paper.
In the paper
“Note that no significant difference was observed in velocity among the four groups (Fig. 1, G and H).”
§ VPS35 haploinsufficiency increases Alzheimer’s disease neuropathology > Results > Genetic enhancement and earlier onset of Tg2576-associated cognitive deficit by loss of VPS35 function
plain- Asserted: passes — The authors put it forward as true.
- Checkable: passes — It can be checked against evidence.
- Load-bearing: passes — The paper’s conclusions depend on it.
- Based: passes — The paper gives a reason why it holds.
The paper states this without a source or data behind it here, so there is nothing to check it against. The quote shows it is in the paper.
In the paper
“VPS35 is highly expressed in pyramidal neurons in young adult CA1–3 hippocampus”
§ VPS35 haploinsufficiency increases Alzheimer’s disease neuropathology > Discussion
plain- Asserted: passes — The authors put it forward as true.
- Checkable: passes — It can be checked against evidence.
- Load-bearing: unclear — It is unclear whether the paper’s conclusions depend on it.
- Based: passes — The paper gives a reason why it holds.
A result the paper reports from its own data — it cites no other source for it, so there is none to check. The quote shows it is in the paper.
In the paper
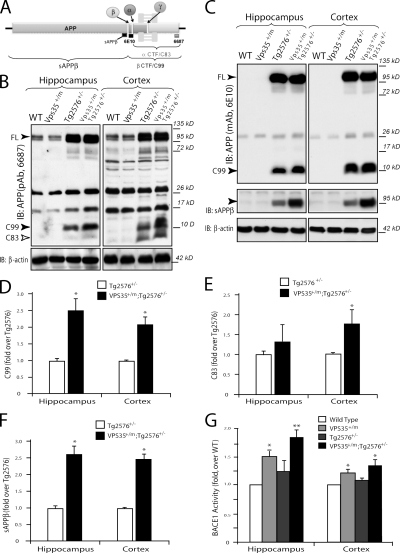
“C83 levels were not consistently altered by Vps35 mutation (Fig. 8, C and E)”
§ VPS35 haploinsufficiency increases Alzheimer’s disease neuropathology > Results > Increased BACE1-mediated cleavage of APP and BACE1 activity in VPS35 mutant mice
plain- Asserted: passes — The authors put it forward as true.
- Checkable: passes — It can be checked against evidence.
- Load-bearing: unclear — It is unclear whether the paper’s conclusions depend on it.
- Based: passes — The paper gives a reason why it holds.
A result the paper reports from its own data — it cites no other source for it, so there is none to check. The quote shows it is in the paper.
In the paper
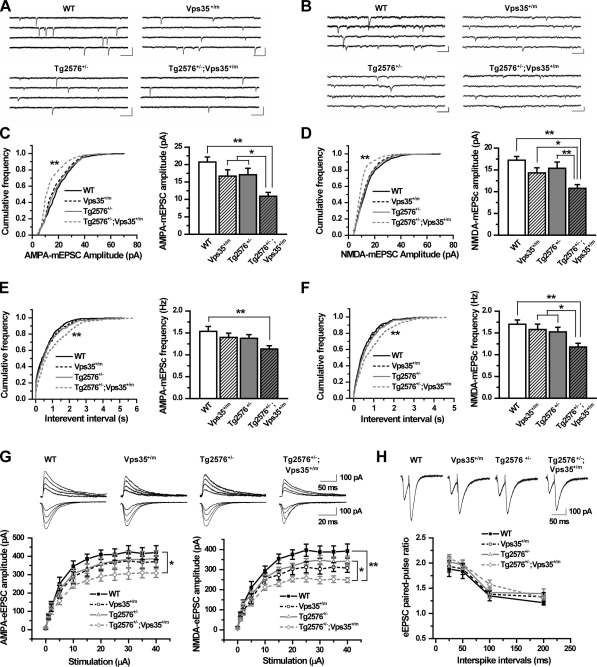
“The ratio of paired-pulse facilitation was not significantly different among the four groups of mice (Fig. 3 H), suggesting that the decreased frequencies of both currents in the double mutant CA1 neurons may be caused by a reduction of the number of postsynaptic glutamatergic neurons/synapses.”
§ VPS35 haploinsufficiency increases Alzheimer’s disease neuropathology > Results > Acceleration of Tg2576-associated synaptic plasticity and glutamatergic transmission phenotypes by loss of VPS35 function
plainn = 4- Asserted: passes — The authors put it forward as true.
- Checkable: passes — It can be checked against evidence.
- Load-bearing: passes — The paper’s conclusions depend on it.
- Based: passes — The paper gives a reason why it holds.
- Probably not a substantial claim. 26
- It may state two separate claims as one. 40
- The quote only partly states this claim. 2
The sources with a verdict support this claim; the rest weren’t checked yet, have no full text we could read, or their verdicts aren’t rated yet.
In the paper
“Genetic ablation of BACE1 in AD animals abolishes Aβ production and rescues AD-like phenotypes (Luo et al., 2001; Ohno et al., 2004; Laird et al., 2005).”
§ VPS35 haploinsufficiency increases Alzheimer’s disease neuropathology > Introduction
What the sources say
- Not checked — no full text of the sourcecites Luo et al., 2001 source
- Not checked — no full text of the sourcecites Ohno et al., 2004 source
- Supportedcites Laird et al., 2005 source
In “Deletion of BACE1 prevents age-dependent cognitive deficits” (page not provided), the paper reports that Aβ1-40 and Aβ1-42 were abolished in APPswe;PS1ΔE9 mice lacking BACE1. The same section reports that complete BACE1 deletion prevented the mice’s age-dependent cognitive deficits; the discussion also reports prevention of amyloid deposits and neuropathological abnormalities. (LLM, conf=0.94)
plaindirect- Asserted: passes — The authors put it forward as true.
- Checkable: passes — It can be checked against evidence.
- Load-bearing: fails — The paper’s conclusions may not depend on it.
- Based: passes — The paper gives a reason why it holds.
Probably not a substantial claim. The paper’s conclusions may not depend on it. It may state two separate claims as one.
Every source the paper cites for this claim was checked and supports it.
In the paper
“Tg2576 mice began to show impaired LTP and synaptic transmission in dentate gyrus (DG) at 4–5 mo or older (Jacobsen et al., 2006).”
§ VPS35 haploinsufficiency increases Alzheimer’s disease neuropathology > Results > Acceleration of Tg2576-associated synaptic plasticity and glutamatergic transmission phenotypes by loss of VPS35 function
What the sources say
- Supportedcites Jacobsen et al., 2006 source
The Results report reduced basal synaptic transmission and LTP in 4- to 5-month-old Tg mice compared with age-matched controls, with neither deficit detected at 2 months. The Abstract identifies the LTP measurement as occurring in the dentate gyrus after perforant-path stimulation. The paper does not establish the electrophysiological findings at every older age, but supports the stated onset. (LLM, conf=0.91)
plain- Asserted: passes — The authors put it forward as true.
- Checkable: passes — It can be checked against evidence.
- Load-bearing: passes — The paper’s conclusions depend on it.
- Based: passes — The paper gives a reason why it holds.
Probably not a substantial claim.
- Supported
Every source the paper cites for this claim was checked and supports it.
In the paper
“SorL1 is a Vps10 family member in the retromer complex that interacts with APP and VPS35, and the interaction of SorL1 with VPS35 is necessary for SorL1 to control APP metabolism (Lane et al., 2010).”
§ VPS35 haploinsufficiency increases Alzheimer’s disease neuropathology > Discussion
What the sources say
- Supportedcites Lane et al., 2010 source
The Results section states that SorL1 directly interacts with APP and reports that Vps35 is required for SorL1 to modulate APP metabolism. The Introduction also describes SorL1 as a VPS10-domain family member that interacts with Vps35, a core retromer component. (LLM, conf=0.91)
plaindirect- Asserted: passes — The authors put it forward as true.
- Checkable: passes — It can be checked against evidence.
- Load-bearing: passes — The paper’s conclusions depend on it.
- Based: passes — The paper gives a reason why it holds.
It may state two separate claims as one.
- Supported
The cited sources support only part of this claim — read each source’s verdict below.
In the paper
“Defective spatial learning and memory are known to be early symptoms of AD (Middei et al., 2006; Bizon et al., 2007; Good and Hale, 2007; Reed et al., 2010).”
§ VPS35 haploinsufficiency increases Alzheimer’s disease neuropathology > Results > Genetic enhancement and earlier onset of Tg2576-associated cognitive deficit by loss of VPS35 function
What the sources say
- Partly supportedcites Middei et al., 2006 sourceExperimental — accuracy not yet measured
The Discussion (page unavailable) reports impaired reaction to spatial novelty and place orientation in 7-month-old AD-model mice, and relates their early hippocampal dysfunction to the progression described in AD patients. The paper describes early human AD in terms of episodic-memory loss, however; it does not establish defective spatial learning and memory specifically as early symptoms in patients. (LLM, conf=0.84)
- Not checked — no full text of the sourcecites Bizon et al., 2007 source
- Not checked — no full text of the sourcecites Good and Hale, 2007 source
boostedcorrelational- Asserted: passes — The authors put it forward as true.
- Checkable: passes — It can be checked against evidence.
- Load-bearing: fails — The paper’s conclusions may not depend on it.
- Based: passes — The paper gives a reason why it holds.
Probably not a substantial claim. The paper’s conclusions may not depend on it.
- Partly supported
Every source the paper cites for this claim was checked and supports it.
In the paper
“Genetic, biochemical, animal, and human studies have all pointed to Aβ peptide to be a major culprit in AD pathogenesis (Tanzi and Bertram, 2005; Selkoe, 2008).”
§ VPS35 haploinsufficiency increases Alzheimer’s disease neuropathology > Discussion
What the sources say
- Supportedcites Tanzi and Bertram, 2005 source
The Introduction says the amyloid hypothesis assigns Aβ a central role in initiating the AD pathogenic cascade and rests on genetic, molecular, biochemical, and neuropathological findings. The section on Aβ toxicity also discusses evidence from animal models, supporting the citing sentence’s broad characterization of Aβ as a major contributor to AD pathogenesis. (LLM, conf=0.91)
- Supportedcites Selkoe, 2008 source
The opening passage [1] says neuropathological, biochemical, genetic and human studies support the hypothesis that Aβ accumulation triggers the changes producing Alzheimer’s disease. It also reports animal experiments in which Aβ oligomers impair synaptic plasticity and memory, supporting the citing sentence’s qualified wording that these studies have ‘pointed to’ Aβ as a major culprit. (LLM, conf=0.92)
boosteddirect- Asserted: passes — The authors put it forward as true.
- Checkable: passes — It can be checked against evidence.
- Load-bearing: passes — The paper’s conclusions depend on it.
- Based: passes — The paper gives a reason why it holds.
Probably not a substantial claim.
- Supported
The cited sources support only part of this claim — read each source’s verdict below.
In the paper
“Our data corroborate with the view that the decreased NMDA and AMPA currents may be induced by the increase of soluble Aβ oligomers, but not Aβ deposits, in the double mutant brain (Nimmrich et al., 2008; Selkoe, 2008)”
§ VPS35 haploinsufficiency increases Alzheimer’s disease neuropathology > Discussion
What the sources say
- Partly supportedcites Nimmrich et al., 2008 sourceExperimental — accuracy not yet measured
The Introduction says soluble Aβ forms, rather than plaques, are associated with impairment, and the Results report that an Aβ oligomer reduces excitatory synaptic activity in cultured hippocampal neurons. But the Discussion says the study found no indication that its oligomer directly affects NMDA receptors. It does not establish decreased NMDA and AMPA currents caused by soluble oligomers rather than deposits in a double-mutant brain. Page numbers are unavailable in our copy. (LLM, conf=0.86)
- Partly supportedcites Selkoe, 2008 sourceExperimental — accuracy not yet measured
The Introduction (page not provided) reports reduced NMDA-receptor-mediated calcium influx and a slight reduction in AMPA-receptor-mediated miniature current amplitude after exposure to soluble Aβ oligomers. The Conclusions propose impaired NMDA signaling, but the paper does not establish that these changes occur in a double-mutant brain or compare oligomers with Aβ deposits as their cause. (LLM, conf=0.85)
hedgedconditional- Asserted: passes — The authors put it forward as true.
- Checkable: passes — It can be checked against evidence.
- Load-bearing: passes — The paper’s conclusions depend on it.
- Based: passes — The paper gives a reason why it holds.
It may state two separate claims as one.
- Partly supported
The cited sources support only part of this claim — read each source’s verdict below.
In the paper
“Many risky factors associated with the late-onset AD also affect APP metabolism and increase Aβ production, which include ApoE4 and SorL1 (Rogaeva et al., 2007; Willnow et al., 2010).”
§ VPS35 haploinsufficiency increases Alzheimer’s disease neuropathology > Discussion
What the sources say
- Partly supportedcites Rogaeva et al., 2007 sourceExperimental — accuracy not yet measured
The Results show that suppressing SORL1 changes APP sorting and increases Aβ production; the Discussion likewise describes SORL1’s role in APP processing. The Introduction associates APOE variants with Aβ accumulation, but our copy does not establish that ApoE4 alters APP metabolism or increases Aβ production. The increase shown for SORL1 is specifically with reduced expression, not SORL1 activity generally. Page numbers are unavailable in our copy. (LLM, conf=0.88)
- Partly supportedcites Willnow et al., 2010 sourceExperimental — accuracy not yet measured
The section on SORLA deficiency (p. 8) reports that loss of SORLA increases APP turnover and Aβ production in mouse models. The paper describes normal SORLA activity as reducing amyloidogenic processing (p. 7), and the passages found do not establish that ApoE4 increases Aβ production. Thus the claim is supported for reduced SORL1 activity, not for both factors as stated. (LLM, conf=0.87)
plaindirect- Asserted: passes — The authors put it forward as true.
- Checkable: passes — It can be checked against evidence.
- Load-bearing: fails — The paper’s conclusions may not depend on it.
- Based: passes — The paper gives a reason why it holds.
Probably not a substantial claim. The paper’s conclusions may not depend on it. It may state two separate claims as one.
- Partly supported
The sources with a verdict support this claim; the rest weren’t checked yet, have no full text we could read, or their verdicts aren’t rated yet.
In the paper
“The retromer contains two subprotein complexes: the cargo-selective subcomplex and membrane deformation subcomplex (Seaman, 2005; Bonifacino and Hurley, 2008).”
§ VPS35 haploinsufficiency increases Alzheimer’s disease neuropathology > Introduction
What the sources say
- Not checked — no full text of the sourcecites Seaman, 2005 source
- Supportedcites Bonifacino and Hurley, 2008 source
The Summary identifies two components of mammalian retromer: a sorting nexin dimer and a cargo-recognition trimer. The Introduction describes the sorting nexin dimer’s role in forming membrane tubules, supporting the paraphrase “membrane deformation subcomplex.” (LLM, conf=0.92)
plain- Asserted: passes — The authors put it forward as true.
- Checkable: passes — It can be checked against evidence.
- Load-bearing: fails — The paper’s conclusions may not depend on it.
- Based: passes — The paper gives a reason why it holds.
Probably not a substantial claim. The paper’s conclusions may not depend on it.
The sources with a verdict support this claim; the rest weren’t checked yet, have no full text we could read, or their verdicts aren’t rated yet.
In the paper
“Recent studies have suggested that SorL1, also called SorLA and LR11, is an APP-binding protein and is involved in the pathogenesis of late-onset AD (Rogaeva et al., 2007; Willnow et al., 2010).”
§ VPS35 haploinsufficiency increases Alzheimer’s disease neuropathology > Introduction
What the sources say
- Supportedcites Rogaeva et al., 2007 source
The Results report that SORL1 directly binds APP, with co-immunoprecipitation showing an interaction with APP holoprotein. The Abstract associates SORL1 variants with late-onset AD, and the Discussion suggests that changes in SORL1 expression or function contribute to AD pathogenesis. (LLM, conf=0.94)
- Not checked yetcites Willnow et al., 2010 source
Checked before — its earlier verdict is held back until a new check runs.
hedgedcorrelational- Asserted: passes — The authors put it forward as true.
- Checkable: passes — It can be checked against evidence.
- Load-bearing: fails — The paper’s conclusions may not depend on it.
- Based: passes — The paper gives a reason why it holds.
Probably not a substantial claim. The paper’s conclusions may not depend on it. It may state two separate claims as one.
- Supported
The cited sources support only part of this claim — read each source’s verdict below.
In the paper
“loss of function of SorCS1, a SorL1 family protein and a risk factor for type 2 diabetes, also leads to an increase of Aβ and a decrease of VPS35 levels (Lane et al., 2010)”
§ VPS35 haploinsufficiency increases Alzheimer’s disease neuropathology > Discussion
What the sources say
- Partly supportedcites Lane et al., 2010 sourceExperimental — accuracy not yet measured
The Introduction and Results report increased Aβ40 and Aβ42 and decreased Vps35 in the brains of female Sorcs1 hypomorphic mice. The citing sentence omits that sex- and model-specific qualification: the paper found no Aβ increase when male and female mice were grouped, and studied reduced Sorcs1 expression rather than a complete knockout. (LLM, conf=0.88)
plaindirect- Asserted: passes — The authors put it forward as true.
- Checkable: passes — It can be checked against evidence.
- Load-bearing: fails — The paper’s conclusions may not depend on it.
- Based: passes — The paper gives a reason why it holds.
Probably not a substantial claim. The paper’s conclusions may not depend on it. It may state two separate claims as one.
- Partly supported
Every source the paper cites for this claim was checked and supports it.
In the paper
“mutation in Vps35 gene has recently been identified in patients of late-onset Parkinson’s disease (PD; Vilariño-Güell et al., 2011; Zimprich et al., 2011)”
§ VPS35 haploinsufficiency increases Alzheimer’s disease neuropathology > Discussion
What the sources say
- Supportedcites Vilariño-Güell et al., 2011 source
The Abstract describes a Swiss family with late-onset Parkinson disease and identifies a VPS35 mutation as the likely genetic cause. The case-control passage also reports the mutation in additional patients with Parkinson disease. (LLM, conf=0.94)
- Supportedcites Zimprich et al., 2011 source
The supplied Abstract reports a VPS35 missense mutation in affected family members and says that p.Asp620Asn cosegregated with late-onset Parkinson disease in three families. (LLM, conf=0.94)
plaincorrelational- Asserted: passes — The authors put it forward as true.
- Checkable: passes — It can be checked against evidence.
- Load-bearing: fails — The paper’s conclusions may not depend on it.
- Based: passes — The paper gives a reason why it holds.
Probably not a substantial claim. The paper’s conclusions may not depend on it.
- Supported
A result the paper reports from its own data — it cites no other source for it, so there is none to check. The quote shows it is in the paper.
In the paper
“In addition, Tg2576+/−;Vps35+/m mutant mice performed worse than all other groups in probe trials, with less frequency to probe the hidden platform (Fig. 1, E and F).”
§ VPS35 haploinsufficiency increases Alzheimer’s disease neuropathology > Results > Genetic enhancement and earlier onset of Tg2576-associated cognitive deficit by loss of VPS35 function
plaincorrelational- Asserted: passes — The authors put it forward as true.
- Checkable: passes — It can be checked against evidence.
- Load-bearing: passes — The paper’s conclusions depend on it.
- Based: passes — The paper gives a reason why it holds.
It may state two separate claims as one.
A result the paper reports from its own data — it cites no other source for it, so there is none to check. The quote shows it is in the paper.
In the paper
“Vps35 homozygous mutant mice died during early embryonic development, but heterozygotes can survive into adulthood with relatively normal behavior, synaptic plasticity, and life span.”
§ VPS35 haploinsufficiency increases Alzheimer’s disease neuropathology > Introduction
plain- Asserted: passes — The authors put it forward as true.
- Checkable: passes — It can be checked against evidence.
- Load-bearing: passes — The paper’s conclusions depend on it.
- Based: passes — The paper gives a reason why it holds.
It may state two separate claims as one.
A result the paper reports from its own data — it cites no other source for it, so there is none to check. The quote shows it is in the paper.
In the paper
“No significant difference in fEPSP slopes was detected at the tested stimulus intensities in both CA1 and DG areas of Tg2576, Vps35+/m, and their WT littermate controls (Fig. 2, A and B), suggesting similar strength of basal synaptic transmission.”
§ VPS35 haploinsufficiency increases Alzheimer’s disease neuropathology > Results > Acceleration of Tg2576-associated synaptic plasticity and glutamatergic transmission phenotypes by loss of VPS35 function
hedged- Asserted: passes — The authors put it forward as true.
- Checkable: passes — It can be checked against evidence.
- Load-bearing: passes — The paper’s conclusions depend on it.
- Based: passes — The paper gives a reason why it holds.
It may state two separate claims as one.
A result the paper reports from its own data — it cites no other source for it, so there is none to check. The quote shows it is in the paper.
In the paper
“VPS35 is codistributed with BACE1 in hippocampus (not depicted) and in cultured cells (Fig. 6).”
§ VPS35 haploinsufficiency increases Alzheimer’s disease neuropathology > Discussion
plaincorrelational- Asserted: passes — The authors put it forward as true.
- Checkable: passes — It can be checked against evidence.
- Load-bearing: unclear — It is unclear whether the paper’s conclusions depend on it.
- Based: passes — The paper gives a reason why it holds.
It may state two separate claims as one.
A result the paper reports from its own data — it cites no other source for it, so there is none to check. The quote shows it is in the paper.
In the paper
“Tg2576 mice with reduced VPS35 expression exhibit an earlier onset of AD-like phenotypes, including cognitive memory deficits, reduced LTP, and decreased glutamatergic neurotransmission in 2-mo-old mice (Figs. 1–3).”
§ VPS35 haploinsufficiency increases Alzheimer’s disease neuropathology > Discussion
plaindirect- Asserted: passes — The authors put it forward as true.
- Checkable: passes — It can be checked against evidence.
- Load-bearing: passes — The paper’s conclusions depend on it.
- Based: passes — The paper gives a reason why it holds.
It may state two separate claims as one.
A result the paper reports from its own data — it cites no other source for it, so there is none to check. The quote shows it is in the paper.
In the paper
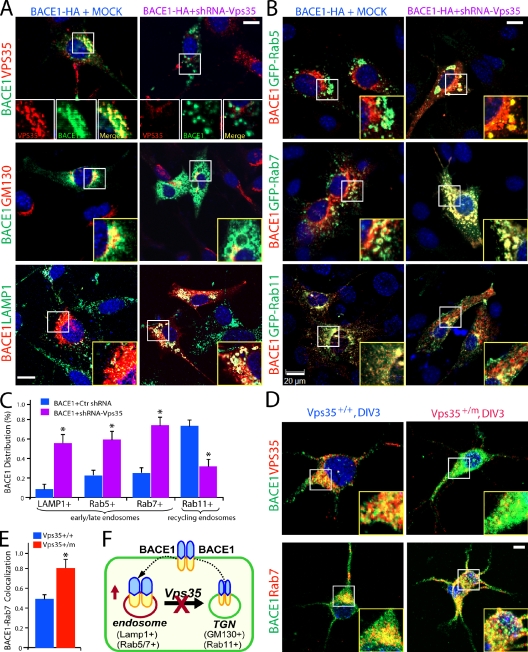
“In cells whose VPS35 expression was suppressed, BACE1 punctae were enlarged in size and no longer confined to the Golgi apparatus (Fig. 7 A).”
§ VPS35 haploinsufficiency increases Alzheimer’s disease neuropathology > Results > Increase of BACE1 in endosomal compartments in Vps35-deficient NLT cells and neurons
plaindirect- Asserted: passes — The authors put it forward as true.
- Checkable: passes — It can be checked against evidence.
- Load-bearing: passes — The paper’s conclusions depend on it.
- Based: passes — The paper gives a reason why it holds.
It may state two separate claims as one.
A result the paper reports from its own data — it cites no other source for it, so there is none to check. The quote shows it is in the paper.
In the paper
“Transfection of shRNA-Vps35 or miRNA-Vps35, but not control (a scrambled miRNA), inhibited expression of cotransfected Flag-Vps35 in HEK293 cells (Fig. S5 A) and endogenous VPS35 in NLT cells (Fig. S5 B).”
§ VPS35 haploinsufficiency increases Alzheimer’s disease neuropathology > Results > Increase of BACE1 in endosomal compartments in Vps35-deficient NLT cells and neurons
plaindirect- Asserted: passes — The authors put it forward as true.
- Checkable: passes — It can be checked against evidence.
- Load-bearing: passes — The paper’s conclusions depend on it.
- Based: passes — The paper gives a reason why it holds.
It may state two separate claims as one.
A result the paper reports from its own data — it cites no other source for it, so there is none to check. The quote shows it is in the paper.
In the paper
“The double mutant mice (Vps35+/m;Tg2576+/−) display impairments in NMDA and AMPA receptor-mediated synaptic transmission and synaptic plasticity (LTP) but not GABAergic transmission.”
§ VPS35 haploinsufficiency increases Alzheimer’s disease neuropathology > Discussion
plain- Asserted: passes — The authors put it forward as true.
- Checkable: passes — It can be checked against evidence.
- Load-bearing: passes — The paper’s conclusions depend on it.
- Based: passes — The paper gives a reason why it holds.
It may state two separate claims as one.
A result the paper reports from its own data — it cites no other source for it, so there is none to check. The quote shows it is in the paper.
In the paper
“Note that the hippocampus of Vps35+/m in the WT background also exhibits an increase of Aβ levels, a decrease of synaptic activity (both NMDA and AMPA currents), and a loss of synapses (decrease of frequency of mEPSCs) but without obvious defects on cognitive learning and memory or LTP (Figs. 1–4).”
§ VPS35 haploinsufficiency increases Alzheimer’s disease neuropathology > Discussion
plaindirect- Asserted: passes — The authors put it forward as true.
- Checkable: passes — It can be checked against evidence.
- Load-bearing: passes — The paper’s conclusions depend on it.
- Based: passes — The paper gives a reason why it holds.
It may state two separate claims as one.
In the paper
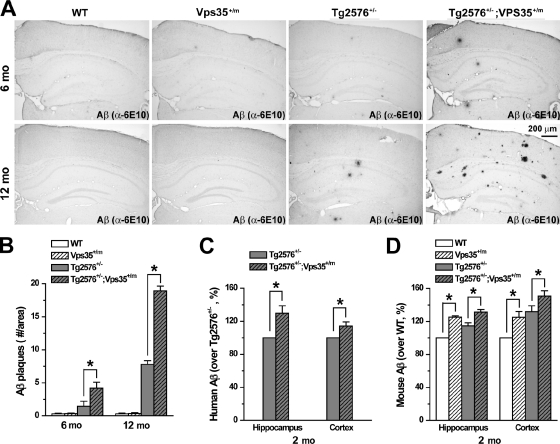
“Aβ deposits were rare in 6-mo-old Tg2576+/− brain but increased in number and size in 12-mo-old samples (Fig. 4, A and B), which is in agreement with a previous study (Hsiao et al., 1996).”
§ VPS35 haploinsufficiency increases Alzheimer’s disease neuropathology > Results > Increase of Aβ deposits and Aβ40/42 in mouse hippocampus and cerebral cortex by loss of Vps35 function
What the sources say
- Not checked — no full text of the sourcecites Hsiao et al., 1996 source
plain- Asserted: passes — The authors put it forward as true.
- Checkable: passes — It can be checked against evidence.
- Load-bearing: unclear — It is unclear whether the paper’s conclusions depend on it.
- Based: passes — The paper gives a reason why it holds.
It may state two separate claims as one.
A result the paper reports from its own data — it cites no other source for it, so there is none to check. The quote shows it is in the paper.
In the paper
“Both the posttetanic potentiation and LTP were reduced in 4-mo-old Vps35+/m;Tg2576+/− CA1 hippocampus (Fig. 2, E and F).”
§ VPS35 haploinsufficiency increases Alzheimer’s disease neuropathology > Results > Acceleration of Tg2576-associated synaptic plasticity and glutamatergic transmission phenotypes by loss of VPS35 function
plaindirect- Asserted: passes — The authors put it forward as true.
- Checkable: passes — It can be checked against evidence.
- Load-bearing: passes — The paper’s conclusions depend on it.
- Based: passes — The paper gives a reason why it holds.
It may state two separate claims as one.
A result the paper reports from its own data — it cites no other source for it, so there is none to check. The quote shows it is in the paper.
In the paper
“Fig. S2 depicts the normal inhibitory synaptic transmission in hippocampal CA1 pyramidal neurons of Tg2576+/−;Vps35+/m mice.”
§ VPS35 haploinsufficiency increases Alzheimer’s disease neuropathology > Materials and methods > Online supplemental material
plain- Asserted: passes — The authors put it forward as true.
- Checkable: passes — It can be checked against evidence.
- Load-bearing: fails — The paper’s conclusions may not depend on it.
- Based: passes — The paper gives a reason why it holds.
Probably not a substantial claim. The paper’s conclusions may not depend on it.
A result the paper reports from its own data — it cites no other source for it, so there is none to check. The quote shows it is in the paper.
In the paper
“Elevated mouse Aβ40 level was also detected in the hippocampus and cortex of 4–6-mo-old Vps35+/m mice (compared with the WT controls) and Tg2576+/−;Vps35+/m mutant mice (compared with the Tg2576+/− mice; unpublished data).”
§ VPS35 haploinsufficiency increases Alzheimer’s disease neuropathology > Results > Increase of Aβ deposits and Aβ40/42 in mouse hippocampus and cerebral cortex by loss of Vps35 function
plaincorrelational- Asserted: passes — The authors put it forward as true.
- Checkable: passes — It can be checked against evidence.
- Load-bearing: passes — The paper’s conclusions depend on it.
- Based: passes — The paper gives a reason why it holds.
It may state two separate claims as one.
A result the paper reports from its own data — it cites no other source for it, so there is none to check. The quote shows it is in the paper.
In the paper
“Remarkably, Vps35 heterozygotes;Tg2576 mice demonstrated an earlier onset of AD-like neuropathology, including cognitive deficits, impaired glutamatergic transmission, and synaptic plasticity, and more Aβ-positive plaques detected in the brain.”
§ VPS35 haploinsufficiency increases Alzheimer’s disease neuropathology > Introduction
boosteddirect- Asserted: passes — The authors put it forward as true.
- Checkable: passes — It can be checked against evidence.
- Load-bearing: passes — The paper’s conclusions depend on it.
- Based: passes — The paper gives a reason why it holds.
It may state two separate claims as one.
A result the paper reports from its own data — it cites no other source for it, so there is none to check. The quote shows it is in the paper.
In the paper
“Neither the frequency nor the amplitude of mIPSCs or eIPSCs was altered in the double mutant hippocampus (Fig. S2).”
§ VPS35 haploinsufficiency increases Alzheimer’s disease neuropathology > Results > Acceleration of Tg2576-associated synaptic plasticity and glutamatergic transmission phenotypes by loss of VPS35 function
plain- Asserted: passes — The authors put it forward as true.
- Checkable: passes — It can be checked against evidence.
- Load-bearing: passes — The paper’s conclusions depend on it.
- Based: passes — The paper gives a reason why it holds.
It may state two separate claims as one.
A result the paper reports from its own data — it cites no other source for it, so there is none to check. The quote shows it is in the paper.
In the paper
“Subcellularly, VPS35 appeared to be enriched in dendrites that were labeled by MAP2, a dendritic marker in both the cortex and the CA1–3 regions of the hippocampus (Fig. 5 D).”
§ VPS35 haploinsufficiency increases Alzheimer’s disease neuropathology > Results > Expression of VPS35 in hippocampal and layer IV–V cortical pyramidal neurons and interaction of VPS35 with BACE1
hedgedcorrelational- Asserted: passes — The authors put it forward as true.
- Checkable: passes — It can be checked against evidence.
- Load-bearing: fails — The paper’s conclusions may not depend on it.
- Based: passes — The paper gives a reason why it holds.
Probably not a substantial claim. The paper’s conclusions may not depend on it.
A result the paper reports from its own data — it cites no other source for it, so there is none to check. The quote shows it is in the paper.
In the paper
“Note that Tg2576+/− and Vps35+/m mutants also showed reductions of the amplitudes and frequencies of both AMPA and NMDA receptor-mediated mEPSCs and the amplitudes of both evoked AMPA and NMDA receptor-mediated EPSCs as compared with the WT control (Fig. 3, A–G), but these reductions were not statistically significant.”
§ VPS35 haploinsufficiency increases Alzheimer’s disease neuropathology > Results > Acceleration of Tg2576-associated synaptic plasticity and glutamatergic transmission phenotypes by loss of VPS35 function
plain- Asserted: passes — The authors put it forward as true.
- Checkable: passes — It can be checked against evidence.
- Load-bearing: unclear — It is unclear whether the paper’s conclusions depend on it.
- Based: passes — The paper gives a reason why it holds.
It may state two separate claims as one.
A result the paper reports from its own data — it cites no other source for it, so there is none to check. The quote shows it is in the paper.
In the paper
“The β-gal activity was detectable in many layers or regions of the cortex and the hippocampus in neonatal mice but became restricted to layers IV–V in the cortex and CA2–3 regions of the hippocampus in adult mice (Fig. 5, A and B; and Fig. S4).”
§ VPS35 haploinsufficiency increases Alzheimer’s disease neuropathology > Results > Expression of VPS35 in hippocampal and layer IV–V cortical pyramidal neurons and interaction of VPS35 with BACE1
plain- Asserted: passes — The authors put it forward as true.
- Checkable: passes — It can be checked against evidence.
- Load-bearing: unclear — It is unclear whether the paper’s conclusions depend on it.
- Based: passes — The paper gives a reason why it holds.
It may state two separate claims as one. The quote only partly states this claim.
A result the paper reports from its own data — it cites no other source for it, so there is none to check. The quote shows it is in the paper.
In the paper
“C99 levels were increased in Tg2576+/−;Vps35+/m (Fig. 8, B–D)”
§ VPS35 haploinsufficiency increases Alzheimer’s disease neuropathology > Results > Increased BACE1-mediated cleavage of APP and BACE1 activity in VPS35 mutant mice
plaincorrelational- Asserted: passes — The authors put it forward as true.
- Checkable: passes — It can be checked against evidence.
- Load-bearing: passes — The paper’s conclusions depend on it.
- Based: passes — The paper gives a reason why it holds.
The quote only partly states this claim.
A result the paper reports from its own data — it cites no other source for it, so there is none to check. The quote shows it is in the paper.
In the paper
“Remarkably, the double mutant mice (Vps35+/m;Tg2576+/−) develop AD-like phenotypes at the age of 2/3 mo old, featured with cognitive memory deficit, synaptic plasticity (LTP) impairments, decrease of glutamatergic transmissions, and increase of Aβ levels (Figs. 1–4).”
§ VPS35 haploinsufficiency increases Alzheimer’s disease neuropathology > Discussion
boosteddirect- Asserted: passes — The authors put it forward as true.
- Checkable: passes — It can be checked against evidence.
- Load-bearing: passes — The paper’s conclusions depend on it.
- Based: passes — The paper gives a reason why it holds.
It may state two separate claims as one.
A result the paper reports from its own data — it cites no other source for it, so there is none to check. The quote shows it is in the paper.
In the paper
“suppression of VPS35 expression increased BACE1 localization in both Rab5- and Rab7-positive endosomal compartments but reduced BACE1 in Rab11-labeled recycling endosomes.”
§ VPS35 haploinsufficiency increases Alzheimer’s disease neuropathology > Results > Increase of BACE1 in endosomal compartments in Vps35-deficient NLT cells and neurons
plaindirect- Asserted: passes — The authors put it forward as true.
- Checkable: passes — It can be checked against evidence.
- Load-bearing: passes — The paper’s conclusions depend on it.
- Based: passes — The paper gives a reason why it holds.
It may state two separate claims as one.
None of the sources cited for this claim have been checked yet.
In the paper
“β-secretase, also called BACE1, is essential for this event (Hussain et al., 1999; Sinha et al., 1999; Vassar et al., 1999, 2009; Yan et al., 1999; Tanzi and Bertram, 2005; Bertram and Tanzi, 2008).”
§ VPS35 haploinsufficiency increases Alzheimer’s disease neuropathology > Introduction
What the sources say
plaindirect- Asserted: passes — The authors put it forward as true.
- Checkable: passes — It can be checked against evidence.
- Load-bearing: fails — The paper’s conclusions may not depend on it.
- Based: passes — The paper gives a reason why it holds.
Probably not a substantial claim. The paper’s conclusions may not depend on it.
In the paper
“Moreover, VPS26 heterozygote mice show increased levels of endogenous Aβ and impaired LTP (Muhammad et al., 2008).”
§ VPS35 haploinsufficiency increases Alzheimer’s disease neuropathology > Introduction
What the sources say
- Not checked — no full text of the sourcecites Muhammad et al., 2008 source
plaindirect- Asserted: passes — The authors put it forward as true.
- Checkable: passes — It can be checked against evidence.
- Load-bearing: passes — The paper’s conclusions depend on it.
- Based: passes — The paper gives a reason why it holds.
It may state two separate claims as one.
None of the sources cited for this claim have been checked yet.
In the paper
“Collectively, these lines of evidence from pathological, genetic, biochemical, and physiological studies have indicated a crucial role of Aβ in the etiology of AD.”
§ VPS35 haploinsufficiency increases Alzheimer’s disease neuropathology > Introduction
hedgeddirect- Asserted: passes — The authors put it forward as true.
- Checkable: passes — It can be checked against evidence.
- Load-bearing: fails — The paper’s conclusions may not depend on it.
- Based: passes — The paper gives a reason why it holds.
Probably not a substantial claim. The paper’s conclusions may not depend on it.
A claim is checked only against the cited paper’s full text, never its abstract, and none is available for its sources.
In the paper
“BACE1 activity is increased in postmortem brains of AD patients and in brains of AD mouse models (Fukumoto et al., 2002; Yang et al., 2003).”
§ VPS35 haploinsufficiency increases Alzheimer’s disease neuropathology > Introduction
What the sources say
plaincorrelational- Asserted: passes — The authors put it forward as true.
- Checkable: passes — It can be checked against evidence.
- Load-bearing: fails — The paper’s conclusions may not depend on it.
- Based: passes — The paper gives a reason why it holds.
Probably not a substantial claim. The paper’s conclusions may not depend on it. It may state two separate claims as one.
A conclusion the paper draws from its own results — it cites no other source for it, so there is none to check. The quote shows it is in the paper.
In the paper
“The retromer complex component VPS35 prevents activation of the BACE1 and Aβ production and thus plays an essential role in limiting Alzheimer’s disease neuropathology.”
- Also stated in: § Increase of Aβ deposits and Aβ40/42 in mouse hippocampus and cerebral cortex by loss of Vps35 function · hedged
“Together, these data suggest that VPS35 negatively regulates Aβ production and support the view that increased Aβ levels may be a key detrimental factor for the cognitive and LTP deficits associated with the AD mice.”
§ VPS35 haploinsufficiency increases Alzheimer’s disease neuropathology > Abstract
plaindirect- Asserted: passes — The authors put it forward as true.
- Checkable: passes — It can be checked against evidence.
- Load-bearing: passes — The paper’s conclusions depend on it.
- Based: passes — The paper gives a reason why it holds.
It may state two separate claims as one.
- Also stated in: § Increase of Aβ deposits and Aβ40/42 in mouse hippocampus and cerebral cortex by loss of Vps35 function · hedged
What the paper did — it cites no source for this, so there is none to check. The quote shows it is in the paper.
In the paper
“Neurons with a resting potential of at least −60 mV and resistance fluctuated within 15% of initial values (<20 MΩ) were analyzed.”
§ VPS35 haploinsufficiency increases Alzheimer’s disease neuropathology > Materials and methods > Electrophysiological recording
plain- Asserted: passes — The authors put it forward as true.
- Checkable: passes — It can be checked against evidence.
- Load-bearing: fails — The paper’s conclusions may not depend on it.
- Based: passes — The paper gives a reason why it holds.
Probably not a substantial claim. The paper’s conclusions may not depend on it.
A conclusion the paper draws from its own results — it cites no other source for it, so there is none to check. The quote shows it is in the paper.
In the paper
“Thus, these results support the notion that loss of VPS35 function leads to an increase of BACE1 activity and thus Aβ production.”
§ VPS35 haploinsufficiency increases Alzheimer’s disease neuropathology > Results > Increased BACE1-mediated cleavage of APP and BACE1 activity in VPS35 mutant mice
hedgeddirect- Asserted: passes — The authors put it forward as true.
- Checkable: passes — It can be checked against evidence.
- Load-bearing: passes — The paper’s conclusions depend on it.
- Based: passes — The paper gives a reason why it holds.
It may state two separate claims as one.
None of the sources cited for this claim have been checked yet.
In the paper
“In the Schaffer collateral (SC) pathway (SC-CA1), the deficiency was not detectable until 12–18 mo old (Chapman et al., 1999; Fitzjohn et al., 2001).”
§ VPS35 haploinsufficiency increases Alzheimer’s disease neuropathology > Results > Acceleration of Tg2576-associated synaptic plasticity and glutamatergic transmission phenotypes by loss of VPS35 function
What the sources say
plain- Asserted: passes — The authors put it forward as true.
- Checkable: passes — It can be checked against evidence.
- Load-bearing: fails — The paper’s conclusions may not depend on it.
- Based: passes — The paper gives a reason why it holds.
Probably not a substantial claim. The paper’s conclusions may not depend on it.
What the paper did — it cites no source for this, so there is none to check. The quote shows it is in the paper.
In the paper
“Control littermates (WT, Vps35+/m, and Tg2576+/−) and Tg2576+/−;Vps35+/m were processed in parallel for each experiment.”
§ VPS35 haploinsufficiency increases Alzheimer’s disease neuropathology > Materials and methods > Reagents and animals
plain- Asserted: passes — The authors put it forward as true.
- Checkable: passes — It can be checked against evidence.
- Load-bearing: fails — The paper’s conclusions may not depend on it.
- Based: passes — The paper gives a reason why it holds.
Probably not a substantial claim. The paper’s conclusions may not depend on it.
In the paper
“Identification of mutations in APP and presenilins in the early-onset AD provides a strong genetic support for the amyloid hypothesis (Hardy and Selkoe, 2002).”
§ VPS35 haploinsufficiency increases Alzheimer’s disease neuropathology > Discussion
What the sources say
- Not checked — no full text of the sourcecites Hardy and Selkoe, 2002 source
boostedcorrelational- Asserted: passes — The authors put it forward as true.
- Checkable: passes — It can be checked against evidence.
- Load-bearing: fails — The paper’s conclusions may not depend on it.
- Based: passes — The paper gives a reason why it holds.
Probably not a substantial claim. The paper’s conclusions may not depend on it.
A conclusion the paper draws from its own results — it cites no other source for it, so there is none to check. The quote shows it is in the paper.
In the paper
“The increased Aβ levels in both Vps35+/m and Vps35+/m;Tg2576 mutant mice (Fig. 4, C and D) suggest a role for VPS35 not only in regulating WT APP, but also APPswe, metabolism.”
§ VPS35 haploinsufficiency increases Alzheimer’s disease neuropathology > Discussion
hedgeddirect- Asserted: passes — The authors put it forward as true.
- Checkable: passes — It can be checked against evidence.
- Load-bearing: passes — The paper’s conclusions depend on it.
- Based: passes — The paper gives a reason why it holds.
It may state two separate claims as one.
What the paper did — it cites no source for this, so there is none to check. The quote shows it is in the paper.
In the paper
“Tg2576 and Vps35 mutations were confirmed by genotyping using PCR (Fig. S1 B).”
§ VPS35 haploinsufficiency increases Alzheimer’s disease neuropathology > Materials and methods > Reagents and animals
plain- Asserted: passes — The authors put it forward as true.
- Checkable: passes — It can be checked against evidence.
- Load-bearing: passes — The paper’s conclusions depend on it.
- Based: passes — The paper gives a reason why it holds.
Probably not a substantial claim. It may state two separate claims as one.
A claim is checked only against the cited paper’s full text, never its abstract, and none is available for its sources.
In the paper
“They are also observed in 8-mo or older Tg2576 mice that express APPswe (Hsiao et al., 1996; Chapman et al., 1999; Rockenstein et al., 2007).”
§ VPS35 haploinsufficiency increases Alzheimer’s disease neuropathology > Results > Genetic enhancement and earlier onset of Tg2576-associated cognitive deficit by loss of VPS35 function
What the sources say
plain- Asserted: passes — The authors put it forward as true.
- Checkable: passes — It can be checked against evidence.
- Load-bearing: fails — The paper’s conclusions may not depend on it.
- Based: passes — The paper gives a reason why it holds.
Probably not a substantial claim. The paper’s conclusions may not depend on it.
A claim is checked only against the cited paper’s full text, never its abstract, and none is available for its sources.
In the paper
“it is reported that APPswe exhibits a much higher affinity to BACE1 as compared with the WT APP, and APPswe may be cleaved by BACE1 at the TGN, whereas WT APP may be cleaved at the endosome compartments (Haass et al., 1995; Selkoe et al., 1996; Thinakaran and Koo, 2008).”
§ VPS35 haploinsufficiency increases Alzheimer’s disease neuropathology > Discussion
What the sources say
hedgedconditional- Asserted: passes — The authors put it forward as true.
- Checkable: passes — It can be checked against evidence.
- Load-bearing: fails — The paper’s conclusions may not depend on it.
- Based: passes — The paper gives a reason why it holds.
Probably not a substantial claim. The paper’s conclusions may not depend on it. It may state two separate claims as one.
The paper states this without a source or data behind it here, so there is nothing to check it against. The quote shows it is in the paper.
In the paper
“The retromer selectively mediates retrograde transport of multiple transmembrane proteins from the endosomes to the TGN.”
§ VPS35 haploinsufficiency increases Alzheimer’s disease neuropathology > Introduction
plaindirect- Asserted: passes — The authors put it forward as true.
- Checkable: passes — It can be checked against evidence.
- Load-bearing: passes — The paper’s conclusions depend on it.
- Based: passes — The paper gives a reason why it holds.
Probably not a substantial claim.
The paper states this without a source or data behind it here, so there is nothing to check it against. The quote shows it is in the paper.
In the paper
“The cargo-selective complex is a trimer of vacuolar protein sorting (Vps) proteins VPS35, VPS29, and VPS26 that sorts cargos into tubules for retrieval to the Golgi apparatus.”
§ VPS35 haploinsufficiency increases Alzheimer’s disease neuropathology > Introduction
plain- Asserted: passes — The authors put it forward as true.
- Checkable: passes — It can be checked against evidence.
- Load-bearing: passes — The paper’s conclusions depend on it.
- Based: passes — The paper gives a reason why it holds.
Probably not a substantial claim. It may state two separate claims as one.
A conclusion the paper draws from its own results — it cites no other source for it, so there is none to check. The quote shows it is in the paper.
In the paper
“our work provides strong evidence for VPS35 to be a crucial component in BACE1 trafficking, APP metabolism, and hippocampal neuronal synaptic function”
§ VPS35 haploinsufficiency increases Alzheimer’s disease neuropathology > Discussion
boosteddirect- Asserted: passes — The authors put it forward as true.
- Checkable: passes — It can be checked against evidence.
- Load-bearing: passes — The paper’s conclusions depend on it.
- Based: passes — The paper gives a reason why it holds.
It may state two separate claims as one.
A conclusion the paper draws from its own results — it cites no other source for it, so there is none to check. The quote shows it is in the paper.
In the paper
“These results support an interaction between VPS35 and BACE1 in vitro and in vivo”
§ VPS35 haploinsufficiency increases Alzheimer’s disease neuropathology > Results > Expression of VPS35 in hippocampal and layer IV–V cortical pyramidal neurons and interaction of VPS35 with BACE1
plaincorrelational- Asserted: passes — The authors put it forward as true.
- Checkable: passes — It can be checked against evidence.
- Load-bearing: passes — The paper’s conclusions depend on it.
- Based: passes — The paper gives a reason why it holds.
It may state two separate claims as one.
What the paper did — it cites no source for this, so there is none to check. The quote shows it is in the paper.
In the paper
“Behavioral analysis was performed with 1–2-, 3-, and 6-mo old mice by investigators unaware of their genotype.”
§ VPS35 haploinsufficiency increases Alzheimer’s disease neuropathology > Materials and methods > Behavior tests
plain- Asserted: passes — The authors put it forward as true.
- Checkable: passes — It can be checked against evidence.
- Load-bearing: fails — The paper’s conclusions may not depend on it.
- Based: passes — The paper gives a reason why it holds.
Probably not a substantial claim. The paper’s conclusions may not depend on it.
A conclusion the paper draws from its own results — it cites no other source for it, so there is none to check. The quote shows it is in the paper.
In the paper
“Thus, these results demonstrate a decrease of glutamatergic, but not GABAnergic, neurotransmission, likely at the postsynaptic sites of the young adult double mutant hippocampus.”
§ VPS35 haploinsufficiency increases Alzheimer’s disease neuropathology > Results > Acceleration of Tg2576-associated synaptic plasticity and glutamatergic transmission phenotypes by loss of VPS35 function
hedgeddirect- Asserted: passes — The authors put it forward as true.
- Checkable: passes — It can be checked against evidence.
- Load-bearing: passes — The paper’s conclusions depend on it.
- Based: passes — The paper gives a reason why it holds.
It may state two separate claims as one.
A conclusion the paper draws from its own results — it cites no other source for it, so there is none to check. The quote shows it is in the paper.
In the paper
“These results demonstrate that Aβ deposits occurred in higher frequency and in younger Vps35+/m;Tg2576+/− mice than that in Tg2576 mice.”
§ VPS35 haploinsufficiency increases Alzheimer’s disease neuropathology > Results > Increase of Aβ deposits and Aβ40/42 in mouse hippocampus and cerebral cortex by loss of Vps35 function
boostedcorrelational- Asserted: passes — The authors put it forward as true.
- Checkable: passes — It can be checked against evidence.
- Load-bearing: passes — The paper’s conclusions depend on it.
- Based: passes — The paper gives a reason why it holds.
It may state two separate claims as one.
A conclusion the paper draws from its own results — it cites no other source for it, so there is none to check. The quote shows it is in the paper.
In the paper
“Collectively, the data presented in this manuscript suggest an important function of VPS35 in suppression of BACE1 activation and Aβ production, thus preventing AD-associated memory cognitive deficits and impairment of glutamatergic synaptic activity.”
§ VPS35 haploinsufficiency increases Alzheimer’s disease neuropathology > Discussion
hedgeddirect- Asserted: passes — The authors put it forward as true.
- Checkable: passes — It can be checked against evidence.
- Load-bearing: passes — The paper’s conclusions depend on it.
- Based: passes — The paper gives a reason why it holds.
It may state two separate claims as one.
What the paper did — it cites no source for this, so there is none to check. The quote shows it is in the paper.
In the paper
“The authenticity of all constructs was verified by DNA sequencing.”
§ VPS35 haploinsufficiency increases Alzheimer’s disease neuropathology > Materials and methods > Expression vectors
plain- Asserted: passes — The authors put it forward as true.
- Checkable: passes — It can be checked against evidence.
- Load-bearing: fails — The paper’s conclusions may not depend on it.
- Based: passes — The paper gives a reason why it holds.
Probably not a substantial claim. The paper’s conclusions may not depend on it.
A conclusion the paper draws from its own results — it cites no other source for it, so there is none to check. The quote shows it is in the paper.
In the paper
“Depletion of Vps35 expression in culture increases BACE1 localization to the endosomal compartments (Fig. 7), an acidic environment favoring BACE1 activation.”
§ VPS35 haploinsufficiency increases Alzheimer’s disease neuropathology > Discussion
plaindirect- Asserted: passes — The authors put it forward as true.
- Checkable: passes — It can be checked against evidence.
- Load-bearing: passes — The paper’s conclusions depend on it.
- Based: passes — The paper gives a reason why it holds.
It may state two separate claims as one.
- Rests on an assumption: BACE1 cleavage of APP is favored in endosomal compartments.
What the paper did — it cites no source for this, so there is none to check. The quote shows it is in the paper.
In the paper
“Fig. S5 shows the suppression of Vps35 expression by both shRNA and miRNA-Vps35.”
§ VPS35 haploinsufficiency increases Alzheimer’s disease neuropathology > Materials and methods > Online supplemental material
boosteddirect- Asserted: passes — The authors put it forward as true.
- Checkable: passes — It can be checked against evidence.
- Load-bearing: fails — The paper’s conclusions may not depend on it.
- Based: passes — The paper gives a reason why it holds.
Probably not a substantial claim. The paper’s conclusions may not depend on it. It may state two separate claims as one.
A conclusion the paper draws from its own results — it cites no other source for it, so there is none to check. The quote shows it is in the paper.
In the paper
“Together, these results indicate that loss of Vps35 promotes BACE1-mediated cleavage of APP or APPswe, thereby increasing Aβ production.”
§ VPS35 haploinsufficiency increases Alzheimer’s disease neuropathology > Results > Increased BACE1-mediated cleavage of APP and BACE1 activity in VPS35 mutant mice
hedgeddirect- Asserted: passes — The authors put it forward as true.
- Checkable: passes — It can be checked against evidence.
- Load-bearing: passes — The paper’s conclusions depend on it.
- Based: passes — The paper gives a reason why it holds.
It may state two separate claims as one.
The authors state this as an assumption.
The mechanisms by which the retromer is involved in Alzheimer’s disease pathogenesis remain elusive.
“However, the underlying mechanisms remain elusive.”
The paper relies on this without support.
Aβ40/42 production requires BACE1.
“Aβ40/42 production requires BACE1.”
The paper relies on this without support.
Retromer is implicated in the pathogenesis of late-onset AD.
“Although retromer is implicated in the pathogenesis of late-onset AD, the function of VPS35 in AD pathology and the underlying molecular mechanisms remain largely unclear.”
The paper relies on this without support.
The function of VPS35 in AD pathology and the underlying molecular mechanisms remain largely unclear.
“Although retromer is implicated in the pathogenesis of late-onset AD, the function of VPS35 in AD pathology and the underlying molecular mechanisms remain largely unclear.”
The paper relies on this without support.
BACE1 cleavage of APP is favored in endosomal compartments.
“increased BACE1 localization to the endosomal compartments where the BACE1 cleavage of APP is favored”
Claims other papers make about this one
Each is checked against this paper’s own text: does it say what the citing paper says it does?
The cited source says what the claim attributes to it.
In the citing paper
“By suppressing protein expression rather than using a knockout (KO) model our approach is physiologically relevant to neurodegenerative patients where Retromer levels are reduced, in contrast with Retromer KO which is embryonically lethal [78].”
From Global identification of neuronal and astrocytic integral membrane proteins that require Retromer for their endosomal recycling (2026) · cites this paper as [78]
The cited source says what the claim attributes to it.
In the citing paper
“most in vivo mouse studies have been performed in transgenic mice engineered to overexpress human mutations in APP and PSEN1/2 (Wen et al., 2011; Li et al., 2019a) or FTD-associated mutations in the tau gene MAPT (Vagnozzi et al., 2019; Carosi et al., 2020).”
From The neuronal retromer can regulate both neuronal and microglial phenotypes of Alzheimer's disease (2022) · cites this paper as Wen et al., 2011
Self-check
Percentages, sums and reported differences re-computed from the paper’s own numbers.
Each contradiction between two passages listed here was confirmed by an independent check.
Rated minor: it would not touch a result — a value no result rests on, a p-value that stays on the same side of the significance level, or a conflict that is clerical, resolved elsewhere in the paper, or outside its own findings.
In the paper
§ VPS35 haploinsufficiency increases Alzheimer’s disease neuropathology > Results > Expression of VPS35 in hippocampal and layer IV–V cortical pyramidal neurons and interaction of VPS35 with BACE1
“The β-gal activity was detectable in many layers or regions of the cortex and the hippocampus in neonatal mice but became restricted to layers IV–V in the cortex and CA2–3 regions of the hippocampus in adult mice (Fig. 5, A and B; and Fig. S4).”
§ VPS35 haploinsufficiency increases Alzheimer’s disease neuropathology > Results > Expression of VPS35 in hippocampal and layer IV–V cortical pyramidal neurons and interaction of VPS35 with BACE1
“LacZ activity was only detected in Vps35+/m but not WT and was largely expressed in layer IV–V cortical neurons and CA1–3 hippocampus.”
Rated minor: it would not touch a result — a value no result rests on, a p-value that stays on the same side of the significance level, or a conflict that is clerical, resolved elsewhere in the paper, or outside its own findings.
In the paper
§ VPS35 haploinsufficiency increases Alzheimer’s disease neuropathology > Results > Increased BACE1-mediated cleavage of APP and BACE1 activity in VPS35 mutant mice
“Equal amounts of homogenates (50 µg of protein) were loaded and revealed by immunoblot (IB) using anti–β-actin antibody.”
§ VPS35 haploinsufficiency increases Alzheimer’s disease neuropathology > Materials and methods > Western blot analysis of APP cleavage products
“Specifically, samples (40 µg) were separated by 16% Tris-Tricine SDS-PAGE and electrophoretically transferred onto nitrocellulose membrane at 380 mA for 60 min.”
Citations
Cites
The Amyloid Hypothesis of Alzheimer’s Disease: Progress and Problems on the Road to Therapeutics
Hardy, J., & Selkoe, D. J. (2002) · Science · doi:10.1126/science.1072994 · Cited by 13,864
Alzheimer's Disease Is a Synaptic Failure
Selkoe, D. J. (2002) · Science · doi:10.1126/science.1074069 · Cited by 4,420
Correlative Memory Deficits, Aβ Elevation, and Amyloid Plaques in Transgenic Mice
Hsiao, K., Chapman, P., Nilsen, S., Eckman, C., Harigaya, Y., Younkin, S., Yang, F., & Cole, G. (1996) · Science · doi:10.1126/science.274.5284.99 · Cited by 4,210
Vassar, R., Bennett, B. D., Babu-Khan, S., Kahn, S., Mendiaz, E. A., Denis, P., Teplow, D. B., Ross, S., Amarante, P., Loeloff, R., et al. (1999) · Science · doi:10.1126/science.286.5440.735 · Cited by 3,876 · cited 2×
“Moreover, double mutant mice at 1–2 mo for this event (Hussain et al., 1999; Sinha et al., 1999; Vassar et al., 1999, 2009; Yan et al., 1999; Tanzi and Bertram, 2005; Bertram and Tanzi, 2008).”
BackgroundTwenty years of the Alzheimer's disease amyloid hypothesis: a genetic perspective
Tanzi, R. E., & Bertram, L. (2005) · Cell · doi:10.1016/j.cell.2005.02.008 · Cited by 1,849
Purification and cloning of amyloid precursor protein β-secretase from human brain
Sinha, S., Anderson, J. P., Barbour, R., Basi, G. S., Caccavello, R., Davis, D., Doan, M., Dovey, H. F., Frigon, N., Hong, J., et al. (1999) · Nature · doi:10.1038/990114 · Cited by 1,612
Membrane-anchored aspartyl protease with Alzheimer's disease β-secretase activity
Yan, R., Bienkowski, M. J., Shuck, M. E., Miao, H., Tory, M. C., Pauley, A. M., Brashler, J. R., Stratman, N. C., Mathews, W. R., Buhl, A. E., et al. (1999) · Nature · doi:10.1038/990107 · Cited by 1,438
Self-citationThe neuronal sortilin-related receptor SORL1 is genetically associated with Alzheimer disease
Rogaeva, E., Meng, Y., Lee, J. H., Gu, Y., Kawarai, T., Zou, F., Katayama, T., Baldwin, C. T., Cheng, R., Hasegawa, H., et al. (2007) · Nature Genetics · doi:10.1038/ng1943 · Cited by 1,167
Amyloid Precursor Protein Trafficking, Processing, and Function
Thinakaran, G., & Koo, E. H. (2008) · Journal of Biological Chemistry · doi:10.1074/jbc.r800019200 · Cited by 1,141
Identification of a Novel Aspartic Protease (Asp 2) as β-Secretase
Hussain, I., Powell, D., Howlett, D. R., Tew, D. G., Meek, T. D., Chapman, C., Gloger, I. S., Murphy, K. E., Southan, C. D., Ryan, D. M., et al. (1999) · Molecular and Cellular Neuroscience · doi:10.1006/mcne.1999.0811 · Cited by 1,080
Cited by
Sorted by citations
Items 201–271 of 271
Bhardwaj, K., Jha, A., Roy, A., & Kumar, H. (2024) · Brain Research · doi:10.1016/j.brainres.2024.149204 · Cited by 7
Vps35-deficiency impairs SLC4A11 trafficking and promotes corneal dystrophy
Liu, W., Tang, F., Lin, S., Zhao, K., Mei, L., Ye, J., & Xiong, W. (2017) · PLoS ONE · doi:10.1371/journal.pone.0184906 · Cited by 7
Self-citationVPS35 haploinsufficiency increases Alzheimer's disease neuropathology
Wen, L., Tang, F., Hong, Y., Luo, S., Wang, C.-L., He, W., Shen, C., Jung, J.-U., Xiong, F., Lee, D., et al. (2011) · The Journal of Experimental Medicine · doi:10.1084/jem20813oia35 · Cited by 7
Self-citationDeliver on Time or Pay the Fine: Scheduling in Membrane Trafficking
Placidi, G., & Campa, C. C. (2021) · International Journal of Molecular Sciences · doi:10.3390/ijms222111773 · Cited by 6
Roque, M., de Souza, D. A. R., Rangel‐Sosa, M. M., Altounian, M., Hocine, M., Deloulme, J., Barbier, E., Mann, F., & Chauvet, S. (2022) · Molecular and Cellular Neuroscience · doi:10.1016/j.mcn.2022.103726 · Cited by 6
Bharathi, V., Zeng, Y., Armour, E. M., Yue, M., Citrano, K., Lovchykova, A., Reeves, M. M., Rawlinson, B. D., Deture, M. A., Dunmore, J. A., et al. (2026) · PLoS Biology · doi:10.1371/journal.pbio.3003573 · Cited by 5
Li, X.-Y., Zhang, S., & He, L. S. (2022) · BMC Genomic Data · doi:10.1186/s12863-022-01084-4 · Cited by 5
A Novel Neuroprotection Target With Distinct Regulation in Stroke and Alzheimer’s Disease
Gamir-Morralla, A., López‐Menéndez, C., Medina, M., & Iglesias, T. (2017) · Elsevier eBooks · doi:10.1016/b978-0-12-803690-7.00007-7 · Cited by 5
Li, J.-G., Blass, B. E., & Praticò, D. (2023) · Journal of Alzheimer's Disease · doi:10.3233/jad-220869 · Cited by 4
Liang, J., LaFleur, B., Hussainy, S., & Perry, G. L. (2023) · Journal of Alzheimer s Disease · doi:10.3233/jad-221241 · Cited by 4
The role of membrane trafficking and retromer complex in Parkinson's and Alzheimer's disease
Abdul‐Rahman, T., Ghosh, S., Kalmanovich, J. B., Awuah, W. A., Zivcevska, M., Khalifa, S., Bassey, E. E., Ali, N. A., Ferreira, M. M. D. S., Umar, T. P., et al. (2023) · Journal of Neuroscience Research · doi:10.1002/jnr.25261 · Cited by 4
Walsh, R. B., Becalska, A. N., Zunitch, M. J., Lemos, T., Dresselhaus, E. C., Lee, S. M., Wang, S., Isaac, B., Yeh, A., Koles, K., et al. (2019) · bioRxiv (Cold Spring Harbor Laboratory) · doi:10.1101/645713 · Cited by 4
Huang, Y., Chen, X., He, X., Guo, C., Sun, X., Liang, F., Long, S., Lu, X.-L., Feng, L., Guo, W., et al. (2017) · Molecular Medicine Reports · doi:10.3892/mmr.2017.6551 · Cited by 3
Exploring the triad: VPS35 , neurogenesis, and neurodegenerative diseases
Qiu, Z., Deng, X., Fu, Y., Jiang, M., & Cui, X. (2024) · Journal of Neurochemistry · doi:10.1111/jnc.16184 · Cited by 3
Associations of sorLA/SORL1 with Alzheimer's disease
Andersen, O. M., & Thakurta, I. G. (2015) · Receptors & Clinical Investigation · doi:10.14800/rci.700 · Cited by 3
Eleuteri, S., Fang, T. S. Z., Cutillo, G., Persico, M., & Simon, D. K. (2023) · Research Square · doi:10.21203/rs.3.rs-3417076/v1 · Cited by 3
Zhang, Y., Wu, Y., Zhang, X., Guo, S., He, J., Hu, N., Huang, Y., Kong, Y., Li, Q., Sui, A., et al. (2025) · British Journal of Pharmacology · doi:10.1111/bph.70124 · Cited by 2
The VPS35-D620N mutation is associated with Parkinson's disease and can be a target for gene therapyPreprint
Dowaidar, M. (2021) · OSF Preprints (OSF Preprints) · doi:10.31219/osf.io/83sxr · Cited by 2
VPS35 Deficiency Markedly Reduces the Proliferation of HEK293 Cells
Lee, S., Park, S., Bang, H., Kim, S.-U., Park, Y., Wee, G., Chae, U., & Kim, E. (2026) · Genes · doi:10.3390/genes17020177 · Cited by 1
γ-secretase facilitates retromer-mediated retrograde transport
Takeo, Y., Crite, M., Mehmood, K., & DiMaio, D. (2025) · Journal of Cell Science · doi:10.1242/jcs.263538 · Cited by 1
Investigating Autophagy Dysfunction Induced by a Parkinson's Disease-Causing Mutation in VPS35
Rahman, A. A. (2018) · ScholarWorks (Boise State University) · doi:10.18122/td/1488/boisestate · Cited by 1
Rôle du peptide amyloïde dans les maladies neurodégénératives
Combes, M. (2018) · theses.fr (ABES) · doi:10.70675/a219ef4dzbca0z4272z8bf2z74080a1976e5 · Cited by 1
Haggarty, S. J. (2014) · Wiley eBooks · doi:10.1002/9781118444122.ch31
Mechanisms of Wntless trafficking and Wnt signaling
de Groot, R. E. A. (2014) · Utrecht University Repository (Utrecht University)
VPS35 leaves endosomes lost in transition
Leslie, M. (2011) · The Journal of Cell Biology · doi:10.1083/jcb.1955iti1
Tam, J. H. K. (2015) · Scholarship@Western (Western University)
Sorting Nexin 27 Regulates Ab Production through Modulating g-Secretase Activity
Wang, X., Huang, T. Y., Hong, W., & Xu, H. (2014)
Rodent Models of Autosomal Dominant Parkinson Disease
Xiao, J., Vemula, S. R., & Yue, Z. (2014) · Elsevier eBooks · doi:10.1016/b978-0-12-405195-9.00018-4
Variants rares et analyse d'exomes : application à la maladie d'Alzheimer du sujet jeune
Guennec, K. L. (2017) · theses.fr (ABES) · doi:10.70675/a8d5f155z38b8z444dzb5eaz8426b28b16d0
Alpha-synuclein expression influences the processing of the amyloid precursor protein
Hall‐Roberts, H. (2016) · The University of Bath Online Publications Store (The University of Bath)
Nakatomi, M., & Neu, H. C. (1986) · PubMed
Identification of genetic modifiers in LRRK2 parkinsonism
Trinh, J. (2017) · cIRcle (University of British Columbia) · doi:10.14288/1.0340339
The endolysosomal system in neuronal physiology and pathology
Sanchez, S. V. (2019)
Vastrad, B. M., Vastrad, C. M., & Kotturshetti, I. (2020) · medRxiv · doi:10.1101/2020.12.21.20248688
Mitochondrial dysfunction and autophagy in neurodegeneration
Gupta, R. V., Ambasta, R. K., & Kumar, P. (2021) · Elsevier eBooks · doi:10.1016/b978-0-323-85666-9.00019-x
Kadgien, C., Kamesh, A., Khinda, J., Cao, L. P., Fox, J. D., Farrer, M. J., & Milnerwood, A. J. (2021) · Research Square · doi:10.21203/rs.3.rs-550445/v2
Kadgien, C., Kamesh, A., Khinda, J., Cao, L., Fox, J. D., Farrer, M. J., & Milnerwood, A. J. (2021) · Research Square · doi:10.21203/rs.3.rs-550445/v1
Endocytosis in β-amyloid biology and Alzheimer’s disease
Heckmann, B. L., & Green, D. R. (2022) · Elsevier eBooks · doi:10.1016/b978-0-323-89906-2.00009-5
Brault, J., Liu, Z., Bardin, S., Ladarré, D., Fraisier, V., Tchenio, A., Lenkei, Z., Salamero, J., Delevoye, C., Goud, B., et al. (2023) · bioRxiv (Cold Spring Harbor Laboratory) · doi:10.1101/2023.04.05.535676
Meier, S., Larsen, A. S. G., Wanke, F., Mercado, N., Mei, A., Takacs, L., Mracsko, E. Z., Collin, L., Kampmann, M., Roudnicky, F., et al. (2024) · bioRxiv (Cold Spring Harbor Laboratory) · doi:10.1101/2024.03.16.585330
The genetic basis of neurodegenerative disorders: Implications in Alzheimer's disease
Jilani, M. G., Hoque, M., Tabrez, S. S. M., & Ali, S. (2024) · Elsevier eBooks · doi:10.1016/b978-0-443-15540-6.00002-1
Kadgien, C., Kamesh, A., & Milnerwood, A. J. (2021) · Figshare · doi:10.6084/m9.figshare.16633340
Bono, K., Hara‐Miyauchi, C., Sumi, S., Oka, H., Iguchi, Y., & Okano, H. J. (2020) · Figshare · doi:10.6084/m9.figshare.13071235
Chen, X., Tsika, E., Levine, N. D., & Moore, D. J. (2023) · Figshare · doi:10.6084/m9.figshare.23884450
Liu, X.-Y., Wang, K., Deng, X.-H., Wei, Y.-H., Guo, R., Liu, S.-F., Zhu, Y.-F., Zhong, J.-J., Zheng, J.-Y., Wang, M., et al. (2023) · Figshare · doi:10.6084/m9.figshare.23292086
Self-citationLi, X.-Y., Zhang, S., & Li, H. (2022) · Figshare · doi:10.6084/m9.figshare.20705327
Bono, K., Hara‐Miyauchi, C., Sumi, S., Oka, H., Iguchi, Y., & Okano, H. (2020) · Figshare · doi:10.6084/m9.figshare.13070791
Wang, X., Xie, Y., Fan, X., Wu, X., Wang, D., & Zhu, L. (2024) · Figshare · doi:10.6084/m9.figshare.26728936
Bono, K., Hara‐Miyauchi, C., Sumi, S., Oka, H., Iguchi, Y., & Okano, H. J. (2020) · Figshare · doi:10.6084/m9.figshare.13071229
Bono, K., Hara‐Miyauchi, C., Sumi, S., Oka, H., Iguchi, Y., & Okano, H. J. (2020) · Figshare · doi:10.6084/m9.figshare.13070785
Kadgien, C., Kamesh, A., & Milnerwood, A. J. (2021) · Figshare · doi:10.6084/m9.figshare.16633337
Chen, X., Tsika, E., Levine, N. D., & Moore, D. J. (2023) · Figshare · doi:10.6084/m9.figshare.23884447
Bono, K., Hara‐Miyauchi, C., Sumi, S., Oka, H., Iguchi, Y., & Okano, H. J. (2020) · Figshare · doi:10.6084/m9.figshare.13070794
Bono, K., Hara‐Miyauchi, C., Sumi, S., Oka, H., Iguchi, Y., & Okano, H. J. (2020) · Figshare · doi:10.6084/m9.figshare.13071238
Bono, K., Hara‐Miyauchi, C., Sumi, S., Oka, H., Iguchi, Y., & Okano, H. J. (2020) · Figshare · doi:10.6084/m9.figshare.13071232
Bono, K., Hara‐Miyauchi, C., Sumi, S., Oka, H., Iguchi, Y., & Okano, H. J. (2020) · Figshare · doi:10.6084/m9.figshare.13070788
Chen, X., Tsika, E., Levine, N. D., & Moore, D. J. (2023) · Figshare · doi:10.6084/m9.figshare.23884441
Wang, X., Xie, Y., Fan, X., Wu, X., Wang, D., & Zhu, L. (2024) · Figshare · doi:10.6084/m9.figshare.26728939
Chen, X., Tsika, E., Levine, N. D., & Moore, D. J. (2023) · Figshare · doi:10.6084/m9.figshare.23884444
Jafrani, A. R. (2021) · TSpace (University of Toronto)
Strategies for Optimizing Genetic Mouse Models to Enhance the Understanding of Parkinson’s Disease
Shen, Z., Ma, L., & Mellick, G. D. (2026) · Biomedicines · doi:10.3390/biomedicines14051162
Qian, W., Zhang, L., Cheng, X., Xue, K., Tian, R., Fan, P., Xu, J., Zhu, S., Qiu, G., Ran, J., et al. (2026) · Glia · doi:10.1002/glia.70184
Wu, A., Lee, D., Nadgauda, A., Arzola, E. P., Xiong, L., & Xiong, W. (2026) · Cell & Bioscience · doi:10.1186/s13578-026-01602-2
Self-citationRetromer-targeted therapy for neurodegenerative diseases
Persico, M., Tuithung, S., Lorenzo, A., Crawford, D., Eleuteri, S., & Simon, D. K. (2026) · Molecular Neurodegeneration · doi:10.1186/s13024-026-00971-z
Verzijl, C. R. C., Barbosa, M. G., Vos, D. Y., Heida, A., Caillaud, A., Vanharanta, L., Ge, X., Tissink, J. J., Koster, M. H., Smit, M., et al. (2026) · Molecular Metabolism · doi:10.1016/j.molmet.2026.102456
Liu, Z., Lee, D., Tan, Z., Wu, A., Mei, L., & Xiong, W. (2026) · Translational Neurodegeneration · doi:10.1186/s40035-026-00585-x
Self-citationSaini, D., Khatoon, Z., Bano, U., Mujeeb, M., Ismail, M. V., Akhtar, M., & Najmi, A. K. (2026) · Current Molecular Pharmacology · doi:10.1016/j.cmp.2026.10.001
Jones, E., Adams, H., Chen, K.-E., Maroof, F., Ibbotson, T. M., Nakamura, Y., Banks, P. J., Healy, M. D., Lewis, P. A., Heesom, K. J., et al. (2026) · doi:10.64898/2026.05.14.724903
Metadata
- Authors
- Wen, L., Tang, F.-L., Hong, Y., Luo, S.-W., Wang, C.-L., He, W., Shen, C., Jung, J.-U., Xiong, F., Lee, D.-H., Zhang, Q.-G., Brann, D., Kim, T.-W., Yan, R., Mei, L., & Xiong, W.-C.
- Affiliations
- Institute of Molecular Medicine and Genetics 1 and 2
- Cleveland Clinic (US)
- Columbia University Irving Medical Center (US)
- Corresponding author
- Wen, Lei
- He, Wanxia
- Xiong, Fei
- Xiong, Wen-Cheng
- ORCID
- Venue
- Journal of Cell Biology
- Publisher
- Rockefeller University Press
- Published
- 2011-11-21
- Volume
- 195
- Issue
- 5
- Pages
- 765-779
- ISSN
- 0021-9525 (ISSN-L)
- 1540-8140
- PMC
- PMC3257571
- OpenAlex
- W2150669288
- Semantic Scholar
- 7397ae7e6abe3f924f61057ea04be04dce07adb4
- Cited by
- 270
- References
- 73
- Citations by year
- 2026: 9 · 2025: 3 · 2024: 17 · 2023: 19 · 2022: 17 · 2021: 25 · 2020: 32 · 2019: 17 · 2018: 15 · 2017: 20 · 2016: 23 · 2015: 25 · 2014: 21 · 2013: 12 · 2012: 11
- FWCI
- 5.41
- Type
- journal article
- Language
- en
- Open access
- hybrid
- doi.org
- Licence
- cc-by-nc-sa
- Locations
- The Journal of Cell Biology (publishedVersion, cc-by-nc-sa)
- Europe PMC (PubMed Central) (publishedVersion, cc-by-nc-sa)
- PubMed Central (publishedVersion, cc-by-nc-sa)
- PubMed (publishedVersion)
- Funders
- National Institutes of Health
- National Institute on Aging (RF1AG045781)
- National Institute of Neurological Disorders and Stroke (R01NS060648)
- Topics
- Life Sciences › Neuroscience › Cellular and Molecular Neuroscience › Alzheimer's disease research and treatments
- Life Sciences › Biochemistry, Genetics and Molecular Biology › Cell Biology › Cellular transport and secretion
- Health Sciences › Medicine › Psychiatry and Mental health › Dementia and Cognitive Impairment Research
- Keywords
- VPS35, retromer complex, Alzheimer's disease, haploinsufficiency, BACE1, amyloid-beta production, Tg2576 mice, hippocampus, long-term potentiation, glutamatergic neurotransmission, pyramidal neurons
- MeSH terms
- Alzheimer Disease, Animals, Cerebral Cortex, Hippocampus, Humans, Endosomes, Amyloid beta-Peptides, Aspartic Acid Endopeptidases, trans-Golgi Network, Vesicular Transport Proteins, Mice, Amyloid Precursor Protein Secretases, HEK293 Cells, Haploinsufficiency
About these checks
Registry, retraction, Cites and statistics results are computed, not judged, with one exception: a printed reference that no index lists is read once by a model before it counts as a citation error. Claims are extracted by a model and kept only when their quote appears verbatim in the text; each cited source is then checked, with a model’s help, for whether it says what the claim relies on. Those verdicts can be wrong — read the claim’s quote and the cited source before relying on one.
A language model drew the claims from the paper on 2026-11-09, under version 3 of the claim definition (model deepseek-v4.1-flash, prompt extract-v3).
A second model labelled each claim on 2026-11-09 (model jev-1.13-20260917, definition revision gold-guideline-v0.2).
Cited sources are checked with a language model’s help (gpt-6-sol).
Statistics and arithmetic are recomputed, not judged.
Confidence bands are shown only for fields calibrated on our annotated test set. None is calibrated yet, so no band is shown.
What counts as a claim ›How we measure confidence ›How we check this ›
Are you an author, or do you see a problem with this page? Request a review
