

The DOI matches its Crossref record; 26 of the 26 references it cites were found in a registry or an index.
Engagement of the Pd-1 Immunoinhibitory Receptor by a Novel B7 Family Member Leads to Negative Regulation of Lymphocyte Activation
Open accessAbstract
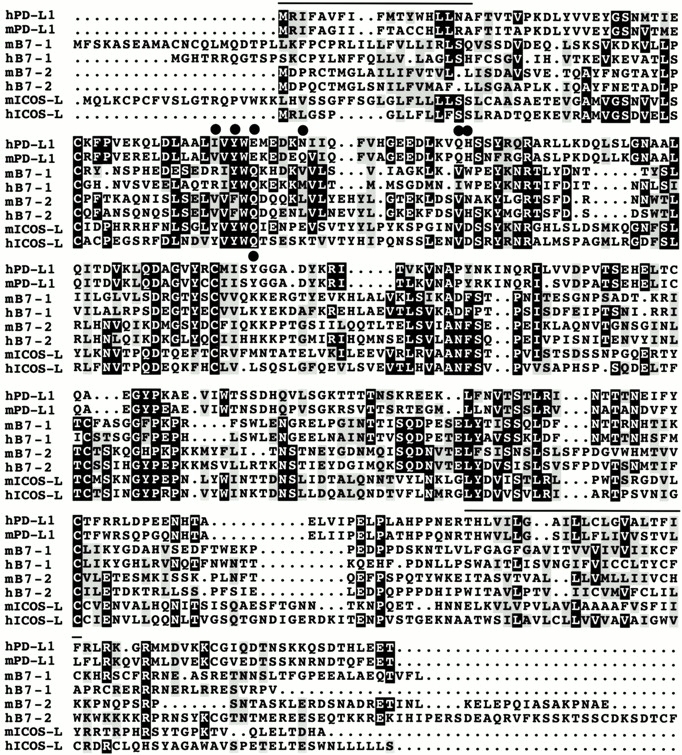
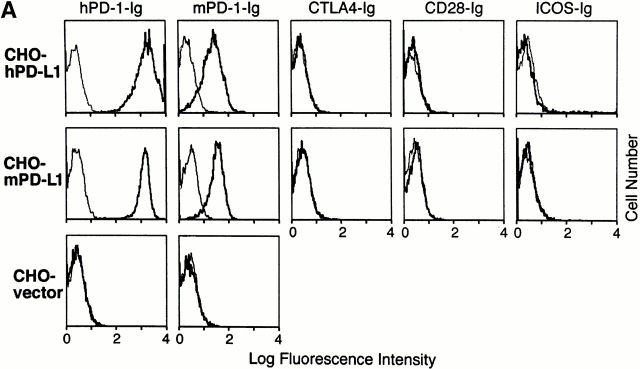
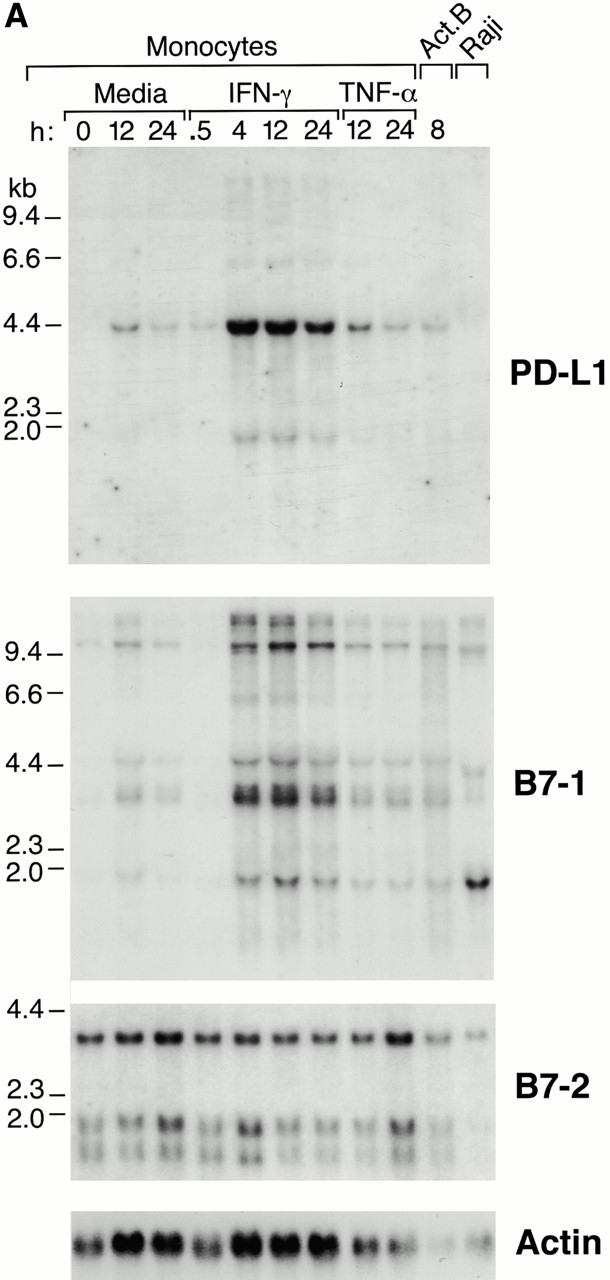
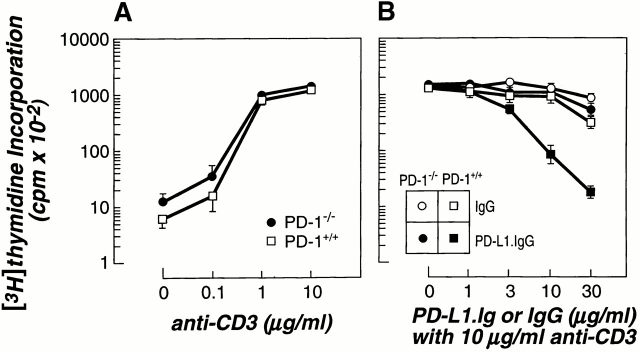
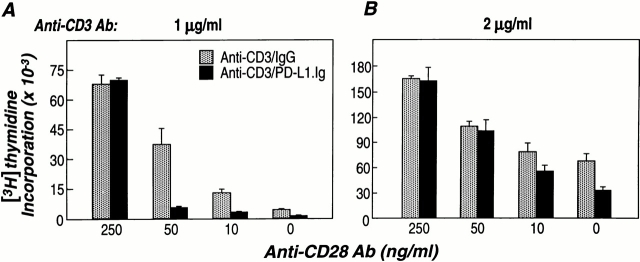
PD-1 is an immunoinhibitory receptor expressed by activated T cells, B cells, and myeloid cells. Mice deficient in PD-1 exhibit a breakdown of peripheral tolerance and demonstrate multiple autoimmune features. We report here that the ligand of PD-1 (PD-L1) is a member of the B7 gene family. Engagement of PD-1 by PD-L1 leads to the inhibition of T cell receptor-mediated lymphocyte proliferation and cytokine secretion. In addition, PD-1 signaling can inhibit at least suboptimal levels of CD28-mediated costimulation. PD-L1 is expressed by antigen-presenting cells, including human peripheral blood monocytes stimulated with interferon gamma, and activated human and murine dendritic cells. In addition, PD-L1 is expressed in nonlymphoid tissues such as heart and lung. The relative levels of inhibitory PD-L1 and costimulatory B7-1/B7-2 signals on antigen-presenting cells may determine the extent of T cell activation and consequently the threshold between tolerance and autoimmunity. PD-L1 expression on nonlymphoid tissues and its potential interaction with PD-1 may subsequently determine the extent of immune responses at sites of inflammation.
Overview
The claims and statistics of this paper haven’t been checked yet.
Run the check — free, no account needed. It reads the open-access text and checks the sources it cites.
Integrity signals
Registry
Cites
Statistics
Figures
Verification
Claims the paper makes
The claims and statistics of this paper haven’t been checked yet.
Run the check — free, no account needed. It reads the open-access text and checks the sources it cites.
Claims other papers make about this one
Each is checked against this paper’s own text: does it say what the citing paper says it does?
The cited source says what the claim attributes to it.
In the citing paper
“the inhibitory immune checkpoint CD274 (also known as PD-L1), which interacts with the PD-1 receptor on T cells to inhibit T-cell activation [5]”
From Characterizing the molecular regulation of inhibitory immune checkpoints with multimodal single-cell screens (2021) · cites this paper as [5]
In the citing paper
“PD-1 activity is therefore only relevant during simultaneous T cell activation, as its signal transduction can only come into effect during TCR-dependent signaling (39, 41, 48).”
From Anti-PD-1 and Anti-CTLA-4 Therapies in Cancer: Mechanisms of Action, Efficacy, and Limitations (2018) · cites this paper as [48]
In the citing paper
“Upon interaction with its ligands, programmed death-ligand 1 (PD-L1; a.k.a. B7-H1 or CD274) and PD-L2 (a.k.a. B7-DC or CD273), it can diminish immune responses (Freeman et al., 2000; Latchman et al., 2001).”
From Hallmarks of response, resistance, and toxicity to immune checkpoint blockade (2021) · cites this paper as Freeman et al., 2000
In the citing paper
“Similar to CTLA-4, engagement of PD-1 with its ligands, PD-L1 and PD-L2, leads to suppression of T cell immune responses (36,37).”
From Immune Checkpoint Inhibitors for the Treatment of Cancer: Clinical Impact and Mechanisms of Response and Resistance (2021) · cites this paper as [36]
In the citing paper
“Both PD-L1 and PD-L2 are expressed on hematopoietic and nonhematopoietic cells, including APCs and cancer cells (36,37).”
From Immune Checkpoint Inhibitors for the Treatment of Cancer: Clinical Impact and Mechanisms of Response and Resistance (2021) · cites this paper as [36]
Self-check
Percentages, sums and reported differences re-computed from the paper’s own numbers.
The self-check needs the paper’s full text.
Citations
Cites
Ishida, Y., Agata, Y., Shibahara, K., & Honjo, T. (1992) · The EMBO Journal · doi:10.1002/j.1460-2075.1992.tb05481.x · Cited by 3,259
Self-citationTivol, E. A., Borriello, F., Schweitzer, A. N., Lynch, W. P., Bluestone, J. A., & Sharpe, A. H. (1995) · Immunity · doi:10.1016/1074-7613(95)90125-6 · Cited by 2,914
Lymphoproliferative Disorders with Early Lethality in Mice Deficient in Ctla-4
Waterhouse, P., Penninger, J. M., Timms, E., Wakeham, A., Shahinian, A., Lee, K. P., Thompson, C. B., Griesser, H., & Mak, T. W. (1995) · Science · doi:10.1126/science.270.5238.985 · Cited by 2,766
Nishimura, H., Nose, M., Hiai, H., Minato, N., & Honjo, T. (1999) · Immunity · doi:10.1016/s1074-7613(00)80089-8 · Cited by 2,749
Self-citationDong, H., Zhu, G., Tamada, K., & Chen, L. (1999) · Nature Medicine · doi:10.1038/70932 · Cited by 2,496
Suda, T., Takahashi, T., Golstein, P., & Nagata, S. (1993) · Cell · doi:10.1016/0092-8674(93)90326-l · Cited by 2,494
Expression of the PD-1 antigen on the surface of stimulated mouse T and B lymphocytes
Agata, Y., Kawasaki, A., Nishimura, H., Ishida, Y., Tsubat, T., Yagita, H., & Honjo, T. (1996) · International Immunology · doi:10.1093/intimm/8.5.765 · Cited by 1,589
Self-citationT-cell co-stimulation through B7RP-1 and ICOS
Yoshinaga, S. K., Whoriskey, J. S., Khare, S. D., Sarmiento, U. M., Guo, J., Horan, T., Shih, G. C., Zhang, M., Coccia, M. A., Kohno, T., et al. (1999) · Nature · doi:10.1038/45582 · Cited by 772
The Emerging Role of CTLA-4 as an Immune Attenuator
Thompson, C. B., & Allison, J. P. (1997) · Immunity · doi:10.1016/s1074-7613(00)80366-0 · Cited by 633
Nishimura, H. (1998) · International Immunology · doi:10.1093/intimm/10.10.1563 · Cited by 500
Self-citation
Research works printed but not linked: 2
- Byrne, 2000, Preparation of mRNA for expression monitoring, 22
- Freeman, 1992, CTLA-4 and CD28 are coexpressed in most T-cells after activation, J. Immunol., 149, 3795, 10.4049/jimmunol.149.12.3795 · DOI
Cited by
Sorted by citations
Items 101–144 of 144
Metcalf, T. U., Cubas, R. A., Ghneim, K., Cartwright, M. J., Grevenynghe, J. V., Richner, J. M., Olagnier, D. P., Wilkinson, P. A., Cameron, M. J., Park, B. S., et al. (2015) · Aging Cell · doi:10.1111/acel.12320 · Cited by 189
Knudson, K. M., Hicks, K. C., Luo, X., Chen, J.-Q., Schlom, J., & Gameiro, S. R. (2018) · OncoImmunology · doi:10.1080/2162402x.2018.1426519 · Cited by 195
Mesenchymal stem cells repress Th17 molecular program through the PD-1 pathway
Luz-Crawford, P., Noël, D., Fernandez, X., Khoury, M., Figueroa, F., Carrión, F., Jorgensen, C., & Djouad, F. (2012) · PLoS ONE · doi:10.1371/journal.pone.0045272 · Cited by 195
Development of an automated PD-L1 immunohistochemistry (IHC) assay for non-small cell lung cancer
Phillips, T., Simmons, P., Inzunza, H. D., Cogswell, J., Novotny, J., Taylor, C., & Zhang, X. (2015) · Applied Immunohistochemistry & Molecular Morphology · doi:10.1097/pai.0000000000000256 · Cited by 189
Subrahmanyam, P. B., Dong, Z., Gusenleitner, D., Giobbie-Hurder, A., Severgnini, M., Zhou, J., Manos, M., Eastman, L. M., Maecker, H. T., & Hodi, F. S. (2018) · Journal for ImmunoTherapy of Cancer · doi:10.1186/s40425-018-0328-8 · Cited by 190
Dovedi, S. J., Elder, M. J., Yang, C., Sitnikova, S. I., Irving, L., Hansen, A., Hair, J., Jones, D. C., Hasani, S., Wang, B., et al. (2021) · Cancer Discovery · doi:10.1158/2159-8290.cd-20-1445 · Cited by 186
PD-1 expression on dendritic cells suppresses CD8+T cell function and antitumor immunity
Lim, T. S., Chew, V., Sieow, J. L., Goh, S., Yeong, J. P.-S., Soon, A. L., & Ricciardi-Castagnoli, P. (2016) · OncoImmunology · doi:10.1080/2162402x.2015.1085146 · Cited by 184
HDAC inhibition potentiates immunotherapy in triple negative breast cancer
Terranova-Barberio, M., Thomas, S., Ali, N., Pawlowska, N., Park, J., Krings, G., Rosenblum, M. D., Budillon, A., & Munster, P. N. (2017) · Oncotarget · doi:10.18632/oncotarget.23169 · Cited by 182
David, J. M., Dominguez, C., McCampbell, K. K., Gulley, J. L., Schlom, J., & Palena, C. (2017) · OncoImmunology · doi:10.1080/2162402x.2017.1349589 · Cited by 180
Clinical Features of Nivolumab-Induced Thyroiditis: A Case Series Study
Yamauchi, I., Sakane, Y., Fukuda, Y., Fujii, T., Taura, D., Hirata, M., Hirota, K., Ueda, Y., Kanai, Y., Yamashita, Y., et al. (2017) · Thyroid · doi:10.1089/thy.2016.0562 · Cited by 169
Tang, B., Yan, X., Sheng, X., Si, L., Cui, C., Kong, Y., Mao, L., Lian, B., Bai, X., Wang, X., et al. (2019) · Journal of Hematology & Oncology · doi:10.1186/s13045-018-0693-2 · Cited by 169
Yin–Yang of costimulation: crucial controls of immune tolerance and function
Nurieva, R. I., Liu, X., & Dong, C. (2009) · Immunological Reviews · doi:10.1111/j.1600-065x.2009.00769.x · Cited by 157
In Vivo Immune Modulatory Activity of Hepatic Stellate Cells in Mice
Chen, C.-H., Kuo, L.-M., Chang, Y., Wu, W., Goldbach, C., Ross, M. A., Stolz, D. B., Chen, L., Fung, J. J., Lu, L., et al. (2006) · Hepatology · doi:10.1002/hep.21379 · Cited by 154
Zheng, B., Ren, T., Huang, Y., Sun, K., Wang, S., Bao, X., Liu, K., & Guo, W. (2018) · Journal of Hematology & Oncology · doi:10.1186/s13045-018-0560-1 · Cited by 151
Combination of Immunotherapy With Targeted Therapy: Theory and Practice in Metastatic Melanoma
Yu, C., Liu, X., Yang, J., Zhang, M., Jin, H., Ma, X., & Shi, H. (2019) · Frontiers in Immunology · doi:10.3389/fimmu.2019.00990 · Cited by 126
CTLA-4 is expressed by human monocyte-derived dendritic cells and regulates their functions
Laurent, S., Carrega, P., Saverino, D., Piccioli, P., Camoriano, M., Morabito, A., Dozin, B., Fontana, V., Simone, R., Mortara, L., et al. (2010) · Human Immunology · doi:10.1016/j.humimm.2010.07.007 · Cited by 121
Selective inhibition of low-affinity memory CD8(+) T cells by corticosteroids
Tokunaga, A., Sugiyama, D., Maeda, Y., Warner, A. B., Panageas, K. S., Ito, S., Togashi, Y., Sakai, C., Wolchok, J. D., & Nishikawa, H. (2019) · Journal of Experimental Medicine · doi:10.1084/jem.20190738 · Cited by 124
Heavy chain ferritin activates regulatory T cells by induction of changes in dendritic cells
Gray, C. P., Arosio, P., & Hersey, P. (2002) · Blood · doi:10.1182/blood.v99.9.3326 · Cited by 118
The deubiquitinase USP22 regulates PD-L1 degradation in human cancer cells
Wang, Y., Sun, Q., Mu, N., Sun, X., Wang, Y., Fan, S., Su, L., & Liu, X. (2020) · Cell Communication and Signaling · doi:10.1186/s12964-020-00612-y · Cited by 124
Targeting the immune microenvironment in acute myeloid leukemia: a focus on T cell immunity
Lamble, A. J., & Lind, E. F. (2018) · Frontiers in Oncology · doi:10.3389/fonc.2018.00213 · Cited by 119
HGF/MET and the Immune System: Relevance for Cancer Immunotherapy
Papaccio, F., Della Corte, C. M., Viscardi, G., Di Liello, R., Esposito, G., Sparano, F., Ciardiello, F., & Morgillo, F. (2018) · International Journal of Molecular Sciences · doi:10.3390/ijms19113595 · Cited by 110
Structure and Dynamics of PD-L1 and an Ultra-High-Affinity PD-1 Receptor Mutant
Pascolutti, R., Sun, X., Kao, J., Maute, R. L., Ring, A. M., Bowman, G. R., & Kruse, A. C. (2016) · Structure · doi:10.1016/j.str.2016.06.026 · Cited by 102
Affinity purification mass spectrometry analysis of PD-1 uncovers SAP as a new checkpoint inhibitor
Peled, M., Tocheva, A. S., Sandigursky, S., Nayak, S., Philips, E. A., Nichols, K. E., Strazza, M., Azoulay-Alfaguter, I., Askenazi, M., Neel, B. G., et al. (2018) · Proceedings of the National Academy of Sciences · doi:10.1073/pnas.1710437115 · Cited by 87
Increased PD-1 expression on CD4+ and CD8+ T cells is involved in immune evasion in gastric cancer
Saito, H., Kuroda, H., Matsunaga, T., Osaki, T., & Ikeguchi, M. (2013) · Journal of Surgical Oncology · doi:10.1002/jso.23281 · Cited by 94
Gerace, D., Zhou, Q., Kenty, J. H.-R., Veres, A., Sintov, E., Wang, X., Boulanger, K. R., Li, H., & Melton, D. A. (2023) · Cell Reports Medicine · doi:10.1016/j.xcrm.2022.100879 · Cited by 88
Arakawa, A., Vollmer, S., Tietze, J., Galinski, A., Heppt, M. V., Bürdek, M., Berking, C., & Prinz, J. C. (2019) · Frontiers in Immunology · doi:10.3389/fimmu.2019.01336 · Cited by 74
Deciphering mechanisms of brain metastasis in melanoma - the gist of the matter
Redmer, T. (2018) · Molecular Cancer · doi:10.1186/s12943-018-0854-5 · Cited by 67
Wang, Y., Ma, R., Liu, F., Lee, S. A., & Zhang, L. (2018) · Frontiers in Immunology · doi:10.3389/fimmu.2018.00374 · Cited by 71
Anti-PD-1 Therapy Response Predicted by the Combination of Exosomal PD-L1 and CD28
Zhang, C., Fan, Y., Che, X., Zhang, M., Li, Z., Li, C., Wang, S., Wen, T., Hou, K., Shao, X., et al. (2020) · Frontiers in Oncology · doi:10.3389/fonc.2020.00760 · Cited by 69
Kudo, M. (2019) · Liver Cancer · doi:10.1159/000503254 · Cited by 70
Current Progress and Future Perspectives of Immune Checkpoint in Cancer and Infectious Diseases
Cai, X., Zhan, H., Ye, Y., Yang, J., Zhang, M., Li, J., & Zhuang, Y. (2021) · Frontiers in Genetics · doi:10.3389/fgene.2021.785153 · Cited by 66
Aguirre, L. E., Guzman, M. E., Lopes, G., & Hurley, J. (2019) · The Oncologist · doi:10.1634/theoncologist.2018-0195 · Cited by 68
PD-1 Imposes Qualitative Control of Cellular Transcriptomes in Response to T Cell Activation
Shimizu, K., Sugiura, D., Okazaki, I.-M., Maruhashi, T., Takegami, Y., Cheng, C., Ozaki, S., & Okazaki, T. (2020) · Molecular Cell · doi:10.1016/j.molcel.2019.12.012 · Cited by 63
Self-citationCell Fate Reprogramming in the Era of Cancer Immunotherapy
Zimmermannova, O., Caiado, I., Ferreira, A. G., & Pereira, C.-F. (2021) · Frontiers in Immunology · doi:10.3389/fimmu.2021.714822 · Cited by 56
Immune checkpoint inhibitors associated cardiovascular immune-related adverse events
Jo, W., Won, T., Daoud, A., & Čiháková, D. (2024) · Frontiers in Immunology · doi:10.3389/fimmu.2024.1340373 · Cited by 55
Di Luccia, B., Molgora, M., Khantakova, D., Jaeger, N., Chang, H.-W., Czepielewski, R. S., Helmink, B. A., Onufer, E. J., Fachi, J. L., Bhattarai, B., et al. (2024) · Science Immunology · doi:10.1126/sciimmunol.adi5374 · Cited by 59
Checkpoint immunotherapy in pediatrics: here, gone, and back again
Long, A. H., Morgenstern, D. A., Leruste, A., Bourdeaut, F., & Davis, K. L. (2022) · American Society of Clinical Oncology Educational Book · doi:10.1200/edbk_349799 · Cited by 53
Self-citationFunctional differences between rodent and human PD-1 linked to evolutionary divergence
Masubuchi, T., Chen, L., Marcel, N., Wen, G. A., Caron, C., Zhang, J., Zhao, Y., Morris, G. P., Chen, X., Hedrick, S. M., et al. (2025) · Science Immunology · doi:10.1126/sciimmunol.ads6295 · Cited by 36
Modulation of immune checkpoint molecule expression in mantle cell lymphoma
Harrington, B. K., Wheeler, E., Hornbuckle, K., Shana’ah, A. Y., Youssef, Y., Smith, L., Hassan II, Q., Klamer, B., Zhang, X., Long, M., et al. (2019) · Leukemia & Lymphoma · doi:10.1080/10428194.2019.1569231 · Cited by 31
Takehara, T., Wakamatsu, E., Machiyama, H., Nishi, W., Emoto, K., Azuma, M., Soejima, K., Fukunaga, K., & Yokosuka, T. (2021) · Communications Biology · doi:10.1038/s42003-021-02111-3 · Cited by 31
Clinical benefit of neoadjuvant anti‐PD‐1/PD‐L1 utilization among different tumors
Li, Z., Wu, X., Zhao, Y., Xiao, Y., Zhao, Y., Zhang, T., Li, H., Sha, F., Wang, Y., Deng, L., et al. (2021) · MedComm · doi:10.1002/mco2.61 · Cited by 23
How does the gut microbiome influence immune checkpoint blockade therapy?
Almonte, A. A., Rangarajan, H., Yip, D., & Fahrer, A. M. (2021) · Immunology & Cell Biology · doi:10.1111/imcb.12423 · Cited by 21
Seethapathy, H., Mistry, K., & Sise, M. E. (2023) · Immunological Reviews · doi:10.1111/imr.13243 · Cited by 15
Immunotherapeutic strategies in breast cancer: a clinical update
Zhang, J. Q., & Plitas, G. (2021) · Journal of Surgical Oncology · doi:10.1002/jso.26287 · Cited by 6
Metadata
- Authors
- Freeman, G. J., Long, A. J., Iwai, Y., Bourque, K., Chernova, T., Nishimura, H., Fitz, L. J., Malenkovich, N., Okazaki, T., Byrne, M. C., Horton, H. F., Fouser, L., Carter, L., Ling, V., Bowman, M. R., Carreno, B. M., Collins, M., Wood, C. R., & Honjo, T.
- Affiliations
- Harvard University (US)
- bGenetics Institute, Wyeth-Ayerst Research, Cambridge, Massachusetts 02140
- Kyoto University (JP)
- ORCID
- Venue
- The Journal of Experimental Medicine
- Publisher
- Rockefeller University Press
- Published
- 2000-10-02
- Volume
- 192
- Issue
- 7
- Pages
- 1027-1034
- ISSN
- 0022-1007 (ISSN-L)
- 1540-9538
- PMC
- PMC2193311
- OpenAlex
- W2118471749
- Cited by
- 5,294
- References
- 26
- Citations by year
- 2026: 147 · 2025: 255 · 2024: 298 · 2023: 328 · 2022: 357 · 2021: 454 · 2020: 451 · 2019: 391 · 2018: 386 · 2017: 375 · 2016: 279 · 2015: 267 · 2014: 158 · 2013: 163 · 2012: 109
- FWCI
- 18.27
- Type
- journal article
- Language
- en
- Open access
- bronze
- doi.org
- Locations
- The Journal of Experimental Medicine (publishedVersion)
- PubMed Central (publishedVersion, cc-by-nc-sa)
- PubMed (publishedVersion)
- Funders
- Association pour la Recherche sur le Cancer
- Seerave Foundation
- E-Rare
- European Commission
- Agence Nationale de la Recherche (ANR-16-RHUS-0008)
- Fondation Leducq
- Institut National de la Santé et de la Recherche Médicale
- Fondation pour la Recherche Médicale
- Ligue Contre le Cancer
- Institut Universitaire de France
- Institut National Du Cancer
- National Institutes of Health (5p01ai041584-05)
- Horizon 2020 Framework Programme (GDW20171100085, GDW20181100051)
- High-end Foreign Experts Recruitment Plan of China (GDW20171100085, GDW20181100051)
- Labex Immuno-Oncology
- National Cancer Institute (CA 84500, R01CA084500)
- National Institute of Allergy and Infectious Diseases (AI 39671, AI 41584, P01AI039671)
- Topics
- Life Sciences › Immunology and Microbiology › Immunology › T-cell and B-cell Immunology
- Health Sciences › Medicine › Oncology › Cancer Immunotherapy and Biomarkers
- Life Sciences › Immunology and Microbiology › Immunology › Immunotherapy and Immune Responses
- Keywords
- PD-1, PD-L1, B7 family, T cell activation, lymphocyte proliferation, cytokine production, CD28 costimulation, antigen-presenting cells, dendritic cells, monocytes, interferon-gamma, autoimmunity, peripheral tolerance
- MeSH terms
- Amino Acid Sequence, Animals, Antigen-Presenting Cells, Antigens, Surface, Base Sequence, Cell Division, Humans, Ligands, Membrane Glycoproteins, Molecular Sequence Data, T-Lymphocytes, Signal Transduction, Antigens, CD, Gene Expression, CD3 Complex, DNA, Complementary, CD28 Antigens, B7-1 Antigen, Apoptosis Regulatory Proteins, Mice, B7-2 Antigen, Programmed Cell Death 1 Receptor
About these checks
Registry, retraction, Cites and statistics results are computed, not judged, with one exception: a printed reference that no index lists is read once by a model before it counts as a citation error. Claims are extracted by a model and kept only when their quote appears verbatim in the text; each cited source is then checked, with a model’s help, for whether it says what the claim relies on. Those verdicts can be wrong — read the claim’s quote and the cited source before relying on one.
Statistics and arithmetic are recomputed, not judged.
Confidence bands are shown only for fields calibrated on our annotated test set. None is calibrated yet, so no band is shown.
What counts as a claim ›How we measure confidence ›How we check this ›
Are you an author, or do you see a problem with this page? Request a review
