

The DOI matches its Crossref record; 82 of the 82 references it cites were found in a registry or an index.
Inflammatory monocytes recruited after skeletal muscle injury switch into antiinflammatory macrophages to support myogenesis
Open accessAbstract
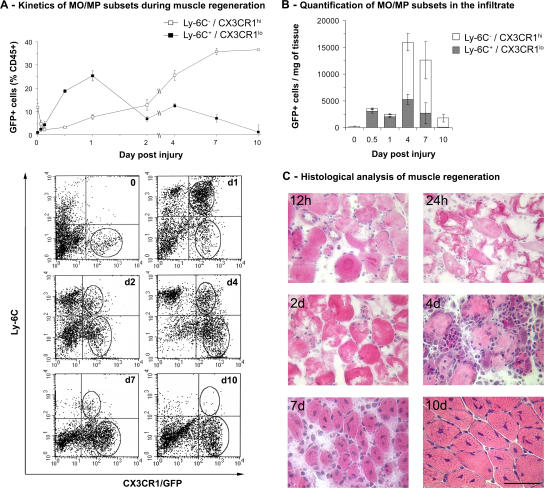
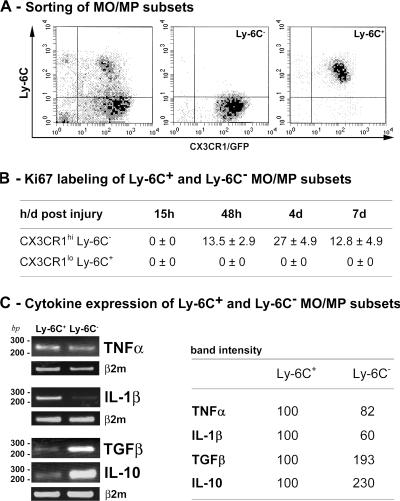
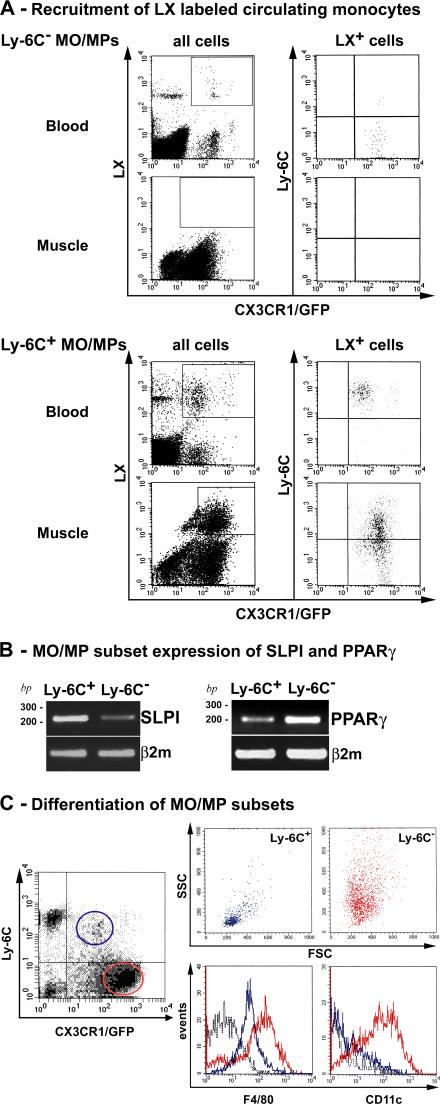
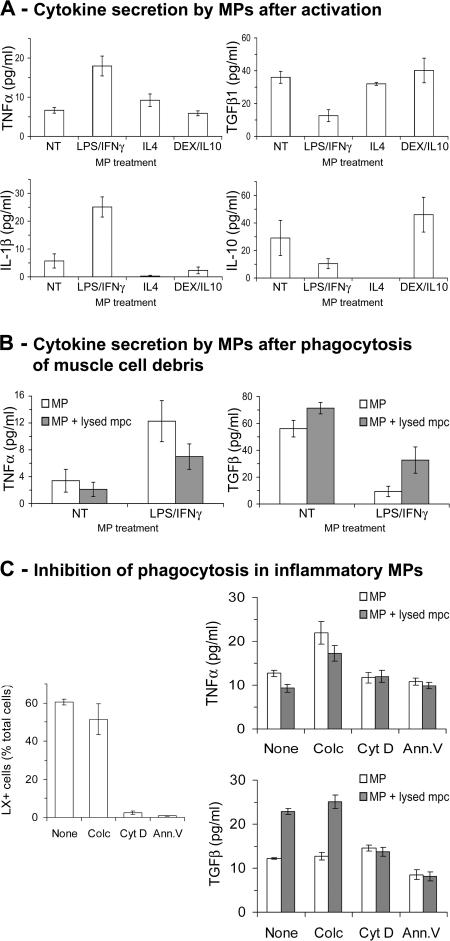
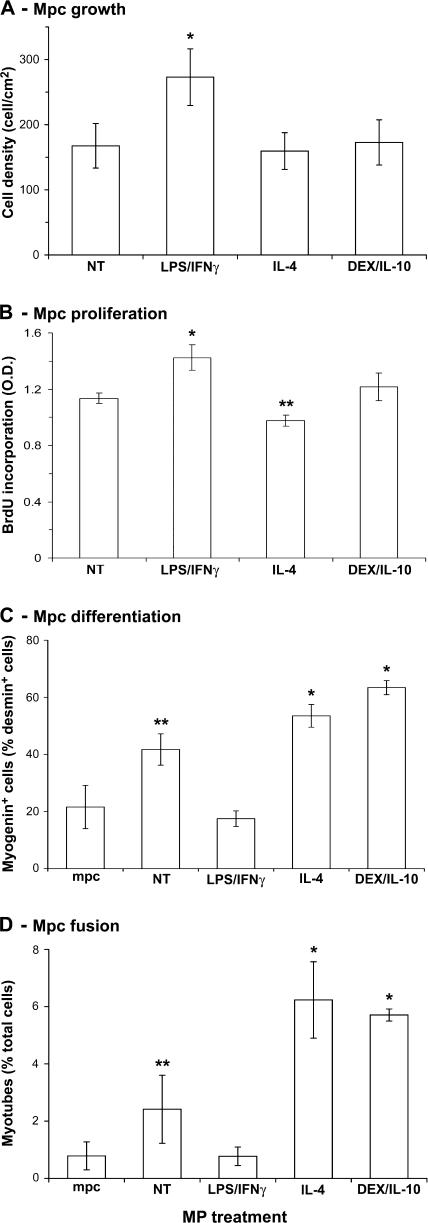
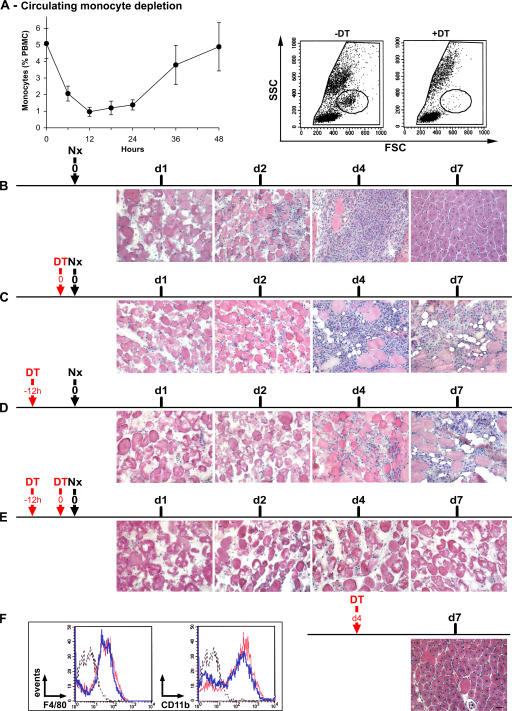
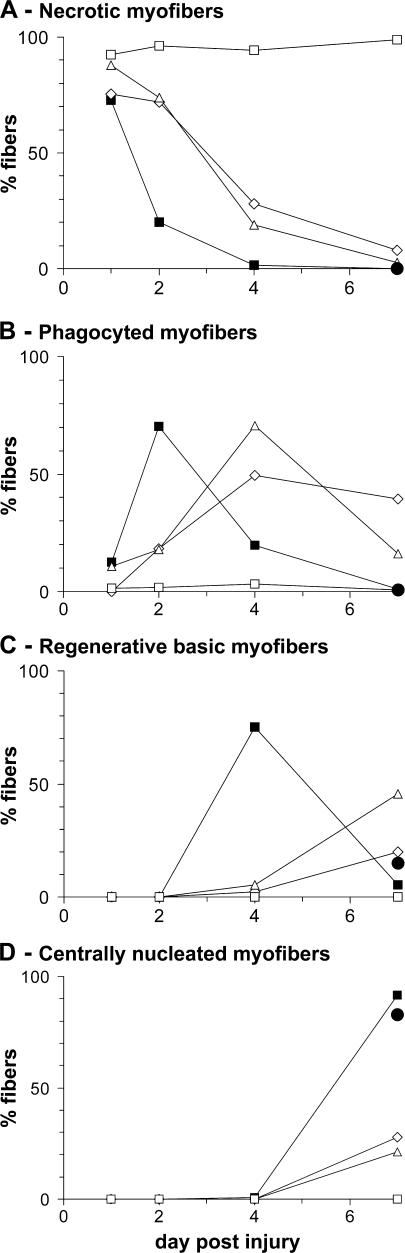
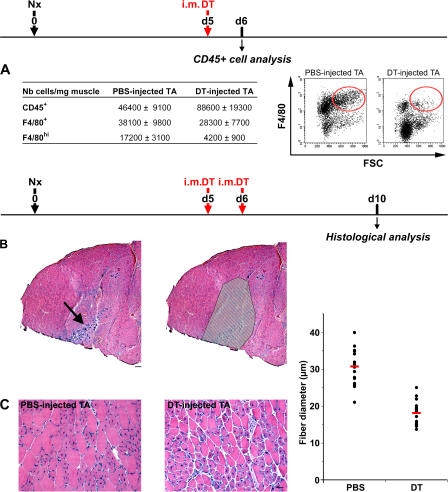
Macrophages (MPs) are important for skeletal muscle regeneration in vivo and may exert beneficial effects on myogenic cell growth through mitogenic and antiapoptotic activities in vitro. However, MPs are highly versatile and may exert various, and even opposite, functions depending on their activation state. We studied monocyte (MO)/MP phenotypes and functions during skeletal muscle repair. Selective labeling of circulating MOs by latex beads in CX3CR1GFP/+ mice showed that injured muscle recruited only CX3CR1lo/Ly-6C+ MOs from blood that exhibited a nondividing, F4/80lo, proinflammatory profile. Then, within muscle, these cells switched their phenotype to become proliferating antiinflammatory CX3CR1hi/Ly-6C− cells that further differentiated into F4/80hi MPs. In vitro, phagocytosis of muscle cell debris induced a switch of proinflammatory MPs toward an antiinflammatory phenotype releasing transforming growth factor β1. In co-cultures, inflammatory MPs stimulated myogenic cell proliferation, whereas antiinflammatory MPs exhibited differentiating activity, assessed by both myogenin expression and fusion into myotubes. Finally, depletion of circulating MOs in CD11b–diphtheria toxin receptor mice at the time of injury totally prevented muscle regeneration, whereas depletion of intramuscular F4/80hi MPs at later stages reduced the diameter of regenerating fibers. In conclusion, injured skeletal muscle recruits MOs exhibiting inflammatory profiles that operate phagocytosis and rapidly convert to antiinflammatory MPs that stimulate myogenesis and fiber growth.
Overview
The claims and statistics of this paper haven’t been checked yet.
Run the check — free, no account needed. It reads the open-access text and checks the sources it cites.
Integrity signals
Registry
Cites
Statistics
Figures
Verification
Claims the paper makes
The claims and statistics of this paper haven’t been checked yet.
Run the check — free, no account needed. It reads the open-access text and checks the sources it cites.
Claims other papers make about this one
Each is checked against this paper’s own text: does it say what the citing paper says it does?
In the citing paper
“A number of studies have shown that reduction of the number of monocytes available to participate in the response following muscle injury via depletion of circulating cells results in slowed removal of cellular debris and delayed muscle tissue remodeling [112–114].”
From Macrophage polarization: an opportunity for improved outcomes in biomaterials and regenerative medicine (2012) · cites this paper as [112]
In the citing paper
“For example, IL-10 secreted by M2 macrophages is known both to drive a transition from an M1 to an M2 phenotype as well as to promote the fusion and maturation of myotubes [112,125].”
From Macrophage polarization: an opportunity for improved outcomes in biomaterials and regenerative medicine (2012) · cites this paper as [112]
In the citing paper
“These studies showed that the timing of inflammatory responses can have profound effects on the kinetics and extent of regeneration69, findings confirmed by experiments using antibodies to block inflammatory cytokines70,71.”
From The central role of muscle stem cells in regenerative failure with aging (2015) · cites this paper as [69]
In the citing paper
“Accumulating evidence indicates that Mp are critical orchestrators in healing of many tissues, including skin (3,4,7,48).”
From Sustained Inflammasome Activity in Macrophages Impairs Wound Healing in Type 2 Diabetic Humans and Mice (2014) · cites this paper as [3]
Self-check
Percentages, sums and reported differences re-computed from the paper’s own numbers.
The self-check needs the paper’s full text.
Citations
Cites
Alternative activation of macrophages
Gordon, S. (2003) · Nature Reviews Immunology · doi:10.1038/nri978 · Cited by 6,189
Monocyte and macrophage heterogeneity
Gordon, S., & Taylor, P. R. (2005) · Nature Reviews Immunology · doi:10.1038/nri1733 · Cited by 5,190
Cytokine-mediated regulation of CXCR4 expression in human neutrophils
Nagase, H., Miyamasu, M., Yamaguchi, M., Imanishi, M., Tsuno, N. H., Matsushima, K., Yamamoto, K., Morita, Y., & Hirai, K. (2002) · Journal of Leukocyte Biology · doi:10.1189/jlb.71.4.711 · Cited by 4,713
Obesity induces a phenotypic switch in adipose tissue macrophage polarization
Lumeng, C. N., Bodzin, J. L., & Saltiel, A. R. (2007) · Journal of Clinical Investigation · doi:10.1172/jci29881 · Cited by 4,664
The peroxisome proliferator-activated receptor-γ is a negative regulator of macrophage activation
Ricote, M., Li, A. C., Willson, T. M., Kelly, C. J., & Glass, C. K. (1998) · Nature · doi:10.1038/34178 · Cited by 3,525
Blood Monocytes Consist of Two Principal Subsets with Distinct Migratory Properties
Geissmann, F., Jung, S., & Littman, D. R. (2003) · Immunity · doi:10.1016/s1074-7613(03)00174-2 · Cited by 3,504
Points of control in inflammation
Nathan, C. (2002) · Nature · doi:10.1038/nature01320 · Cited by 2,738
Resolution of inflammation: the beginning programs the end
Serhan, C. N., & Savill, J. (2005) · Nature Immunology · doi:10.1038/ni1276 · Cited by 2,552
Stein, M., Keshav, S., Harris, N., & Gordon, S. (1992) · The Journal of experimental medicine · doi:10.1084/jem.176.1.287 · Cited by 1,960
van Rooijen, N., & Sanders, A. (1994) · Journal of Immunological Methods · doi:10.1016/0022-1759(94)90012-4 · Cited by 1,763
Research works printed but not linked: 5
- 1996, J. Anat., 188, 17
- 2006, J. Leukoc. Biol., 81, 775
- 2004, FASEB J., 19, 413
- 2006, Nat. Immunol., 7, 265
- 2004, Proc. Natl. Acad. Sci. USA., 102, 99
Cited by
Sorted by citations
Items 401–500 of 1,001
The Glial Scar-Monocyte Interplay: A Pivotal Resolution Phase in Spinal Cord Repair
Shechter, R., Rapôso, C., London, A., Sagi, I., & Schwartz, M. (2011) · PLoS ONE · doi:10.1371/journal.pone.0027969 · Cited by 117
Matsuda, M., Tsurusaki, S., Miyata, N., Saijou, E., Okochi, H., Miyajima, A., & Tanaka, M. (2017) · Hepatology · doi:10.1002/hep.29421 · Cited by 113
The Role of Innate and Adaptive Immune Cells in Skeletal Muscle Regeneration
Ziemkiewicz, N., Hilliard, G. M., Pullen, N., & Garg, K. (2021) · International Journal of Molecular Sciences · doi:10.3390/ijms22063265 · Cited by 124
Single-cell analysis of skeletal muscle macrophages reveals age-associated functional subpopulations
Krasniewski, L. K., Chakraborty, P., Cui, C., Mazan-Mamczarz, K., Dunn, C., Piao, Y., Fan, J., Shi, C., Wallace, T., Nguyen, C., et al. (2022) · eLife · doi:10.7554/elife.77974 · Cited by 111
Time-dependent effects of CX3CR1 in a mouse model of mild traumatic brain injury
Febinger, H. Y., Thomasy, H. E., Pavlova, M. N., Ringgold, K. M., Barf, P. R., George, A. M., Grillo, J. N., Bachstetter, A. D., Garcia, J. A., Cardona, A. E., et al. (2015) · Journal of Neuroinflammation · doi:10.1186/s12974-015-0386-5 · Cited by 110
“CX3CR1 monocytes may differentiate from Ly6C monocytes in tissue and thus may not require CX3CR1 for recruitment [54, 55].”
Myocardial NF-κB activation is essential for zebrafish heart regeneration
Karra, R., Knecht, A. K., Kikuchi, K., & Poss, K. D. (2015) · Proceedings of the National Academy of Sciences · doi:10.1073/pnas.1511209112 · Cited by 117
Macrophages and Alcohol-Related Liver Inflammation
Ju, C. H. (2015) · Alcohol research · doi:10.35946/arcr.v37.2.09 · Cited by 110
Attenuated muscle regeneration is a key factor in dysferlin-deficient muscular dystrophy
Chiu, Y., Hornsey, M. A., Klinge, L., Jørgensen, L. H., Laval, S. H., Charlton, R., Barresi, R., Straub, V. W., Lochmüller, H., & Bushby, K. M. D. (2009) · Human Molecular Genetics · doi:10.1093/hmg/ddp121 · Cited by 108
Varga, T., Mounier, R., Gogolák, P., Póliska, S., Chazaud, B., & Nagy, L. (2013) · The Journal of Immunology · doi:10.4049/jimmunol.1301445 · Cited by 116
Self-citationMonocyte homeostasis and the plasticity of inflammatory monocytes
Mitchell, A. J., Roediger, B., & Weninger, W. (2014) · Cellular Immunology · doi:10.1016/j.cellimm.2014.05.010 · Cited by 117
Skeletal muscle regeneration with robotic actuation–mediated clearance of neutrophils
Seo, B. R., Payne, C. J., McNamara, S. L., Freedman, B. R., Kwee, B. J., Nam, S., de Lázaro, I., Darnell, M., Alvarez, J. T., Dellacherie, M. O., et al. (2021) · Science Translational Medicine · doi:10.1126/scitranslmed.abe8868 · Cited by 116
Rehak, L., Giurato, L., Meloni, M., Panunzi, A., Manti, G. M., & Uccioli, L. (2022) · Journal of Clinical Medicine · doi:10.3390/jcm11030889 · Cited by 112
Local administration of regulatory T cells promotes tissue healing
Nayer, B., Tan, J. L., Alshoubaki, Y. K., Lu, Y., Legrand, J. M. D., Lau, S., Hu, N., Park, A. J., Wang, X., Amann‐Zalcenstein, D., et al. (2024) · Nature Communications · doi:10.1038/s41467-024-51353-2 · Cited by 117
Macrophages Protect against Muscle Atrophy and Promote Muscle Recovery in Vivo and in Vitro
Dumont, N. A., & Frenette, J. (2010) · American Journal Of Pathology · doi:10.2353/ajpath.2010.090884 · Cited by 113
Bone marrow‐derived cell regulation of skeletal muscle regeneration
Sun, D., Martinez, C. O., Ochoa, O., Ruiz‐Willhite, L., Bonilla, J. R., Centonze, V. E., Waite, L. L., Michalek, J. E., McManus, L. M., & Shireman, P. K. (2008) · The FASEB Journal · doi:10.1096/fj.07-095901 · Cited by 117
Inflammation in tissue engineering: The Janus between engraftment and rejection
Crupi, A., Costa, A., Tarnok, A., Melzer, S., & Teodori, L. (2015) · European Journal of Immunology · doi:10.1002/eji.201545818 · Cited by 108
Resolvin D2 Enhances Postischemic Revascularization While Resolving Inflammation
Zhang, M. J., Sansbury, B. E., Hellmann, J. L., Baker, J. F., Guo, L., Parmer, C. M., Prenner, J. C., Conklin, D. J., Bhatnagar, A., Creager, M. A., et al. (2016) · Circulation · doi:10.1161/circulationaha.116.021894 · Cited by 111
Graubardt, N., Vugman, M., Mouhadeb, O., Caliari, G., Pasmanik‐Chor, M., Reuveni, D., Zigmond, E., Brazowski, E., David, E., Chappell‐Maor, L., et al. (2017) · Frontiers in Immunology · doi:10.3389/fimmu.2017.00626 · Cited by 114
Regulation of inflammation as an anti‐aging intervention
Neves, J., & Sousa‐Victor, P. (2019) · FEBS Journal · doi:10.1111/febs.15061 · Cited by 110
Glial scar and immune cell involvement in tissue remodeling and repair following acute CNS injuries
Rapôso, C., & Schwartz, M. (2014) · Glia · doi:10.1002/glia.22676 · Cited by 112
Lenzo, J. C., Turner, A. L., Cook, A. D., Vlahos, R., Anderson, G. P., Reynolds, E. C., & Hamilton, J. A. (2011) · Immunology and Cell Biology · doi:10.1038/icb.2011.58 · Cited by 105
Stage-specific effects of Notch activation during skeletal myogenesis
Bi, P., Yue, F., Sato, Y., Wirbisky, S. E., Liu, W., Shan, T., Wen, Y., Zhou, D., Freeman, J. L., & Kuang, S. (2016) · eLife · doi:10.7554/elife.17355 · Cited by 105
Deng, Z. H., Shi, F., Zhou, Z., Sun, F., Sun, M., Sun, Q., Chen, L., Deng, L., Jiang, C., Zhao, R., et al. (2019) · Toxicology and Applied Pharmacology · doi:10.1016/j.taap.2019.01.022 · Cited by 106
Satellite cell loss and impaired muscle regeneration in selenoprotein N deficiency
Castets, P., Bertrand, A., Beuvin, M., Ferry, A., Grand, F. L., Castets, M., Chazot, G., Rederstorff, M., Krol, A., Lescure, A., et al. (2010) · Human Molecular Genetics · doi:10.1093/hmg/ddq515 · Cited by 106
Zhang, C., Cheng, N., Qiao, B., Zhang, F., Wu, J., Liu, C., Li, Y., & Du, J. (2020) · Journal of Cachexia Sarcopenia and Muscle · doi:10.1002/jcsm.12584 · Cited by 105
Muscle injury: review of experimental models.
de Souza, J. B., & Gottfried, C. (2013) · Journal of Electromyography & Kinesiology · doi:10.1016/j.jelekin.2013.07.009 · Cited by 115
Criscimanna, A., Coudriet, G. M., Gittes, G. K., Piganelli, J. D., & Esni, F. (2014) · Gastroenterology · doi:10.1053/j.gastro.2014.08.008 · Cited by 107
Immune Responses to Resistance Exercise
Freidenreich, D. J., & Volek, J. S. (2026) · PubMed · doi:10.22029/eir.2012.1667 · Cited by 103
Glucocorticoids Shape Macrophage Phenotype for Tissue Repair
Desgeorges, T., Caratti, G., Mounier, R., Tuckermann, J. P., & Chazaud, B. (2019) · Frontiers in Immunology · doi:10.3389/fimmu.2019.01591 · Cited by 109
Self-citationLoreti, M., & Sacco, A. (2022) · npj Regenerative Medicine · doi:10.1038/s41536-022-00204-z · Cited by 111
Extrinsic and intrinsic control of macrophage inflammatory responses
Cohen, H., & Mosser, D. (2013) · Journal of Leukocyte Biology · doi:10.1189/jlb.0413236 · Cited by 106
Crosstalk Between Skeletal Muscle and Immune System: Which Roles Do IL-6 and Glutamine Play?
Rogeri, P. S., Gasparini, S. O., Martins, G. L., Costa, L. K. F., Araujo, C. C., Lugaresi, R., Kopfler, M., & Lancha, A. H. (2020) · Frontiers in Physiology · doi:10.3389/fphys.2020.582258 · Cited by 108
Moratal, C., Raffort, J., Arrighi, N., Rekima, S., Schaub, S., Dechesne, C. A., Chinetti, G., & Dani, C. (2018) · Scientific Reports · doi:10.1038/s41598-018-35429-w · Cited by 101
Contributions to the dynamics of cervix remodeling prior to term and preterm birth†
Yellon, S. M. (2016) · Biology of Reproduction · doi:10.1095/biolreprod.116.142844 · Cited by 105
Thalacker‐Mercer, A. E., Dell’Italia, L. J., Cui, X., Cross, J. M., & Bamman, M. M. (2009) · Physiological Genomics · doi:10.1152/physiolgenomics.00151.2009 · Cited by 99
Monocytes in health and disease — Minireview
Karlmark, K. R., Tacke, F., & Dunay, I. R. (2012) · European Journal of Microbiology and Immunology · doi:10.1556/eujmi.2.2012.2.1 · Cited by 105
Targeting Macrophage Subsets for Infarct Repair
Ben-Mordechai, T., Palevski, D., Glucksam, Y., Elron-Gross, I., Margalit, R., & Leor, J. (2014) · Journal of Cardiovascular Pharmacology and Therapeutics · doi:10.1177/1074248414534916 · Cited by 100
Skeletal Muscle Repair and Regeneration
Schiaffino, S. (2008) · Springer eBooks · doi:10.1007/978-1-4020-6768-6 · Cited by 100
Kulkarni, O. P., Lichtnekert, J., Anders, H., & Mulay, S. R. (2016) · Mediators of Inflammation · doi:10.1155/2016/2856213 · Cited by 108
Hobbs, S. S., Reynoso, M., Geddis, A. V., Mitrophanov, A. Y., & Matheny, R. W. (2018) · Physiological Reports · doi:10.14814/phy2.13914 · Cited by 99
Walton, R. G., Kosmac, K., Mula, J., Fry, C. S., Peck, B. D., Groshong, J. S., Finlin, B. S., Zhu, B., Kern, P. A., & Peterson, C. A. (2019) · Scientific Reports · doi:10.1038/s41598-018-37187-1 · Cited by 97
Yang, J., Li, S., Wang, L., Du, F., Zhou, X., Song, Q., Zhao, J., & Fang, R. (2018) · Frontiers in Pharmacology · doi:10.3389/fphar.2018.00850 · Cited by 100
Wang, T., Wang, Z., Yang, P., Xia, L., Zhou, M., Wang, S., Du, J., & Zhang, J. (2016) · Cell Death and Disease · doi:10.1038/cddis.2016.9 · Cited by 96
Ishida, Y., Kimura, A., Nosaka, M., Kuninaka, Y., Hemmi, H., Sasaki, I., Kaisho, T., Mukaida, N., & Kondo, T. (2017) · Scientific Reports · doi:10.1038/s41598-017-17007-8 · Cited by 97
Necroptosis mediates myofibre death in dystrophin-deficient mice
Morgan, J. E., Prola, A., Mariot, V., Pini, V., Meng, J., Hourdé, C., Dumonceaux, J., Conti, F. J. A., Relaix, F., Authier, F., et al. (2018) · Nature Communications · doi:10.1038/s41467-018-06057-9 · Cited by 97
Macrophage polarity and wound age determination
Kuninaka, Y., Ishida, Y., Ishigami, A., Nosaka, M., Matsuki, J., Yasuda, H., Kofuna, A., Kimura, A., Furukawa, F., & Kondo, T. (2022) · Scientific Reports · doi:10.1038/s41598-022-24577-9 · Cited by 95
Ramos, G. V., Pinheiro-Dardis, C. M., Messa, S. P., Delfino, G. B., Marqueti, R. D. C., Salvini, T. F., & Durigan, J. L. Q. (2016) · Scientific Reports · doi:10.1038/srep18525 · Cited by 95
Seebach, E., Freischmidt, H., Holschbach, J., Fellenberg, J., & Richter, W. (2014) · Acta Biomaterialia · doi:10.1016/j.actbio.2014.07.017 · Cited by 92
Myeloid cell dysfunction and the pathogenesis of the diabetic chronic wound
Wicks, K., Torbica, T., & Mace, K. A. (2014) · Seminars in Immunology · doi:10.1016/j.smim.2014.04.006 · Cited by 93
Englund, D. A., Zhang, X., Aversa, Z., & LeBrasseur, N. K. (2021) · Mechanisms of Ageing and Development · doi:10.1016/j.mad.2021.111595 · Cited by 94
Monocyte heterogeneity in cardiovascular disease
Libby, P., Nahrendorf, M., & Świrski, F. K. (2013) · Seminars in Immunopathology · doi:10.1007/s00281-013-0387-3 · Cited by 97
Choi, W., Lee, J.-M., Lee, J.-H., Lee, S. H., & Kim, S. (2019) · Frontiers in Physiology · doi:10.3389/fphys.2019.00914 · Cited by 99
Immune Actions on the Peripheral Nervous System in Pain
Liu, J. A., Yu, J., & Cheung, C. W. (2021) · International Journal of Molecular Sciences · doi:10.3390/ijms22031448 · Cited by 97
Regulatory T cells in skeletal muscle repair and regeneration: recent insights
Wu, J., Ren, B., Wang, D., & Lin, H. (2022) · Cell Death and Disease · doi:10.1038/s41419-022-05142-8 · Cited by 101
Fibrosis development in early-onset muscular dystrophies: Mechanisms and translational implications
Serrano, A. L., & Muñoz‐Cánoves, P. (2016) · Seminars in Cell and Developmental Biology · doi:10.1016/j.semcdb.2016.09.013 · Cited by 97
Recent progress in satellite cell/myoblast engraftment – relevance for therapy
Briggs, D. A., & Morgan, J. E. (2013) · FEBS Journal · doi:10.1111/febs.12273 · Cited by 95
Skeletal Muscle as a Paradigm for Regenerative Biology and Medicine
Gayraud-Morel, B., Chrétien, F., & Tajbakhsh, S. (2009) · Regenerative Medicine · doi:10.2217/17460751.4.2.293 · Cited by 103
Striated muscle function, regeneration, and repair
Shadrin, I. Y., Khodabukus, A., & Bursac, N. (2016) · Cellular and Molecular Life Sciences · doi:10.1007/s00018-016-2285-z · Cited by 106
Vainchtein, I. D., Vinet, J., Brouwer, N., Brendecke, S., Biagini, G., Biber, K., Boddeke, H. W. G. M., & Eggen, B. J. L. (2014) · Glia · doi:10.1002/glia.22711 · Cited by 92
Philippou, Α., Maridaki, M. D., Theos, A., & Koutsilieris, M. (2012) · Advances in clinical chemistry · doi:10.1016/b978-0-12-394383-5.00010-2 · Cited by 92
Modulating exercise-induced hormesis: Does less equal more?
Peake, J. M., Markworth, J. F., Nosaka, K., Raastad, T., Wadley, G. D., & Coffey, V. G. (2015) · Journal of Applied Physiology · doi:10.1152/japplphysiol.01055.2014 · Cited by 98
Helmke, A., Nordlohne, J., Balzer, M. S., Dong, L., Rong, S., Hiß, M., Shushakova, N., Haller, H. G., & von Vietinghoff, S. (2019) · Kidney International · doi:10.1016/j.kint.2018.12.030 · Cited by 92
Patsalos, A., Halász, L., Medina-Serpas, M. A., Berger, W. K., Dániel, B., Tzerpos, P., Kiss, M., Nagy, G., Fischer, C., Simándi, Z., et al. (2021) · The Journal of Experimental Medicine · doi:10.1084/jem.20210420 · Cited by 94
Venosa, A., Malaviya, R., Choi, H., Gow, A. J., Laskin, J. D., & Laskin, D. L. (2015) · American Journal of Respiratory Cell and Molecular Biology · doi:10.1165/rcmb.2015-0120oc · Cited by 92
Macrophages in cardiac homeostasis, injury responses and progenitor cell mobilisation
Pinto, A. R., Godwin, J. W., & Rosenthal, N. A. (2014) · Stem Cell Research · doi:10.1016/j.scr.2014.06.004 · Cited by 94
Cabanas, E. D., Hereu, M., Piedrafita, L., Casanovas, A., Calderó, J., & Esquerda, J. E. (2011) · Journal of Neuropathology & Experimental Neurology · doi:10.1097/nen.0b013e31821cbd8b · Cited by 91
Hanging in the balance: endogenous anti‐inflammatory mechanisms in tissue repair and fibrosis
Ariel, A., & Zeituni-Timor, O. (2012) · The Journal of Pathology · doi:10.1002/path.4108 · Cited by 92
Skeletal muscle inflammation and atrophy in heart failure
Lavine, K. J., & Sierra, O. L. (2017) · Heart Failure Reviews · doi:10.1007/s10741-016-9593-0 · Cited by 96
Regenerative inflammation: When immune cells help to re‐build tissues
Caballero‐Sánchez, N., Alonso‐Alonso, S., & Nagy, L. (2022) · FEBS Journal · doi:10.1111/febs.16693 · Cited by 100
Blomster, L. V., Brennan, F. H., Lao, H. W., Harle, D. W., Harvey, A. R., & Ruitenberg, M. J. (2013) · Experimental Neurology · doi:10.1016/j.expneurol.2013.05.002 · Cited by 97
Multifaceted aspects of inflammation in multiple sclerosis: The role of microglia
Muzio, L., Martino, G., & Furlan, R. (2007) · Journal of Neuroimmunology · doi:10.1016/j.jneuroim.2007.09.016 · Cited by 91
Porcine myelomonocytic markers and cell populations
Ezquerra, Á., Revilla, C., Álvarez, B., Pérez, C., Alonso, F., & Domı́nguez, J. (2008) · Developmental & Comparative Immunology · doi:10.1016/j.dci.2008.06.002 · Cited by 89
Age dependent increase in the levels of osteopontin inhibits skeletal muscle regeneration
Paliwal, P., Pishesha, N., Wijaya, D., & Conboy, I. M. (2012) · Aging · doi:10.18632/aging.100477 · Cited by 89
Blood Vessels and the Satellite Cell Niche
Mounier, R., Chrétien, F., & Chazaud, B. (2011) · Current Topics in Developmental Biology · doi:10.1016/b978-0-12-385940-2.00005-x · Cited by 89
Self-citationDietary strategies to recover from exercise-induced muscle damage
Sousa, M., Teixeira, V. H., & Soares, J. M. (2013) · International Journal of Food Sciences and Nutrition · doi:10.3109/09637486.2013.849662 · Cited by 98
Neutrophil derived CSF1 induces macrophage polarization and promotes transplantation tolerance
Braza, M. S., Conde, P., Garcia, M. R., Cortegano, I., Brahmachary, M., Pothula, V., Fay, F., Boros, P., Werner, S. A., Ginhoux, F., et al. (2018) · American Journal of Transplantation · doi:10.1111/ajt.14645 · Cited by 88
Rossi, A., Dupaty, L., Aillot, L., Zhang, L., Gallien, C., Hallek, M., Odenthal, M., Adriouch, S., Salvetti, A., & Büning, H. (2019) · Scientific Reports · doi:10.1038/s41598-019-40071-1 · Cited by 85
Leukocyte-rich PRP for knee osteoarthritis: Current concepts
Lana, J. F., de Macedo, A. P., Ingrao, I. L. G., Huber, S. C., Santos, G. S., & Santana, M. H. A. (2019) · Journal of Clinical Orthopaedics and Trauma · doi:10.1016/j.jcot.2019.01.011 · Cited by 88
Sicari, B. M., Dearth, C. L., & Badylak, S. F. (2013) · The Anatomical Record · doi:10.1002/ar.22794 · Cited by 88
What are the roles of macrophages and monocytes in human pregnancy?
Tang, M., Hu, X., Liu, Z.-Z., Kwak-Kim, J. Y.-H., & Liao, A. (2015) · Journal of Reproductive Immunology · doi:10.1016/j.jri.2015.08.001 · Cited by 91
Neutrophils launch monocyte extravasation by release of granule proteins
Zernecke, A., Weber, C., & Soehnlein, O. (2009) · Thrombosis and Haemostasis · doi:10.1160/th08-11-0720 · Cited by 90
Direct and macrophage-mediated actions of fatty acids causing insulin resistance in muscle cells
Bilan, P. J., Samokhvalov, V., Koshkina, A., Schertzer, J. D., Samaan, M. C., & Klip, A. (2009) · Archives of Physiology and Biochemistry · doi:10.1080/13813450903079314 · Cited by 88
Protective features of peripheral monocytes/macrophages in stroke
Gliem, M., Schwaninger, M., & Jander, S. (2016) · Biochimica et Biophysica Acta (BBA) - Molecular Basis of Disease · doi:10.1016/j.bbadis.2015.11.004 · Cited by 88
Schwartz, M. (2010) · Brain Behavior and Immunity · doi:10.1016/j.bbi.2010.01.010 · Cited by 88
Immunology Guides Skeletal Muscle Regeneration
Sass, F. A., Fuchs, M. A., Pumberger, M., Geißler, S., Duda, G. N., Perka, C., & Schmidt‐Bleek, K. (2018) · International Journal of Molecular Sciences · doi:10.3390/ijms19030835 · Cited by 89
Resolution of Deep Venous Thrombosis: Proposed Immune Paradigms
Nicklas, J. M., Gordon, A. E., & Henke, P. K. (2020) · International Journal of Molecular Sciences · doi:10.3390/ijms21062080 · Cited by 89
Macrophage function in the elderly and impact on injury repair and cancer
Duong, L., Radley‐Crabb, H. G., Lee, B. R., Dye, D. E., Pixley, F. J., Grounds, M. D., Nelson, D. J., & Jackaman, C. (2021) · Immunity & Ageing · doi:10.1186/s12979-021-00215-2 · Cited by 93
The Many Roles of Macrophages in Skeletal Muscle Injury and Repair
Wang, X., & Zhou, L. (2022) · Frontiers in Cell and Developmental Biology · doi:10.3389/fcell.2022.952249 · Cited by 101
Qin, H., Luo, Z., Sun, Y., He, Z., Qi, B., Chen, Y., Wang, J., Li, C., Lin, W., Han, Z., et al. (2023) · International Journal of Biological Sciences · doi:10.7150/ijbs.79685 · Cited by 86
New Proteins as Vascular Biomarkers in Primary Open Angle Glaucomatous Aqueous Humor
Saccà, S. C., Centofanti, M., & Izzotti, A. (2012) · Investigative Ophthalmology & Visual Science · doi:10.1167/iovs.11-8902 · Cited by 87
Transcriptomic Profiling of the Development of the Inflammatory Response in Human Monocytes In Vitro
Italiani, P., Mazza, E. M. C., Lucchesi, D., Cifola, I., Gemelli, C., Grande, A., Battaglia, C., Bicciato, S., & Boraschi, D. (2014) · PLoS ONE · doi:10.1371/journal.pone.0087680 · Cited by 89
The origins and non-canonical functions of macrophages in development and regeneration
Théret, M., Mounier, R., & Rossi, F. M. V. (2019) · Development · doi:10.1242/dev.156000 · Cited by 90
Protective Autoimmunity: A Unifying Model for the Immune Network Involved in CNS Repair
Schwartz, M., & Raposo, C. (2014) · The Neuroscientist · doi:10.1177/1073858413516799 · Cited by 86
Oyaizu, T., Enomoto, M., Yamamoto, N., Tsuji, K., Horie, M., Muneta, T., Sekiya, I., Okawa, A., & Yagishita, K. (2018) · Scientific Reports · doi:10.1038/s41598-018-19670-x · Cited by 84
Li, X.-C., Luo, S., Wu, F., Zhou, T., Tan, D., Tan, R., Xian, Q.-Z., Li, J., Huang, C., & Wang, M. (2022) · Frontiers in Immunology · doi:10.3389/fimmu.2022.922173 · Cited by 85
Ahmad, K., Shaikh, S., Chun, H. J., Ali, S. M., Lim, J. H., Ahmad, S. S., Lee, E. J., & Choi, I. (2023) · Inflammation and Regeneration · doi:10.1186/s41232-023-00308-z · Cited by 89
Bosurgi, L., Manfredi, A. A., & Rovere, P. Q. (2011) · Frontiers in Immunology · doi:10.3389/fimmu.2011.00062 · Cited by 87
Clements, M. E., Gershenovich, M., Chaber, C. J., Campos‐Rivera, J., Du, P., Zhang, M., Ledbetter, S., & Żuk, A. (2015) · Journal of the American Society of Nephrology · doi:10.1681/asn.2014111138 · Cited by 91
Bryer, S. C., Fantuzzi, G., van Rooijen, N., & Koh, T. J. (2008) · The Journal of Immunology · doi:10.4049/jimmunol.180.2.1179 · Cited by 85
Macrophage polarization in nerve injury: do Schwann cells play a role?
Stratton, J. A., & Shah, P. T. (2016) · Neural Regeneration Research · doi:10.4103/1673-5374.175042 · Cited by 86
Metadata
- Authors
- Arnold, L., Henry, A., Poron, F., Baba-Amer, Y., van Rooijen, N., Plonquet, A., Gherardi, R. K., & Chazaud, B.
- Affiliations
- Inserm (FR)
- Université Paris-Est Créteil (FR)
- 1Institut National de la Santé et de la Recherche Médicale, Unité 841, Institut Mondor de Recherche Biomédicale, “Cell Interactions in the Neuromuscular System” Team, Université Paris 12 Val-de-Marne, 94000 Créteil, France
- Vrije Universiteit Amsterdam (NL)
- Assistance Publique – Hôpitaux de Paris (FR)
- Venue
- The Journal of Experimental Medicine
- Publisher
- Rockefeller University Press
- Published
- 2007-05-07
- Volume
- 204
- Issue
- 5
- Pages
- 1057-1069
- ISSN
- 0022-1007 (ISSN-L)
- 1540-9538
- PMC
- PMC2118577
- OpenAlex
- W2108723188
- Cited by
- 2,002
- References
- 82
- Citations by year
- 2026: 87 · 2025: 83 · 2024: 100 · 2023: 119 · 2022: 124 · 2021: 151 · 2020: 144 · 2019: 134 · 2018: 131 · 2017: 147 · 2016: 119 · 2015: 127 · 2014: 120 · 2013: 101 · 2012: 89
- FWCI
- 20.15
- Type
- journal article
- Language
- en
- Open access
- green
- europepmc.org
- Licence
- cc-by-nc-sa
- Locations
- The Journal of Experimental Medicine (publishedVersion)
- Europe PMC (PubMed Central) (publishedVersion, cc-by-nc-sa)
- PubMed Central (publishedVersion, cc-by-nc-sa)
- PubMed (publishedVersion)
- HAL (submittedVersion, other-oa)
- Funders
- Institut National de la Santé et de la Recherche Médicale
- Topics
- Life Sciences › Biochemistry, Genetics and Molecular Biology › Molecular Biology › Muscle Physiology and Disorders
- Health Sciences › Medicine › Surgery › Wound Healing and Treatments
- Life Sciences › Immunology and Microbiology › Immunology › Immune cells in cancer
- Keywords
- inflammatory monocytes, macrophage polarization, skeletal muscle regeneration, myogenesis, CX3CR1, Ly6C, F4/80, TGF-β1, myotube formation, monocyte depletion, muscle damage
- MeSH terms
- CX3C Chemokine Receptor 1, Animals, Cell Differentiation, Humans, Immunohistochemistry, Macrophages, Mice, Mutant Strains, Microspheres, Monocytes, Phagocytosis, DNA Primers, Muscle, Skeletal, Receptors, Chemokine, Reverse Transcriptase Polymerase Chain Reaction, Muscle Development, CD11b Antigen, Green Fluorescent Proteins, Mice
About these checks
Registry, retraction, Cites and statistics results are computed, not judged, with one exception: a printed reference that no index lists is read once by a model before it counts as a citation error. Claims are extracted by a model and kept only when their quote appears verbatim in the text; each cited source is then checked, with a model’s help, for whether it says what the claim relies on. Those verdicts can be wrong — read the claim’s quote and the cited source before relying on one.
Statistics and arithmetic are recomputed, not judged.
Confidence bands are shown only for fields calibrated on our annotated test set. None is calibrated yet, so no band is shown.
What counts as a claim ›How we measure confidence ›How we check this ›
Are you an author, or do you see a problem with this page? Request a review
