

The DOI matches its Crossref record; 38 of the 38 references it cites were found in a registry or an index.
Clonal analysis reveals multiple functional defects of aged murine hematopoietic stem cells
Open accessAbstract
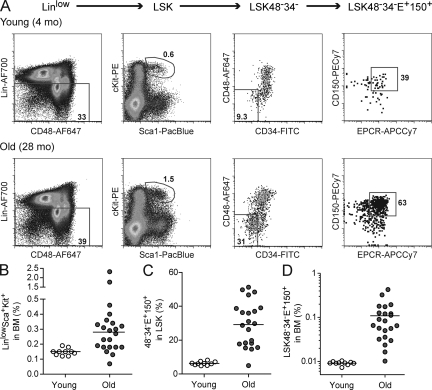
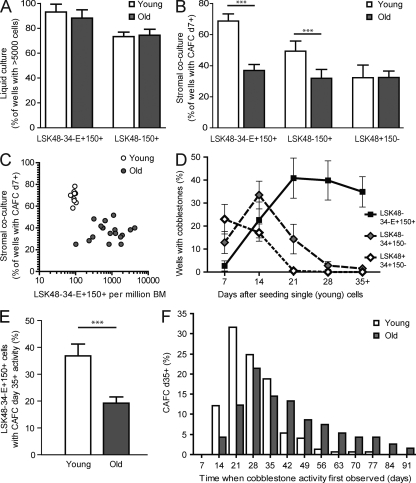
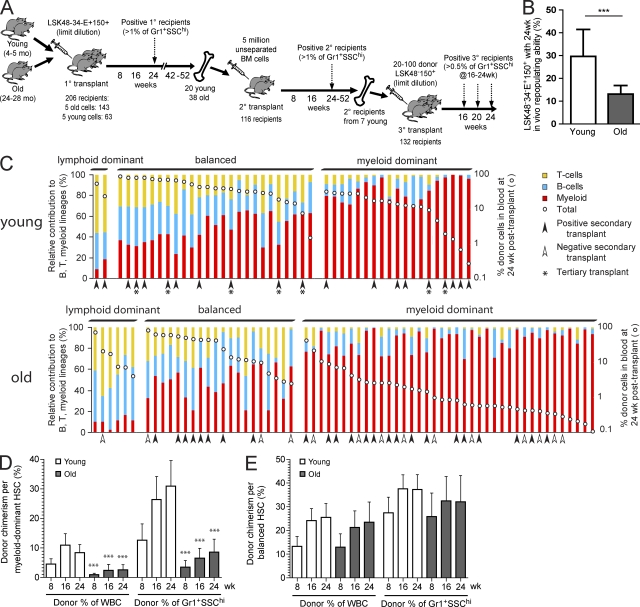
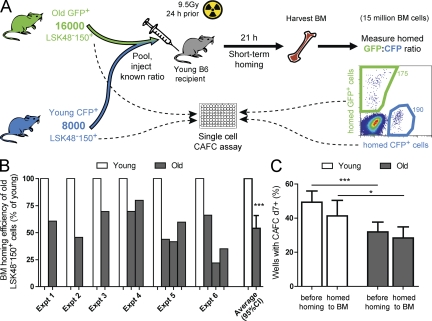
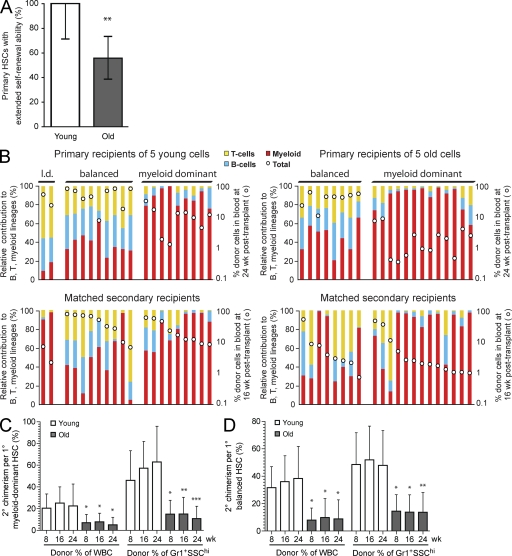
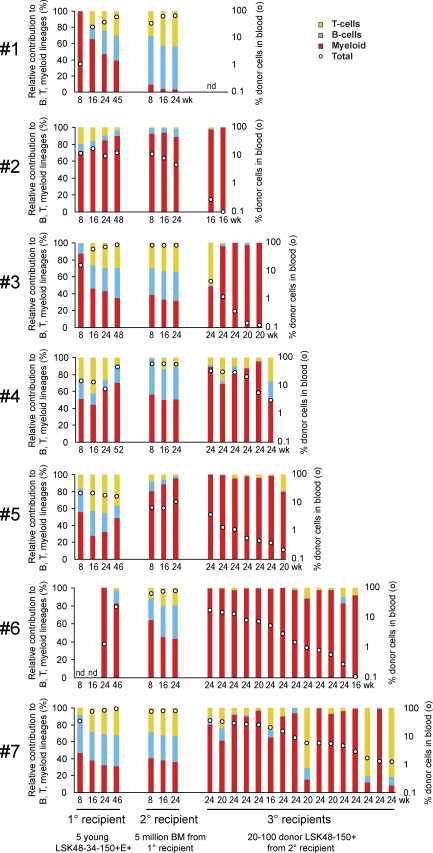
Hematopoietic stem cell (HSC) populations change with aging, but the extent to which this is caused by qualitative versus quantitative alterations in HSC subtypes is unclear. Using clonal assays, in this study we show that the aging HSC compartment undergoes both quantitative and qualitative changes. We observed a variable increase of HSC pool size with age, accompanied by the accumulation of predominantly myeloid-biased HSCs that regenerate substantially fewer mature progeny than young myeloid-biased HSCs and exhibit reduced self-renewal activity as measured by long-term secondary transplantation. Old HSCs had a twofold reduction in marrow-homing efficiency and a similar decrease in functional frequency as measured using long-term transplantation assays. Similarly, old HSCs had a twofold reduced seeding efficiency and a significantly delayed proliferative response compared with young HSCs in long-term stromal cell co-cultures but were indistinguishable in suspension cultures. We show that these functional defects are characteristics of most or all old HSCs and are not indicative of a nonfunctional subset of cells that express HSC markers. Furthermore, we demonstrate that cells with functional properties of old HSCs can be generated directly from young HSCs by extended serial transplantation, which is consistent with the possibility that they arise through a process of cellular aging.
Overview
The claims and statistics of this paper haven’t been checked yet.
Run the check — free, no account needed. It reads the open-access text and checks the sources it cites.
Integrity signals
Registry
Cites
Statistics
Figures
Verification
Claims the paper makes
The claims and statistics of this paper haven’t been checked yet.
Run the check — free, no account needed. It reads the open-access text and checks the sources it cites.
Claims other papers make about this one
Each is checked against this paper’s own text: does it say what the citing paper says it does?
In the citing paper
“Despite the increase in their number, myeloid-biased stem cells are not as robust as their young counterparts (24)”
From Causes, consequences, and reversal of immune system aging (2013) · cites this paper as [24]
In the citing paper
“That aged HSC are functionally impaired compared with their young counterparts upon transplantation in young mice”
From Aging of hematopoietic stem cells (2018) · cites this paper as [10]
In the citing paper
“the functional heterogeneity of the HSC population increases with age.”
From Aging of hematopoietic stem cells (2018) · cites this paper as [10]
In the citing paper
“in aged mice that display an overall increase in HSC pool size”
From Aging of hematopoietic stem cells (2018) · cites this paper as [10]
In the citing paper
“individual HSCs behave very differently.”
From Aging of hematopoietic stem cells (2018) · cites this paper as [10]
In the citing paper
“mice in which blood cell production is derived from even a single stem cell, are not necessarily prone to develop leukemia.”
From Aging of hematopoietic stem cells (2018) · cites this paper as [10]
Self-check
Percentages, sums and reported differences re-computed from the paper’s own numbers.
The self-check needs the paper’s full text.
Citations
Cites
Hu, Y., & Smyth, G. K. (2009) · Journal of Immunological Methods · doi:10.1016/j.jim.2009.06.008 · Cited by 2,084 · cited 1×
“…to Gr-1+SSChi cells at 24 wk after transplant were considered to be repopulated with HSCs and were counted as positive for the purposes of the limiting dilution calculation, performed using the Web-based calculator provided at http://bioinf.wehi.edu .au/software/elda/ (Hu and Smyth, 2009).”
MethodWilson, A., Laurenti, E., Oser, G., van der Wath, R. C., Blanco-Bose, W., Jaworski, M., Offner, S., Dunant, C. F., Eshkind, L., Bockamp, E., et al. (2008) · Cell · doi:10.1016/j.cell.2008.10.048 · Cited by 1,908 · cited 1×
“To confirm the utility of this measurement, we sorted three LSK subpopulations from young BM: LSK4834E+150+, LSK4834+150, and LSK48+34+150, which are known to contain HSCs, more primitive multipotent progenitors (MPPs), and less primitive MPPs, respectively (Wilson et al., 2008).”
MethodCell intrinsic alterations underlie hematopoietic stem cell aging
Rossi, D. J., Bryder, D., Zahn, J. M., Ahlenius, H., Sonu, R., Wagers, A. J., & Weissman, I. L. (2005) · Proceedings of the National Academy of Sciences · doi:10.1073/pnas.0503280102 · Cited by 1,152 · cited 2×
“…of these differences is that upon transplantation; old HSCs tend to have a myeloid-skewed blood cell production caused by a decreased ability to produce lymphoid cells (Sudo et al., 2000; Kim et al., 2003; Liang et al., 2005; Rossi et al., 2005; Cho et al., 2008; Beerman et al., 2010a).”
BackgroundDeficiencies in DNA damage repair limit the function of haematopoietic stem cells with age
Rossi, D. J., Bryder, D., Seita, J., Nussenzweig, A., Hoeijmakers, J., & Weissman, I. L. (2007) · Nature · doi:10.1038/nature05862 · Cited by 1,115 · cited 5×
“Consistent with earlier studies (Morrison et al., 1996; Sudo et al., 2000; Rossi et al., 2007b), the median proportion of LinloSca1+cKit+ (LSK) cells within the BM increased 1.9-fold in old mice (Fig.”
BackgroundResultInfluentialIsolation of Single Human Hematopoietic Stem Cells Capable of Long-Term Multilineage Engraftment
Notta, F., Doulatov, S., Laurenti, E., Poeppl, A., Jurisica, I., & Dick, J. E. (2011) · Science · doi:10.1126/science.1201219 · Cited by 919 · cited 1×
“Exciting recent developments in purification and assays for human HSCs (Notta et al., 2011) finally open up the possibility for similar interrogation of the aged human HSC pool at a clonal level.”
BackgroundIn vivo labeling with 2H2O reveals a human neutrophil lifespan of 5.4 days
Pillay, J., den Braber, I., Vrisekoop, N., Kwast, L. M., de Boer, R. J., Borghans, J. A. M., Tesselaar, K., & Koenderman, L. (2010) · Blood · doi:10.1182/blood-2010-01-259028 · Cited by 873 · cited 1×
“As a strict measure for long-term, active hematopoiesis, we considered a mouse to be transplanted with an HSC only if there was a minimum 1% donor contribution to the short-lived (Pillay et al., 2010) granulocyte population (defined as Gr-1+SSChi) at 24 wk after transplant.”
BackgroundThe aging of hematopoietic stem cells
Morrison, S. J., Wandycz, A. M., Akashi, K., Globerson, A., & Weissman, I. L. (1996) · Nature Medicine · doi:10.1038/nm0996-1011 · Cited by 853 · cited 5×
“…expressing HSC-associated markers is contaminated with primitive progenitors that are detected by in vitro assays but lack repopulating ability in vivo (Sudo et al., 2000) or that HSCs from old mice have a homing and/or engraftment defect and therefore remain undetected (Morrison et al., 1996).”
BackgroundResultInfluentialAging Hematopoietic Stem Cells Decline in Function and Exhibit Epigenetic Dysregulation
Chambers, S. M., Shaw, C. A., Gatza, C. E., Fisk, C. J., Donehower, L. A., & Goodell, M. A. (2007) · PLoS Biology · doi:10.1371/journal.pbio.0050201 · Cited by 799
Age-Associated Characteristics of Murine Hematopoietic Stem Cells
Sudo, K., Ema, H., Morita, Y., & Nakauchi, H. (2000) · The Journal of Experimental Medicine · doi:10.1084/jem.192.9.1273 · Cited by 722 · cited 8×
“…expressing HSC-associated markers is contaminated with primitive progenitors that are detected by in vitro assays but lack repopulating ability in vivo (Sudo et al., 2000) or that HSCs from old mice have a homing and/or engraftment defect and therefore remain undetected (Morrison et al., 1996).”
BackgroundResultInfluentialBeerman, I., Bhattacharya, D., Zandi, S., Sigvardsson, M., Weissman, I. L., Bryder, D., & Rossi, D. J. (2010) · Proceedings of the National Academy of Sciences · doi:10.1073/pnas.1000834107 · Cited by 711
Cited by
Sorted by citations
Clearance of senescent cells by ABT263 rejuvenates aged hematopoietic stem cells in mice
Chang, J., Wang, Y., Shao, L., Laberge, R.-M., Demaria, M., Campisi, J., Janakiraman, K., Sharpless, N. E., Ding, S., Feng, W., et al. (2016) · Nature Medicine · doi:10.1038/nm.4010 · Cited by 1,819
Age-dependent dysregulation of innate immunity
Shaw, A. C., Goldstein, D. R., & Montgomery, R. R. (2013) · Nature Reviews Immunology · doi:10.1038/nri3547 · Cited by 1,061
Haematopoietic stem cell activity and interactions with the niche
Pinho, S., & Frenette, P. S. (2019) · Nature Reviews Molecular Cell Biology · doi:10.1038/s41580-019-0103-9 · Cited by 1,064
Kowalczyk, M. S., Tirosh, I., Heckl, D., Rao, T. N., Dixit, A., Haas, B. J., Schneider, R. K., Wagers, A. J., Ebert, B. L., & Regev, A. (2015) · Genome Research · doi:10.1101/gr.192237.115 · Cited by 778
“…et al. 2000; Rossi et al. 2005) that shows decreased regenerative potential (Morrison et al. 1996; Sudo et al. 2000; Kim et al. 2003; Rossi et al. 2005; Dykstra et al. 2011) and a myeloid-skewed differentiation potential (Sudo et al. 2000; Kim et al. 2003; Liang et al. 2005; Rossi et al. 2005).”
BackgroundCauses, consequences, and reversal of immune system aging
Montecino-Rodriguez, E., Berent-Maoz, B., & Dorshkind, K. (2013) · Journal of Clinical Investigation · doi:10.1172/jci64096 · Cited by 793
“Despite the increase in their number, myeloid-biased stem cells are not as robust as their young counterparts (24), which in turn could underlie the numerous age-related deficiencies observed in mature myeloid cells such as neutrophils and macrophages (25, 26).”
Hematopoietic stem cell niche maintenance during homeostasis and regeneration
Mendelson, A., & Frenette, P. S. (2014) · Nature Medicine · doi:10.1038/nm.3647 · Cited by 819
Sun, D., Luo, M., Jeong, M., Rodriguez, B., Xia, Z., Hannah, R., Wang, H., Le, T., Faull, K. F., Chen, R., et al. (2014) · Cell Stem Cell · doi:10.1016/j.stem.2014.03.002 · Cited by 686
“The myeloid dominance is caused partly by a shift in the clonal composition of the HSC compartment (Beerman et al., 2010; Challen et al., 2010; Cho et al., 2008) but also reflects diminished differentiation capacity of individual HSCs (Dykstra et al., 2011).”
BackgroundThe ageing haematopoietic stem cell compartment
Geiger, H., de Haan, G., & Florian, M. C. (2013) · Nature Reviews Immunology · doi:10.1038/nri3433 · Cited by 604
Cdc42 activity regulates hematopoietic stem cell aging and rejuvenation
Florian, M. C., Dörr, K., Niebel, A., Daria, D., Schrezenmeier, H., Rojewski, M., Filippi, M.-D., Hasenberg, A., Gunzer, M., Scharffetter-Kochanek, K., et al. (2012) · Cell Stem Cell · doi:10.1016/j.stem.2012.04.007 · Cited by 564
“Because aged HSCs exhibit a 2-fold reduced ability to home to the BM (Dykstra et al., 2011; Liang et al., 2005) and aged early hematopoietic progenitor cells localize more distantly from the (A) Schematic representation of the experimental setup.”
InfluentialHematopoietic stem cells: concepts, definitions, and the new reality
Eaves, C. J. (2015) · Blood · doi:10.1182/blood-2014-12-570200 · Cited by 588
“The results thus obtained indicate that all of these purification strategies isolate the same, or very similar, cellpopulations.(33,41,42,44-46) Interestingly,very fewof themarkersgenerally used to purify LTRCs contribute to their functional properties, suggesting that new, more relevant markers may still be awaiting…”
ResultBeerman, I., Bock, C., Garrison, B. S., Smith, Z. D., Gu, H., Meissner, A., & Rossi, D. J. (2013) · Cell Stem Cell · doi:10.1016/j.stem.2013.01.017 · Cited by 485
“…et al., 2007), loss of cell polarity (Florian et al., 2012), dominance of lineage-biased HSC clones (Beerman et al., 2010a; Challen et al., 2010; Dykstra et al., 2011; Muller-Sieburg et al., 2004), and DNA damage accumulation (Rossi et al., 2007; Rü be et al., 2011; Wang et al., 2012; Yahata et…”
Cardiac macrophages promote diastolic dysfunction
Hulsmans, M., Sager, H. B., Roh, J. D., Valero‐Muñoz, M., Houstis, N. E., Iwamoto, Y., Sun, Y., Wilson, R. M., Wojtkiewicz, G. R., Tricot, B., et al. (2018) · The Journal of Experimental Medicine · doi:10.1084/jem.20171274 · Cited by 508
“Aging is associated with functionally compromised HSCs, which expand phenotypically (Dykstra et al., 2011; Beerman et al., 2013) and develop a myeloid bias (Beerman et al.”
BackgroundAge-dependent modulation of vascular niches for haematopoietic stem cells
Kusumbe, A. P., Ramasamy, S. K., Itkin, T., Mäe, M. A., Langen, U. H., Betsholtz, C., Lapidot, T., & Adams, R. H. (2016) · Nature · doi:10.1038/nature17638 · Cited by 474
Aging of hematopoietic stem cells
de Haan, G., & Lazare, S. S. (2018) · Blood · doi:10.1182/blood-2017-06-746412 · Cited by 432
Beerman, I., Seita, J., Inlay, M. A., Weissman, I. L., & Rossi, D. J. (2014) · Cell Stem Cell · doi:10.1016/j.stem.2014.04.016 · Cited by 445
“Mounting evidence suggests that aging-associated changes in hemopoietic stem cells (HSCs) autonomously contribute to many of these age-related phenotypes throughdiversemechanisms involvingdiminution of regenerative potential (Dykstra et al., 2011; Rossi et al., 2005; Sudo et al., 2000), changes in lineage potential an…”
BackgroundInfluentialAgeing and atherosclerosis: vascular intrinsic and extrinsic factors and potential role of IL-6
Tyrrell, D. J., & Goldstein, D. R. (2020) · Nature Reviews Cardiology · doi:10.1038/s41569-020-0431-7 · Cited by 447
Demand-adapted regulation of early hematopoiesis in infection and inflammation
Takizawa, H., Boettcher, S., & Manz, M. G. (2012) · Blood · doi:10.1182/blood-2011-12-380113 · Cited by 420
DNA damage checkpoints in stem cells, ageing and cancer
Sperka, T., Wang, J., & Rudolph, K. L. (2012) · Nature Reviews Molecular Cell Biology · doi:10.1038/nrm3420 · Cited by 393
Alcohol and endogenous aldehydes damage chromosomes and mutate stem cells
Garaycoechea, J. I., Crossan, G. P., Langevin, F., Mulderrig, L., Louzada, S., Yang, F., Guilbaud, G., Park, N., Roerink, S. F., Nik‐Zainal, S., et al. (2018) · Nature · doi:10.1038/nature25154 · Cited by 397
Medyouf, H., Mossner, M., Jann, J.-C., Nolte, F., Raffel, S., Herrmann, C., Lier, A., Eisen, C., Nowak, V., Zens, B., et al. (2014) · Cell stem cell · doi:10.1016/j.stem.2014.02.014 · Cited by 399
“To date, there are no surface markers that allow us to distinguish MDS stem cells from normal HSCs.”
BackgroundInfluentialBao, H., Cao, J., Chen, M., Min, C., Chen, W., Chen, X., Chen, Y., Chen, Y., Chen, Y., Chen, Z., et al. (2023) · Science China Life Sciences · doi:10.1007/s11427-023-2305-0 · Cited by 402
Inflamm-aging of hematopoiesis, hematopoietic stem cells, and the bone marrow microenvironment
Kovtonyuk, L. V., Fritsch, K., Feng, X., Manz, M. G., & Takizawa, H. (2016) · Frontiers in Immunology · doi:10.3389/fimmu.2016.00502 · Cited by 371
“These characteristics of HSC aging can, in part, be experimentally recapitulated by increasing the proliferative history of HSCs or stressing them with multiple injections of myeloablative chemotherapeutic regimens (57), or by conducting serial transplantations (“experimental aging”) (34, 35).”
BackgroundGrover, A., Sanjuán-Pla, A., Thongjuea, S., Carrelha, J., Giustacchini, A., Gambardella, A. R., Macaulay, I. C., Mancini, E., Luis, T. C., Mead, A. J., et al. (2016) · Nature Communications · doi:10.1038/ncomms11075 · Cited by 361
“Genes (11,910) were selected for PCA analysis based on coefficient of variation (CVZ1) and mean of expression values across all cells (log2(CPM)40).”
MethodBenz, C., Copley, M. R., Kent, D. G., Wöhrer, S., Cortés, A., Aghaeepour, N., Ma, E., Mader, H., Rowe, K. M., Day, C. W., et al. (2012) · Cell stem cell · doi:10.1016/j.stem.2012.02.007 · Cited by 322
“The observation of dominant a-HSCs in old mice confirms similar recent reports of an alteration in the composition of the HSC compartment during aging (Beerman et al., 2010; Cho et al., 2008; Dykstra et al., 2011) and is relevant to the question of the mechanisms responsible for the well-documented age-associated decl…”
ResultWhen stem cells grow old: phenotypes and mechanisms of stem cell aging
Schultz, M. B., & Sinclair, D. A. (2016) · Development · doi:10.1242/dev.130633 · Cited by 341
“Only when function was measured on a per-cell basis were old immunophenotypic HSCs shown to have a greatly reduced ability to engraft and properly differentiate in new hosts (Dykstra et al., 2011; Liang et al., 2005; Morrison et al., 1996).”
BackgroundHo, Y.-H., del Toro, R., Rivera-Torres, J., Rak, J., Korn, C., García-García, A., Macías, D., González-Gómez, C., del Monte, A., Wittner, M., et al. (2019) · Cell Stem Cell · doi:10.1016/j.stem.2019.06.007 · Cited by 315
“Although HSC aging was initially regarded as solely derived from intrinsic changes in HSCs (Chambers et al., 2007; Dykstra et al., 2011; Florian et al., 2013; Rossi et al., 2007), several alterations in the BM microenvironment or in its interaction with HSCs have been proposed to promote hematopoietic aging (Ergen et…”
BackgroundInduction of myelodysplasia by myeloid-derived suppressor cells
Chen, X., Eksioglu, E. A., Zhou, J., Zhang, L., Djeu, J., Fortenbery, N., Epling-Burnette, P., Van Bijnen, S., Dolstra, H., Cannon, J., et al. (2013) · Journal of Clinical Investigation · doi:10.1172/jci67580 · Cited by 316
“…indicate that TRAF6 is essential for survival and proliferation of MDS HSPC (11) and sustained TLR activation skews their commitment toward the myeloid lineage while suppressing osteoblast differentiation (12, 13), analogous to the senescence-dependent changes observed with normal aging (14).”
Hematopoietic progenitor cells as integrative hubs for adaptation to and fine-tuning of inflammation
Chavakis, T., Mitroulis, I., & Hajishengallis, G. (2019) · Nature Immunology · doi:10.1038/s41590-019-0402-5 · Cited by 330
Hematopoietic stem cells count and remember self-renewal divisions
Bernitz, J. M., Kim, H. S., MacArthur, B., Sieburg, H., & Moore, K. (2016) · Cell · doi:10.1016/j.cell.2016.10.022 · Cited by 285
“While the HSC compartment expands dramatically with age (Beerman et al., 2010; Dykstra et al., 2011; Rossi et al., 2005; Sudo et al., 2000), functional LTHSC numbers within aging BM expand but to a lesser extent (Cho et al., 2008; Morrison et al., 1996; Sudo et al., 2000).”
InfluentialGuan, J., Simon, A. K., Prescott, M., Menéndez, J. A., Liu, F., Wang, F., Wang, C., Wolvetang, E. J., Vázquez‐Martín, A., & Zhang, J. (2013) · Autophagy · doi:10.4161/auto.24132 · Cited by 292
“HSCs from aged mice show a reduced repopulating activity per cell, attenuated self-renewal and homing abilities, myeloid skewing of differentiation, and an increased level of stress-induced apoptosis.(74) This phenotype is largely reminiscent of the one found in HSCs from mice deficient for ATG7 or RB1CC1/FIP200.”
BackgroundAging, inflammation, immunity and periodontal disease
Ebersole, J. L., Graves, C. L., González, O. A., Dawson, D. R., Morford, L. A., Emecen‐Huja, P., Hartsfield, J. K., Huja, S. S., Pandruvada, S. N. M., & Wallet, S. M. (2016) · Periodontology 2000 · doi:10.1111/prd.12135 · Cited by 315
Chaperone-mediated autophagy sustains haematopoietic stem-cell function
Dong, S., Wang, Q., Kao, Y.-R., Diaz, A., Tasset, I., Kaushik, S., Thiruthuvanathan, V., Zintiridou, A., Nieves, E., Dzieciatkowska, M., et al. (2021) · Nature · doi:10.1038/s41586-020-03129-z · Cited by 275
The Stem Cell Niche in Regenerative Medicine
Wagers, A. J. (2012) · Cell stem cell · doi:10.1016/j.stem.2012.02.018 · Cited by 281
“Likewise, high throughput chemical screening using purified human HSCs has identified soluble signals, such as inhibition of ligand-induced signaling by the aryl hydrocarbon receptor (AhR), that can promote in vitro expansion of umbilical cord and mobilized peripheral blood-derived human HSCs (Boitano et al., 2010; M.…”
BackgroundInfluentialMacrophages in age-related chronic inflammatory diseases
Oishi, Y., & Manabe, I. (2016) · npj Aging and Mechanisms of Disease · doi:10.1038/npjamd.2016.18 · Cited by 262
“Despite the skewing of aged HSCs toward myelopoiesis, however, the basal inflammation seen in older individuals is not associated with increased numbers of myeloid cells, presumably reflecting multiple functional defects in the homing and proliferative responses of aged HSCs.(1,15) Immunosenescence leads not only to i…”
BackgroundImmune aging, dysmetabolism, and inflammation in neurological diseases
Deleidi, M., Jäggle, M., & Rubino, G. (2015) · Frontiers in Neuroscience · doi:10.3389/fnins.2015.00172 · Cited by 260
“Diseases (DZNE), Hertie Institute for Clinical Brain Research, University of Tübingen, Otfried-Müller.”
BackgroundInfluentialThe Human Cell Atlas bone marrow single-cell interactive web portal
Hay, S. B., Ferchen, K., Chetal, K., Grimes, H. L., & Salomonis, N. (2018) · Experimental Hematology · doi:10.1016/j.exphem.2018.09.004 · Cited by 256
Mitofusin 2 maintains haematopoietic stem cells with extensive lymphoid potential
Luchsinger, L. L., de Almeida, M. J., Corrigan, D., Mumau, M. D., & Snoeck, H. (2016) · Nature · doi:10.1038/nature16500 · Cited by 247
Roles of JAK2 in Aging, Inflammation, Hematopoiesis and Malignant Transformation
Perner, F., Perner, C., Ernst, T., & Heidel, F. H. (2019) · Cells · doi:10.3390/cells8080854 · Cited by 248
“As the hematopoietic system ages, somatic mutations lead to a decline in the HSC function and skewing towards the myeloid compartment [1,2].”
BackgroundThe hematopoietic stem cell niche: from embryo to adult
Gao, X., Xu, C., Asada, N., & Frenette, P. S. (2018) · Development · doi:10.1242/dev.139691 · Cited by 247
“Aged HSCs are more proliferative and their numbers increase in the aged bone marrow (de Haan et al., 1997; Dykstra et al., 2011; Morrison et al., 1996; Rossi et al., 2005).”
BackgroundKlauke, K., Radulović, V., Broekhuis, M., Weersing, E., Zwart, E., Olthof, S., Ritsema, M., Bruggeman, S., Wu, X., Helin, K., et al. (2013) · Nature Cell Biology · doi:10.1038/ncb2701 · Cited by 237
Self-citationLineage-Biased Hematopoietic Stem Cells Are Regulated by Distinct Niches
Pinho, S., Marchand, T., Yang, E. M., Wei, Q., Nerlov, C., & Frenette, P. S. (2018) · Developmental Cell · doi:10.1016/j.devcel.2018.01.016 · Cited by 235
“…et al., 2002; Sanjuan-Pla et al., 2013; Sieburg et al., 2006), whereas myeloid-biased HSCs become dominant with age (Cho et al., 2008; Dykstra et al., 2011; Grover et al., 2016) with declined long-term self-renewal functions, possibly contributing to the development of hematologic…”
BackgroundEpigenetic Memory Underlies Cell-Autonomous Heterogeneous Behavior of Hematopoietic Stem Cells
Yu, V. W. C., Yusuf, R. Z., Oki, T., Wu, J. W., Sáez, B., Wang, X., Cook, C., Baryawno, N., Ziller, M. J., Lee, E., et al. (2017) · Cell · doi:10.1016/j.cell.2017.02.010 · Cited by 239
Depleting myeloid-biased haematopoietic stem cells rejuvenates aged immunity
Ross, J., Myers, L. M., Noh, J. J., Collins, M. M., Carmody, A., Messer, R. J., Dhuey, E., Hasenkrug, K. J., & Weissman, I. L. (2024) · Nature · doi:10.1038/s41586-024-07238-x · Cited by 245
Targeting immune dysfunction in aging
Borgoni, S., Kudryashova, K. S., Burka, K., & de Magalhães, J. P. (2021) · Ageing Research Reviews · doi:10.1016/j.arr.2021.101410 · Cited by 232
Adelman, E. R., Huang, H.-T., Roisman, A., Olsson, A., Colaprico, A., Qin, T., Lindsley, R. C., Bejar, R. L., Salomonis, N., Grimes, H. L., et al. (2019) · Cancer Discovery · doi:10.1158/2159-8290.cd-18-1474 · Cited by 234
Decline in IGF1 in the bone marrow microenvironment initiates hematopoietic stem cell aging
Young, K., Eudy, E., Bell, R., Loberg, M. A., Stearns, T., Sharma, D., Velten, L., Haas, S., Filippi, M.-D., & Trowbridge, J. J. (2021) · Cell Stem Cell · doi:10.1016/j.stem.2021.03.017 · Cited by 216
Impact of genomic damage and ageing on stem cell function
Behrens, A., van Deursen, J. M., Rudolph, K. L., & Schumacher, B. (2014) · Nature Cell Biology · doi:10.1038/ncb2928 · Cited by 207
Large-Scale Clonal Analysis Resolves Aging of the Mouse Hematopoietic Stem Cell Compartment
Yamamoto, R., Wilkinson, A. C., Ooehara, J., Lan, X., Lai, C.-Y., Nakauchi, Y., Pritchard, J. K., & Nakauchi, H. (2018) · Cell Stem Cell · doi:10.1016/j.stem.2018.03.013 · Cited by 202
“, 2011), myeloid-biased differentiation (Dykstra et al., 2011; Sudo et al., 2000), P-biased differentiation (Grover et al.”
InfluentialThe multifaceted role of autophagy in cancer and the microenvironment
Folkerts, H., Hilgendorf, S., Vellenga, E., Bremer, E., & Wiersma, V. R. (2018) · Medicinal Research Reviews · doi:10.1002/med.21531 · Cited by 203
Epigenetic Memory Underlies Cell-Autonomous Heterogeneous Behavior of Hematopoietic Stem Cells
Yu, V. W. C., Yusuf, R. Z., Oki, T., Wu, J. W., Sáez, B., Wang, X., Cook, C., Baryawno, N., Ziller, M. J., Lee, E., et al. (2016) · Cell · doi:10.1016/j.cell.2016.10.045 · Cited by 207
“…November 17, 2016 ª 2016 Elsevier Inc. to exhibit bias toward myeloid, lymphoid, or megakaryocytic lineage upon transplantation of single cells (Dykstra et al., 2007, 2011; Morita et al., 2010), on ex vivo barcoding and transplantation of populations (Aiuti et al., 2013; Gerrits et al.,…”
BackgroundHeterogeneous Responses of Hematopoietic Stem Cells to Inflammatory Stimuli Are Altered with Age
Mann, M., Mehta, A., de Boer, C. G., Kowalczyk, M. S., Lee, K., Haldeman, P., Rogel, N., Knecht, A. R., Farouq, D., Regev, A., et al. (2018) · Cell Reports · doi:10.1016/j.celrep.2018.11.056 · Cited by 188
Hematopoiesis and Cardiovascular Disease
Poller, W. C., Nahrendorf, M., & Świrski, F. K. (2020) · Circulation Research · doi:10.1161/circresaha.120.315895 · Cited by 191
Verovskaya, E. V., Broekhuis, M., Zwart, E., Ritsema, M., van Os, R. P., de Haan, G., & Bystrykh, L. V. (2013) · Blood · doi:10.1182/blood-2013-01-481135 · Cited by 175
“Studies of unmanipulated old and young HSCs have indicated an ;twofold reduced functional activity of old cells.(13) To compensate for the expected decrease of functional activity in old HSCs, we initiated the experiment with LSK48(2)150(1) cells from young and old mice cotransplanted in a 1:2 ratio (Figure 6A).”
BackgroundMethodResultInfluentialSelf-citationMyeloproliferative neoplasm stem cells
Mead, A. J., & Mullally, A. (2017) · Blood · doi:10.1182/blood-2016-10-696005 · Cited by 187
“Given the increased prevalence of CHIP in older individuals, it is interesting to note that aging has significant effects on HSC heterogeneity, including an increase in myeloid-biased differentiation, a decreased output of differentiated cells, and a reduced capacity for self-renewal in longterm secondary transplantat…”
BackgroundMitochondrial Potentiation Ameliorates Age-Related Heterogeneity in Hematopoietic Stem Cell Function
Mansell, E., Sigurðsson, V., Deltcheva, E. M., Brown, J., James, C. T., Miharada, K., Soneji, S., Larsson, J. T., & Enver, T. (2020) · Cell stem cell · doi:10.1016/j.stem.2020.09.018 · Cited by 187
“Upon aging of the hematopoietic system, the phenotypic HSC pool expands but collectively displays reduced repopulation capacity, increased clonality, myeloid-biased blood output, and lymphoid and erythroid deficiency (Sudo et al., 2000; Liang et al., 2005; Norddahl et al., 2011; Dykstra et al., 2011; Grover et al., 20…”
BackgroundHematopoietic Stem Cell Heterogeneity Takes Center Stage
Copley, M. R., Beer, P. A., & Eaves, C. J. (2012) · Cell stem cell · doi:10.1016/j.stem.2012.05.006 · Cited by 181
“Likewise, the initial pattern of differentiation by which they are defined is frequently expressed by their clonally generated daughter HSCs when these are transplanted into secondary mice (Benz Cell et al., 2012; Dykstra et al., 2007, 2011; MüllerSieburg et al., 2002, 2012).”
BackgroundInfluentialAging, Clonality, and Rejuvenation of Hematopoietic Stem Cells
Akunuru, S., & Geiger, H. (2016) · Trends in Molecular Medicine · doi:10.1016/j.molmed.2016.06.003 · Cited by 178
“This feature of aged HSCs is demonstrated to be a cellautonomous function [3,31].”
BackgroundIL-1 mediates microbiome-induced inflammaging of hematopoietic stem cells in mice
Kovtonyuk, L. V., Caiado, F., Garcia-Martin, S., Manz, E.-M., Helbling, P., Takizawa, H., Boettcher, S., Al-Shahrour, F., Nombela-Arrieta, C., Slack, E., et al. (2022) · Blood · doi:10.1182/blood.2021011570 · Cited by 166
B cell maintenance and function in aging
Kogut, I., Scholz, J. L., Cancro, M. P., & Cambier, J. C. (2012) · Seminars in Immunology · doi:10.1016/j.smim.2012.04.004 · Cited by 166
Horiguchi, H., Loftus, T. J., Hawkins, R. B., Raymond, S. L., Stortz, J. A., Hollen, M. K., Weiss, B. P., Miller, E. S., Bihorac, A., Larson, S. D., et al. (2018) · Frontiers in Immunology · doi:10.3389/fimmu.2018.00595 · Cited by 164
“They have a lower functional frequency, a delayed proliferative response, and a reduced efficiency for short-term BM homing, and they produce smaller clones of mature cells and have a reduced long-term selfrenewal activity (210, 211).”
BackgroundStem cell heterogeneity: implications for aging and regenerative medicine
Müller‐Sieburg, C. E., Sieburg, H. B., Bernitz, J. M., & Cattarossi, G. (2012) · Blood · doi:10.1182/blood-2011-12-376749 · Cited by 164
“However, in a carefully executed study, Dykstra and colleagues recently examined a very large number of CD150+ HSC clones and reported that CD150+ cells from aged mice have less self-renewal capacity and home less efficiently to BM than CD150+ cells isolated from young animals.(55) This deficit can be attributed large…”
InfluentialAging disrupts circadian gene regulation and function in macrophages
Blacher, E., Tsai, C. A., Litichevskiy, L., Shipony, Z., Iweka, C. A., Schneider, K. M., Chuluun, B., Heller, H. C., Menon, V., Thaiss, C. A., et al. (2021) · Nature Immunology · doi:10.1038/s41590-021-01083-0 · Cited by 172
Zeng, X., Li, X., Li, X., Wei, C., Shi, C., Hu, K., Kong, D., Luo, Q., Xu, Y., Shan, W., et al. (2023) · Blood · doi:10.1182/blood.2022017514 · Cited by 157
Aging alters the epigenetic asymmetry of HSC division
Florian, M. C., Klose, M., Saçma, M., Jablanovic, J., Knudson, L. A., Nattamai, K., Marka, G., Vollmer, A., Soller, K., Sakk, V., et al. (2018) · PLoS Biology · doi:10.1371/journal.pbio.2003389 · Cited by 160
Rimmelé, P., Bigarella, C. L., Liang, R. H.-S., Izac, B., Dieguez‐Gonzalez, R., Barbet, G., Donovan, M. J., Brugnara, C., Blander, J. M., Sinclair, D. A., et al. (2014) · Stem Cell Reports · doi:10.1016/j.stemcr.2014.04.015 · Cited by 154
“3 j 44–59 j July 8, 2014 j a2014 The Authors prominent modifications of HSC properties with age is their biased differentiation toward myeloid lineage at the expense of their lymphoid potential (Challen et al., 2010; Dykstra et al., 2011; Rossi et al., 2005).”
BackgroundFunctional dysregulation of stem cells during aging: a focus on skeletal muscle stem cells
García‐Prat, L., Sousa‐Victor, P., & Muñoz‐Cánoves, P. (2013) · The FEBS Journal · doi:10.1111/febs.12221 · Cited by 152
Microenvironmental contributions to hematopoietic stem cell aging
Ho, Y., & Méndez‐Ferrer, S. (2019) · Haematologica · doi:10.3324/haematol.2018.211334 · Cited by 156
Aging-associated inflammation promotes selection for adaptive oncogenic events in B cell progenitors
Henry, C. J., Casás-Selves, M., Kim, J., Zaberezhnyy, V., Aghili, L., Daniel, A. E., Jimenez, L., Azam, T., McNamee, E. N., Clambey, E. T., et al. (2015) · Journal of Clinical Investigation · doi:10.1172/jci83024 · Cited by 148
Nilsson, A. R., Soneji, S., Adolfsson, S., Bryder, D., & Pronk, C. J. (2016) · PLoS ONE · doi:10.1371/journal.pone.0158369 · Cited by 161
“In several reports, aged murine HSCs have been characterized by an increased myeloid-to-lymphoid output, often referred to as a myeloid bias (My-bi), although also their myeloid cell forming ability is decreased on a per cell basis when compared to younger HSCs [14, 18].”
ResultJakobsen, N. A., Turkalj, S., Zeng, A. G. X., Stoilova, B., Metzner, M., Rahmig, S., Nagree, M. S., Shah, S., Moore, R., Usukhbayar, B., et al. (2024) · Cell Stem Cell · doi:10.1016/j.stem.2024.05.010 · Cited by 130
Neutrophils in aging and aging‐related pathologies
Avondt, K. V., Strecker, J., Tulotta, C., Minnerup, J., Schulz, C., & Soehnlein, O. (2022) · Immunological Reviews · doi:10.1111/imr.13153 · Cited by 155
A comprehensive transcriptome signature of murine hematopoietic stem cell aging
Flohr Svendsen, A., Yang, D., Kim, K., Lazare, S., Skinder, N., Zwart, E., Mura-Meszaros, A., Ausema, A., von Eyss, B., de Haan, G., et al. (2021) · Blood · doi:10.1182/blood.2020009729 · Cited by 138
Plasma cells are obligate effectors of enhanced myelopoiesis in aging bone marrow
Pioli, P. D., Casero, D., Montecino-Rodriguez, E., Morrison, S. L., & Dorshkind, K. (2019) · Immunity · doi:10.1016/j.immuni.2019.06.006 · Cited by 131
“, 2005) that includes a significant increase in the frequency and number of hematopoietic stem cells (HSCs) (Dykstra and de Haan, 2008; Geiger and Van Zant, 2002), common myeloid progenitors (CMPs), granulocytemacrophage progenitors (GMPs) and mature myeloid cells (Dykstra et al., 2011; Tang et al., 2013).”
BackgroundWill, B., Vogler, T. O., Narayanagari, S., Bartholdy, B., Todorova, T. I., da Silva Ferreira, M., Chen, J., Yu, Y., Mayer, J., Barreyro, L., et al. (2015) · Nature Medicine · doi:10.1038/nm.3936 · Cited by 127
Age-associated changes in human hematopoietic stem cells
Pang, W. W., Schrier, S. L., & Weissman, I. L. (2016) · Seminars in Hematology · doi:10.1053/j.seminhematol.2016.10.004 · Cited by 126
Djeghloul, D., Kuranda, K., Kuzniak, I., Barbieri, D., Naguibneva, I., Choisy, C., Bories, J.-C., Dosquet, C., Pla, M., Vanneaux, V., et al. (2016) · Stem Cell Reports · doi:10.1016/j.stemcr.2016.05.007 · Cited by 128
“Studies in both humans and mice have shown that HSC are not constant throughout life (Chambers et al., 2007; Dykstra et al., 2011; Flach et al., 2014; Kuranda et al., 2011; Lescale et al., 2010; Pang et al., 2011; Rossi et al., 2005).”
BackgroundValletta, S., Thomas, A., Meng, Y., Ren, X., Drissen, R., Sengül, H., Di Genua, C., & Nerlov, C. (2020) · Nature Communications · doi:10.1038/s41467-020-17942-7 · Cited by 122
Mechanisms and rejuvenation strategies for aged hematopoietic stem cells
Li, X., Zeng, X., Xu, Y., Wang, B., Zhao, Y., Lai, X., Qian, P., & Huang, H. (2020) · Journal of Hematology & Oncology · doi:10.1186/s13045-020-00864-8 · Cited by 119
Sun, X., Cao, B., Naval-Sánchez, M., Pham, T. A., Sun, Y., Williams, B., Heazlewood, S. Y., Deshpande, N., Li, J., Kraus, F., et al. (2021) · Nature Communications · doi:10.1038/s41467-021-22863-0 · Cited by 120
Poscablo, D. M., Worthington, A. K., Smith‐Berdan, S., Rommel, M. G. E., Manso, B. A., Adili, R., Mok, L., Reggiardo, R. E., Cool, T., Mogharrab, R., et al. (2024) · Cell · doi:10.1016/j.cell.2024.04.018 · Cited by 120
“19,20 21–24 This age-related functional decline of old HSCs (oHSCs) stands in stark contrast to our recently uncovered surprising gain of function of old MkPs (oMkPs) compared with young MkPs (yMkPs).”
ResultLimited rejuvenation of aged hematopoietic stem cells in young bone marrow niche
Kuribayashi, W., Oshima, M., Itokawa, N., Koide, S., Nakajima-Takagi, Y., Yamashita, M., Yamazaki, S., Rahmutulla, B., Miura, F., Ito, T., et al. (2021) · Journal of Experimental Medicine · doi:10.1084/jem.20192283 · Cited by 111
Stem Cells, Redox Signaling, and Stem Cell Aging
Liang, R., & Ghaffari, S. (2014) · Antioxidants & Redox Signaling · doi:10.1089/ars.2013.5300 · Cited by 106
“Aging is associated with HSC expansion, compromise of their homing, gradual loss of their function, HSC myeloid biased-differentiation, and onset of anemia (20, 93, 103).”
Inflammation in atherosclerosis: Lessons and therapeutic implications
Libby, P., & Soehnlein, O. (2025) · Immunity · doi:10.1016/j.immuni.2025.09.012 · Cited by 119
Singh, S. K., Williams, C. A., Klarmann, K. D., Burkett, S. S., Keller, J. R., & Oberdoerffer, P. (2013) · The Journal of Experimental Medicine · doi:10.1084/jem.20121608 · Cited by 107
“Similar observations have been made for myc- or glucocorticoid receptor-associated H4 acetylation, which is necessary but not sufficient to induce transcription of target genes (Frank et al., 2001; Flavin et al., 2004).”
BackgroundWahlestedt, M., Norddahl, G. L., Sten, G., Ugale, A., Frisk, M.-A. M., Mattsson, R., Deierborg, T., Sigvardsson, M., & Bryder, D. (2013) · Blood · doi:10.1182/blood-2012-11-469080 · Cited by 106
“For instance, the key epigenetic regulator Ezh2 is down-regulated in aged HSCs.36 Although we previously found little evidence of epigenetic changes at the p16INK4a locus in aged HSCs,36 a wellestablished Ezh2 target loci in other cells,37 the broad and potent roles of Ezh2 might well underlie other epigenetic alterat…”
ResultInfluentialClonal hematopoiesis, somatic mosaicism, and age-associated disease
Evans, M. A., & Walsh, K. X. (2022) · Physiological Reviews · doi:10.1152/physrev.00004.2022 · Cited by 112
HSC Aging and Senescent Immune Remodeling
Denkinger, M. D., Leins, H., Schirmbeck, R., Florian, M. C., & Geiger, H. (2015) · Trends in Immunology · doi:10.1016/j.it.2015.10.008 · Cited by 107
“It is currently unclear whether the aging-associated myeloid bias of hematopoiesis is a consequence of such a clonal shift, or whether aging directly impacts on the differentiation potential of HSCs themselves [53].”
Fujino, T., Goyama, S., Sugiura, Y., Inoue, D., Asada, S., Yamasaki, S., Matsumoto, A., Yamaguchi, K., Isobe, Y., Tsuchiya, A., et al. (2021) · Nature Communications · doi:10.1038/s41467-021-22053-y · Cited by 109
Young, K. A., Borikar, S., Bell, R. K., Kuffler, L., Philip, V. M., & Trowbridge, J. J. (2016) · The Journal of Experimental Medicine · doi:10.1084/jem.20160168 · Cited by 96
Dysregulation of Systemic Immunity in Aging and Dementia
Lutshumba, J., Nikolajczyk, B. S., & Bachstetter, A. D. (2021) · Frontiers in Cellular Neuroscience · doi:10.3389/fncel.2021.652111 · Cited by 104
Hennrich, M. L., Romanov, N., Horn, P., Jaeger, S., Eckstein, V., Steeples, V., Ye, F., Ding, X., Poisa-Beiro, L., Lai, M. C., et al. (2018) · Nature Communications · doi:10.1038/s41467-018-06353-4 · Cited by 101
Kirschner, K., Chandra, T., Kiselev, V. Y., Cruz, D. F. S., Macaulay, I. C., Park, H. J., Li, J., Kent, D. G., Kumar, R., Pask, D. C., et al. (2017) · Cell Reports · doi:10.1016/j.celrep.2017.04.074 · Cited by 97
“In addition to the lineage skew, aging of the hematopoietic system also results in reduced performance in blood reconstitution and engraftment, regardless of lineage output (Dykstra et al., 2011).”
BackgroundAging-induced IL27Ra signaling impairs hematopoietic stem cells
He, H., Xu, P., Zhang, X., Liao, M., Dong, Q., Cong, T., Tang, B., Yang, X., Ye, M., Chang, Y., et al. (2020) · Blood · doi:10.1182/blood.2019003910 · Cited by 94
Grigoriou, M., Banos, A., Filia, A., Pavlidis, P., Giannouli, S., Karali, V., Nikolopoulos, D., Pieta, A., Bertsias, G. K., Verginis, P., et al. (2019) · Annals of the Rheumatic Diseases · doi:10.1136/annrheumdis-2019-215782 · Cited by 99
Pharmacological Regulation of Oxidative Stress in Stem Cells
Lee, J., Cho, Y. S., Jung, H., & Choi, I. (2018) · Oxidative Medicine and Cellular Longevity · doi:10.1155/2018/4081890 · Cited by 99
The 3 I’s of immunity and aging: immunosenescence, inflammaging, and immune resilience
Wrona, M. V., Ghosh, R. B., Coll, K., Chun, C., & Yousefzadeh, M. J. (2024) · Frontiers in Aging · doi:10.3389/fragi.2024.1490302 · Cited by 107
“Beyond the differentiation bias aged HSCs are also known to have an inferior potential for immune reconstitution, engraftment, and self-renewal compared to younger HSCs (Morrison et al., 1996; Dykstra et al., 2011).”
BackgroundDo haematopoietic stem cells age?
Dorshkind, K. A., Höfer, T., Montecino‐Rodriguez, E., Pioli, P. D., & Rodewald, H.-R. (2019) · Nature reviews. Immunology · doi:10.1038/s41577-019-0236-2 · Cited by 92
B lymphocyte-derived acetylcholine limits steady-state and emergency hematopoiesis
Schloss, M. J., Hulsmans, M., Rohde, D., Lee, I., Sévère, N., Foy, B. H., Pulous, F. E., Zhang, S., Kokkaliaris, K. D., Frodermann, V., et al. (2022) · Nature Immunology · doi:10.1038/s41590-022-01165-7 · Cited by 97
Epigenetic traits inscribed in chromatin accessibility in aged hematopoietic stem cells
Itokawa, N., Oshima, M., Koide, S., Takayama, N., Kuribayashi, W., Nakajima‐Takagi, Y., Aoyama, K., Yamazaki, S., Yamaguchi, K., Furukawa, Y., et al. (2022) · Nature Communications · doi:10.1038/s41467-022-30440-2 · Cited by 102
Niche derived netrin-1 regulates hematopoietic stem cell dormancy via its receptor neogenin-1
Renders, S., Svendsen, A. F., Panten, J., Rama, N., Maryanovich, M., Sommerkamp, P., Ladel, L., Redavid, A. R., Gibert, B., Lazare, S., et al. (2021) · Nature Communications · doi:10.1038/s41467-020-20801-0 · Cited by 97
Metadata
- Authors
- Dykstra, B., Olthof, S., Schreuder, J., Ritsema, M., & de Haan, G.
- Affiliations
- University Medical Center Groningen (NL)
- Department of Cell Biology 1 ; and 2
- Corresponding author
- Dykstra, Brad
- Venue
- Journal of Experimental Medicine
- Publisher
- Rockefeller University Press
- Published
- 2011-11-21
- Volume
- 208
- Issue
- 13
- Pages
- 2691-2703
- ISSN
- 0022-1007 (ISSN-L)
- 1540-9538
- PMC
- PMC3244040
- OpenAlex
- W2103911902
- Cited by
- 494
- References
- 38
- Citations by year
- 2026: 26 · 2025: 34 · 2024: 35 · 2023: 42 · 2022: 38 · 2021: 42 · 2020: 41 · 2019: 36 · 2018: 40 · 2017: 26 · 2016: 36 · 2015: 25 · 2014: 29 · 2013: 29 · 2012: 15
- FWCI
- 15.97
- Type
- journal article
- Language
- en
- Open access
- hybrid
- doi.org
- Licence
- other-oa
- Locations
- The Journal of Experimental Medicine (publishedVersion, other-oa)
- Europe PMC (PubMed Central) (publishedVersion, cc-by-nc-sa)
- PubMed Central (publishedVersion, cc-by-nc-sa)
- PubMed (publishedVersion)
- University of Groningen research database (University of Groningen / Centre for Information Technology) (submittedVersion, cc-by-nc-sa)
- Funders
- Ministry of Earth Sciences
- Universitair Medisch Centrum Groningen
- Topics
- Health Sciences › Medicine › Hematology › Hematopoietic Stem Cell Transplantation
- Life Sciences › Biochemistry, Genetics and Molecular Biology › Cell Biology › Mesenchymal stem cell research
- Health Sciences › Medicine › Hematology › Blood disorders and treatments
- Keywords
- hematopoietic stem cells, aging, clonal analysis, HSC self-renewal, stromal co-culture, serial transplantation, cellular aging
- MeSH terms
- Animals, Antigens, Differentiation, Colony-Forming Units Assay, Hematopoietic Stem Cells, Mice, Transgenic, Transplantation, Homologous, Cellular Senescence, Hematopoietic Stem Cell Transplantation, Cell Proliferation, Mice
About these checks
Registry, retraction, Cites and statistics results are computed, not judged, with one exception: a printed reference that no index lists is read once by a model before it counts as a citation error. Claims are extracted by a model and kept only when their quote appears verbatim in the text; each cited source is then checked, with a model’s help, for whether it says what the claim relies on. Those verdicts can be wrong — read the claim’s quote and the cited source before relying on one.
Statistics and arithmetic are recomputed, not judged.
Confidence bands are shown only for fields calibrated on our annotated test set. None is calibrated yet, so no band is shown.
What counts as a claim ›How we measure confidence ›How we check this ›
Are you an author, or do you see a problem with this page? Request a review
