

The DOI matches its Crossref record; 105 of the 105 references it cites were found in a registry or an index.
Microglial large extracellular vesicles propagate early synaptic dysfunction in Alzheimer’s disease
Open accessAbstract
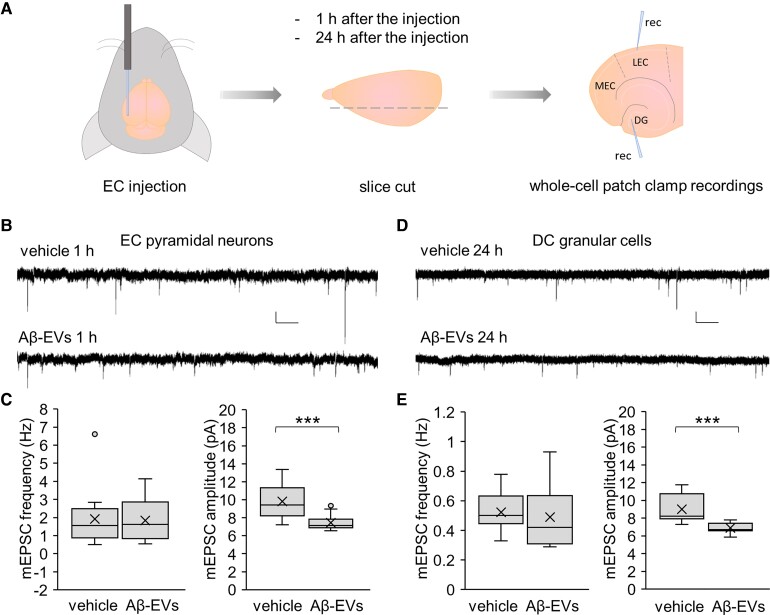
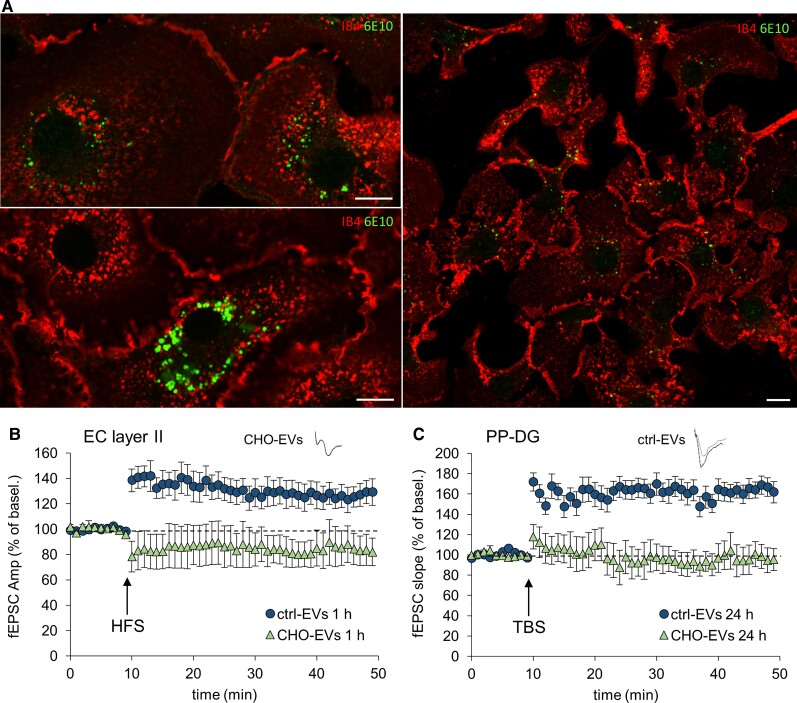
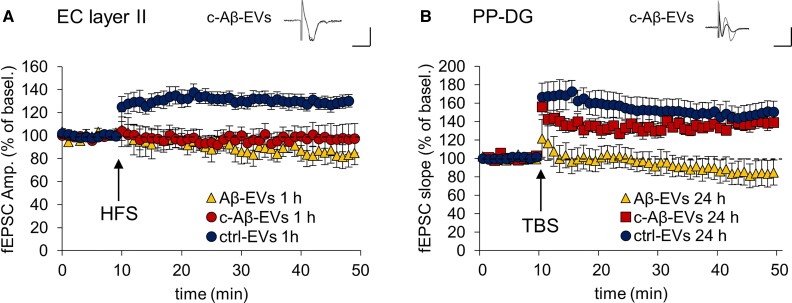
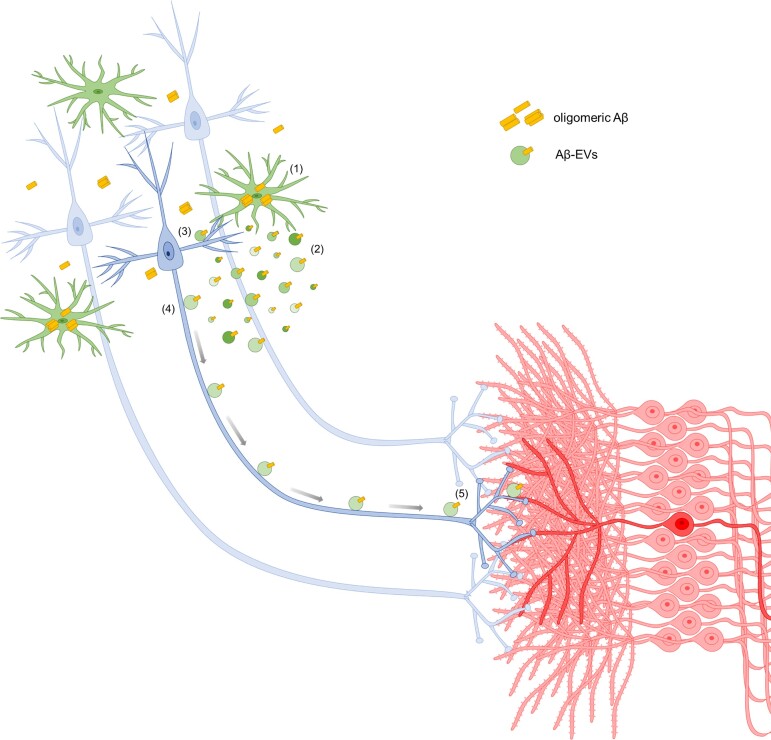
Synaptic dysfunction is an early mechanism in Alzheimer’s disease that involves progressively larger areas of the brain over time. However, how it starts and propagates is unknown. Here we show that amyloid-β released by microglia in association with large extracellular vesicles (Aβ-EVs) alters dendritic spine morphology in vitro, at the site of neuron interaction, and impairs synaptic plasticity both in vitro and in vivo in the entorhinal cortex–dentate gyrus circuitry. One hour after Aβ-EV injection into the mouse entorhinal cortex, long-term potentiation was impaired in the entorhinal cortex but not in the dentate gyrus, its main target region, while 24 h later it was also impaired in the dentate gyrus, revealing a spreading of long-term potentiation deficit between the two regions. Similar results were obtained upon injection of extracellular vesicles carrying Aβ naturally secreted by CHO7PA2 cells, while neither Aβ42 alone nor inflammatory extracellular vesicles devoid of Aβ were able to propagate long-term potentiation impairment. Using optical tweezers combined to time-lapse imaging to study Aβ-EV–neuron interaction, we show that Aβ-EVs move anterogradely at the axon surface and that their motion can be blocked through annexin-V coating. Importantly, when Aβ-EV motility was inhibited, no propagation of long-term potentiation deficit occurred along the entorhinal–hippocampal circuit, implicating large extracellular vesicle motion at the neuron surface in the spreading of long-term potentiation impairment. Our data indicate the involvement of large microglial extracellular vesicles in the rise and propagation of early synaptic dysfunction in Alzheimer’s disease and suggest a new mechanism controlling the diffusion of large extracellular vesicles and their pathogenic signals in the brain parenchyma, paving the way for novel therapeutic strategies to delay the disease.
Overview
The claims and statistics of this paper haven’t been checked yet.
Run the check — free, no account needed. It reads the open-access text and checks the sources it cites.
Integrity signals
Registry
Cites
Statistics
Figures
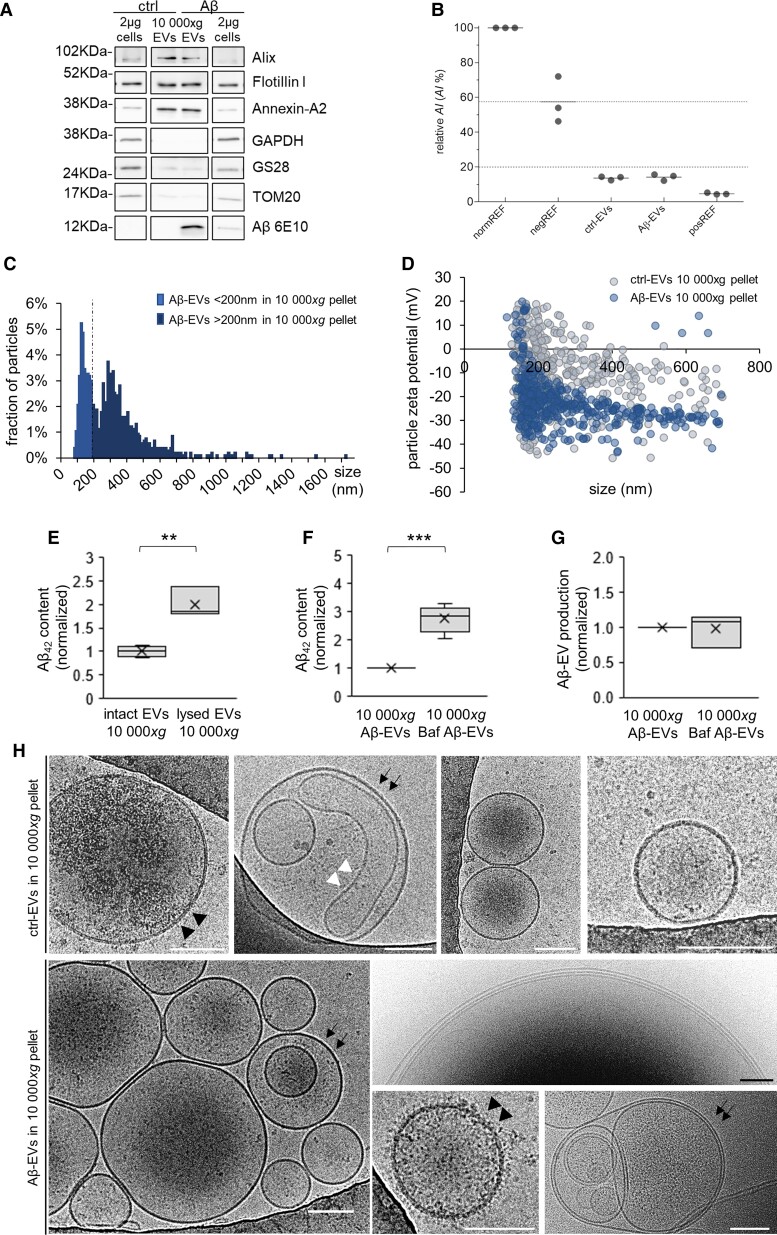
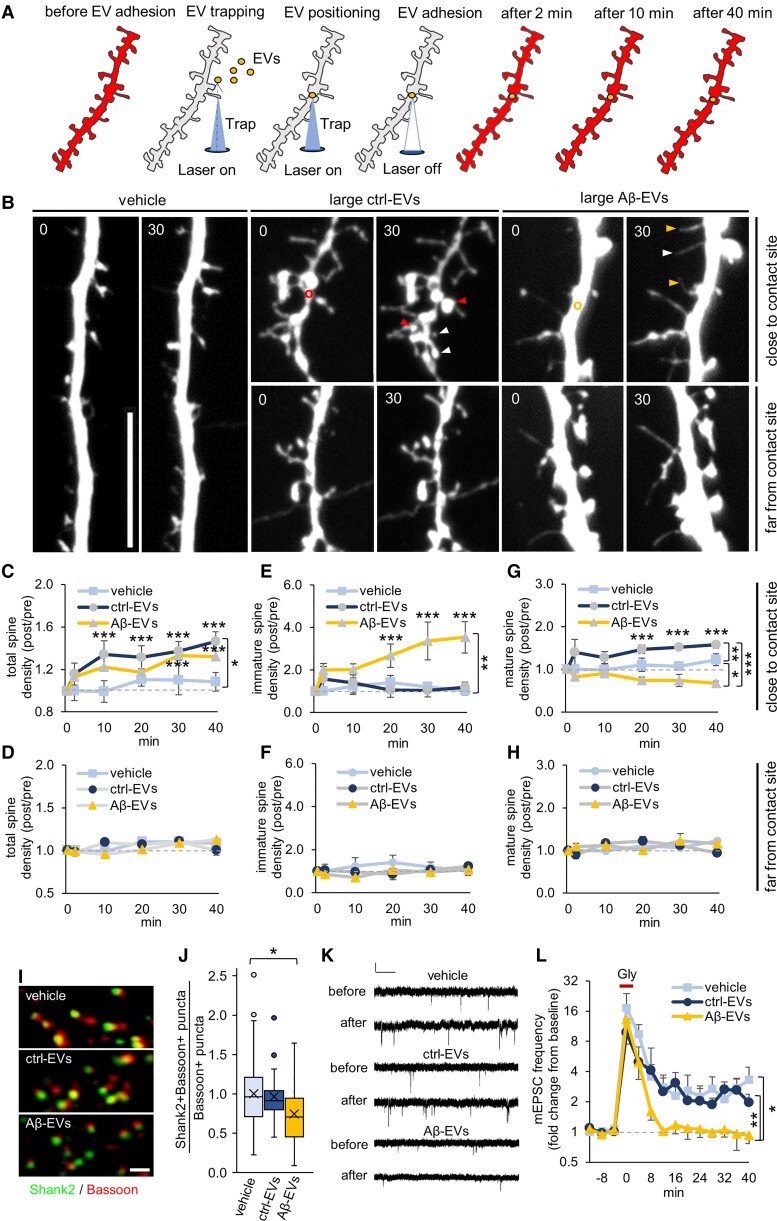
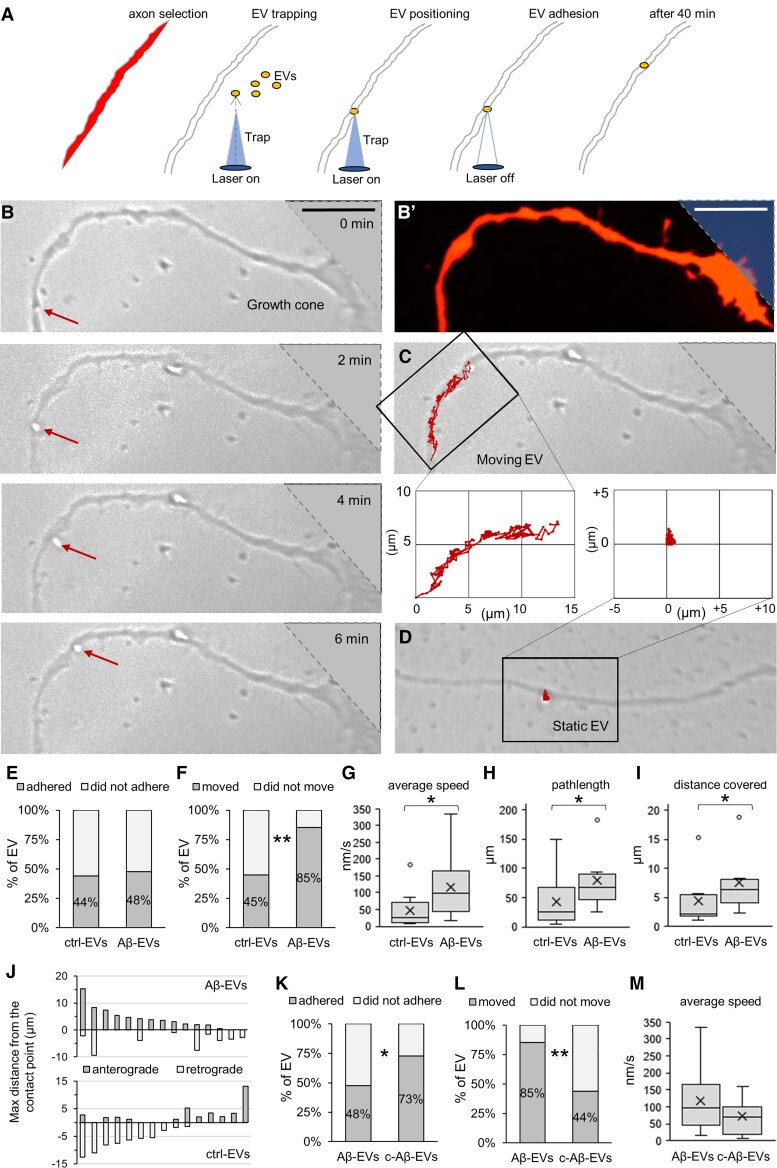
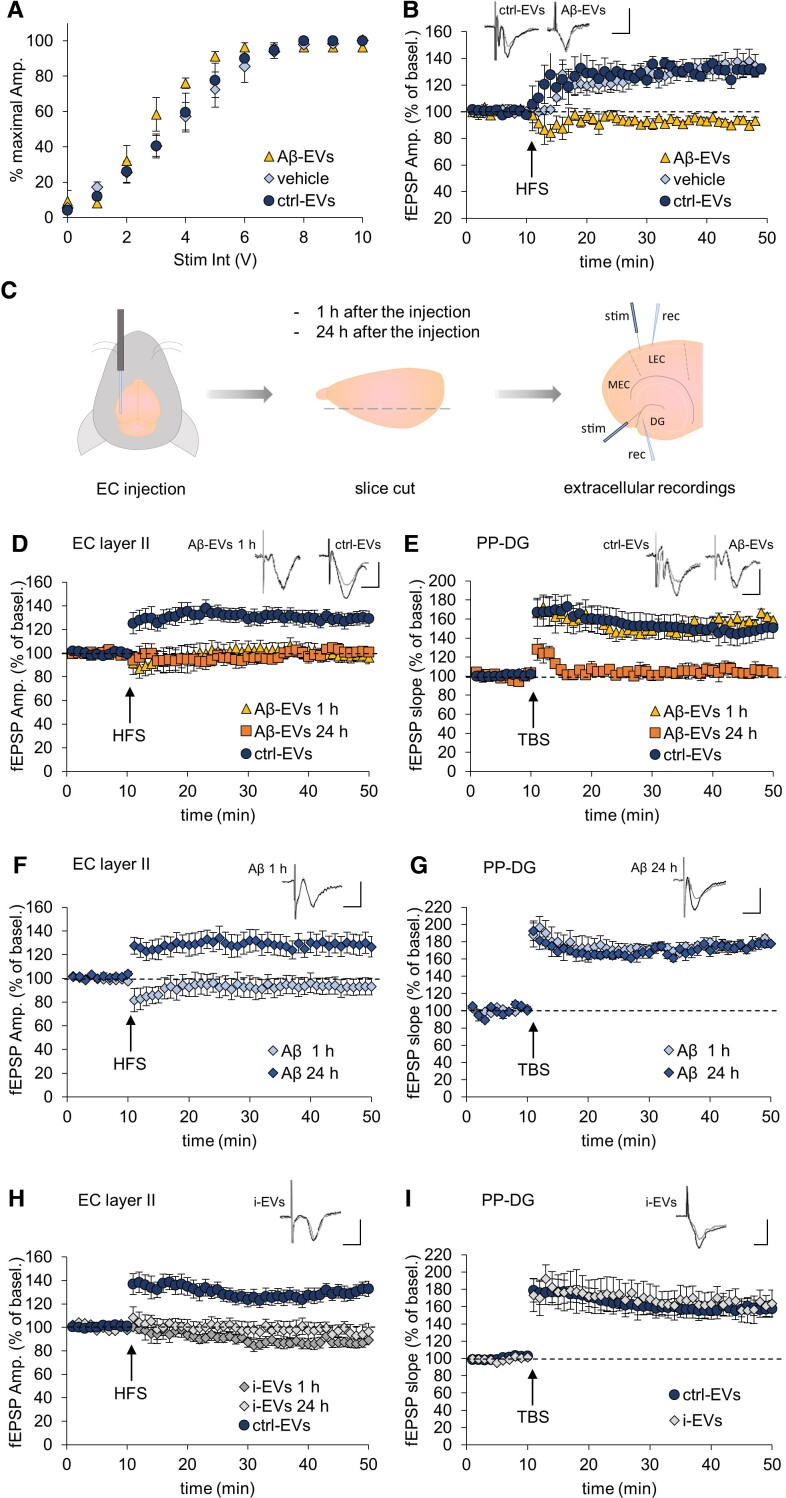
Verification
Claims the paper makes
The claims and statistics of this paper haven’t been checked yet.
Run the check — free, no account needed. It reads the open-access text and checks the sources it cites.
Claims other papers make about this one
Each is checked against this paper’s own text: does it say what the citing paper says it does?
In the citing paper
“Microglia could also lead to synaptic dysfunction in vivo and in vitro by releasing Aβ-containing EVs.”
From Microglia in neurodegenerative diseases: mechanism and potential therapeutic targets (2023) · cites this paper as [198]
Self-check
Percentages, sums and reported differences re-computed from the paper’s own numbers.
The self-check needs the paper’s full text.
Citations
Cites
Neuropathological stageing of Alzheimer-related changes.
Braak, H., & Braak, E. (1991) · Acta Neuropathologica · doi:10.1007/bf00308809 · Cited by 16,123
A synaptic model of memory: long-term potentiation in the hippocampus
Bliss, T. V. P., & Collingridge, G. L. (1993) · Nature · doi:10.1038/361031a0 · Cited by 11,566
Théry, C., Witwer, K. W., Aikawa, E., Alcaraz, M. J., Anderson, J. D., Andriantsitohaina, R., Antoniou, A., Arab, T., Archer, F., Atkin‐Smith, G. K., et al. (2018) · Journal of Extracellular Vesicles · doi:10.1080/20013078.2018.1535750 · Cited by 11,099
Self-citationAmyloid oligomers exacerbate tau pathology in a mouse model of tauopathy
Selenica, M.-L. B., Brownlow, M., Jimenez, J. P., Lee, D. C., Pena, G., Dickey, C. A., Gordon, M. N., & Morgan, D. (2013) · Neurodegenerative Diseases · doi:10.1159/000337230 · Cited by 10,359
Polazzi, E., Mengoni, I., Caprini, M., Peña‐Altamira, E., Kurtys, E., & Monti, B. (2012) · Neurosignals · doi:10.1159/000337115 · Cited by 9,023
Shedding light on the cell biology of extracellular vesicles
van Niel, G., D'Angelo, G., & Raposo, G. (2018) · Nature Reviews Molecular Cell Biology · doi:10.1038/nrm.2017.125 · Cited by 8,369
Neuroinflammation in Alzheimer's disease
Heneka, M. T., Carson, M. J., Khoury, J. E., Landreth, G. E., Brosseron, F., Feinstein, D. L., Jacobs, A. H., Wyss-Coray, T., Vitorica, J., Ransohoff, R. M., et al. (2015) · The Lancet Neurology · doi:10.1016/s1474-4422(15)70016-5 · Cited by 6,226
The amyloid hypothesis of Alzheimer's disease at 25 years
Selkoe, D. J., & Hardy, J. (2016) · EMBO Molecular Medicine · doi:10.15252/emmm.201606210 · Cited by 6,164
Alzheimer's Disease Is a Synaptic Failure
Selkoe, D. J. (2002) · Science · doi:10.1126/science.1074069 · Cited by 4,420
Terry, R. D., Masliah, E., Salmon, D. P., Butters, N., DeTeresa, R., Hill, R., Hansen, L. A., & Katzman, R. (1991) · Annals of Neurology · doi:10.1002/ana.410300410 · Cited by 4,397
Meta-Analysis of 74,046 Individuals Identifies 11 New Susceptibility Loci for Alzheimer’s Disease
(EADI), E. A. D. I., Lambert, J.-C., (GERAD), G. A. E. R. I. A. D., Alzheimer's Disease Genetic Consortium (ADGC), (CHARGE), C. F. H. A. A. R. I. G. E., Ibrahim-Verbaas, C. A., Harold, D., Naj, A. C., Sims, R., Bellenguez, C., et al. (2013) · Nature Genetics · doi:10.1038/ng.2802 · Cited by 4,336
Walsh, D. M., Klyubin, I., Fadeeva, J. V., Cullen, W. K., Anwyl, R., Wolfe, M. S., Rowan, M. J., & Selkoe, D. J. (2002) · Nature · doi:10.1038/416535a · Cited by 4,291
Triple-Transgenic Model of Alzheimer’s Disease with Plaques and Tangles
Oddo, S., Caccamo, A., Shepherd, J. D., Murphy, M. P., Golde, T. E., Kayed, R., Metherate, R., Mattson, M. P., Akbari, Y., & LaFerla, F. M. (2003) · Neuron · doi:10.1016/s0896-6273(03)00434-3 · Cited by 4,126
Shankar, G. M., Li, S., Mehta, T. H., Garcia-Munoz, A., Shepardson, N. E., Smith, I., Brett, F. M., Farrell, M. A., Rowan, M. J., Lemere, C. A., et al. (2008) · Nature Medicine · doi:10.1038/nm1782 · Cited by 3,685
Diffusible, nonfibrillar ligands derived from Aβ 1–42 are potent central nervous system neurotoxins
Lambert, M. P., Barlow, A. K., Chromy, B. A., Edwards, C., Freed, R., Liosatos, M., Morgan, T. E., Rozovsky, I., Trommer, B., Viola, K. L., et al. (1998) · Proceedings of the National Academy of Sciences · doi:10.1073/pnas.95.11.6448 · Cited by 3,506
Phases of Aβ-deposition in the human brain and its relevance for the development of AD
Thal, D. R., Rüb, U., Orantes, M., & Braak, H. (2002) · Neurology · doi:10.1212/wnl.58.12.1791 · Cited by 3,490
Complement and microglia mediate early synapse loss in Alzheimer mouse models
Hong, S., Beja-Glasser, V. F., Nfonoyim, B. M., Frouin, A., Li, S., Ramakrishnan, S., Merry, K. M., Shi, Q., Rosenthal, A., Barres, B. A., et al. (2016) · Science · doi:10.1126/science.aad8373 · Cited by 3,343
Braak, H., Alafuzoff, I., Arzberger, T., Kretzschmar, H., & Del Tredici, K. (2006) · Acta Neuropathologica · doi:10.1007/s00401-006-0127-z · Cited by 3,172
TREM2 Variants in Alzheimer's Disease
Guerreiro, R., Wojtas, A., Bras, J., Carrasquillo, M., Rogaeva, E., Majounie, E., Cruchaga, C., Sassi, C., Kauwe, J. S. K., Younkin, S., et al. (2013) · New England Journal of Medicine · doi:10.1056/nejmoa1211851 · Cited by 3,020
The Medial Temporal Lobe and Recognition Memory
Eichenbaum, H., Yonelinas, A. P., & Ranganath, C. (2007) · Annual Review of Neuroscience · doi:10.1146/annurev.neuro.30.051606.094328 · Cited by 2,580
Variant of TREM2 Associated with the Risk of Alzheimer's Disease
Jonsson, T., Stefansson, H., Steinberg, S., Jonsdottir, I., Jonsson, P. V., Snaedal, J., Bjornsson, S., Huttenlocher, J., Levey, A. I., Lah, J. J., et al. (2013) · New England Journal of Medicine · doi:10.1056/nejmoa1211103 · Cited by 2,558
Synapse loss in frontal cortex biopsies in Alzheimer's disease: Correlation with cognitive severity
DeKosky, S. T., & Scheff, S. W. (1990) · Annals of Neurology · doi:10.1002/ana.410270502 · Cited by 2,376
Buckner, R. L., Snyder, A. Z., Shannon, B. J., LaRossa, G., Sachs, R., Fotenos, A. F., Sheline, Y. I., Klunk, W. E., Mathis, C. A., Morris, J. C., et al. (2005) · The Journal of Neuroscience · doi:10.1523/jneurosci.2177-05.2005 · Cited by 2,140
The Cellular Phase of Alzheimer’s Disease
De Strooper, B., & Karran, E. (2016) · Cell · doi:10.1016/j.cell.2015.12.056 · Cited by 1,990
Profound Loss of Layer II Entorhinal Cortex Neurons Occurs in Very Mild Alzheimer’s Disease
Gómez-Isla, T., Price, J. L., McKeel Jr., D. W., Morris, J. C., Growdon, J. H., & Hyman, B. T. (1996) · The Journal of Neuroscience · doi:10.1523/jneurosci.16-14-04491.1996 · Cited by 1,796
Microglia emerge as central players in brain disease
Salter, M. W., & Stevens, B. (2017) · Nature Medicine · doi:10.1038/nm.4397 · Cited by 1,767
Differential Effects of Early Hippocampal Pathology on Episodic and Semantic Memory
Vargha-Khadem, F., Gadian, D. G., Watkins, K. E., Connelly, A., Van Paesschen, W., & Mishkin, M. (1997) · Science · doi:10.1126/science.277.5324.376 · Cited by 1,746
Neuroinflammation in Alzheimer's disease: current evidence and future directions
Calsolaro, V., & Edison, P. (2016) · Alzheimer's & Dementia · doi:10.1016/j.jalz.2016.02.010 · Cited by 1,726
Integrated Systems Approach Identifies Genetic Nodes and Networks in Late-Onset Alzheimer’s Disease
Zhang, B., Gaiteri, C., Bodea, L.-G., Wang, Z., McElwee, J., Podtelezhnikov, A. A., Zhang, C., Xie, T., Tran, L., Dobrin, R., et al. (2013) · Cell · doi:10.1016/j.cell.2013.03.030 · Cited by 1,657
Amyloid-β–induced neuronal dysfunction in Alzheimer's disease: from synapses toward neural networks
Palop, J. J., & Mucke, L. (2010) · Nature Neuroscience · doi:10.1038/nn.2583 · Cited by 1,651
Depletion of microglia and inhibition of exosome synthesis halt tau propagation
Asai, H., Ikezu, S., Tsunoda, S., Medalla, M., Luebke, J., Haydar, T., Wolozin, B., Butovsky, O., Kügler, S., & Ikezu, T. (2015) · Nature Neuroscience · doi:10.1038/nn.4132 · Cited by 1,591
Soluble oligomers of the amyloid β-protein impair synaptic plasticity and behavior
Selkoe, D. J. (2008) · Behavioural Brain Research · doi:10.1016/j.bbr.2008.02.016 · Cited by 1,038
Hippocampal synaptic loss in early Alzheimer's disease and mild cognitive impairment
Scheff, S. W., Price, D. A., Schmitt, F. A., & Mufson, E. J. (2006) · Neurobiology of Aging · doi:10.1016/j.neurobiolaging.2005.09.012 · Cited by 1,017
Trans-Synaptic Spread of Tau Pathology In Vivo
Liu, L., Drouet, V., Wu, J., Witter, M. P., Small, S. A., Clelland, C. L. T., & Duff, K. (2012) · PLoS ONE · doi:10.1371/journal.pone.0031302 · Cited by 994
Lu, W.-Y., Man, H., Ju, W. H., Trimble, W. S., MacDonald, J. F., & Wang, Y. T. (2001) · Neuron · doi:10.1016/s0896-6273(01)00194-5 · Cited by 935
Structure-stability-function relationships of dendritic spines
Kasai, H., Matsuzaki, M., Noguchi, J., Yasumatsu, N., & Nakahara, H. (2003) · Trends in Neurosciences · doi:10.1016/s0166-2236(03)00162-0 · Cited by 847
Normal and Abnormal Biology of the Beta-Amyloid Precursor Protein
Selkoe, D. J. (1994) · Annual Review of Neuroscience · doi:10.1146/annurev.ne.17.030194.002421 · Cited by 834
Microglia remodel synapses by presynaptic trogocytosis and spine head filopodia induction
Weinhard, L., di Bartolomei, G., Bolasco, G., Machado, P., Schieber, N. L., Neniskyte, U., Exiga, M., Vadisiute, A., Raggioli, A., Schertel, A., et al. (2018) · Nature Communications · doi:10.1038/s41467-018-03566-5 · Cited by 790
Altered expression of synaptic proteins occurs early during progression of Alzheimer's disease
Masliah, E., Mallory, M., Alford, M., DeTeresa, R., Hansen, L. A., McKeel, D. W., & Morris, J. C. (2001) · Neurology · doi:10.1212/wnl.56.1.127 · Cited by 720
Current and future treatments for Alzheimer's disease
Yiannopoulou, K. G., & Papageorgiou, S. G. (2013) · Therapeutic Advances in Neurological Disorders · doi:10.1177/1756285612461679 · Cited by 677
The release and trans-synaptic transmission of Tau via exosomes
Wang, Y., Balaji, V., Kaniyappan, S., Krüger, L., Irsen, S., Tepper, K., Chandupatla, R., Maetzler, W., Schneider, A., Mandelkow, E., et al. (2017) · Molecular Neurodegeneration · doi:10.1186/s13024-016-0143-y · Cited by 674
Acid sphingomyelinase activity triggers microparticle release from glial cells
Bianco, F., Perrotta, C., Novellino, L., Francolini, M., Riganti, L., Menna, E., Saglietti, L., Schuchman, E. H., Furlan, R., Clementi, E., et al. (2009) · The EMBO Journal · doi:10.1038/emboj.2009.45 · Cited by 615
Self-citationAstrocyte-Derived ATP Induces Vesicle Shedding and IL-1β Release from Microglia
Bianco, F., Pravettoni, E., Colombo, A., Schenk, U., Möller, T., Matteoli, M., & Verderio, C. (2005) · The Journal of Immunology · doi:10.4049/jimmunol.174.11.7268 · Cited by 596
Self-citationType I interferon response drives neuroinflammation and synapse loss in Alzheimer disease
Roy, E. R., Wang, B., Wan, Y.-W., Chiu, G., Cole, A., Yin, Z., Propson, N. E., Xu, Y., Jankowsky, J. L., Liu, Z., et al. (2020) · Journal of Clinical Investigation · doi:10.1172/jci133737 · Cited by 563
Late onset Alzheimer’s disease genetics implicates microglial pathways in disease risk
Efthymiou, A. G., & Goate, A. M. (2017) · Molecular Neurodegeneration · doi:10.1186/s13024-017-0184-x · Cited by 562
Wang, H.-W., Pasternak, J. F., Kuo, H., Ristic, H., Lambert, M. P., Chromy, B., Viola, K. L., Klein, W. L., Stine, W. B., Krafft, G. A., et al. (2002) · Brain Research · doi:10.1016/s0006-8993(01)03058-x · Cited by 527
Alzheimer’s disease pathology propagation by exosomes containing toxic amyloid-beta oligomers
Sardar Sinha, M., Ansell-Schultz, A., Civitelli, L., Hildesjö, C., Larsson, M., Lannfelt, L., Ingelsson, M., & Hallbeck, M. (2018) · Acta Neuropathologica · doi:10.1007/s00401-018-1868-1 · Cited by 527
Therapeutic strategies for Alzheimer's disease in clinical trials
Godyń, J., Jończyk, J., Panek, D., & Malawska, B. (2015) · Pharmacological Reports · doi:10.1016/j.pharep.2015.07.006 · Cited by 462
Heusermann, W., Hean, J., Trojer, D., Steib, E., von Bueren, S., Graff-Meyer, A., Genoud, C., Martin, K., Pizzato, N., Voshol, J., et al. (2016) · Journal of Cell Biology · doi:10.1083/jcb.201506084 · Cited by 447
Molecular interactions at the surface of extracellular vesicles
Buzás, E. I., Tóth, E. Á., Sódar, B. W., & Szabó-Taylor, K. (2018) · Seminars in Immunopathology · doi:10.1007/s00281-018-0682-0 · Cited by 400
Podlisny, M. B., Ostaszewski, B. L., Squazzo, S. L., Koo, E. H., Rydel, R. E., Teplow, D. B., & Selkoe, D. J. (1995) · Journal of Biological Chemistry · doi:10.1074/jbc.270.16.9564 · Cited by 369
Chivet, M., Javalet, C., Laulagnier, K., Blot, B., Hemming, F. J., & Sadoul, R. (2014) · Journal of Extracellular Vesicles · doi:10.3402/jev.v3.24722 · Cited by 340
RAGE potentiates Aβ‐induced perturbation of neuronal function in transgenic mice
Arancio, O., Zhang, H. P., Chen, X., Lin, C., Trinchese, F., Puzzo, D., Liu, S., Hegde, A. N., Yan, S. F., Stern, A., et al. (2004) · The EMBO Journal · doi:10.1038/sj.emboj.7600415 · Cited by 333
Self-citationAntonucci, F., Turola, E., Riganti, L., Caleo, M., Gabrielli, M., Perrotta, C., Novellino, L., Clementi, E., Giussani, P., Viani, P., et al. (2012) · The EMBO Journal · doi:10.1038/emboj.2011.489 · Cited by 328
Self-citationHarris, J. A., Devidze, N., Verret, L., Ho, K., Halabisky, B., Thwin, M. T., Kim, D., Hamto, P., Lo, I., Yu, G.-Q., et al. (2010) · Neuron · doi:10.1016/j.neuron.2010.10.020 · Cited by 319
Lipids revert inert Aβ amyloid fibrils to neurotoxic protofibrils that affect learning in mice
Martins, I. C., Kuperstein, I., Wilkinson, H. R., Maes, E., Vanbrabant, M., Jonckheere, W., Gelder, P. V., Hartmann, D., D’Hooge, R., Strooper, B. D., et al. (2007) · The EMBO Journal · doi:10.1038/sj.emboj.7601953 · Cited by 318
Prada, I., Gabrielli, M., Turola, E., Iorio, A., D’Arrigo, G., Parolisi, R., De Luca, M., Pacifici, M., Bastoni, M., Lombardi, M., et al. (2018) · Acta Neuropathologica · doi:10.1007/s00401-017-1803-x · Cited by 312
Self-citationLazarov, O., Lee, M., Peterson, D. A., & Sisodia, S. S. (2002) · The Journal of Neuroscience · doi:10.1523/jneurosci.22-22-09785.2002 · Cited by 302
Mechanism of Evenness Interrupted (Evi)-Exosome Release at Synaptic Boutons
Koles, K., Nunnari, J. N., Korkut, C., Barría, R., Brewer, C., Li, Y., Leszyk, J., Zhang, B., & Budnik, V. (2012) · Journal of Biological Chemistry · doi:10.1074/jbc.m112.342667 · Cited by 300
Microglia convert aggregated amyloid-β into neurotoxic forms through the shedding of microvesicles
Joshi, P., Turola, E., Ruiz, A., Bergami, A., Libera, D. D., Benussi, L., Giussani, P., Magnani, G., Comı, G., Legname, G., et al. (2013) · Cell Death and Differentiation · doi:10.1038/cdd.2013.180 · Cited by 289
Self-citationExtracellular vesicle docking at the cellular port: Extracellular vesicle binding and uptake
French, K. C., Antonyak, M. A., & Cerione, R. A. (2017) · Seminars in Cell and Developmental Biology · doi:10.1016/j.semcdb.2017.01.002 · Cited by 288
Alzheimer’s disease brain-derived extracellular vesicles spread tau pathology in interneurons
Ruan, Z., Pathak, D., Venkatesan Kalavai, S., Yoshii-Kitahara, A., Muraoka, S., Bhatt, N., Takamatsu-Yukawa, K., Hu, J., Wang, Y., Hersh, S., et al. (2021) · Brain · doi:10.1093/brain/awaa376 · Cited by 283
Microglial genes regulating neuroinflammation in the progression of Alzheimer's disease
Villegas-Llerena, C., Phillips, A., Garcia-Reitboeck, P., Hardy, J., & Pocock, J. M. (2016) · Current Opinion in Neurobiology · doi:10.1016/j.conb.2015.10.004 · Cited by 270
Söllvander, S., Nikitidou, E., Brolin, R., Söderberg, L., Sehlin, D., Lannfelt, L., & Erlandsson, A. (2016) · Molecular Neurodegeneration · doi:10.1186/s13024-016-0098-z · Cited by 267
Amyloid-β Receptors: The Good, the Bad, and the Prion Protein
Jarosz-Griffiths, H. H., Noble, E., Rushworth, J. V., & Hooper, N. M. (2016) · Journal of Biological Chemistry · doi:10.1074/jbc.r115.702704 · Cited by 256
Differential detergent sensitivity of extracellular vesicle subpopulations
Osteikoetxea, X., Sódar, B. W., Nemeth, A. H., Szabó-Taylor, K., Pálóczi, K., Vukman, K. V., Tamási, V., Balogh, A., Kittel, Á., Pállinger, É., et al. (2015) · Organic & Biomolecular Chemistry · doi:10.1039/c5ob01451d · Cited by 245
Active endocannabinoids are secreted on extracellular membrane vesicles
Gabrielli, M., Battista, N., Riganti, L., Prada, I., Antonucci, F., Cantone, L., Matteoli, M., Maccarrone, M., & Verderio, C. (2015) · The EMBO Reports · doi:10.15252/embr.201439668 · Cited by 231
Self-citationTamamaki, N., & Nojyo, Y. (1993) · Hippocampus · doi:10.1002/hipo.450030408 · Cited by 216
Origlia, N., Righi, M., Capsoni, S., Cattaneo, A., Fang, F., Stern, D. M., Chen, J. X., Schmidt, A. M., Arancio, O., Yan, S. D., et al. (2008) · Journal of Neuroscience · doi:10.1523/jneurosci.0204-08.2008 · Cited by 206
Self-citationStranahan, A. M., & Mattson, M. P. (2010) · Neural Plasticity · doi:10.1155/2010/108190 · Cited by 198 · cited 1×
“In particular, we investigatedwhether large Aβ-EVs are able to impair LTP inmouse EC slices, a crucial site for memory formation, particularly vulnerable in Alzheimer’s disease.(13,26,73) Horizontal sections of entorhinal slices were treated with 1×10(8) Aβ-EVs/ml (equal to 82 pM surface Aβ42), ctrl-EVs (1 × 10 8 EVs/…”
Lombardi, M., Parolisi, R., Scaroni, F., Bonfanti, E., Gualerzi, A., Gabrielli, M., de Rosbo, N. K., Uccelli, A., Giussani, P., Viani, P., et al. (2019) · Acta Neuropathologica · doi:10.1007/s00401-019-02049-1 · Cited by 191
Self-citationDetection of Aggregation-Competent Tau in Neuron-Derived Extracellular Vesicles
Guix, F. X., Corbett, G. T., Cha, D., Mustapić, M., Liu, W., Mengel, D., Chen, Z., Aïkawa, E., Young‐Pearse, T. L., Kapogiannis, D., et al. (2018) · International Journal of Molecular Sciences · doi:10.3390/ijms19030663 · Cited by 186
Exosomes taken up by neurons hijack the endosomal pathway to spread to interconnected neurons
Polanco, J. C., Li, C., Durisic, N., Sullivan, R., & Götz, J. (2018) · Acta Neuropathologica Communications · doi:10.1186/s40478-018-0514-4 · Cited by 185
In Vivo Tau, Amyloid, and Gray Matter Profiles in the Aging Brain
Sepulcre, J., Schultz, A. P., Sabuncu, M. R., Gómez‐Isla, T., Chhatwal, J. P., Becker, A., Sperling, R. A., & Johnson, K. A. (2016) · Journal of Neuroscience · doi:10.1523/jneurosci.0639-16.2016 · Cited by 182
BIN1 favors the spreading of Tau via extracellular vesicles
Crotti, A., Sait, H. R., McAvoy, K. M., Estrada, K., Ergun, A., Szak, S., Marsh, G., Jandreski, L., Peterson, M., Reynolds, T. L., et al. (2019) · Scientific Reports · doi:10.1038/s41598-019-45676-0 · Cited by 171
(1995) · PubMed · Cited by 167
P2RX7 inhibitor suppresses exosome secretion and disease phenotype in P301S tau transgenic mice
Ruan, Z., Delpech, J.-C., Venkatesan Kalavai, S., Van Enoo, A. A., Hu, J., Ikezu, S., & Ikezu, T. (2020) · Molecular Neurodegeneration · doi:10.1186/s13024-020-00396-2 · Cited by 150
Eitan, E., Hutchison, E. R., Marosi, K., Comotto, J., Mustapic, M., Nigam, S. M., Suire, C., Maharana, C., Jicha, G. A., Liu, D., et al. (2016) · npj Aging and Mechanisms of Disease · doi:10.1038/npjamd.2016.19 · Cited by 129
Sheng, J. G., Price, D. L., & Koliatsos, V. E. (2002) · The Journal of Neuroscience · doi:10.1523/jneurosci.22-22-09794.2002 · Cited by 124
Impairments of long-term potentiation in hippocampal slices of β-amyloid-infused rats
Itoh, A., Akaike, T., Sokabe, M., Nitta, A., Iida, R., Olariu, A., Yamada, K., & Nabeshima, T. (1999) · European Journal of Pharmacology · doi:10.1016/s0014-2999(99)00601-9 · Cited by 122
Welikovitch, L. A., Do Carmo, S., Maglóczky, Z., Malcolm, J. C., Lőke, J., Klein, W. L., Freund, T., & Cuello, A. C. (2020) · Proceedings of the National Academy of Sciences · doi:10.1073/pnas.1914593117 · Cited by 116
Neuroimaging as a marker of the onset and progression of Alzheimer's disease
Masdeu, J. C., Zubieta, J. L., & Arbizu, J. (2005) · Journal of the Neurological Sciences · doi:10.1016/j.jns.2005.05.001 · Cited by 114
Brenna, S., Altmeppen, H. C., Mohammadi, B., Rissiek, B., Schlink, F., Ludewig, P., Krisp, C., Schlüter, H., Failla, A. V., Schneider, C., et al. (2020) · Journal of Extracellular Vesicles · doi:10.1080/20013078.2020.1809065 · Cited by 114
Agosta, F., Dalla Libera, D., Spinelli, E. G., Finardi, A., Canu, E., Bergami, A., Bocchio Chiavetto, L., Baronio, M., Comi, G., Martino, G., et al. (2014) · Annals of Neurology · doi:10.1002/ana.24235 · Cited by 113
Self-citationOriglia, N., Bonadonna, C., Rosellini, A., Leznik, E., Arancio, O., Yan, S. S., & Domenici, L. (2010) · The Journal of Neuroscience · doi:10.1523/jneurosci.2127-10.2010 · Cited by 111
Self-citationChiarini, A., Armato, U., Gardenal, E., Gui, L., & Prà, I. D. (2017) · Frontiers in Neuroscience · doi:10.3389/fnins.2017.00217 · Cited by 109
Cellular Receptors of Amyloid β Oligomers (AβOs) in Alzheimer’s Disease
Mroczko, B., Groblewska, M., Litman-Zawadzka, A., Kornhuber, J., & Lewczuk, P. (2018) · International Journal of Molecular Sciences · doi:10.3390/ijms19071884 · Cited by 97
Amyloid Deposition Is Linked to Aberrant Entorhinal Activity among Cognitively Normal Older Adults
Huijbers, W., Mormino, E. C., Wigman, S. E., Ward, A. M., Vannini, P., McLaren, D. G., Becker, J. A., Schultz, A. P., Hedden, T., Johnson, K. A., et al. (2014) · Journal of Neuroscience · doi:10.1523/jneurosci.3579-13.2014 · Cited by 91
Criscuolo, C., Fontebasso, V., Middei, S., Stazi, M., Ammassari‐Teule, M., Yan, S. S., & Origlia, N. (2017) · Scientific Reports · doi:10.1038/srep42370 · Cited by 83
Self-citationReduced SNAP-25 increases PSD-95 mobility and impairs spine morphogenesis
Fossati, G., Morini, R., Corradini, I., Antonucci, F., Trepte, P., Edry, E., Sharma, V. K., Papale, A., Pozzi, D., Defilippi, P., et al. (2015) · Cell Death and Differentiation · doi:10.1038/cdd.2014.227 · Cited by 74
Beretta, C., Nikitidou, E., Streubel-Gallasch, L., Ingelsson, M., Sehlin, D., & Erlandsson, A. (2020) · Scientific Reports · doi:10.1038/s41598-020-72355-2 · Cited by 71
A New Approach to Follow a Single Extracellular Vesicle—Cell Interaction using Optical Tweezers
Prada, I., Amin, L., Furlan, R., Legname, G., Verderio, C., & Cojoc, D. (2016) · BioTechniques · doi:10.2144/000114371 · Cited by 68
Self-citationArab, T., Raffo‐Romero, A., Camp, C. V., Lemaire, Q., Marrec‐Croq, F. L., Drago, F., Aboulouard, S., Slomianny, C., Lacoste, A.-S., Guigon, I., et al. (2019) · Journal of Extracellular Vesicles · doi:10.1080/20013078.2019.1603048 · Cited by 57
Zendrini, A., Paolini, L., Busatto, S., Radeghieri, A., Romano, M., Wauben, M. H. M., van Herwijnen, M. J. C., Nejsum, P. L., Borup, A., Ridolfi, A., et al. (2020) · Frontiers in Bioengineering and Biotechnology · doi:10.3389/fbioe.2019.00452 · Cited by 56
Self-citationMiller, M. I., Ratnanather, J. T., Tward, D. J., Brown, T., Lee, D. S., Ketcha, M. D., Mori, K., Wang, M., Mori, S., Albert, M., et al. (2015) · Frontiers in Bioengineering and Biotechnology · doi:10.3389/fbioe.2015.00054 · Cited by 53
Origlia, N., Capsoni, S., Cattaneo, A., Fang, F., Arancio, O., Yan, S. D., & Domenici, L. (2009) · Journal of Alzheimer s Disease · doi:10.3233/jad-2009-1045 · Cited by 53
Self-citationExtracellular Vesicles: Catching the Light in Zebrafish
Verweij, F. J., Hyenne, V., van Niel, G., & Goetz, J. G. (2019) · Trends in Cell Biology · doi:10.1016/j.tcb.2019.07.007 · Cited by 53
Johansson, A., Garlind, A., Berglind‐Dehlin, F., Karlsson, G., Edwards, K., Gellerfors, P., Pettersson, F. E., Palmblad, J. E. W., & Lannfelt, L. (2007) · FEBS Journal · doi:10.1111/j.1742-4658.2007.05647.x · Cited by 48
Aβ42 Protofibrils Interact with and Are Trafficked through Microglial-Derived Microvesicles
Gouwens, L. K., Ismail, M. S., Rogers, V. A., Zeller, N. T., Garrad, E. C., Amtashar, F. S., Makoni, N. J., Osborn, D. C., & Nichols, M. R. (2018) · ACS Chemical Neuroscience · doi:10.1021/acschemneuro.8b00029 · Cited by 48
Characterization of prion protein function by focal neurite stimulation
Amin, L., Nguyen, X. T. A., Rolle, I. G., D’Este, E., Giachin, G., Tran, T. H., Šerbec, V. Č., Cojoc, D., & Legname, G. (2016) · Journal of Cell Science · doi:10.1242/jcs.183137 · Cited by 47
D’Arrigo, G., Gabrielli, M., Scaroni, F., Swuec, P., Amin, L., Pegoraro, A., Adinolfi, E., Virgilio, F. D., Cojoc, D., Legname, G., et al. (2021) · Journal of Extracellular Vesicles · doi:10.1002/jev2.12114 · Cited by 44
Self-citationPicciolini, S., Gualerzi, A., Carlomagno, C., Cabinio, M., Sorrentino, S., Baglio, F., & Bedoni, M. (2020) · Journal of Pharmaceutical and Biomedical Analysis · doi:10.1016/j.jpba.2020.113649 · Cited by 40
Copper Binding Regulates Cellular Prion Protein Function
Nguyen, X. T. A., Tran, T. H., Cojoc, D., & Legname, G. (2019) · Molecular Neurobiology · doi:10.1007/s12035-019-1510-9 · Cited by 38
Ziehm, T., Brener, O., van Groen, T., Kadish, I., Frenzel, D., Tusche, M., Kutzsche, J., Reiß, K., Gremer, L., Nagel‐Steger, L., et al. (2016) · ACS Chemical Neuroscience · doi:10.1021/acschemneuro.6b00047 · Cited by 31
Imaging the Earliest Stages of Alzheimers Disease
Wu, W. E., & Small, S. A. (2006) · Current Alzheimer Research · doi:10.2174/156720506779025161 · Cited by 23
Cited by
Sorted by citations
Microglia in neurodegenerative diseases: mechanism and potential therapeutic targets
Gao, C., Jiang, J., Tan, Y., & Chen, S. (2023) · Signal Transduction and Targeted Therapy · doi:10.1038/s41392-023-01588-0 · Cited by 1,616
Involvement of Astrocytes in the Formation, Maintenance, and Function of the Blood–Brain Barrier
Schiera, G., Liegro, C. M. D., Schirò, G., Sorbello, G., & Liegro, I. D. (2024) · Cells · doi:10.3390/cells13020150 · Cited by 128
Neuropathogenesis-on-chips for neurodegenerative diseases
Amartumur, S., Nguyen, H. M., Huynh, T., Kim, T. S., Woo, R., Oh, E., Kim, K. K., Lee, L. P., & Heo, C. (2024) · Nature Communications · doi:10.1038/s41467-024-46554-8 · Cited by 131
Extracellular vesicles set the stage for brain plasticity and recovery by multimodal signalling
Hermann, D. M., Peruzzotti‐Jametti, L., Giebel, B., & Pluchino, S. (2023) · Brain · doi:10.1093/brain/awad332 · Cited by 79
Research progress on the role of extracellular vesicles in neurodegenerative diseases
Li, Z., Wang, X., Wang, X., Yi, X., Wong, Y. K., Wu, J., Xie, F., Hu, D., Wang, Q., Wang, J., et al. (2023) · Translational Neurodegeneration · doi:10.1186/s40035-023-00375-9 · Cited by 67
Metadata
- Authors
- Gabrielli, M., Prada, I., Joshi, P., Falcicchia, C., D’Arrigo, G., Rutigliano, G., Battocchio, E., Zenatelli, R., Tozzi, F., Radeghieri, A., Arancio, O., Origlia, N., & Verderio, C.
- Affiliations
- CNR Institute of Neuroscience , Vedano al Lambro, MB 20854 , Italy
- Neuroscience Institute (IT)
- Scuola Superiore Sant'Anna (IT)
- University of Milano-Bicocca (IT)
- University of Brescia (IT)
- Scuola Normale Superiore (IT)
- Consorzio Interuniversitario per lo Sviluppo dei Sistemi a Grande Interfase (IT)
- Columbia University (US)
- Corresponding author
- Origlia, Nicola
- Verderio, Claudia
- ORCID
- Venue
- Brain
- Publisher
- Oxford University Press (OUP)
- Published
- 2022-03-03
- Volume
- 145
- Issue
- 8
- Pages
- 2849-2868
- ISSN
- 0006-8950 (ISSN-L)
- 1460-2156
- PMC
- PMC9420022
- OpenAlex
- W4214920994
- Cited by
- 106
- References
- 105
- Citations by year
- 2026: 22 · 2025: 29 · 2024: 27 · 2023: 22 · 2022: 6
- FWCI
- 12.99
- Type
- journal article
- Language
- en
- Open access
- hybrid
- doi.org
- Licence
- Locations
- Brain (publishedVersion, cc-by-nc)
- PubMed Central (publishedVersion, cc-by-nc)
- PubMed (publishedVersion)
- BOA (University of Milano-Bicocca) (submittedVersion, cc-by-nc)
- Institutional Research Information System (Università degli Studi di Brescia) (submittedVersion, cc-by-nc)
- Scuola Normale Superiore di Pisa (submittedVersion, cc-by-nc)
- Funders
- American National Institutes of Health (1R56AG056108-01)
- Alzheimer’s Association Research Fellowship (2018-AARF-588984)
- Italian Multiple Sclerosis Foundation
- Topics
- Life Sciences › Neuroscience › Cellular and Molecular Neuroscience › Alzheimer's disease research and treatments
- Life Sciences › Biochemistry, Genetics and Molecular Biology › Molecular Biology › Extracellular vesicles in disease
- Life Sciences › Neuroscience › Neurology › Neuroinflammation and Neurodegeneration Mechanisms
- Keywords
- Alzheimer's disease, microglia, large extracellular vesicles, amyloid-beta, synaptic dysfunction, long-term potentiation, dendritic spine morphology, synaptic plasticity, vesicle motility, annexin V, amyloid-beta 42, disease propagation
- MeSH terms
- Extracellular Vesicles, Alzheimer Disease, Animals, Hippocampus, Amyloid beta-Peptides, Microglia, Long-Term Potentiation, Mice
About these checks
Registry, retraction, Cites and statistics results are computed, not judged, with one exception: a printed reference that no index lists is read once by a model before it counts as a citation error. Claims are extracted by a model and kept only when their quote appears verbatim in the text; each cited source is then checked, with a model’s help, for whether it says what the claim relies on. Those verdicts can be wrong — read the claim’s quote and the cited source before relying on one.
Statistics and arithmetic are recomputed, not judged.
Confidence bands are shown only for fields calibrated on our annotated test set. None is calibrated yet, so no band is shown.
What counts as a claim ›How we measure confidence ›How we check this ›
Are you an author, or do you see a problem with this page? Request a review
