

The DOI matches its Crossref record; 57 of the 57 references it cites were found in a registry or an index.
Within-patient correspondence of amyloid-β and intrinsic network connectivity in Alzheimer’s disease
Open accessAbstract
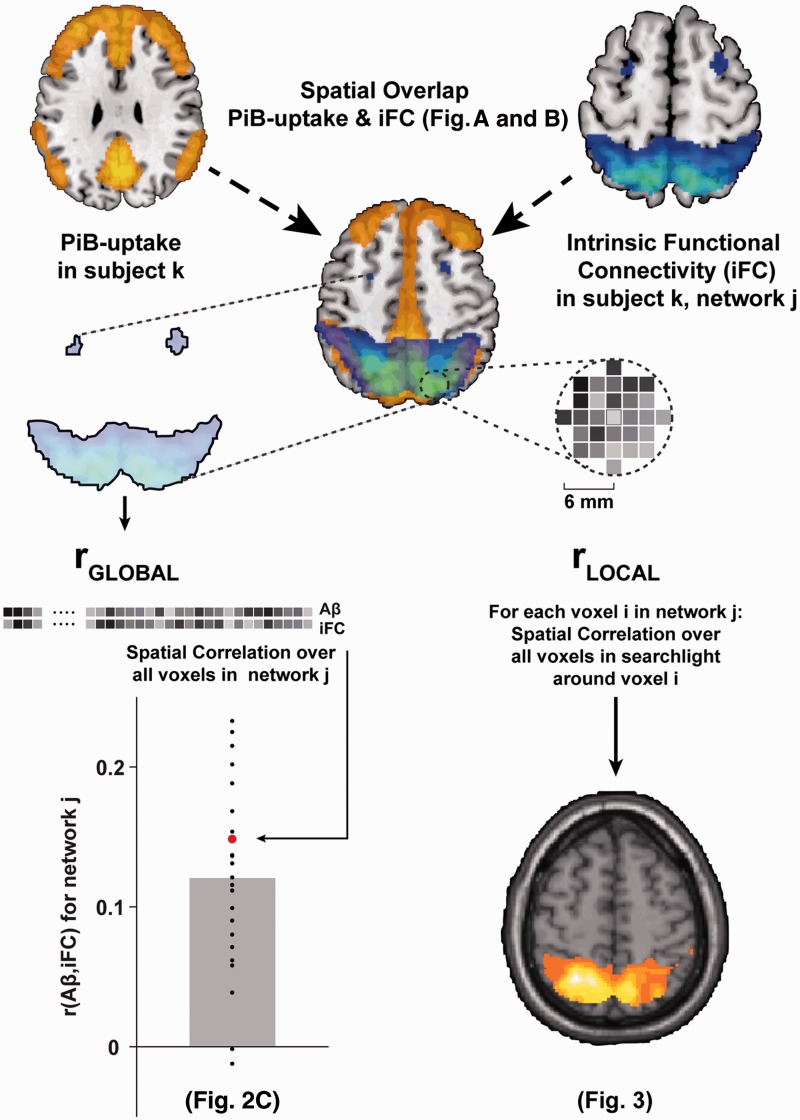
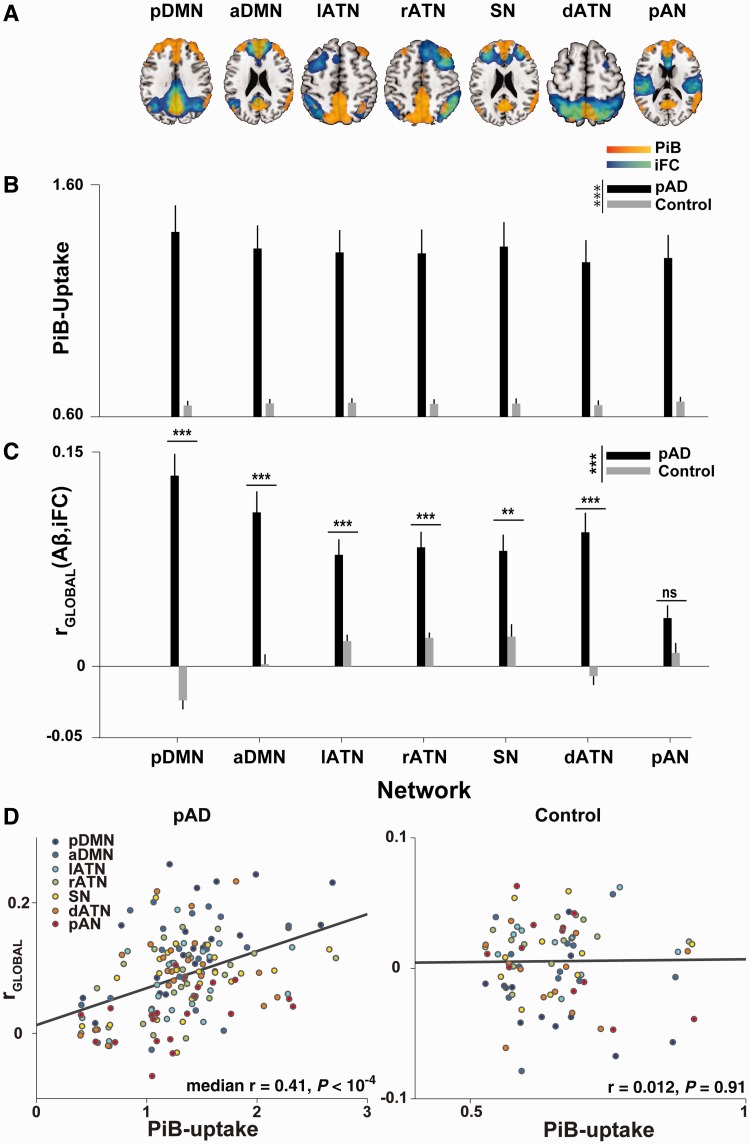
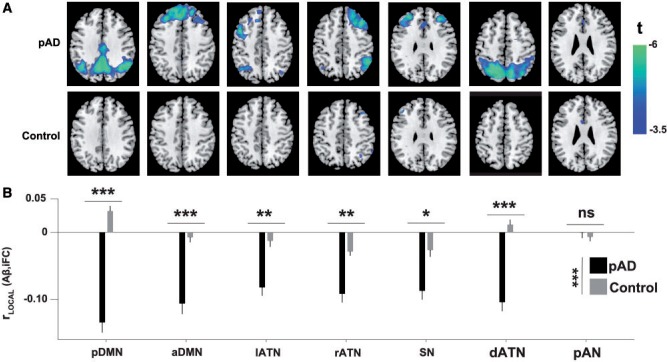
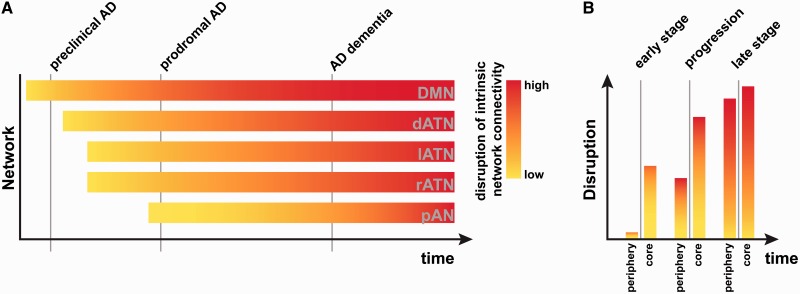
There is striking overlap between the spatial distribution of amyloid-β pathology in patients with Alzheimer's disease and the spatial distribution of high intrinsic functional connectivity in healthy persons. This overlap suggests a mechanistic link between amyloid-β and intrinsic connectivity, and indeed there is evidence in patients for the detrimental effects of amyloid-β plaque accumulation on intrinsic connectivity in areas of high connectivity in heteromodal hubs, and particularly in the default mode network. However, the observed spatial extent of amyloid-β exceeds these tightly circumscribed areas, suggesting that previous studies may have underestimated the negative impact of amyloid-β on intrinsic connectivity. We hypothesized that the known positive baseline correlation between patterns of amyloid-β and intrinsic connectivity may mask the larger extent of the negative effects of amyloid-β on connectivity. Crucially, a test of this hypothesis requires the within-patient comparison of intrinsic connectivity and amyloid-β distributions. Here we compared spatial patterns of amyloid-β-plaques (measured by Pittsburgh compound B positron emission tomography) and intrinsic functional connectivity (measured by resting-state functional magnetic resonance imaging) in patients with prodromal Alzheimer's disease via spatial correlations in intrinsic networks covering fronto-parietal heteromodal cortices. At the global network level, we found that amyloid-β and intrinsic connectivity patterns were positively correlated in the default mode and several fronto-parietal attention networks, confirming that amyloid-β aggregates in areas of high intrinsic connectivity on a within-network basis. Further, we saw an internetwork gradient of the magnitude of correlation that depended on network plaque-load. After accounting for this globally positive correlation, local amyloid-β-plaque concentration in regions of high connectivity co-varied negatively with intrinsic connectivity, indicating that amyloid-β pathology adversely reduces connectivity anywhere in an affected network as a function of local amyloid-β-plaque concentration. The local negative association between amyloid-β and intrinsic connectivity was much more pronounced than conventional group comparisons of intrinsic connectivity would suggest. Our findings indicate that the negative impact of amyloid-β on intrinsic connectivity in heteromodal networks is underestimated by conventional analyses. Moreover, our results provide first within-patient evidence for correspondent patterns of amyloid-β and intrinsic connectivity, with the distribution of amyloid-β pathology following functional connectivity gradients within and across intrinsic networks.
Overview
The claims and statistics of this paper haven’t been checked yet.
Run the check — free, no account needed. It reads the open-access text and checks the sources it cites.
Integrity signals
Registry
Cites
Statistics
Figures
Verification
Claims the paper makes
The claims and statistics of this paper haven’t been checked yet.
Run the check — free, no account needed. It reads the open-access text and checks the sources it cites.
Claims other papers make about this one
Each is checked against this paper’s own text: does it say what the citing paper says it does?
In the citing paper
“A certain overlap between the DMN and the distribution of Aβ fibrils in AD has also been noted in previous publications23–26.”
From Earliest accumulation of β-amyloid occurs within the default-mode network and concurrently affects brain connectivity (2017) · cites this paper as [25]
In the citing paper
“There is an increased Aβ-PET signal within the CEN and the SN in the progression of AD.244,245”
From Amyloid β-based therapy for Alzheimer’s disease: Challenges, successes and future (2023) · cites this paper as [244]
Self-check
Percentages, sums and reported differences re-computed from the paper’s own numbers.
The self-check needs the paper’s full text.
Citations
Cites
Neuropathological stageing of Alzheimer-related changes.
Braak, H., & Braak, E. (1991) · Acta Neuropathologica · doi:10.1007/bf00308809 · Cited by 16,123 · cited 1×
“The dissociation between heteromodal and primary networks is in line with findings that primary sensory and sensorimotor regions are relatively spared in earlier stages of Alzheimer’s disease (Braak and Braak, 1991).”
The Clinical Dementia Rating (CDR): Current version and scoring rules
Morris, J. C. (1993) · Neurology · doi:10.1212/wnl.43.11.2412-a · Cited by 9,882
Ashburner, J., & Friston, K. J. (2005) · NeuroImage · doi:10.1016/j.neuroimage.2005.02.018 · Cited by 7,507 · cited 1×
“…MRI image (using affine registration), and normalized to a template in the stereotactic space of the Montreal Neurological Institute (MNI) with the ‘segment’ function (SPM5), which uses an iterative combination of non-linear registration and cortical segmentation (Ashburner and Friston, 2005).”
Power, J. D., Barnes, K. A., Snyder, A. Z., Schlaggar, B. L., & Petersen, S. E. (2012) · NeuroImage · doi:10.1016/j.neuroimage.2011.10.018 · Cited by 7,429 · cited 2×
“Framewise displacement (Power et al., 2012) or the root-mean-”
Hypothetical model of dynamic biomarkers of the Alzheimer's pathological cascade
Jack, C. R., Knopman, D. S., Jagust, W. J., Shaw, L. M., Aisen, P. S., Weiner, M. W., Petersen, R. C., & Trojanowski, J. Q. (2010) · The Lancet Neurology · doi:10.1016/s1474-4422(09)70299-6 · Cited by 4,806
Alzheimer's Disease Is a Synaptic Failure
Selkoe, D. J. (2002) · Science · doi:10.1126/science.1074069 · Cited by 4,420 · cited 1×
“Aberrant clearance of amyloid-b precursor protein is thought to be a critical initial event in the disease’s pathogenesis, leading to amyloid-b peptide accumulation and plaque formation 20 to 30 years before cognitive symptoms arise (Selkoe, 2002; Jack et al., 2010; Bateman et al., 2012).”
Research criteria for the diagnosis of Alzheimer's disease: revising the NINCDS–ADRDA criteria
Dubois, B., Feldman, H. H., Jacova, C., DeKosky, S. T., Barberger-Gateau, P., Cummings, J., Delacourte, A., Galasko, D., Gauthier, S., Jicha, G., et al. (2007) · The Lancet Neurology · doi:10.1016/s1474-4422(07)70178-3 · Cited by 4,411 · cited 1×
“Prodromal Alzheimer’s disease has recently been defined by the coincidence of both mild cognitive impairment and the presence of at least one of five supportive biological signs for Alzheimer’s disease, such as medial temporal lobe atrophy or significant PiB uptake (Dubois et al., 2007).”
Moms, J. C., Heyman, A., Mohs, R. C., Hughes, J. P., van Belle, G., Fillenbaum, G., Mellits, E. D., & Clark, C. (1989) · Neurology · doi:10.1212/wnl.39.9.1159 · Cited by 4,130 · cited 1×
“…participant included medical history, neurological examination, informant interview (Morris, 1993), neuropsychological assessment by the neuropsychological assessment battery of the Consortium to Establish a Registry for Alzheimer’s disease (CERAD, Morris et al., 1989), structural MRI and PiB-PET.”
Gauthier, S. G., Reisberg, ., Zaudig, M., Petersen, R. C., Ritchie, K. A., Broich, K., Belleville, S., Brodaty, H., Bennett, D. A., Chertkow, H. M., et al. (2006) · The Lancet · doi:10.1016/s0140-6736(06)68542-5 · Cited by 4,094
Clinical and biomarker changes in dominantly inherited Alzheimer's disease
Bateman, R. J., Xiong, C., Benzinger, T. L. S., Fagan, A. M., Goate, A., Fox, N. C., Marcus, D. S., Cairns, N. J., Xie, X., Blazey, T. M., et al. (2012) · New England Journal of Medicine · doi:10.1056/nejmoa1202753 · Cited by 3,814 · cited 3×
“Given that significant PiB-uptake is measurable in the DMN even in early preclinical stages of Alzheimer’s disease (Jack et al., 2010; Bateman et al., 2012), where conventional measures of connectivity do not report robust connectivity reductions, the method presented here may help detect early, subtle reductions in c…”
Greicius, M. D., Srivastava, G., Reiss, A. L., & Menon, V. (2004) · Proceedings of the National Academy of Sciences · doi:10.1073/pnas.0308627101 · Cited by 3,684 · cited 2×
“…et al., 2009; Bero et al., 2012; Zhou et al., 2012); and that (ii) amyloid-b pathology is accelerated by local stress caused by a lifetime of increased metabolism and intrinsic activity and connectivity (Greicius et al., 2004; Buckner et al., 2005, 2009; Bero et al., 2011; Drzezga et al., 2011).”
Buckner, R. L., Sepulcre, J., Talukdar, T., Krienen, F. M., Liu, H., Hedden, T., Andrews-Hanna, J. R., Sperling, R. A., & Johnson, K. A. (2009) · The Journal of Neuroscience · doi:10.1523/jneurosci.5062-08.2009 · Cited by 2,862 · cited 8×
“…et al., 2009; Bero et al., 2012; Zhou et al., 2012); and that (ii) amyloid-b pathology is accelerated by local stress caused by a lifetime of increased metabolism and intrinsic activity and connectivity (Greicius et al., 2004; Buckner et al., 2005, 2009; Bero et al., 2011; Drzezga et al., 2011).”
InfluentialConsortium to Establish a Registry for Alzheimer's Disease (CERAD)
Fillenbaum, G., & Heyman, A. (2002) · doi:10.1002/0470846410.ch42(iii · Cited by 2,859
Neurodegenerative Diseases Target Large-Scale Human Brain Networks
Seeley, W. W., Crawford, R. K., Zhou, J., Miller, B. L., & Greicius, M. D. (2009) · Neuron · doi:10.1016/j.neuron.2009.03.024 · Cited by 2,350 · cited 5×
“…previous studies, which tested amyloid-b-propagation models in healthy controls and compared them with patient atrophy data (Buckner et al., 2009; Seeley et al., 2009; Raj et al., 2012; Zhou et al., 2012), or which correlated amyloid-b plaques with DMN connectivity across subjects (Drzezga et…”
InfluentialThe influence of head motion on intrinsic functional connectivity MRI
Van Dijk, K. R. A., Sabuncu, M. R., & Buckner, R. L. (2012) · NeuroImage · doi:10.1016/j.neuroimage.2011.07.044 · Cited by 2,344 · cited 2×
“In turn, the stronger accumulation leads to an increased reduction in connectivity.”
Buckner, R. L., Snyder, A. Z., Shannon, B. J., LaRossa, G., Sachs, R., Fotenos, A. F., Sheline, Y. I., Klunk, W. E., Mathis, C. A., Morris, J. C., et al. (2005) · The Journal of Neuroscience · doi:10.1523/jneurosci.2177-05.2005 · Cited by 2,140 · cited 5×
“…et al., 2009; Bero et al., 2012; Zhou et al., 2012); and that (ii) amyloid-b pathology is accelerated by local stress caused by a lifetime of increased metabolism and intrinsic activity and connectivity (Greicius et al., 2004; Buckner et al., 2005, 2009; Bero et al., 2011; Drzezga et al., 2011).”
InfluentialInformation-based functional brain mapping
Kriegeskorte, N., Goebel, R., & Bandettini, P. (2006) · Proceedings of the National Academy of Sciences · doi:10.1073/pnas.0600244103 · Cited by 2,113 · cited 1×
“Searchlight approaches (Kriegeskorte et al., 2006) are multivariate analysis methods that step through all voxels of interest in sequence (in our case, all voxels in a given network) and examine voxel values in a ‘searchlight’ region of interest surrounding the current voxel.”
Alzheimer Mechanisms and Therapeutic Strategies
Huang, Y., & Mucke, L. (2012) · Cell · doi:10.1016/j.cell.2012.02.040 · Cited by 1,758 · cited 2×
“…it allowed us to confirm previous studies done in animal models (e.g. Bero et al., 2011, 2012) or using intrinsic connectivity estimates from healthy controls (e.g. Buckner et al., 2009, Seeley et al., 2009, Zhou et al., 2012) that may not necessarily replicate in patients (Huang and Mucke, 2012).”
Distinct patterns of brain activity in young carriers of the APOE -ε4 allele
Filippini, N., MacIntosh, B. J., Hough, M. G., Goodwin, G. M., Frisoni, G. B., Smith, S. M., Matthews, P. M., Beckmann, C. F., & Mackay, C. E. (2009) · Proceedings of the National Academy of Sciences · doi:10.1073/pnas.0811879106 · Cited by 1,613 · cited 1×
“The estimation of independent component analysis across both groups was in line with previous research (e.g. Filippini et al., 2009) and ensured a better correspondence of network maps between groups.”
A Baseline for the Multivariate Comparison of Resting-State Networks
Allen, E. A., Erhardt, E. B., Damaraju, E., Gruner, W. E., Segall, J. M., Silva, R. F., Havlíček, M., Rachakonda, S., Fries, J. F., Kalyanam, R., et al. (2011) · Frontiers in Systems Neuroscience · doi:10.3389/fnsys.2011.00002 · Cited by 1,329 · cited 5×
“, 2012), the DMN and so-called attentional networks were of a priori interest (Allen et al., 2011).”
InfluentialMorris, J. C., Mohs, R. C., Rogers, H., Fillenbaum, G. G., & Heyman, A. (1988) · PubMed · Cited by 1,131
Clusters of Hyperactive Neurons Near Amyloid Plaques in a Mouse Model of Alzheimer’s Disease
Busche, M. A., Eichhoff, G., Adelsberger, H., Abramowski, D., Wiederhold, K.-H., Haass, C., Staufenbiel, M., Konnerth, A., & Garaschuk, O. (2008) · Science · doi:10.1126/science.1162844 · Cited by 1,125 · cited 2×
“On the one hand, animal studies have linked amyloid-b to reduced intrinsic activity and connectivity (Busche et al., 2008; Bero et al., 2011), a finding that has been repeatedly corroborated in the human DMN (Sheline et al., 2010; Mormino et al., 2011; for a review see Sheline and Raichle, 2013).”
Large-scale cortical correlation structure of spontaneous oscillatory activity
Hipp, J. F., Hawellek, D. J., Corbetta, M., Siegel, M., & Engel, A. K. (2012) · Nature Neuroscience · doi:10.1038/nn.3101 · Cited by 1,113 · cited 1×
“This approach has been used to remove zero-lag correlations when connectivity is calculated in magnetoencephalographic data (see Brookes et al., 2011; Hipp et al., 2012).”
Selective changes of resting-state networks in individuals at risk for Alzheimer’s disease
Sorg, C., Riedl, V., Mühlau, M., Calhoun, V. D., Eichele, T., Läer, L., Drzezga, A., Förstl, H., Kurz, A., Zimmer, C., et al. (2007) · Proceedings of the National Academy of Sciences · doi:10.1073/pnas.0708803104 · Cited by 1,036 · cited 3×
“05 FWE cluster corrected for multiple comparisons) only in posterior parietal regions of the posterior DMN and right attention networks, replicating previous results (e.g. Sorg et al., 2007; see Supplementary Fig.”
Self-citationSperling, R. A., LaViolette, P. S., O'Keefe, K., O'Brien, J., Rentz, D. M., Pihlajamaki, M., Marshall, G., Hyman, B. T., Selkoe, D. J., Hedden, T., et al. (2009) · Neuron · doi:10.1016/j.neuron.2009.07.003 · Cited by 1,027 · cited 2×
“Typically, the deposition of plaques has been associated with the default mode network (DMN; Buckner et al., 2005; Sperling et al., 2009), a set of frontal and parietal midline structures with high metabolic activity that are coupled through high intrinsic functional connectivity (i.e. synchronous…”
He, Y., Chen, Z., & Evans, A. (2008) · The Journal of Neuroscience · doi:10.1523/jneurosci.0141-08.2008 · Cited by 965 · cited 2×
“rather than to spatially contiguous but less connected neighbours (He et al., 2008; Seeley et al., 2009; Bero et al., 2012; Zhou et al., 2012); and that (ii) amyloid-b pathology is accelerated by local”
Investigating the electrophysiological basis of resting state networks using magnetoencephalography
Brookes, M. J., Woolrich, M., Luckhoo, H., Price, D., Hale, J. R., Stephenson, M. C., Barnes, G. R., Smith, S. M., & Morris, P. G. (2011) · Proceedings of the National Academy of Sciences · doi:10.1073/pnas.1112685108 · Cited by 938 · cited 6×
“Resulting network connectivity scores were then submitted to two-way mixed-effects ANOVA with factors group and network.”
InfluentialNeuronal activity regulates the regional vulnerability to amyloid-β deposition
Bero, A. W., Yan, P., Roh, J. H., Cirrito, J. R., Stewart, F. R., Raichle, M. E., Lee, J.-M., & Holtzman, D. M. (2011) · Nature Neuroscience · doi:10.1038/nn.2801 · Cited by 880 · cited 7×
“On the one hand, animal studies have linked amyloid-b to reduced intrinsic activity and connectivity (Busche et al., 2008; Bero et al., 2011), a finding that has been repeatedly corroborated in the human DMN (Sheline et al., 2010; Mormino et al., 2011; for a review see Sheline and Raichle, 2013).”
InfluentialComparison of multi‐subject ICA methods for analysis of fMRI data
Erhardt, E. B., Rachakonda, S., Bedrick, E. J., Allen, E. A., Adalı, T., & Calhoun, V. D. (2010) · Human Brain Mapping · doi:10.1002/hbm.21170 · Cited by 733 · cited 1×
“Our independent component analysis approach consisted of a series of wellestablished analysis steps (Kiviniemi et al., 2003; Erhardt et al., 2011).”
Mosconi, L., Tsui, W. H., Herholz, K., Pupi, A., Drzezga, A., Lucignani, G., Reiman, E. M., Holthoff, V., Kalbe, E., Sorbi, S., et al. (2008) · Journal of Nuclear Medicine · doi:10.2967/jnumed.107.045385 · Cited by 726 · cited 3×
“05. automatically spatially normalized to the MNI-template in SPM5 using warping parameters derived from previous individual structural MRI normalization (Mosconi et al., 2008).”
InfluentialSelf-citationA network diffusion model of disease progression in dementia
Raj, A., Kuceyeski, A., & Weiner, M. (2012) · Neuron · doi:10.1016/j.neuron.2011.12.040 · Cited by 723 · cited 2×
“atrophy data (Buckner et al., 2009; Seeley et al., 2009; Raj et al., 2012; Zhou et al., 2012), or which correlated amyloid-b plaques with DMN connectivity across subjects (Drzezga et al.”
Predicting Regional Neurodegeneration from the Healthy Brain Functional Connectome
Zhou, J., Gennatas, E. D., Kramer, J. H., Miller, B. L., & Seeley, W. W. (2012) · Neuron · doi:10.1016/j.neuron.2012.03.004 · Cited by 706 · cited 5×
“…models in healthy controls and compared them with patient atrophy data (Buckner et al., 2009; Seeley et al., 2009; Raj et al., 2012; Zhou et al., 2012), or which correlated amyloid-b plaques with DMN connectivity across subjects (Drzezga et al., 2011), here we developed a…”
InfluentialCalhoun, V. D., Adalı, T., Pearlson, G. D., & Pekar, J. J. (2001) · Human Brain Mapping · doi:10.1002/hbm.1024 · Cited by 697 · cited 2×
“analysis framework (Calhoun et al., 2001), which is implemented”
Resting state fMRI in Alzheimer's disease: beyond the default mode network
Agosta, F., Pievani, M., Geroldi, C., Copetti, M., Frisoni, G. B., & Filippi, M. (2011) · Neurobiology of Aging · doi:10.1016/j.neurobiolaging.2011.06.007 · Cited by 599 · cited 2×
“Following previous findings of aberrant medial and lateral heteromodal frontoparietal networks in early Alzheimer’s disease (Sorg et al., 2007, 2009; Neufang et al., 2011; Agosta et al., 2012), the DMN and so-called attentional networks were of a priori interest (Allen et al.”
Disruption of Functional Connectivity in Clinically Normal Older Adults Harboring Amyloid Burden
Hedden, T., Van Dijk, K. R. A., Becker, J. A., Mehta, A., Sperling, R. A., Johnson, K. A., & Buckner, R. L. (2009) · The Journal of Neuroscience · doi:10.1523/jneurosci.3189-09.2009 · Cited by 598 · cited 2×
“This finding is in line with results of previous studies, which found intersubject correlations between amyloid-b load and intrinsic connectivity in the DMN in individuals with significant plaque pathology (Hedden et al., 2009; Sheline et al., 2010; Mormino et al., 2011).”
Sheline, Y. I., Raichle, M. E., Snyder, A. Z., Morris, J. C., Head, D., Wang, S., & Mintun, M. A. (2010) · Biological Psychiatry · doi:10.1016/j.biopsych.2009.08.024 · Cited by 597 · cited 2×
“This finding is in line with results of previous studies, which found intersubject correlations between amyloid-b load and intrinsic connectivity in the DMN in individuals with significant plaque pathology (Hedden et al., 2009; Sheline et al., 2010; Mormino et al., 2011).”
Brier, M. R., Thomas, J. B., Snyder, A. Z., Benzinger, T. L., Zhang, D., Raichle, M. E., Holtzman, D. M., Morris, J. C., & Ances, B. M. (2012) · Journal of Neuroscience · doi:10.1523/jneurosci.5698-11.2012 · Cited by 595
Resting state functional connectivity in preclinical Alzheimer’s disease
Sheline, Y. I., & Raichle, M. E. (2013) · Biological Psychiatry · doi:10.1016/j.biopsych.2012.11.028 · Cited by 509
Spatial correlation between brain aerobic glycolysis and amyloid-β (Aβ) deposition
Vlassenko, A. G., Vaishnavi, S. N., Couture, L., Sacco, D., Shannon, B. J., Mach, R. H., Morris, J. C., Raichle, M. E., & Mintun, M. A. (2010) · Proceedings of the National Academy of Sciences · doi:10.1073/pnas.1010461107 · Cited by 404 · cited 1×
“This association is mostly due to the apparent spatial overlap between the DMN and the average deposition of amyloid across the cortex (e.g. Buckner et al., 2005, 2009; Vlassenko et al., 2010; Mormino et al., 2011).”
Activity Dependent Degeneration Explains Hub Vulnerability in Alzheimer's Disease
de Haan, W., Mott, K. K., van Straaten, E. C. W., Scheltens, P., & Stam, C. J. (2012) · PLoS Computational Biology · doi:10.1371/journal.pcbi.1002582 · Cited by 400 · cited 2×
“In contrast, rGLOBAL did not correlate with mean intrinsic connectivity in any network of either group (all uncorrected P4 0.12), indicating that the correlation was mainly driven by variability in PiB-uptake.”
InfluentialDrzezga, A. E., Becker, J. A., Dijk, K. R. A. V., Sreenivasan, A., Talukdar, T., Sullivan, C., Schultz, A. P., Sepulcre, J., Putcha, D., Greve, D. N., et al. (2011) · Brain · doi:10.1093/brain/awr066 · Cited by 385 · cited 10×
“15, consistent with cut-off values used in previous PiB-PET studies (Drzezga et al., 2011).”
InfluentialSelf-citationClinical and Biomarker Changes in Dominantly Inherited Alzheimer's Disease
(2012) · New England Journal of Medicine · doi:10.1056/nejmx120056 · Cited by 385
Independent component analysis of nondeterministic fMRI signal sources
Kiviniemi, V. J., Kantola, J.-H., Jauhiainen, J., Hyvärinen, A., & Tervonen, O. A. (2003) · NeuroImage · doi:10.1016/s1053-8119(03)00097-1 · Cited by 381 · cited 1×
“Our independent component analysis approach consisted of a series of wellestablished analysis steps (Kiviniemi et al., 2003; Erhardt et al., 2011).”
Mormino, E. C., Smiljic, A., Hayenga, A. O., Onami, S. H., Greicius, M. D., Rabinovici, G. D., Janabi, M., Baker, S. L., Yen, I. V., Madison, C. M., et al. (2011) · Cerebral Cortex · doi:10.1093/cercor/bhr025 · Cited by 344 · cited 4×
“This association is mostly due to the apparent spatial overlap between the DMN and the average deposition of amyloid across the cortex (e.g. Buckner et al., 2005, 2009; Vlassenko et al., 2010; Mormino et al., 2011).”
InfluentialLehmann, M., Ghosh, P. M., Madison, C., Laforce, R., Corbetta-Rastelli, C., Weiner, M. W., Greicius, M. D., Seeley, W. W., Gorno-Tempini, M. L., Rosen, H. J., et al. (2013) · Brain · doi:10.1093/brain/aws327 · Cited by 325 · cited 3×
“2A and B), with the highest load in the posterior DMN. Generally, the correlation between plaques and connectivity was higher in networks of higher median plaque load (Fig.”
Mouse models of Alzheimer's disease
Hall, A. M., & Roberson, E. D. (2012) · Brain Research Bulletin · doi:10.1016/j.brainresbull.2011.11.017 · Cited by 317
Lifespan brain activity, β-amyloid, and Alzheimer's disease
Jagust, W. J., & Mormino, E. C. (2011) · Trends in Cognitive Sciences · doi:10.1016/j.tics.2011.09.004 · Cited by 221 · cited 3×
“Our finding provides strong evidence for the previously stated hypothesis (Jagust and Mormino, 2011) that high levels of connectivity in heteromodal areas are associated with increased levels of amyloidb pathology, potentially due to nodal stress incurred by a lifetime of increased intrinsic…”
Bidirectional Relationship between Functional Connectivity and Amyloid-β Deposition in Mouse Brain
Bero, A. W., Bauer, A. Q., Stewart, F. R., White, B. R., Cirrito, J. R., Raichle, M. E., Culver, J. P., & Holtzman, D. M. (2012) · The Journal of Neuroscience · doi:10.1523/jneurosci.5845-11.2012 · Cited by 181 · cited 7×
“…spreading to functionally connected areas rather than to spatially contiguous but less connected neighbours (He et al., 2008; Seeley et al., 2009; Bero et al., 2012; Zhou et al., 2012); and that (ii) amyloid-b pathology is accelerated by local stress caused by a lifetime of increased metabolism…”
InfluentialAttention‐related networks in Alzheimer's disease: A resting functional MRI study
Li, R., Wu, X., Fleisher, A., Reiman, E. M., Chen, K., & Li, Y. (2011) · Human Brain Mapping · doi:10.1002/hbm.21269 · Cited by 146 · cited 1×
“…deficits in functional connectivity of other intrinsic networks covering heteromodal areas (Sorg et al., 2007; Brier et al., 2012; Li et al., 2012; see also Sorg et al., 2012), the latter point has been reformulated in a model that supposes effects of amyloid-b in hetermodal…”
Increased Intrinsic Brain Activity in the Striatum Reflects Symptom Dimensions in Schizophrenia
Sorg, C., Manoliu, A., Neufang, S., Myers, N. E., Peters, H., Schwerthöffer, D., Scherr, M., Mühlau, M., Zimmer, C., Drzezga, A. E., et al. (2012) · Schizophrenia Bulletin · doi:10.1093/schbul/sbr184 · Cited by 133 · cited 2×
“As described previously (Sorg et al., 2013), the preprocessed data were decomposed into spatially independent components reflecting intrinsic networks in a group-independent component analysis framework (Calhoun et al., 2001), which is implemented in the GIFT software (http://icatb.sourceforge.net).”
Self-citationLehmann, M., Madison, C. M., Ghosh, P. M., Seeley, W. W., Mormino, E., Greicius, M. D., Gorno-Tempini, M. L., Kramer, J. H., Miller, B. L., Jagust, W. J., et al. (2013) · Proceedings of the National Academy of Sciences · doi:10.1073/pnas.1221536110 · Cited by 122 · cited 2×
“Since our model predicts that the same mechanism governs amyloid-b-related neurodegeneration, irrespective of the affected network, it should also apply to other variants of Alzheimer’s disease, such as posterior cortical atrophy or logopenic primary progressive aphasia (Lehmann et al., 2013a, b).”
In vivo characterization of the early states of the amyloid-beta network
Sepulcre, J., Sabuncu, M. R., Becker, A., Sperling, R., & Johnson, K. A. (2013) · Brain · doi:10.1093/brain/awt146 · Cited by 117 · cited 2×
“Given the widespread and well-known distribution of amyloid-b outside the DMN (Lehmann et al., 2013a, b; Sepulcre et al., 2013), and the well-characterized deficits in functional connectivity of other intrinsic networks covering heteromodal areas (Sorg et al.”
Neufang, S., Akhrif, A., Riedl, V., Förstl, H., Kurz, A., Zimmer, C., Sorg, C., & Wohlschläger, A. M. (2011) · Journal of Alzheimer s Disease · doi:10.3233/jad-2011-102154 · Cited by 101 · cited 2×
“Following previous findings of aberrant medial and lateral heteromodal frontoparietal networks in early Alzheimer’s disease (Sorg et al., 2007, 2009; Neufang et al., 2011; Agosta et al., 2012), the DMN and so-called attentional networks were of a priori interest (Allen et al.”
Self-citationImpact of Alzheimers Disease on the Functional Connectivity of Spontaneous Brain Activity
Sorg, C., Riedl, V., Perneczky, R., Kurz, A., & Wohlschläger, A. M. (2009) · Current Alzheimer Research · doi:10.2174/156720509790147106 · Cited by 86 · cited 1×
“Following previous findings of aberrant medial and lateral heteromodal frontoparietal networks in early Alzheimer’s disease (Sorg et al., 2007, 2009; Neufang et al., 2011; Agosta et al., 2012), the DMN and so-called attentional networks were of a priori interest (Allen et al., 2011).”
Self-citationDistinct patterns of brain activity in young carriers of the APOE e4 allele
Filippini, N., MacIntosh, B., Hough, M., Goodwin, G. M., Frisoni, G. B., Ebmeier, K. P., Smith, S. M., Matthews, P. M., Beckmann, C. F., & Mackay, C. (2009) · NeuroImage · doi:10.1016/s1053-8119(09)71381-3 · Cited by 81
Asymmetric Loss of Parietal Activity Causes Spatial Bias in Prodromal and Mild Alzheimer's Disease
Sorg, C., Myers, N. E., Redel, P., Bublak, P., Riedl, V., Manoliu, A., Perneczky, R., Grimmer, T., Kurz, A., Förstl, H., et al. (2011) · Biological Psychiatry · doi:10.1016/j.biopsych.2011.09.027 · Cited by 25 · cited 1×
“…in functional connectivity of other intrinsic networks covering heteromodal areas (Sorg et al., 2007; Brier et al., 2012; Li et al., 2012; see also Sorg et al., 2012), the latter point has been reformulated in a model that supposes effects of amyloid-b in hetermodal (i.e. fronto-parietal)…”
Self-citationLifespan brain activity, b-amyloid, and Alzheimer's disease
Jagust, W. J., & Mormino, E. C. (2011) · Cited by 6
Cited by
Sorted by citations
The Amyloid-β Pathway in Alzheimer’s Disease
Hampel, H., Hardy, J., Blennow, K., Chen, C., Perry, G., Kim, S. H., Villemagne, V. L., Aisen, P., Vendruscolo, M., Iwatsubo, T., et al. (2021) · Molecular Psychiatry · doi:10.1038/s41380-021-01249-0 · Cited by 1,952
The connectomics of brain disorders
Fornito, A., Zalesky, A., & Breakspear, M. (2015) · Nature Reviews Neuroscience · doi:10.1038/nrn3901 · Cited by 1,734
Amyloid β-based therapy for Alzheimer’s disease: Challenges, successes and future
Zhang, Y., Chen, H., Li, R., Sterling, K., & Song, W. (2023) · Signal Transduction and Targeted Therapy · doi:10.1038/s41392-023-01484-7 · Cited by 988
Palmqvist, S., Schöll, M., Strandberg, O., Mattsson, N., Stomrud, E., Zetterberg, H., Blennow, K., Landau, S., Jagust, W., & Hansson, O. (2017) · Nature Communications · doi:10.1038/s41467-017-01150-x · Cited by 911
The Evolution of Preclinical Alzheimer’s Disease: Implications for Prevention Trials
Sperling, R., Mormino, E., & Johnson, K. (2014) · Neuron · doi:10.1016/j.neuron.2014.10.038 · Cited by 725
Metadata
- Authors
- Myers, N., Pasquini, L., Göttler, J., Grimmer, T., Koch, K., Ortner, M., Neitzel, J., Mühlau, M., Förster, S., Kurz, A., Förstl, H., Zimmer, C., Wohlschläger, A. M., Riedl, V., Drzezga, A., & Sorg, C.
- Affiliations
- TUM Klinikum (DE)
- Technical University of Munich (DE)
- University of Cologne (DE)
- Corresponding author
- Myers, Nicholas
- ORCID
- Venue
- Brain
- Publisher
- Oxford University Press (OUP)
- Published
- 2014-04-26
- Volume
- 137
- Issue
- 7
- Pages
- 2052-2064
- ISSN
- 0006-8950 (ISSN-L)
- 1460-2156
- PMC
- PMC4065018
- OpenAlex
- W2031921419
- Cited by
- 132
- References
- 57
- Citations by year
- 2026: 3 · 2025: 3 · 2024: 9 · 2023: 13 · 2022: 9 · 2021: 15 · 2020: 5 · 2019: 10 · 2018: 13 · 2017: 20 · 2016: 11 · 2015: 14 · 2014: 7
- FWCI
- 9.67
- Type
- journal article
- Language
- en
- Open access
- hybrid
- doi.org
- Licence
- cc-by
- Locations
- Brain (publishedVersion, cc-by)
- PubMed Central (publishedVersion, cc-by)
- PubMed (publishedVersion)
- eScholarship (California Digital Library) (submittedVersion, cc-by)
- mediaTUM (Technical University of Munich) (submittedVersion)
- Funders
- Wellcome Trust
- Bundesministerium für Bildung und Forschung (01ER0803, 01EV0710)
- Topics
- Life Sciences › Neuroscience › Cognitive Neuroscience › Functional Brain Connectivity Studies
- Health Sciences › Medicine › Psychiatry and Mental health › Dementia and Cognitive Impairment Research
- Life Sciences › Neuroscience › Cellular and Molecular Neuroscience › Alzheimer's disease research and treatments
- Keywords
- amyloid plaques, intrinsic functional connectivity, Alzheimer's disease, prodromal Alzheimer's disease, default mode network, frontoparietal attention network, within-patient comparison, Pittsburgh compound B PET, resting-state fMRI
- MeSH terms
- Aged, Aged, 80 and over, Alzheimer Disease, Analysis of Variance, Aniline Compounds, Brain, Brain Mapping, Female, Humans, Magnetic Resonance Imaging, Male, Middle Aged, Neural Pathways, Neuropsychological Tests, Thiazoles, Amyloid beta-Peptides, Positron-Emission Tomography, Plaque, Amyloid
About these checks
Registry, retraction, Cites and statistics results are computed, not judged, with one exception: a printed reference that no index lists is read once by a model before it counts as a citation error. Claims are extracted by a model and kept only when their quote appears verbatim in the text; each cited source is then checked, with a model’s help, for whether it says what the claim relies on. Those verdicts can be wrong — read the claim’s quote and the cited source before relying on one.
Statistics and arithmetic are recomputed, not judged.
Confidence bands are shown only for fields calibrated on our annotated test set. None is calibrated yet, so no band is shown.
What counts as a claim ›How we measure confidence ›How we check this ›
Are you an author, or do you see a problem with this page? Request a review
