

The DOI matches its Crossref record; 57 of the 57 references it cites were found in a registry or an index.
Database for mRNA Half-Life of 19 977 Genes Obtained by DNA Microarray Analysis of Pluripotent and Differentiating Mouse Embryonic Stem Cells
Open accessAbstract
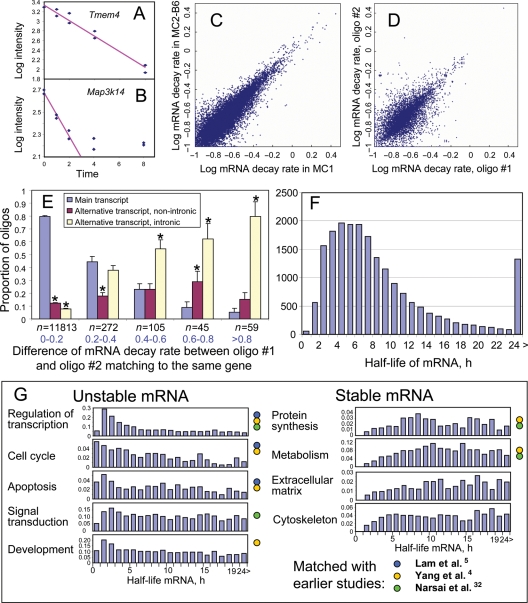
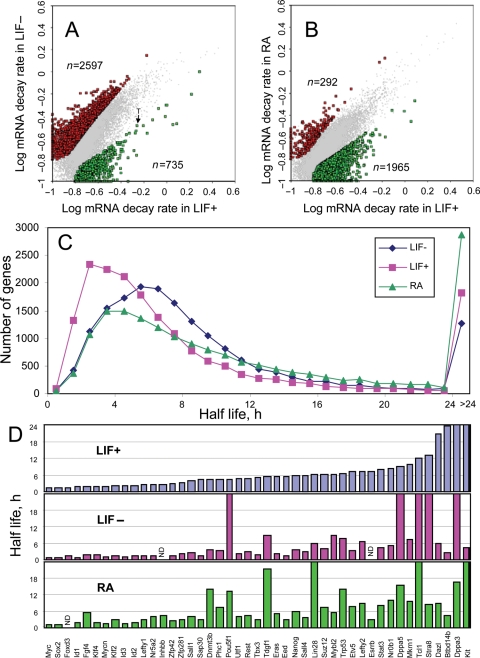
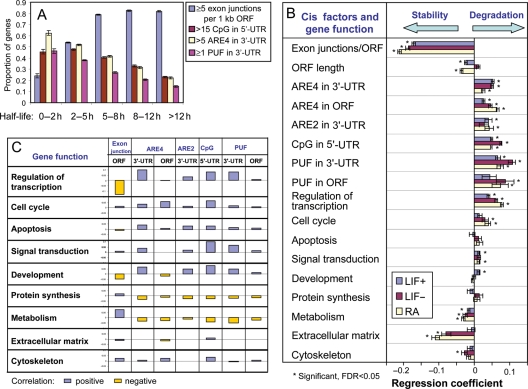
Degradation of mRNA is one of the key processes that control the steady-state level of gene expression. However, the rate of mRNA decay for the majority of genes is not known. We successfully obtained the rate of mRNA decay for 19 977 non-redundant genes by microarray analysis of RNA samples obtained from mouse embryonic stem (ES) cells. Median estimated half-life was 7.1 h and only <100 genes, including Prdm1, Myc, Gadd45 g, Foxa2, Hes5 and Trib1, showed half-life less than 1 h. In general, mRNA species with short half-life were enriched among genes with regulatory functions (transcription factors), whereas mRNA species with long half-life were enriched among genes related to metabolism and structure (extracellular matrix, cytoskeleton). The stability of mRNAs correlated more significantly with the structural features of genes than the function of genes: mRNA stability showed the most significant positive correlation with the number of exon junctions per open reading frame length, and negative correlation with the presence of PUF-binding motifs and AU-rich elements in 3'-untranslated region (UTR) and CpG di-nucleotides in the 5'-UTR. The mRNA decay rates presented in this report are the largest data set for mammals and the first for ES cells.
Overview
The claims and statistics of this paper haven’t been checked yet.
Run the check — free, no account needed. It reads the open-access text and checks the sources it cites.
Integrity signals
Registry
Cites
Statistics
Figures
Verification
Claims the paper makes
The claims and statistics of this paper haven’t been checked yet.
Run the check — free, no account needed. It reads the open-access text and checks the sources it cites.
Claims other papers make about this one
Each is checked against this paper’s own text: does it say what the citing paper says it does?
The source backs part of the claim, not all of it — or backs it for a different population, condition or comparison.
In the citing paper
“In silico analysis showed several ARE 1 (AUUUA) and ARE 4 (12-mer A/U, max.one mismatch) sites (33) as well as a potential miR-27a/b binding site.”
From MicroRNA-27b Contributes to Lipopolysaccharide-mediated Peroxisome Proliferator-activated Receptor γ (PPARγ) mRNA Destabilization (2010) · cites this paper as [33]
Experimental — accuracy not yet measuredIn the citing paper
“This result is in agreement with that previously observed in mESCs 54,55 , thus suggesting the bona fide of the experiment.”
From Intragenic DNA methylation prevents spurious transcription initiation (2017) · cites this paper as [54]
Self-check
Percentages, sums and reported differences re-computed from the paper’s own numbers.
The self-check needs the paper’s full text.
Citations
Cites
Controlling the False Discovery Rate: A Practical and Powerful Approach to Multiple Testing
Benjamini, Y., & Hochberg, Y. (1995) · Journal of the Royal Statistical Society Series B: Statistical Methodology · doi:10.1111/j.2517-6161.1995.tb02031.x · Cited by 109,482 · cited 1×
“FDR, which is necessary for multiple hypothesis testing, was estimated using the method of Benjamini and Hochberg.(35) In addition to FDR, we used the criterion of .”
MethodDatabase resources of the National Center for Biotechnology Information: update
Wheeler, D. L. (2003) · Nucleic Acids Research · doi:10.1093/nar/gkh073 · Cited by 10,695
Kinetics and kinematics for translational motions in microgravity during parabolic flight.
Stirling, L., Willcox, K., Ferguson, P., & Newman, D. (2009) · Aviation Space and Environmental Medicine · doi:10.3357/asem.2356.2009 · Cited by 5,455
Shaw, G. D., & Kamen, R. (1986) · Cell · doi:10.1016/0092-8674(86)90341-7 · Cited by 3,946
AU-rich elements: characterization and importance in mRNA degradation
Chen, C.-Y. A., & Shyu, A.-B. (1995) · Trends in Biochemical Sciences · doi:10.1016/s0968-0004(00)89102-1 · Cited by 1,948 · cited 1×
“multi-exon genes), which makes mRNA more stable;(44) and (ii) the presence of AREs in the 30UTR of genes, which makes mRNA less stable.(45,46) However, all the previous results have been obtained using single-factor analysis, which may easily lead to erroneous conclusions if factors are correlated.”
ResultXie, X., Lu, J., Kulbokas, E. J., Golub, T. R., Mootha, V., Lindblad-Toh, K., Lander, E. S., & Kellis, M. (2005) · Nature · doi:10.1038/nature03441 · Cited by 1,872 · cited 1×
“We used UGUANAUA as PUF consensus motifs.(29,48,49) CpG elements were added to the list after we unexpectedly found that they can affect mRNA stability.”
MethodThe Nonsense-Mediated Decay RNA Surveillance Pathway
Chang, Y.-F., Imam, J. S., & Wilkinson, M. (2007) · Annual Review of Biochemistry · doi:10.1146/annurev.biochem.76.050106.093909 · Cited by 1,326
The highways and byways of mRNA decay
Garneau, N. L., Wilusz, J., & Wilusz, C. J. (2007) · Nature Reviews Molecular Cell Biology · doi:10.1038/nrm2104 · Cited by 1,294 · cited 1×
“For example, ARE-binding proteins can recruit PARN or exosomes.(51) It is also known that the stability of mRNA can be modified by immune factors via AREs in 30-UTR.”
BackgroundA protein interaction network for pluripotency of embryonic stem cells
Wang, J., Rao, S., Chu, J., Shen, X., Levasseur, D. N., Theunissen, T. W., & Orkin, S. H. (2006) · Nature · doi:10.1038/nature05284 · Cited by 1,107
Database resources of the National Center for Biotechnology Information
Wheeler, D. L., Barrett, T., Benson, D. A., Bryant, S. H., Canese, K., Chetvernin, V., Church, D. M., DiCuccio, M., Edgar, R., Federhen, S., et al. (2007) · Nucleic Acids Research · doi:10.1093/nar/gkm1000 · Cited by 1,007
Research works printed but not linked: 3
- 2001, Genome biology, 2
- 2002, Molecular cell, 160, 951
- White, 2001, RNA, 7, 1855
Cited by
Sorted by citations
Items 301–400 of 608
Stein, G. Y., Yosef, N., Reichman, H., Horev, J., Laser-Azogui, A., Berens, A., Resau, J. H., Ruppin, E., Sharan, R., & Tsarfaty, I. (2012) · PLoS ONE · doi:10.1371/journal.pone.0045969 · Cited by 17
“) changes in gene expression in response to HGF/SF treatment can be explained by the mRNA half-life of Met kinetic signature genes (Text S1) [27].”
BackgroundGugliandolo, A., Chiricosta, L., Calcaterra, V., Biasin, M., Cappelletti, G., Carelli, S., Zuccotti, G., Avanzini, M. A., Bramanti, P., Pelizzo, G., et al. (2021) · International Journal of Molecular Sciences · doi:10.3390/ijms22158059 · Cited by 17
“Interestingly, JUN transcript was restricted at post transcriptional level by SARS-CoV-2 [68], also due to its short half-life [69].”
BackgroundRhodes, C., Lewis, C. A., Szekely, J., Campbell, A., Creighton, M.-R. A., Boone, E. L., & Seashols‐Williams, S. J. (2022) · Forensic Science International Genetics · doi:10.1016/j.fsigen.2022.102692 · Cited by 17
Wang, E., Li, Y., Li, H., Liu, Y., Ming, R., Wei, J., Du, P., Li, X., Zong, S., & Xiao, H. (2022) · Neuroscience · doi:10.1016/j.neuroscience.2023.03.001 · Cited by 16
High-resolution kinetic characterization of the RIG-I-signaling pathway and the antiviral response
Burkart, S. S., Schweinoch, D., Frankish, J., Sparn, C., Wüst, S., Urban, C., Merlo, M., Magalhães, V. G., Piras, A., Pichlmair, A., et al. (2023) · Life Science Alliance · doi:10.26508/lsa.202302059 · Cited by 18
RNA Exosome Complex-Mediated Control of Redox Status in Pluripotent Stem Cells
Skamagki, M., Zhang, C., Ross, C. A., Ananthanarayanan, A., Liu, Z., Mu, Q., Basu, U., Wang, J., Zhao, R., Li, H., et al. (2017) · Stem Cell Reports · doi:10.1016/j.stemcr.2017.08.024 · Cited by 16
“To test this hypothesis, we performed gene enrichment analysis of a gene set containing the minimal AU-rich motif targeted by the RNA exosome complex that effectively destabilizes mRNA (Sharova et al., 2009; Zubiaga et al., 1995) among a list of genes highly expressed in A-iPSCs (poor expression of ZSCAN10) and in ESC…”
BackgroundMethodWolfe, M. B., Goldstrohm, A. C., & Freddolino, L. (2018) · Methods · doi:10.1016/j.ymeth.2018.12.001 · Cited by 15
“In cultured mammalian cells, the average mRNA half-life is 7–9 hours [55, 56, 16] and it is critical to choose time points that capture the decay of mRNA transcripts of interest.”
BackgroundMethodPoon, J., Campos, M., Foronjy, R., Nath, S., Gupta, G., Railwah, C., Dabo, A. J., Baumlin, N., Salathe, M. A., & Geraghty, P. M. (2019) · International Journal of COPD · doi:10.2147/copd.s196658 · Cited by 16
“LIF also can regulate signaling via influencing mRNA fate of other genes, with the removal of LIF from mouse embryonic stem cells resulting in increased decay rates of mRNA of multiple targets.(49)”
BackgroundLee, H., Fu, C., Lin, C., Hu, J., Huang, T., Lo, K., Tsai, H., Sheu, J., & Tsai, H. (2021) · The EMBO Journal · doi:10.15252/embj.2019104123 · Cited by 16
“Since some translated mRNAs have a half-life shorter than 1 h (Sharova, et al , 2009) or even shorter than 30 min (Raghavan et al , 2002), the half-life of huORF chop 81-105-nt transcript is reasonably sufficient for CHOP translation.”
Mathematical modeling of the cGAS pathway reveals robustness of DNA sensing to TREX1 feedback
Gregg, R. W., Sarkar, S. N., & Shoemaker, J. E. (2018) · Journal of Theoretical Biology · doi:10.1016/j.jtbi.2018.11.001 · Cited by 15
Genome-Wide Stress Responses to Copper and Arsenic in a Field Population of Daphnia
Asselman, J., Semmouri, I., Jackson, C. E., Keith, N., Nieuwerburgh, F. V., Deforce, D. L. D., Shaw, J. R., & Schamphelaere, K. D. (2019) · Environmental Science & Technology · doi:10.1021/acs.est.8b06720 · Cited by 15
Melanson, B. D., Cabrita, M. A., Bose, R., Hamill, J. D., Pan, E., Brochu, C., Marcellus, K. A., Zhao, T. T., Holčı́k, M., & McKay, B. C. (2013) · Nucleic Acids Research · doi:10.1093/nar/gkt279 · Cited by 18
Jasnos, L., Aksoy, F. B., Hersi, H. M., Wantuch, S., & Sawado, T. (2013) · Stem Cell Reports · doi:10.1016/j.stemcr.2013.08.005 · Cited by 14
“It should be noted that the halflife of mRNA molecules for transcription factors is much shorter than the average (Sharova et al., 2009), and thus (C) Box and whisker plots for expression levels of reprogramming factors in WT and TKO single ESCs are shown.”
BackgroundMethodInvestigation of RNA Synthesis Using 5-Bromouridine Labelling and Immunoprecipitation
Kofoed, R. H., Betzer, C., Lykke‐Andersen, S., Molska, E. Š., & Jensen, P. H. (2018) · Journal of Visualized Experiments · doi:10.3791/57056 · Cited by 14
YBX2-dependent stabilization of oocyte mRNA through a reversible sponge-like cortical partition
Zhang, Z., Liu, R., Zhou, H., Luo, Y., Mu, J., Fu, J., Wu, T., Chen, B., Sang, Q., & Wang, L. (2023) · Cell Research · doi:10.1038/s41422-023-00824-0 · Cited by 14
MRI reveals differential effects of amphetamine exposure on neuroglia in vivo
Liu, C. H., Yang, J., Ren, J. Q., Liu, C., You, Z., & Liu, P. K. (2012) · The FASEB Journal · doi:10.1096/fj.12-220061 · Cited by 14
The TRAF-interacting protein (TRAIP) is a novel E2F target with peak expression in mitosis
Chapard, C., Hohl, D., & Huber, M. (2015) · Oncotarget · doi:10.18632/oncotarget.3055 · Cited by 14
“3 hours was found in mouse embryonic stem cells using different culture conditions [65] indicating that the Traip mRNA has an intermediate stability.”
BackgroundIncomplete meiotic sex chromosome inactivation in the domestic dog
Federici, F., Mulugeta, E., Schoenmakers, S., Wassenaar, E., Hoogerbrugge, J. W., van der Heijden, G. W., van Cappellen, W. A., Slotman, J. A., van IJcken, W. F. J., Laven, J. S. E., et al. (2015) · BMC Genomics · doi:10.1186/s12864-015-1501-9 · Cited by 14
“1 h [72], and although regulation of mRNA stability will differ between different cell types, we feel that active transcription of SLCA25A6 in dog pachytene spermatocytes most likely accounts for the high FPKM value that we measured for this mRNA.”
BackgroundColeta, transporte e armazenamento de amostras para diagnóstico molecular
Melo, M. R., Martins, A. R., Barbosa, I. V., Romano, P., & Shcolnik, W. (2010) · Jornal Brasileiro de Patologia e Medicina Laboratorial · doi:10.1590/s1676-24442010000500006 · Cited by 14
Temporally and Spatially Restricted Gene Expression Profiling
Tallafuß, A., Washbourne, P., & Postlethwait, J. H. (2014) · Current Genomics · doi:10.2174/1389202915666140602230106 · Cited by 13
“Some RNAs have long half-lives, for instance the average estimated half-life in human cells was reported to be 600 minutes [13], or about 420 minutes in mouse embryonic stem cells [14], but many have a half-life of 120-360 minutes and some only 15 minutes [15].”
BackgroundCalder, M. D., Watson, P. H., & Watson, A. J. (2011) · Reproduction · doi:10.1530/rep-11-0082 · Cited by 13
“Our calculations for mRNA half-lives for Gclc, Slc2a1 and Slc7a1 were all longer than those calculated from a microarray study of mouse ES cells (Sharova et al. 2009).”
BackgroundKallestad, L., Blackshaw, S., Khalil, A. M., & Palczewski, K. (2019) · Scientific Reports · doi:10.1038/s41598-019-51379-3 · Cited by 13
Regulatory Mechanisms Controlling Inflammation and Synthesis of Acute Phase Proteins
Jura, J., & Koj, A. (2011) · InTech eBooks · doi:10.5772/18207 · Cited by 13
“…transcription factor activated by this cascade. www.intechopen.com Acute Phase Proteins – Regulation and Functions of Acute Phase Proteins 68 The half-life of mRNAs coding for mediators of inflammation is considerably shorter than that of mRNAs of various housekeeping genes (Sharova et al., 2009).”
BackgroundEndocrinology: Advances through omics and related technologies
García‐Reyero, N., Tingaud‐Sequeira, A., Cao, M., Zhu, Z., Perkins, E. J., & Hu, W. (2014) · General and Comparative Endocrinology · doi:10.1016/j.ygcen.2014.03.042 · Cited by 13
Bronicki, L., Bélanger, G., & Jasmin, B. J. (2012) · Journal of Neuroscience · doi:10.1523/jneurosci.2247-12.2012 · Cited by 13
“These results are comparable to the previously published half-life values of HuD obtained in embryonic stem cells (Sharova et al., 2009).”
ResultSharov, A. A., Nishiyama, A., Piao, Y., Correa-Cerro, L. S., Amano, T., Thomas, M., Mehta, S. D., & Ko, M. S. H. (2011) · BMC Genomics · doi:10.1186/1471-2164-12-102 · Cited by 13
“To further analyze the effect of major factors on the TF-responsiveness of genes, we used linear regression analysis, as this method helps distinguish true functional relations between cell characteristics from mere correlations [14].”
BackgroundMethodInfluentialSelf-citationGene and Genome Parameters of Mammalian Liver Circadian Genes (LCGs)
Wu, G., Zhu, J., He, F., Wang, W., Hu, S., & Yu, J. M. (2012) · PLoS ONE · doi:10.1371/journal.pone.0046961 · Cited by 13
“In addition, a dataset from a study on mRNA decay in mouse ES cells [56], one dataset about microarray-based transcriptomic data from 46 murine tissues [21] and one massspectrum-based proteomic data from nine murine tissues [22] are also used.”
Analysis of glucocorticoid-induced MYOC expression in human trabecular meshwork cells
Joe, M. K., Sohn, S., Kim, T. E., Im, J.-E., Choi, Y. R., & Kee, C. (2011) · Vision Research · doi:10.1016/j.visres.2011.02.014 · Cited by 14
Gan, Z., Powell, F. L., Zambon, A. C., Buchholz, K. S., Fu, Z., Ocorr, K. A., Bodmer, R., Moya, E. A., Stowe, J. C., Haddad, G. G., et al. (2017) · The Journal of Physiology · doi:10.1113/jp274556 · Cited by 13
“The half-lives analysis of differentially expressed genes was based on Sharova’s mouse mRNA half-life database (Sharova et al. 2009).”
BackgroundMethodInfluentialVan Heesbeen, H. J., Von Oerthel, L., De Vries, P. M., Wagemans, C. M. R. J., & Smidt, M. P. (2023) · International Journal of Molecular Sciences · doi:10.3390/ijms24021387 · Cited by 12
“Since the median half-life of transcripts is estimated at 7–9 h, and those of proteins ~48 h [36,37], we reasoned that FACS sorting neurons ~5/6 h after global loss of H3K79me2 would provide us with the initial transcriptional changes as a result of that H3K79me2 loss.”
BackgroundOptimizing retinal ganglion cell nuclear staining for automated cell counting
Lin, F., Lin, S.-T., Wang, J., & Geisert, E. E. (2024) · Experimental Eye Research · doi:10.1016/j.exer.2024.109881 · Cited by 12
How energy determines spatial localisation and copy number of molecules in neurons
Bergmann, C., Mousaei, K., Rizzoli, S. O., & Tchumatchenko, T. (2025) · Nature Communications · doi:10.1038/s41467-025-56640-0 · Cited by 13
TU-Tagging: A Method for Identifying Layer-Enriched Neuronal Genes in Developing Mouse Visual Cortex
Tomorsky, J., DeBlander, L., Kentros, C. G., Doe, C. Q., & Niell, C. M. (2017) · eNeuro · doi:10.1523/eneuro.0181-17.2017 · Cited by 12
A Protocol for Transcriptome-Wide Inference of RNA Metabolic Rates in Mouse Embryonic Stem Cells
Biasini, A., & Marques, A. C. (2020) · Frontiers in Cell and Developmental Biology · doi:10.3389/fcell.2020.00097 · Cited by 12
Wang, P., Li, C. G., Zhou, X., Cui, D., Ouyang, T., Chen, W., & Ding, S. (2022) · Clinical and Experimental Pharmacology and Physiology · doi:10.1111/1440-1681.13632 · Cited by 12
Mechanism of life-long maintenance of neuron identity despite molecular fluctuations
Traets, J. J. H., van der Burght, S. N., Rademakers, S., Jansen, G., & van Zon, J. S. (2021) · eLife · doi:10.7554/elife.66955 · Cited by 10
“The che-1 mRNA and protein half-lives are short compared to reported mRNA half-lives in eukaryotes (Fornasiero et al. 2018; Sharova et al. 2009) and average protein half-lives reported in young C. elegans adults (Dhondt et al. 2017; Schwanhausser et al. 2011).”
BackgroundIntrinsic factors behind long COVID: III. Persistence of SARS‐CoV‐2 and its components
El‐Baky, N. A., Amara, A. A. A. F., Uversky, V. N., & Redwan, E. M. M. M. (2023) · Journal of Cellular Biochemistry · doi:10.1002/jcb.30514 · Cited by 11
“140 Consequently, SARS ‐ CoV ‐ 2 RNA persistence is a mystery.”
BackgroundCacace, F., Paci, P., Cusimano, V., Germani, A., & Farina, L. (2012) · PLoS Computational Biology · doi:10.1371/journal.pcbi.1002772 · Cited by 13
Direct measurement of pervasive weak repression by microRNAs and their role at the network level
Ma, F., Lin, P., Chen, Q., Lu, X., Zhang, Y. E., & Wu, C. (2018) · BMC Genomics · doi:10.1186/s12864-018-4757-z · Cited by 12
Shelton, M., Ritso, M., Liu, J., O’Neil, D., Kocharyan, A., Rudnicki, M. A., Stanford, W. L., Skerjanc, I. S., & Blais, A. (2019) · PLoS ONE · doi:10.1371/journal.pone.0222946 · Cited by 12
Weaver, J. J. A., & Shoemaker, J. E. (2020) · Processes · doi:10.3390/pr8060719 · Cited by 12
“The literature search provided estimated decay rates for STATP [39], IRF7 [40], and IRF7P [41].”
BackgroundInfluentialControl of tissue development and cell diversity by cell cycle-dependent transcriptional filtering
Chakra, M. A., Isserlin, R., Tran, T. N., & Bader, G. D. (2021) · eLife · doi:10.7554/elife.64951 · Cited by 11
Using stem cell oxygen physiology to optimize blastocyst culture while minimizing hypoxic stress
Bolnick, A. D., Awonuga, A. O., Yang, Y., Abdulhasan, M. A., Xie, Y., Zhou, S., Puscheck, E. E., & Rappolee, D. A. (2017) · Journal of Assisted Reproduction and Genetics · doi:10.1007/s10815-017-0971-x · Cited by 13
Clarke, L. A., Luz, V. C. C., Targowski, S., Ramalho, S. S., Farinha, C. M., & Amaral, M. D. (2021) · Genes · doi:10.3390/genes12111810 · Cited by 11
“3 h, with the greater figure seen in more differentiated cells [43].”
BackgroundXiang, X., Poli, D., Degnan, B. M., & Degnan, B. M. (2022) · Marine Biotechnology · doi:10.1007/s10126-022-10138-8 · Cited by 11
“In the eukaryote animal hosts, mRNA transcripts generally have a half-life of many hours (Sharova et al. 2009; Yang et al. 2003) and are stabilised by the addition of a long tail of adenines (poly(A) tails; ~ 250 long) at the 3′ end of the transcript (Dendooven et al.”
BackgroundKwan, R., Looi, K., & Omary, M. B. (2015) · Experimental Cell Research · doi:10.1016/j.yexcr.2015.04.003 · Cited by 11
“2) are consistent with previous studies showing that metabolic and structural proteins typically have long mRNA half-lives [54,55].”
ResultGenome-wide assessment of post-transcriptional control in the fly brain
Mezan, S., Ashwal-Fluss, R., Shenhav, R., Garber, M. G., & Kadener, S. (2013) · Frontiers in Molecular Neuroscience · doi:10.3389/fnmol.2013.00049 · Cited by 11
“…control and RNA turnover rates, these assessments have been restricted either to unicellular organism e.g.,(Andersson et al., 2006; Shock et al., 2007; Miller et al., 2011; Morey and Van Dolah, 2013; Rustad et al., 2013) or cells in culture (Filipowicz et al., 2008; Sharova et…”
BackgroundGudde, A. E. E. G., van Kessel, I. D. G., André, L. M., Wieringa, B., & Wansink, D. G. (2017) · Biochimica et Biophysica Acta (BBA) - Gene Regulatory Mechanisms · doi:10.1016/j.bbagrm.2017.04.002 · Cited by 12
“We consider the first option unlikely, since DMPK mRNAs are rather stable with a half-life of 7–24 h in LHCN-M2 cells (unpublished data) which matches data found for other cell types [40,58,59].”
BackgroundDesign and Evaluation of Synthetic Terminators for Regulating Mammalian Cell Transgene Expression
Cheng, J. K., Morse, N. J., Wagner, J. M., Tucker, S. K., & Alper, H. S. (2019) · ACS Synthetic Biology · doi:10.1021/acssynbio.8b00285 · Cited by 11
WGS and WTS in leukaemia: A tool for diagnostics?
Meggendorfer, M., Walter, W., & Haferlach, T. (2020) · Best Practice & Research Clinical Haematology · doi:10.1016/j.beha.2020.101190 · Cited by 11
P23 Acts as Functional RBP in the Macrophage Inflammation Response
de Vries, S., Beneš, V., Vries, I. S. N., Rücklé, C., Zarnack, K., Marx, G., Ostareck, D. H., & Ostareck‐Lederer, A. (2021) · Frontiers in Molecular Biosciences · doi:10.3389/fmolb.2021.625608 · Cited by 12
“A comparable Kif15 mRNA halflife (t1/2 5–6 h) was observed in differentiating mouse embryonic stem cells (Sharova et al., 2009).”
BackgroundChen, S., Lai, W., Li, Y., Liu, Y., Jiang, J., Li, X., Jiang, G., & Wang, H. (2023) · The EMBO Journal · doi:10.15252/embj.2023113684 · Cited by 10
“Notably, mRNA decay is prevalent and exhibits a short half-life ranging from minutes to hours (Hambraeus et al, 2003; Sharova et al, 2009).”
BackgroundCharacteristics of Transcriptional Activity in Nonlinear Dynamics of Genetic Regulatory Networks
Rosenfeld, S. (2009) · Gene Regulation and Systems Biology · doi:10.4137/grsb.s3119 · Cited by 11
“Oh, Dear We Are in Tribble”: An Overview of the Oncogenic Functions of Tribbles 1
Singh, K., Showalter, C. A., Manring, H. R., Haque, S. J., & Chakravarti, A. (2024) · Cancers · doi:10.3390/cancers16101889 · Cited by 10
“The half-life of TRIB1 mRNA is less than 1 h [8], and protein turnaround is about 2 h [9].”
BackgroundTsume-Kajioka, M., Kimura-Yoshida, C., Mochida, K., Ueda, Y., & Matsuo, I. (2022) · BMC Biology · doi:10.1186/s12915-022-01251-0 · Cited by 10
“, the time lag in degradation of endogenous protein products because it has been shown that the halflife of Nanog mRNA is about 4 h [53] and that of NANOG protein is more than 4 h [54].”
BackgroundEmerging tools for uncovering genetic and transcriptomic heterogeneities in bacteria
Liao, Y. H. (2024) · Biophysical Reviews · doi:10.1007/s12551-023-01178-y · Cited by 9
“…2013; Taniguchi et al. 2010) and are degraded on much faster timescales, with typical half-lives ranging from seconds to minutes, in comparison to their eukaryotic counterparts which can remain stable for hours or even days (Nierlich and Murakawa 1996; Rauhut and Klug 1999; Sharova et al. 2009).”
Do DNA Microarrays Tell the Story of Gene Expression?
Rosenfeld, S. (2010) · Gene Regulation and Systems Biology · doi:10.4137/grsb.s4657 · Cited by 10
Inference of Gene Regulation via miRNAs During ES Cell Differentiation Using MiRaGE Method
Yoshizawa, M., Taguchi, Y., & Yasuda, J. (2011) · International Journal of Molecular Sciences · doi:10.3390/ijms12129265 · Cited by 9
“To address this issue, we have analyzed the other dataset by the same group [20] with the modified MiRaGE method.”
MethodNucleosome positioning changes during human embryonic stem cell differentiation
Zhang, W., Li, Y., Kulik, M. J., Tiedemann, R. L., Robertson, K. D., Dalton, S., & Zhao, S. (2016) · Epigenetics · doi:10.1080/15592294.2016.1176649 · Cited by 10
“published study.(45) The mouse-human gene conversion was achieved using the Human andMouse Ortholog file obtained from Mouse Genome Database (www.”
MethodEfficient Generation of Dopamine Neurons by Synthetic Transcription Factor mRNAs
Kim, S.-M., Lim, M.-S., Lee, E.-H., Jung, S. J., Chung, H. Y., Kim, C.-H., & Park, C. (2017) · Molecular Therapy · doi:10.1016/j.ymthe.2017.06.015 · Cited by 10
“Most housekeeping genes related to metabolism and structure have long mRNA half-lives, whereas genes with regulatory function have short half-lives.(58) As transcription factors, N and F mRNAs have very short half-lives of less than 1 hr, and rapid mRNA decay may occur after transfection, resulting in low protein expr…”
BackgroundWeber, N., Kowalski, K., Holler, T., Radocaj, A., Fischer, M., Thiemann, S., de la Roche, J., Schwanke, K., Piep, B., Peschel, N., et al. (2020) · Stem Cell Reports · doi:10.1016/j.stemcr.2020.03.015 · Cited by 11
“The general mismatch between MYH-mRNA and protein expression levels in the same cells suggests that synthesis rates and degradation rates of MYH-mRNA and protein are different (Schwanhäusser et al., 2011; Sharova et al., 2009).”
BackgroundGalectin-3 is modulated in pancreatic cancer cells under hypoxia and nutrient deprivation
Filho, A. F. D. S., Tavares, L. B., Pitta, M. G. D. R., Beltrão, E. I. C., & Rêgo, M. J. B. D. M. (2020) · Biological Chemistry · doi:10.1515/hsz-2019-0413 · Cited by 10
Nightshift work can induce oxidative DNA damage: a pilot study
Zou, Y., Ma, X., Chen, Q., Xu, E., Yu, J., Tang, Y., Wang, D., Yu, S., & Qiu, L. (2023) · BMC Public Health · doi:10.1186/s12889-023-15742-4 · Cited by 9
“However, the half-life of mRNAs varies considerably from minutes to days, with a median of ~ 12 h [29].”
BackgroundPolyester materials for mRNA delivery
Chen, W., Ma, Y., Liu, X., & Zhu, D. (2022) · Exploration of Targeted Anti-tumor Therapy · doi:10.37349/etat.2022.00075 · Cited by 9
Wang, L., Zhou, D., Tu, J., Wang, Y., & Lu, Z. (2014) · Biology Direct · doi:10.1186/1745-6150-9-15 · Cited by 9
“It has been known that short-lived mRNAs were enriched among genes with regulatory functions, whereas longlived mRNAs with metabolism and structure [22,23].”
BackgroundKim, S. H., Vieira, M., Kim, H.-J., Kesawat, M. S., & Park, H. (2019) · Molecules and Cells · doi:10.14348/molcells.2019.2398 · Cited by 5
“1 hours (Sharova et al., 2009) and that in human cells is approximately 10 hours (Yang et al.”
BackgroundInfluentialDifferent Functions of Recombinantly Expressed Domains of Tenascin-C in Glial Scar Formation
Bijelić, D. D., Adžić, M., Perić, M., Jakovčevski, I., Förster, E., Schachner, M., & Anđjus, P. R. (2021) · Frontiers in Immunology · doi:10.3389/fimmu.2020.624612 · Cited by 9
“Since it has been shown that the median half-life of mRNA for all genes in mammals is up to 7 h, after which time mRNA is less stable/decays (33), we decided that 6 h would be the most appropriate time point to analyze the effects of fragments and also to not lose the information due to various signaling convergence a…”
BackgroundLau, B., Kerr, K., Camiolo, S., Nightingale, K., Gu, Q., Antrobus, R., Suárez, N. M., Loney, C., Stanton, R. J., Weekes, M. P., et al. (2021) · Journal of Virology · doi:10.1128/jvi.00698-21 · Cited by 11
Jørgensen, A., Thygesen, M. B., Kristiansen, U., & Poulsen, H. E. (2021) · Scandinavian Journal of Clinical and Laboratory Investigation · doi:10.1080/00365513.2021.1969682 · Cited by 9
Sharma, P., Dhiman, P., & Singh, D. (2022) · Nutritional Neuroscience · doi:10.1080/1028415x.2022.2071807 · Cited by 9
Alternative Splicing in Self-Renewal of Embryonic Stem Cells
Cheong, C. Y., & Lufkin, T. (2011) · Stem Cells International · doi:10.4061/2011/560261 · Cited by 10
“Given the function of the 5′ region in transcriptional initiation, and the poly(A) tract in the 3′ end for mRNA stability, it is likely that the use of alternative UTRs can alter the half-time of an mRNA strand, and by extension, the amount of protein production from a functional sequence [37, 38].”
Shigunov, P., Sotelo-Silveira, J. R., Stimamiglio, M. A., Kuligovski, C., Irigoı́n, F., Badano, J. L., Munroe, D. J., Correa, A., & Dallagiovanna, B. (2014) · BMC Molecular Biology · doi:10.1186/1471-2199-15-12 · Cited by 10
“The mean relative amount of cDNA determined by quantitative RT-PCR at each time point after the addition of Act D was used to estimate the half-life of the transcript (t1/2) from a first-order decay model based on the equation, γ = β0 e β 1 t + ε, where γ is the mean relative amount of mRNA at time t after the additio…”
MethodExpression of Pluripotency Markers in Nonpluripotent Human Neural Stem and Progenitor Cells
Vincent, P. H., Benedikz, E., Uhlén, P., Hovatta, O., & Sundström, E. (2017) · Stem Cells and Development · doi:10.1089/scd.2016.0346 · Cited by 9
“It should be noted that since the half-life of GFP and RFP is much longer (>24 h [38]) than, for example, NANOG mRNA (&5 h [39]) and the NANOG protein (120 min in hESCs [40]), cells that turn off gene expression will remain fluorescent for some time.”
Ozgyin, L., Horváth, A., & Bálint, B. L. (2018) · Oncotarget · doi:10.18632/oncotarget.25764 · Cited by 9
Nuclear Origins of Cell-to-Cell VariabilityPreprint
Waks, Z., & Silver, P. A. (2010) · Cold Spring Harbor Symposia on Quantitative Biology · doi:10.1101/sqb.2010.75.027 · Cited by 9
“In mammalian cells, mRNAs are often stable for several hours (Yang et al. 2003; Sharova et al. 2009).”
BackgroundCircular RNAs in Hedgehog Signaling Activation and Hedgehog-Mediated Medulloblastoma Tumors
Azatyan, A., Zhang, S., Darabi, A., Siesjö, P., Wang, T., & Zaphiropoulos, P. G. (2021) · Cancers · doi:10.3390/cancers13205138 · Cited by 8
“In addition, circRNAs are considerably more stable, with a half-life of 24–48 h, compared to linear mRNAs, which are usually degraded within few hours [36,37].”
BackgroundAssessing Markovian and Delay Models for Single-Nucleus RNA Sequencing
Gorin, G., Yoshida, S. R., & Pachter, L. S. (2023) · Bulletin of Mathematical Biology · doi:10.1007/s11538-023-01213-9 · Cited by 13
“On the other hand, the results of genome-wide inhibition experiments are largely consistent with Markovian RNA degradation, with exponentially decaying RNA levels over time (Sharova et al. 2009).”
BackgroundGholipour, A., Zahedmehr, A., Arabian, M., Shakerian, F., Maleki, M., Oveisee, M., & Malakootian, M. (2024) · Non-coding RNA Research · doi:10.1016/j.ncrna.2024.08.006 · Cited by 8
“It is believed that specific regulatory elements within the 3 ′ - UTR, rather than its length, are the primary determinants of regulatory activity [50 – 52].”
BackgroundImpact of delayed processing of bovine peripheral blood on differential gene expression
Sheridan, M., Browne, J. A., MacHugh, D. E., Costello, E., & Gormley, E. P. (2011) · Veterinary Immunology and Immunopathology · doi:10.1016/j.vetimm.2011.11.006 · Cited by 8
Xu, B., Gao, X., Li, X., Jia, Y., Li, F., & Zhang, Z. (2022) · Genome Research · doi:10.1101/gr.276554.122 · Cited by 7
“Although PRO-seq of SHS cells has shown changes of cell cycle – related processes, we only observed the redistribution of cells in cell cycle at LHS, possibly resulting from the half-life of global mRNA in mammalian cells of about several hours (Shyu et al. 1989; Sharova et al. 2009).”
Calia, G., Chen, X., Zuckerman, B., & Weinberger, L. S. (2023) · bioRxiv (Cold Spring Harbor Laboratory) · doi:10.1101/2023.03.14.532632 · Cited by 9
The Experimental Side of Parameter Estimation
Schliemann-Bullinger, M., Fey, D., Bastogne, T., Findeisen, R., Scheurich, P., & Bullinger, E. (2015) · Studies in mechanobiology, tissue engineering and biomaterials · doi:10.1007/978-3-319-21296-8_5 · Cited by 7
Barandun, N., Meier, B., Stehli, G., Gräbnitz, F., Zangger, N. S., & Oxenius, A. (2025) · Cell Reports · doi:10.1016/j.celrep.2024.115127 · Cited by 8
Characterization and molecular targeting of CFIm25 ( NUDT21/CPSF5 ) mRNA using miRNAs
Khan, N., Gupta, M., & Masamha, C. P. (2025) · The FASEB Journal · doi:10.1096/fj.202402184r · Cited by 6
MiREx: mRNA levels prediction from gene sequence and miRNA target knowledge
Pianfetti, E., Lovino, M., Ficarra, E., & Martignetti, L. (2023) · BMC Bioinformatics · doi:10.1186/s12859-023-05560-1 · Cited by 8
“It was shown in [24, 25] that features linked to mRNA half-life encompass specific aspects of gene structure.”
BackgroundAdvances in RNA therapeutics for modulation of ‘undruggable’ targets
Martinsen, E., Jinnurine, T., Subramani, S., & Rogne, M. (2024) · Progress in molecular biology and translational science · doi:10.1016/bs.pmbts.2023.12.003 · Cited by 7
The Ribosome Hypothesis: Decoding Mood Disorder Complexity
Sharma, V., Swaminathan, K., & Shukla, R. (2024) · International Journal of Molecular Sciences · doi:10.3390/ijms25052815 · Cited by 6
“Furthermore, the average half-life of RPGs (10 to 17 h) [27] falls within the duration required for homeostatic scaling, further supporting their potential involvement in mechanisms of homeostatic synaptic scaling.”
BackgroundMalat1 affects transcription and splicing through distinct pathways in mouse embryonic stem cells
Aslanzadeh, M., Stanicek, L., Tarbier, M., Mármol‐Sánchez, E., Biryukova, I., & Friedländer, M. R. (2024) · NAR Genomics and Bioinformatics · doi:10.1093/nargab/lqae045 · Cited by 7
“The half-life measurements used in our analysis were derived from a previously published study ( 42 ).”
MethodGadd45 Proteins in Aging and Longevity of Mammals and Drosophila
Moskalev, A., Николаевна, П. Е., & Shaposhnikov, M. V. (2015) · Healthy ageing and longevity · doi:10.1007/978-3-319-18326-8_2 · Cited by 6
“The median half-life of the GADD45 mRNA is unusually short (less than 1 h), suggesting a regulatory rather than metabolic function for GADD45 proteins (Sharova et al. 2009).”
BackgroundImpact of the cross-talk between circular and messenger RNAs on cell regulation
Fumagalli, M. R., Zapperi, S., & Porta, C. A. M. L. (2018) · Journal of Theoretical Biology · doi:10.1016/j.jtbi.2018.06.024 · Cited by 7
Florencio-Martínez, L. E., Cano-Santiago, A., Mondragón-Rosas, F., Gómez-García, M., Flores-Pérez, C., Román-Carraro, F. C., Barocio-Rodríguez, L. A., Manning-Cela, R. G., Nepomuceno‐Mejía, T., & Martínez‐Calvillo, S. (2021) · Genes · doi:10.3390/genes12020280 · Cited by 7
“These decay rates are relatively short in relation to human mRNAs, which show half-lives of 7 to 10 h [55].”
BackgroundAnti-aging and anti-oxidant activities of murine short interspersed nuclear element antisense RNA
Song, Z., Shah, S., Lv, B., Ji, N., Liu, X., Yan, L., Khan, M., Zhao, Y., Wu, P., Liu, S., et al. (2021) · European Journal of Pharmacology · doi:10.1016/j.ejphar.2021.174577 · Cited by 7
Adolescent binge ethanol impacts H3K36me3 regulation of synaptic genes
Brocato, E. R., & Wolstenholme, J. T. (2023) · Frontiers in Molecular Neuroscience · doi:10.3389/fnmol.2023.1082104 · Cited by 7
“The half-life of mRNA varies based on a variety of factors, but is estimated to last up until 10 h in mammalian cells (Yang et al., 2003; Chen et al., 2008; Sharova et al., 2009; Tani et al., 2012).”
BackgroundUpregulation of Tribbles decreases body weight and increases sleep duration
Popovic, R., Yu, Y., Leal, N. S., Fedele, G., Loh, S. H. Y., & Martins, L. M. (2023) · Disease Models & Mechanisms · doi:10.1242/dmm.049942 · Cited by 8
mRNA as a medicine in nephrology: the future is now
Granata, S., Stallone, G., & Zaza, G. (2023) · Clinical Kidney Journal · doi:10.1093/ckj/sfad196 · Cited by 7
“Moreover, it is highly susceptible to degradation by nucleases and its median intracellular half-life is only approximately 7 h [ 40 ].”
BackgroundRegulatory factors of milk fat synthesis in dairy cows
Ma, L. (2012) · VTechWorks (Virginia Tech) · Cited by 7
Transient and delay chemical master equationsPreprint
Gorin, G., Yoshida, S., & Pachter, L. (2022) · bioRxiv · doi:10.1101/2022.10.17.512599 · Cited by 6
Deep dynamical modelling of developmental trajectories with temporal transcriptomicsPreprint
Maizels, R. J., Snell, D. M., & Briscoe, J. (2023) · bioRxiv (Cold Spring Harbor Laboratory) · doi:10.1101/2023.07.06.547989 · Cited by 7
Ren, X., Weng, Y., Zhang, Z., Pan, G., Li, C., & Cao, Y. (2025) · Nano Letters · doi:10.1021/acs.nanolett.5c01219 · Cited by 6
Metadata
- Authors
- Sharova, L. V., Sharov, A. A., Nedorezov, T., Piao, Y., Shaik, N., & Ko, M. S. H.
- Affiliations
- National Institutes of Health (US)
- Corresponding author
- Ko, M. S.H.
- Venue
- DNA Research
- Publisher
- Oxford University Press (OUP)
- Published
- 2009-01-08
- Volume
- 16
- Issue
- 1
- Pages
- 45-58
- ISSN
- 1340-2838 (ISSN-L)
- 1756-1663
- PMC
- PMC2644350
- OpenAlex
- W2106014350
- Cited by
- 591
- References
- 57
- Citations by year
- 2026: 20 · 2025: 28 · 2024: 42 · 2023: 40 · 2022: 39 · 2021: 42 · 2020: 37 · 2019: 35 · 2018: 36 · 2017: 38 · 2016: 33 · 2015: 43 · 2014: 40 · 2013: 31 · 2012: 30
- FWCI
- 7.82
- Type
- journal article
- Language
- en
- Open access
- gold
- doi.org
- Locations
- DNA Research (publishedVersion)
- PubMed Central (publishedVersion)
- PubMed (publishedVersion)
- Funders
- National Institutes of Health
- National Institute on Aging (Z01AG000656)
- Topics
- Life Sciences › Biochemistry, Genetics and Molecular Biology › Molecular Biology › RNA Research and Splicing
- Life Sciences › Biochemistry, Genetics and Molecular Biology › Molecular Biology › Molecular Biology Techniques and Applications
- Life Sciences › Biochemistry, Genetics and Molecular Biology › Molecular Biology › RNA and protein synthesis mechanisms
- Keywords
- mRNA half-life, mRNA stability, mouse embryonic stem cells, pluripotency, cell differentiation, gene expression regulation, exon-exon junctions, AU-rich elements, 3' untranslated region, CpG, 5' untranslated region, transcription factors, steady-state mRNA levels
- MeSH terms
- Animals, Cell Differentiation, Cells, Cultured, Half-Life, Humans, Mice, Inbred C57BL, Mice, Inbred Strains, RNA, Messenger, Oligonucleotide Array Sequence Analysis, 3' Untranslated Regions, Gene Expression Profiling, RNA Stability, Databases, Genetic, Pluripotent Stem Cells, Mice, Embryonic Stem Cells
About these checks
Registry, retraction, Cites and statistics results are computed, not judged, with one exception: a printed reference that no index lists is read once by a model before it counts as a citation error. Claims are extracted by a model and kept only when their quote appears verbatim in the text; each cited source is then checked, with a model’s help, for whether it says what the claim relies on. Those verdicts can be wrong — read the claim’s quote and the cited source before relying on one.
Statistics and arithmetic are recomputed, not judged.
Confidence bands are shown only for fields calibrated on our annotated test set. None is calibrated yet, so no band is shown.
What counts as a claim ›How we measure confidence ›How we check this ›
Are you an author, or do you see a problem with this page? Request a review
