

The DOI matches its Crossref record; 8 of the 8 references it cites were found in a registry or an index.
Analysis of CDS-located miRNA target sites suggests that they can effectively inhibit translation
Abstract
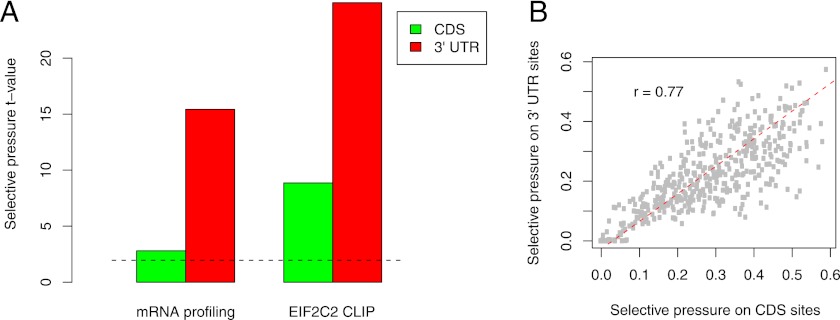
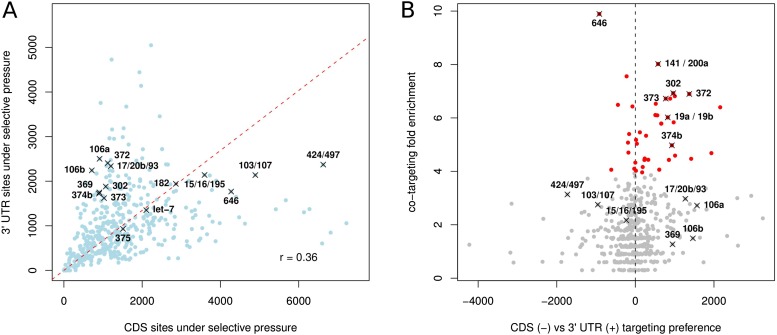
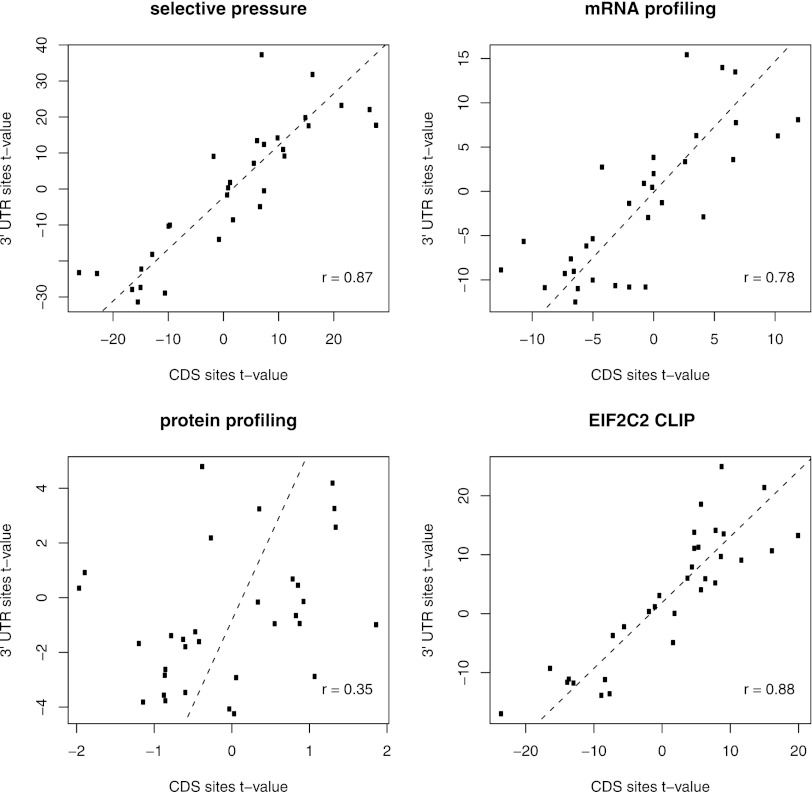
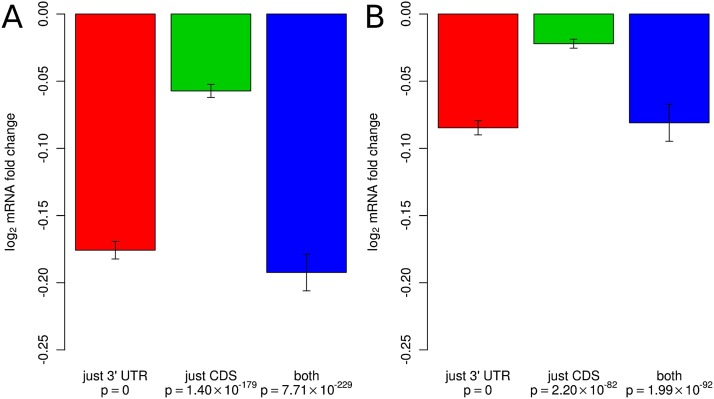
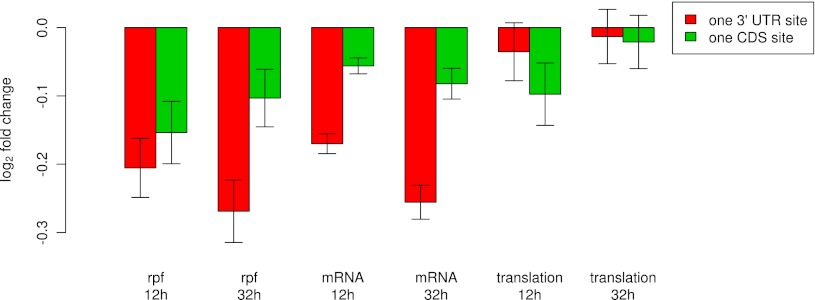
Most of what is presently known about how miRNAs regulate gene expression comes from studies that characterized the regulatory effect of miRNA binding sites located in the 3′ untranslated regions (UTR) of mRNAs. In recent years, there has been increasing evidence that miRNAs also bind in the coding region (CDS), but the implication of these interactions remains obscure because they have a smaller impact on mRNA stability compared with miRNA-target interactions that involve 3′ UTRs. Here we show that miRNA-complementary sites that are located in both CDS and 3′-UTRs are under selection pressure and share the same sequence and structure properties. Analyzing recently published data of ribosome-protected fragment profiles upon miRNA transfection from the perspective of the location of miRNA-complementary sites, we find that sites located in the CDS are most potent in inhibiting translation, while sites located in the 3′ UTR are more efficient at triggering mRNA degradation. Our study suggests that miRNAs may combine targeting of CDS and 3′ UTR to flexibly tune the time scale and magnitude of their post-transcriptional regulatory effects.
Overview
The claims and statistics of this paper haven’t been checked yet.
Run the check — free, no account needed. It reads the open-access text and checks the sources it cites.
Integrity signals
Registry
Cites
Statistics
Figures
Verification
Claims the paper makes
The claims and statistics of this paper haven’t been checked yet.
Run the check — free, no account needed. It reads the open-access text and checks the sources it cites.
Claims other papers make about this one
Each is checked against this paper’s own text: does it say what the citing paper says it does?
In the citing paper
“This difference in potency is consistent with prior studies, and more recent data support that miRNA binding to CDS primarily inhibits translation (Hausser et al., 2013).”
From Transcriptome-wide Discovery of microRNA Binding Sites in Human Brain (2014) · cites this paper as Hausser et al., 2013
Self-check
Percentages, sums and reported differences re-computed from the paper’s own numbers.
The self-check needs the paper’s full text.
Citations
Cites
The C. elegans heterochronic gene lin-4 encodes small RNAs with antisense complementarity to lin-14
Lee, R. C., Feinbaum, R. L., & Ambros, V. (1993) · Cell · doi:10.1016/0092-8674(93)90529-y · Cited by 12,948
Combinatorial microRNA target predictions
Krek, A., Grün, D., Poy, M. N., Wolf, R., Rosenberg, L., Epstein, E. J., MacMenamin, P., da Piedade, I., Gunsalus, K. C., Stoffel, M., et al. (2005) · Nature Genetics · doi:10.1038/ng1536 · Cited by 4,603
Wightman, B., Ha, I., & Ruvkun, G. (1993) · Cell · doi:10.1016/0092-8674(93)90530-4 · Cited by 4,292
Evolutionarily conserved elements in vertebrate, insect, worm, and yeast genomes
Siepel, A., Bejerano, G., Pedersen, J. S., Hinrichs, A. S., Hou, M., Rosenbloom, K., Clawson, H., Spieth, J., Hillier, L. W., Richards, S., et al. (2005) · Genome Research · doi:10.1101/gr.3715005 · Cited by 3,971 · cited 2×
“For comparison, we estimated the average phastCons conservation score (Siepel et al. 2005) for CDS and 39 UTR occurrences of individual motifs, and found a similar but weaker correlation (Supplemental Fig.”
ResultThe impact of microRNAs on protein output
Baek, D., Villén, J., Shin, C., Camargo, F. D., Gygi, S. P., & Bartel, D. P. (2008) · Nature · doi:10.1038/nature07242 · Cited by 3,592
Widespread changes in protein synthesis induced by microRNAs
Selbach, M., Schwanhäusser, B., Thierfelder, N., Fang, Z., Khanin, R., & Rajewsky, N. (2008) · Nature · doi:10.1038/nature07228 · Cited by 3,429 · cited 8×
“Protein profiling data from Selbach et al. (2008) and Baek et al. (2008) were retrieved from http://psilac.mdc-berlin.de/download/ and http://dx.doi.org/10.1038/nature07242, respectively.”
BackgroundMethodResultInfluentialWidespread translational inhibition by plant miRNAs and siRNAs
Brodersen, P., Sakvarelidze-Achard, L., Bruun-Rasmussen, M., Dunoyer, P., Yamamoto, Y. Y., Sieburth, L., & Voinnet, O. (2008) · Science · doi:10.1126/science.1159151 · Cited by 1,477
Ribosome Profiling Shows That miR-430 Reduces Translation Before Causing mRNA Decay in Zebrafish
Bazzini, A. A., Lee, M. T., & Giraldez, A. J. (2012) · Science · doi:10.1126/science.1215704 · Cited by 709 · cited 3×
“In the Bazzini et al. (2012) data, however, what is observed is preferential stabilization of known dre-miR-430 targets, which suggests either a direct involvement of miRNA-dependent regulation or an indirect correlation caused by the overlap between the set of mRNAs that undergo polyadenylation…”
Background
Research works printed but not linked: 56
- 10.1093/bioinformatics/btp565 · DOI
- 1997, Postfertilization deadenylation of mRNAs in Xenopus laevis embryos is sufficient to cause their degradation at the blastula stage, Mol Cell Biol, 17, 209, 10.1128/MCB.17.1.209 · DOI · Paper page
- 10.1016/j.cell.2005.07.031 · DOI
- 10.1097/JTO.0b013e31820db125 · DOI
- 10.1016/j.cell.2009.01.002 · DOI · Paper page
- 10.1038/embor.2012.82 · DOI
- 10.1016/j.cell.2006.04.031 · DOI
- 10.1146/annurev.cellbio.23.090506.123406 · DOI · Paper page
- 10.1038/nature08170 · DOI · Paper page
- 2012, miRNAs' strict schedule, Nat Rev Mol Cell Biol, 13, 340, 10.1038/nrm3354 · DOI
- 10.1126/science.1215691 · DOI · Paper page
- 10.1016/j.cell.2007.12.024 · DOI
- 10.1371/journal.pone.0018067 · DOI
- 10.1038/nrg2290 · DOI
- 10.1073/pnas.0803230105 · DOI · Paper page
- 10.1038/leu.2009.246 · DOI · Paper page
- 10.1002/gcc.20709 · DOI
- 10.1186/1471-2105-8-69 · DOI
- 10.1126/science.1122689 · DOI · Paper page
- 10.1038/ncb1722 · DOI
- 10.1016/j.molcel.2007.06.017 · DOI · Paper page
- 10.1038/nsmb.1552 · DOI
- 10.1038/nature09267 · DOI · Paper page
- 10.1016/j.cell.2010.03.009 · DOI · Paper page
- 10.1101/gr.091181.109 · DOI
- 10.1038/nature03552 · DOI
- 10.1002/(SICI)1098-2795(200005)56:1<12::AID-MRD3>3.0.CO;2-# · DOI
- 10.1038/ncb1681 · DOI
- 10.1093/bioinformatics/btp635 · DOI
- 10.1007/s00239-005-0273-2 · DOI
- 10.1146/annurev.arplant.57.032905.105218 · DOI
- 10.1073/pnas.0709971104 · DOI · Paper page
- 2008, Interplay between microRNAs and RNA-binding proteins determines developmental processes, Cell Cycle, 7, 899, 10.4161/cc.7.7.5644 · DOI
- 10.1016/j.cell.2007.11.034 · DOI
- 10.1093/nar/gkq940 · DOI
- 10.1126/science.1171347 · DOI
- 10.1038/nmeth.1608 · DOI
- 10.1105/tpc.108.063412 · DOI
- 10.1016/j.cell.2004.12.035 · DOI · Paper page
- 10.1128/MCB.02005-06 · DOI · Paper page
- 10.1101/gad.2038811 · DOI
- 10.1038/nm.2512 · DOI · Paper page
- 10.1101/gad.1861409 · DOI
- 10.1371/journal.pone.0016250 · DOI
- 10.1371/journal.pone.0009429 · DOI
- 10.1073/pnas.1006172107 · DOI
- 10.1101/gr.121210.111 · DOI
- 10.1158/0008-5472.CAN-10-3369 · DOI
- 10.1002/stem.431 · DOI · Paper page
- 10.1089/scd.2009.0426 · DOI
- 10.1186/1471-2105-11-292 · DOI
- 10.1016/j.ydbio.2004.02.019 · DOI
- 10.1038/ncomms1532 · DOI
- 10.1002/mrd.1080260113 · DOI
- 10.1016/j.cell.2008.02.019 · DOI
- 10.1016/j.cell.2006.02.037 · DOI
Cited by
Sorted by citations
The multilayered complexity of ceRNA crosstalk and competition
Tay, Y., Rinn, J., & Pandolfi, P. P. (2014) · Nature · doi:10.1038/nature12986 · Cited by 3,910
A critical analysis of codon optimization in human therapeutics
Mauro, V. P., & Chappell, S. A. (2014) · Trends in Molecular Medicine · doi:10.1016/j.molmed.2014.09.003 · Cited by 343
Transcriptome-wide Discovery of microRNA Binding Sites in Human Brain
Boudreau, R. L., Jiang, P., Gilmore, B. L., Spengler, R. M., Tirabassi, R., Nelson, J. A., Ross, C. A., Xing, Y., & Davidson, B. L. (2014) · Neuron · doi:10.1016/j.neuron.2013.10.062 · Cited by 217
Circulating miRNAs as Biomarkers for Neurodegenerative Disorders
Grasso, M., Piscopo, P., Confaloni, A., & Denti, M. (2014) · Molecules · doi:10.3390/molecules19056891 · Cited by 208
Identifying microRNA targets in different gene regions
Xu, W., San Lucas, A., Wang, Z., & Liu, Y. (2014) · BMC Bioinformatics · doi:10.1186/1471-2105-15-s7-s4 · Cited by 159
Metadata
- Authors
- Hausser, J., Syed, A. P., Bilen, B., & Zavolan, M.
- Venue
- Genome Research
- Publisher
- Cold Spring Harbor Laboratory
- Published
- 2013-01-18
- Volume
- 23
- Issue
- 4
- Pages
- 604-615
- ISSN
- 1088-9051
- PMC
- PMC3613578
- Cited by
- 317
- References
- 8
- Language
- en
About these checks
Registry, retraction, Cites and statistics results are computed, not judged, with one exception: a printed reference that no index lists is read once by a model before it counts as a citation error. Claims are extracted by a model and kept only when their quote appears verbatim in the text; each cited source is then checked, with a model’s help, for whether it says what the claim relies on. Those verdicts can be wrong — read the claim’s quote and the cited source before relying on one.
Statistics and arithmetic are recomputed, not judged.
Confidence bands are shown only for fields calibrated on our annotated test set. None is calibrated yet, so no band is shown.
What counts as a claim ›How we measure confidence ›How we check this ›
Are you an author, or do you see a problem with this page? Request a review
