

The DOI matches its Crossref record; 60 of the 60 references it cites were found in a registry or an index; 61 of the 73 sources its claims cite were checked for support.
Aging drives Tet2 +/− clonal hematopoiesis via IL-1 signaling
Open accessAbstract
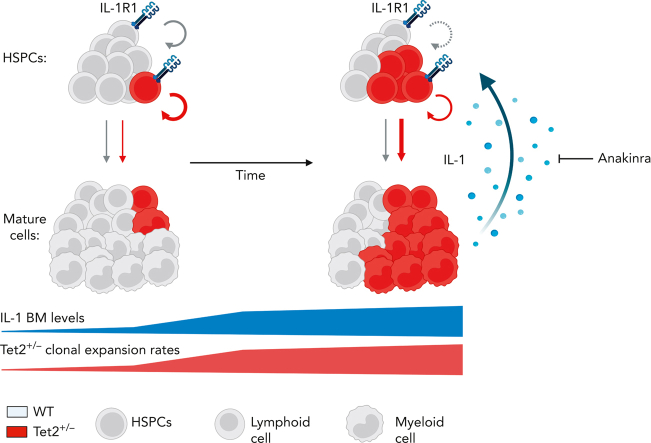
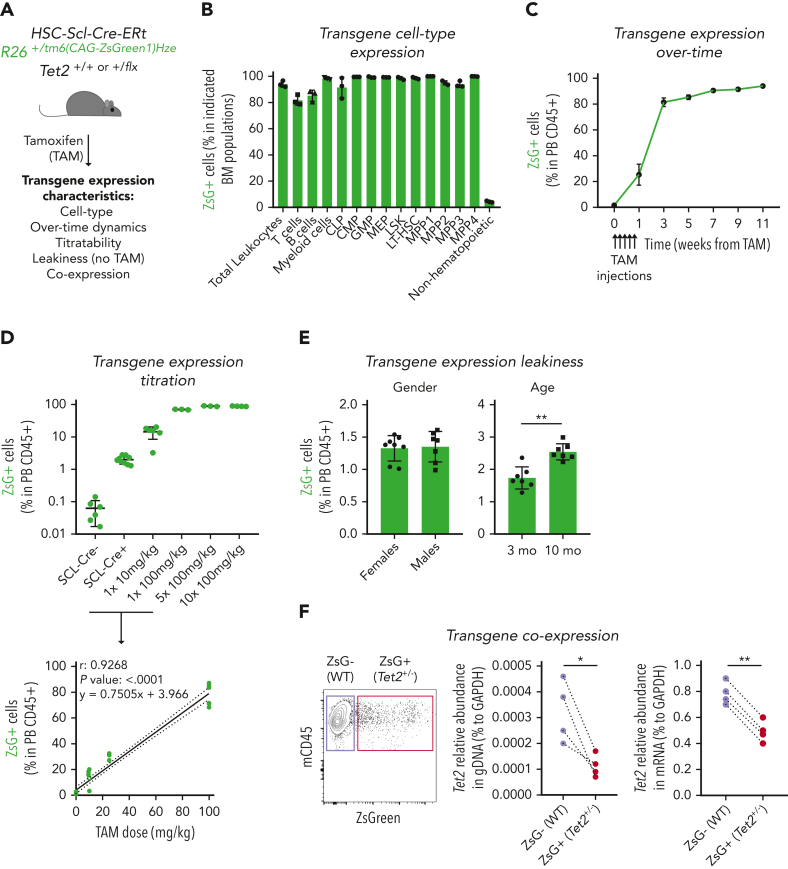
Clonal hematopoiesis of indeterminate potential (CHIP), also referred to as aging-related clonal hematopoiesis, is defined as an asymptomatic clonal expansion of mutant mature hematopoietic cells in ≥4% of blood leukocytes. CHIP associates with advanced age and increased risk for hematological malignancy, cardiovascular disease, and all-cause mortality. Loss-of-function somatic mutations in TET2 are frequent drivers of CHIP. However, the contribution of aging-associated cooperating cell-extrinsic drivers, like inflammation, remains underexplored. Using bone marrow (BM) transplantation and newly developed genetic mosaicism (HSC-SCL-Cre-ERT; Tet2+/flox; R26+/tm6[CAG-ZsGreen1]Hze) mouse models of Tet2+/−driven CHIP, we observed an association between increased Tet2+/− clonal expansion and higher BM levels of the inflammatory cytokine interleukin-1 (IL-1) upon aging. Administration of IL-1 to mice carrying CHIP led to an IL-1 receptor 1 (IL-1R1)–dependent expansion of Tet2+/− hematopoietic stem and progenitor cells (HSPCs) and mature blood cells. This expansion was caused by increased Tet2+/− HSPC cell cycle progression, increased multilineage differentiation, and higher repopulation capacity compared with their wild-type counterparts. In agreement, IL-1α–treated Tet2+/− hematopoietic stem cells showed increased DNA replication and repair transcriptomic signatures and reduced susceptibility to IL-1α–mediated downregulation of self-renewal genes. More important, genetic deletion of IL-1R1 in Tet2+/− HPSCs or pharmacologic inhibition of IL-1 signaling impaired Tet2+/− clonal expansion, establishing the IL-1 pathway as a relevant and therapeutically targetable driver of Tet2+/− CHIP progression during aging.
Overview
AI snapshot
Written from the paper’s full text.
TL;DR
Aging promotes Tet2+/− clonal hematopoiesis in mice through increased bone marrow IL-1, which acts directly on Tet2+/− HSPCs via IL-1R1 to enhance proliferation, multilineage differentiation, and clonal dominance. Genetic or pharmacologic blockade of IL-1–IL-1R1 signaling reduces Tet2+/− clonal expansion during aging.
Key findings
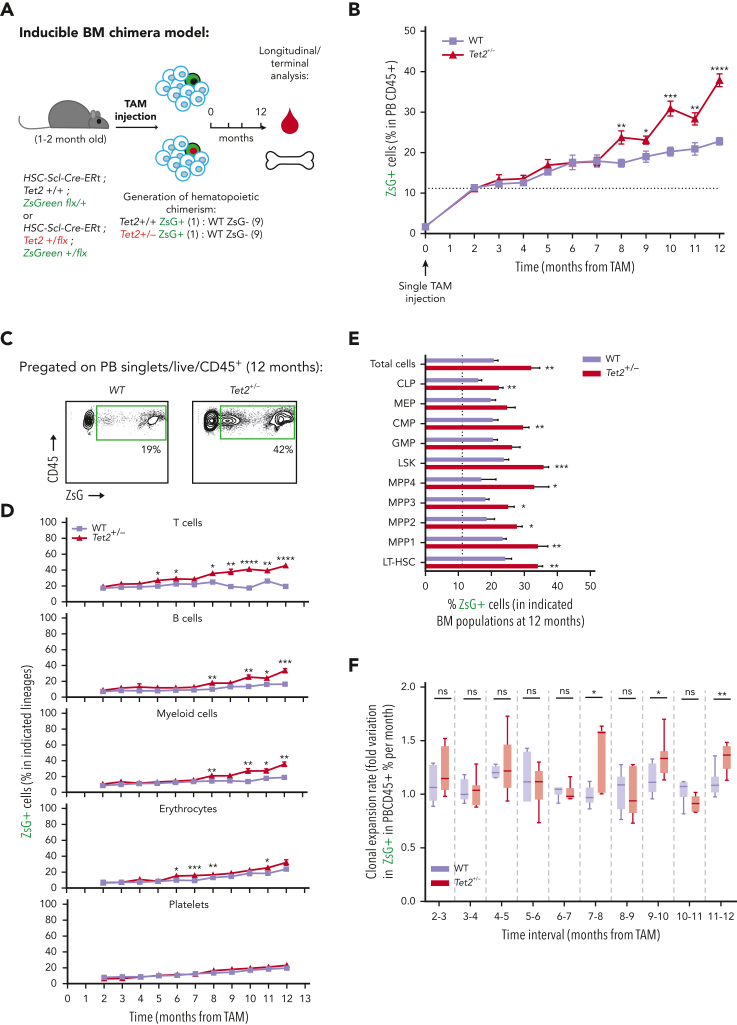
- In an inducible, transplantation-independent Tet2+/− mosaicism model, Tet2+/− clones expanded significantly more than WT clones during aging; the increase in monthly expansion rates became significant from 7 months onward, particularly at 7-8, 9-10, and 11-12 months, and occurred across T cells, B cells, myeloid cells, erythrocytes, and multiple HSPC populations.
- Aged Tet2+/− BM showed increased IL-1α/β and TNF-α gene expression, increased IL-1α protein, and a positive correlation between BM Tet2+/− clonal size and IL-1α concentration; Tet2+/− myeloid cells were the main IL-1α producers, especially after LPS exposure.
- IL-1α exposure for 14 days in young mice significantly increased the Tet2+/− clonal fraction in PB and HSPCs, whereas Tet2+/−; Il1r1−/− cells showed no expansion; IL-1β had a similar but lower-magnitude effect. Genetic IL-1R1 ablation completely abrogated Tet2+/− expansion in transplantation chimeras, and anakinra reduced PB Tet2+/− clonal expansion but did not fully prevent HSPC clonal expansion.
- RNA-seq of HSCs after IL-1α showed 318 DEGs unique to Tet2+/− HSCs, 221 unique to WT HSCs, and 515 shared; Tet2+/− HSCs were enriched for DNA replication, cell cycle progression, and DNA repair pathways, while 9 self-renewal genes (e.g., Mecom, Hmox1, Plag1) were downregulated exclusively in IL-1α–treated WT HSCs.
Methods
- Used triple-transgenic mice (HSC-SCL-Cre-ERT; Tet2+/flox; R26+/tm6(CAG-ZsGreen1)Hze) and WT controls, with tamoxifen titration to generate about 10% or ≈2% ZsG+ clonal fractions; mice were aged up to 12 or 28 months, exposed to IL-1α/IL-1β, or treated with anakinra (37 μg/mouse every other day from 11 to 13 months).
- Also used BM transplantation chimeras, including 90:10 and 50:50 competition settings, with WT, Tet2+/−, Il1r1−/−, and Tet2+/−; Il1r1−/− donor cells.
- Main assays included flow cytometry for PB/BM lineages and HSPCs, cell cycle analysis, methylcellulose colony-forming/replating assays, bulk RNA-seq of HSCs, and statistics by Student t-test or 2-way ANOVA with Tukey correction in Prism v8.
Limitations
- Stated: the exact molecular mechanisms by which Tet2+/− HSCs show differential differentiating and self-renewing proliferative responses to IL-1 remain to be elucidated; whether IL-1 dependency is exclusive to TET2-mutant AML remains to be determined; and whether additional age-associated mutations such as FLT3 synergize with Tet2 loss and IL-1R1 remains to be determined.
- Stated: the anakinra regimen used did not fully prevent Tet2+/− HSPC clonal expansion, suggesting the dose and timing were insufficient to revert established clonal dominance; reversion may require combination therapy.
- Evident from the text: the causal experiments are in murine models, with human relevance inferred from cited CHIP and canakinumab data rather than directly tested here; the inducible model also showed ZsG leakiness up to 2.5% at 10 months, and transplantation models had an early post-irradiation expansion phase not seen in the inducible model.
Model-written summary. Check it against the paper before relying on it.
Integrity signals
Registry
Cites
Statistics
Figures
Verification
Claims the paper makes
58 Own result · 27 Own interpretation · 20 Partly supported · 7 Own method · 6 Supported · 4 Supported so far · 2 No basis given · 1 Mixed support · 1 Not supported · 1 No full text of the sources · accuracy not yet measured
The cited sources support only part of this claim — read each source’s verdict below.
In the paper
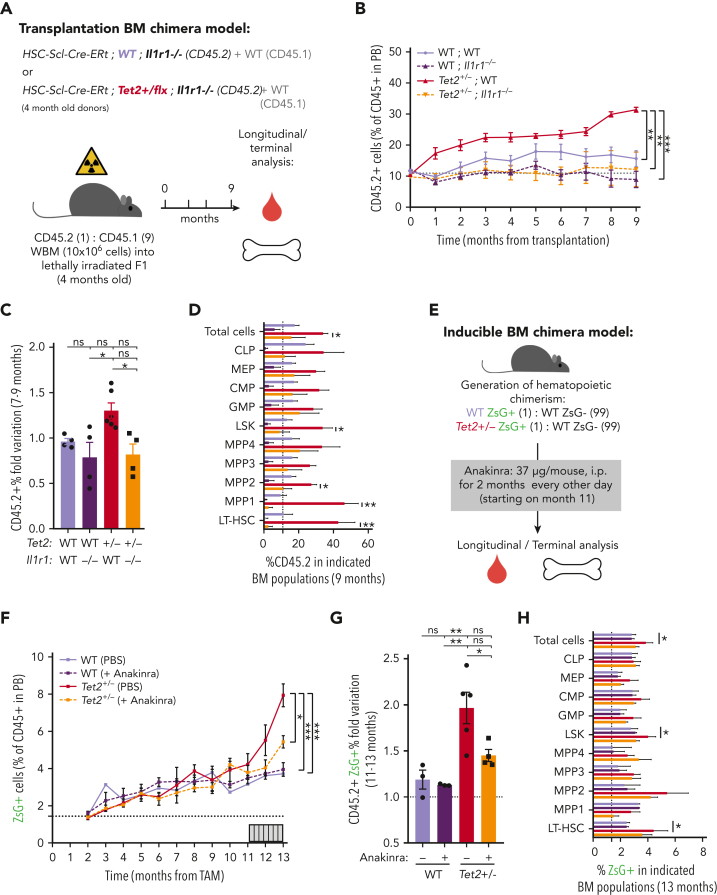
“As previously reported, we observed increased repopulating capacity in Tet2+/− PB CD45.2+ compared with WT in the PBS groups.11, 12, 13”
§ Aging drives Tet2+/− clonal hematopoiesis via IL-1 signaling > Results > Tet2+/− HSPCs maintain higher proliferative and repopulation capacity than WT in response to long-term IL-1α
What the sources say
- Not checked — no full text of the sourcecites [11] Ko, 2011, Ten-eleven-translocation 2 (TET2) negatively regulates homeostasis and differentiation of hematopoietic stem cells in mice, Proc Natl Acad Sci U S A source
- Partly supportedcites [12] Moran-Crusio, 2011, Tet2 loss leads to increased hematopoietic stem cell self-renewal and myeloid transformation, Cancer Cell sourceExperimental — accuracy not yet measured
The Results section, “Tet2 haploinsufficiency is sufficient to initiate aberrant hematopoiesis in vitro and in vivo” (page not supplied), reports that Tet2+/− cells outcompeted wild-type cells in competitive reconstitution experiments, supporting the increased repopulating-capacity comparison. The Bone marrow transplantation procedures identify heterozygous and wild-type cells as CD45.2+, but describe polyI-polyC-induced deletion, not a PBS-treated comparison group. PBS appears there as a cell-preparation buffer, so the PBS-group qualifier is not supported by this copy. (LLM, conf=0.88)
- Not checked — no full text of the sourcecites [13] Quivoron, 2011, TET2 inactivation results in pleiotropic hematopoietic abnormalities in mouse and is a recurrent event during human lymphomagenesis, Cancer Cell source
plaincorrelational- Asserted: passes — The authors put it forward as true.
- Checkable: passes — It can be checked against evidence.
- Load-bearing: passes — The paper’s conclusions depend on it.
- Based: passes — The paper gives a reason why it holds.
The cited sources support only part of this claim — read each source’s verdict below.
In the paper
“Moreover, Tet2-deficient HSPCs maintain a repopulation advantage after exposure to bacterial lipopolysaccharides (LPSs), due to increased resistance to IL-6–mediated apoptosis,16”
§ Aging drives Tet2+/− clonal hematopoiesis via IL-1 signaling > Introduction
What the sources say
- Partly supportedcites [16] Cai, 2018, Inhibition of inflammatory signaling in Tet2 mutant preleukemic cells mitigates stress-induced abnormalities and clonal hematopoiesis, Cell Stem Cell sourceExperimental — accuracy not yet measured
The Results section on repopulating activity (page unavailable) reports that Tet2-KO HSPCs maintain greater engraftment than wild-type cells after LPS challenge; the apoptosis Results section reports less apoptosis in Tet2-KO cells after LPS. But the IL-6 experiments report reduced apoptosis of Tet2-KO cells in the presence of IL-6, not resistance to apoptosis mediated by IL-6. The claim’s proposed mechanism therefore misstates what the paper shows. (LLM, conf=0.88)
plaindirect- Asserted: passes — The authors put it forward as true.
- Checkable: passes — It can be checked against evidence.
- Load-bearing: passes — The paper’s conclusions depend on it.
- Based: passes — The paper gives a reason why it holds.
- Partly supported
Every source the paper cites for this claim was checked and supports it.
In the paper
“Indeed, Tet2-deficient HSPCs show enhanced proliferation and differentiation in response to microbial-induced interleukin-6 (IL-6)14 and in response to tumor necrosis factor-α (TNF-α).15”
§ Aging drives Tet2+/− clonal hematopoiesis via IL-1 signaling > Introduction
What the sources say
- Supportedcites [14] Meisel, 2018, Microbial signals drive pre-leukaemic myeloproliferation in a Tet2-deficient host, Nature source
The Extended Data Fig. 10r model states that microbial-induced IL-6 is sensed by Tet2-deficient myeloid progenitors, which then expand and preferentially differentiate into mature myeloid cells. The paper also reports increased IL-6 sensitivity in Tet2-deficient progenitors and microbiota-dependent expansion of those cells. (LLM, conf=0.93)
plaindirect- Asserted: passes — The authors put it forward as true.
- Checkable: passes — It can be checked against evidence.
- Load-bearing: passes — The paper’s conclusions depend on it.
- Based: passes — The paper gives a reason why it holds.
- Supported
The cited sources support only part of this claim — read each source’s verdict below.
In the paper
“Currently, most CHIP mouse models rely on BM transplantation following high-dose irradiation and inevitably increased inflammatory milieus.16,24,39”
§ Aging drives Tet2+/− clonal hematopoiesis via IL-1 signaling > Discussion
What the sources say
- Partly supportedcites [16] Cai, 2018, Inhibition of inflammatory signaling in Tet2 mutant preleukemic cells mitigates stress-induced abnormalities and clonal hematopoiesis, Cell Stem Cell sourceExperimental — accuracy not yet measured
The STAR*METHODS Method Details section (page not supplied) says this paper’s bone-marrow transplantation recipients were lethally irradiated before transplantation, supporting the claim for this model. The paper does not establish that most CHIP mouse models use this approach or that irradiation inevitably increases the inflammatory milieu. (LLM, conf=0.85)
- Partly supportedcites [24] Fuster, 2017, Clonal hematopoiesis associated with TET2 deficiency accelerates atherosclerosis development in mice, Science sourceExperimental — accuracy not yet measured
The passage labeled Abstract (page not provided) describes this CHIP mouse model using bone marrow transplantation into lethally irradiated recipients. It does not establish that most CHIP mouse models use this approach or that irradiation inevitably increases the inflammatory milieu; its inflammatory findings concern TET2 deficiency. (LLM, conf=0.87)
- Partly supportedcites [39] Sano, 2018, Tet2-mediated clonal hematopoiesis accelerates heart failure through a mechanism involving the IL-1β/NLRP3 inflammasome, J Am Coll Cardiol sourceExperimental — accuracy not yet measured
The Results describe this paper’s CHIP model as bone-marrow transplantation into lethally irradiated mice. They do not establish that most CHIP mouse models use this approach or that irradiation inevitably increases the inflammatory milieu; the reported inflammatory changes were measured after myocardial infarction in Tet2-deficient mice relative to transplanted controls. The Methods also describe a conditional myeloid-restricted model. (LLM, conf=0.86)
plaindirect- Asserted: passes — The authors put it forward as true.
- Checkable: passes — It can be checked against evidence.
- Load-bearing: passes — The paper’s conclusions depend on it.
- Based: passes — The paper gives a reason why it holds.
- Partly supported
The cited sources support only part of this claim — read each source’s verdict below.
In the paper
“Increased IL-1 BM level, produced by different cellular sources, is a hallmark of hematopoietic inflammaging in mice.21,22,42”
§ Aging drives Tet2+/− clonal hematopoiesis via IL-1 signaling > Discussion
What the sources say
- Supportedcites [21] Frisch, 2019, Aged marrow macrophages expand platelet-biased hematopoietic stem cells via interleukin-1B, JCI Insight source
The section on aged marrow macrophages reports higher IL-1B in the marrow of aged mice than in young mice. The section on potential sources identifies macrophages and neutrophils as potential sources of that increase. The copy provides section labels but no page numbers. (LLM, conf=0.93)
- Partly supportedcites [22] Pioli, 2019, Plasma cells are obligate effectors of enhanced myelopoiesis in aging bone marrow, Immunity sourceExperimental — accuracy not yet measured
The Discussion reports an age-dependent increase in Il1b expression in bone-marrow stroma and identifies plasma cells as another potential IL-1 source in old mice. This supports the link between IL-1 and hematopoietic inflammaging, but the cited passages do not establish an increased IL-1 protein level in bone marrow. (LLM, conf=0.83)
- Partly supportedcites [42] Helbling, 2019, Global transcriptomic profiling of the bone marrow stromal microenvironment during postnatal development, aging, and inflammation, Cell Rep sourceExperimental — accuracy not yet measured
The ‘Increased Pro-inflammatory Signatures in Aged BM Stroma’ section reports increased Il1b expression in bone marrow stromal cells of aged mice and an enhanced inflammatory milieu. It does not establish increased IL-1 protein levels throughout the bone marrow or show production by different cellular sources. (LLM, conf=0.86)
plaincorrelational- Asserted: passes — The authors put it forward as true.
- Checkable: passes — It can be checked against evidence.
- Load-bearing: passes — The paper’s conclusions depend on it.
- Based: passes — The paper gives a reason why it holds.
- Supported
The cited sources support only part of this claim — read each source’s verdict below.
In the paper
“canakinumab, an IL-1β blocker, was particularly effective in reducing cardiovascular events in patients carrying hematopoietic TET2 mutations”
§ Aging drives Tet2+/− clonal hematopoiesis via IL-1 signaling > Discussion
What the sources say
- Partly supportedcites [58] Svensson, 2022, TET2-driven clonal hematopoiesis and response to canakinumab: An exploratory analysis of the CANTOS randomized clinical trial, JAMA Cardiol sourceExperimental — accuracy not yet measured
The ‘Patients With CHIP Who Have Somatic Variants in TET2 and Response to Canakinumab’ section (page not provided) reports a 62% relative reduction in major adverse cardiovascular events among canakinumab-treated patients with TET2 variants. However, the difference between groups was not statistically significant in the interaction analysis, and the Conclusions say only that these patients may respond better. ‘Particularly effective’ states that comparative benefit more firmly than the paper does. (LLM, conf=0.88)
plaindirect- Asserted: passes — The authors put it forward as true.
- Checkable: passes — It can be checked against evidence.
- Load-bearing: unclear — It is unclear whether the paper’s conclusions depend on it.
- Based: passes — The paper gives a reason why it holds.
- Partly supported
Every source the paper cites for this claim was checked and supports it.
In the paper
“thus in parallel validating our mouse model findings of IL-1 as a likely relevant inflammatory determinant of TET2 CHIP in the human population.44”
§ Aging drives Tet2+/− clonal hematopoiesis via IL-1 signaling > Discussion
What the sources say
- Supportedcites [44] Bick, 2020, Inherited causes of clonal haematopoiesis in 97,691 whole genomes, Nature source
The CHIP phenotypic associations section reports that human carriers of TET2 CHIP had increased IL-1β (p=2.4 × 10⁻⁴). The citing authors’ statement that this finding validates their mouse model is their interpretation; the cited paper supplies the human association. (LLM, conf=0.89)
hedgedconditional- Asserted: passes — The authors put it forward as true.
- Checkable: passes — It can be checked against evidence.
- Load-bearing: passes — The paper’s conclusions depend on it.
- Based: passes — The paper gives a reason why it holds.
- Supported
The cited sources support only part of this claim — read each source’s verdict below.
In the paper
“hematological malignancies that frequently carry TET2 founding mutations, such as MDS and AML, display dependencies on IL-1 signaling.53, 54, 55”
§ Aging drives Tet2+/− clonal hematopoiesis via IL-1 signaling > Discussion
What the sources say
- Not checked — no full text of the sourcecites [53] Barreyro, 2012, Overexpression of IL-1 receptor accessory protein in stem and progenitor cells and outcome correlation in AML and MDS, Blood source
- Not checked — no full text of the sourcecites [54] Turzanski, 2004, Interleukin-1β maintains an apoptosis-resistant phenotype in the blast cells of acute myeloid leukaemia via multiple pathways, Leukemia source
- Partly supportedcites [55] Carey, 2017, Identification of interleukin-1 by functional screening as a key mediator of cellular expansion and disease progression in acute myeloid leukemia, Cell Rep sourceExperimental — accuracy not yet measured
The Results section ('Absence of IL-1 receptor attenuates the expansion of AML cells in vitro and disease progression in vivo'; page unavailable) reports that IL-1-sensitive AML samples depended on IL-1 receptors for survival. The paper does not establish an IL-1-signaling dependency in MDS or link that dependency to TET2 founding mutations; its AML finding is limited to a subset of samples. (LLM, conf=0.86)
plaincorrelational- Asserted: passes — The authors put it forward as true.
- Checkable: passes — It can be checked against evidence.
- Load-bearing: unclear — It is unclear whether the paper’s conclusions depend on it.
- Based: passes — The paper gives a reason why it holds.
The cited sources support only part of this claim — read each source’s verdict below.
In the paper
“It results, as demonstrated by us recently, partially from hematopoietic sensing of increased circulating levels of microbiota derived TLR4 and TLR8 agonists upon aging.23”
§ Aging drives Tet2+/− clonal hematopoiesis via IL-1 signaling > Discussion
What the sources say
- Partly supportedcites [23] Kovtonyuk, 2022, IL-1 mediates microbiome-induced inflammaging of hematopoietic stem cells in mice, Blood sourceExperimental — accuracy not yet measured
The results section reports increased circulating TLR4 and TLR8 ligands in older mice, while experiments show that older bone-marrow cells produce more IL-1 in response to the TLR4 agonist LPS. The paper does not demonstrate that sensing the increased TLR8 ligands contributes to the age-related rise in bone-marrow IL-1; its tested TLR7/8 agonist induced IL-1 less strongly than LPS. Page numbers are not available in our copy. (LLM, conf=0.84)
boostedconditional- Asserted: passes — The authors put it forward as true.
- Checkable: passes — It can be checked against evidence.
- Load-bearing: unclear — It is unclear whether the paper’s conclusions depend on it.
- Based: passes — The paper gives a reason why it holds.
- Partly supported
The cited sources support only part of this claim — read each source’s verdict below.
In the paper
“a recent screen for inflammatory markers in up to 22 092 individuals with CHIP revealed that increased IL-1β circulating levels associate significantly and exclusively with TET2 mutant CHIP”
§ Aging drives Tet2+/− clonal hematopoiesis via IL-1 signaling > Discussion
What the sources say
- Partly supportedcites [44] Bick, 2020, Inherited causes of clonal haematopoiesis in 97,691 whole genomes, Nature sourceExperimental — accuracy not yet measured
The CHIP phenotypic associations section reports that TET2 CHIP was associated with increased IL-1β (p=2.4 × 10⁻⁴) in a human inflammatory-profile analysis. The paper contrasts this with IL-18 associations for JAK2 and SF3B1 CHIP, but does not establish that the IL-1β association is exclusive to TET2; the stated sample size of up to 22,092 was also not verified in the retrieved passages. No page number is available in our copy. (LLM, conf=0.86)
plaincorrelational- Asserted: passes — The authors put it forward as true.
- Checkable: passes — It can be checked against evidence.
- Load-bearing: unclear — It is unclear whether the paper’s conclusions depend on it.
- Based: passes — The paper gives a reason why it holds.
- Partly supported
- Probably not a substantial claim. 18
- It may state two separate claims as one. 40
At least one cited source doesn’t support this claim or points to a different paper, and none confirmed it — see the verdicts below.
In the paper
“Moreover, TET2 mutations are the most frequent single-gene mutations in myelodysplastic syndrome (MDS), an age-related hematopoietic stem and progenitor cell (HSPC) disease.9”
§ Aging drives Tet2+/− clonal hematopoiesis via IL-1 signaling > Introduction
What the sources say
- Disputedcites [9] Nazha, 2021, Personalized prediction model to risk stratify patients with myelodysplastic syndromes, J Clin Oncol sourceExperimental — accuracy not yet measured
The mutation table in the indexed copy (section labeled “Validations of the New Model in Different Settings”; page unavailable) lists SF3B1 in 369 patients and TET2 in 363. The paper identifies TET2 as commonly mutated, but its cohort data do not make it the most frequent single-gene mutation. (LLM, conf=0.86)
Checked by a reasoning model — may be wrong.
plain- Asserted: passes — The authors put it forward as true.
- Checkable: passes — It can be checked against evidence.
- Load-bearing: fails — The paper’s conclusions may not depend on it.
- Based: passes — The paper gives a reason why it holds.
Probably not a substantial claim. The paper’s conclusions may not depend on it.
- Disputed
Some cited sources support this claim and some don’t — read each source’s verdict below.
In the paper
“CHIP carriers have an about 13-fold increased risk of developing myeloid hematological malignancies and an increased risk of all-cause mortality, largely due to cardiovascular disease and stroke.1, 2, 3, 4”
§ Aging drives Tet2+/− clonal hematopoiesis via IL-1 signaling > Introduction
What the sources say
- Disputedcites [1] Genovese, 2014, Clonal hematopoiesis and blood-cancer risk inferred from blood DNA sequence, N Engl J Med sourceExperimental — accuracy not yet measured
The Results section reports increased all-cause mortality among participants with clonal hematopoiesis (hazard ratio, 1.4). But it says the reduced survival in this cohort was explained by cancer deaths and an association with smoking, contrary to the claim that it was largely due to cardiovascular disease and stroke. Page numbers are unavailable in our copy. (LLM, conf=0.88)
Checked by a reasoning model — may be wrong.
- Partly supportedcites [2] Jaiswal, 2014, Age-related clonal hematopoiesis associated with adverse outcomes, N Engl J Med sourceExperimental — accuracy not yet measured
The Results section on overall survival reports increased all-cause mortality and a higher risk of cardiovascular death among people with mutations. The cardiometabolic Results section reports increased incidence of ischemic stroke, but the Discussion says the excess mortality *may* be related to coronary heart disease and stroke. The paper does not establish that mortality was largely due to those conditions or identify stroke as a major cause of death. (LLM, conf=0.88)
- Could not verifycites [3] Xie, 2014, Age-related mutations associated with clonal hematopoietic expansion and malignancies, Nat Med sourceExperimental — accuracy not yet measured
The Results section on cancer types and sample characteristics notes that 22.1% of participants were deceased at sample procurement, but does not compare mortality in carriers and noncarriers. Searches for all-cause mortality, cardiovascular disease, stroke, and survival found no passage addressing the attributed risk or causes of death. (LLM, conf=0.76)
- Supportedcites [4] Jaiswal, 2019, Clonal haematopoiesis: connecting ageing and inflammation in cardiovascular disease, Nat Rev Cardiol source
The Clinical associations of CHIP section reports increased all-cause mortality among CHIP carriers and says the excess deaths reflected higher rates of fatal strokes and heart attacks, rather than haematological malignancies. This supports the attributed claim. (LLM, conf=0.94)
plaindirect- Asserted: passes — The authors put it forward as true.
- Checkable: passes — It can be checked against evidence.
- Load-bearing: fails — The paper’s conclusions may not depend on it.
- Based: passes — The paper gives a reason why it holds.
Probably not a substantial claim. The paper’s conclusions may not depend on it.
- Disputed
The cited sources support only part of this claim — read each source’s verdict below.
In the paper
“CHIP carriers have an about 13-fold increased risk of developing myeloid hematological malignancies and an increased risk of all-cause mortality, largely due to cardiovascular disease and stroke.1, 2, 3, 4”
§ Aging drives Tet2+/− clonal hematopoiesis via IL-1 signaling > Introduction
What the sources say
- Partly supportedcites [1] Genovese, 2014, Clonal hematopoiesis and blood-cancer risk inferred from blood DNA sequence, N Engl J Med sourceExperimental — accuracy not yet measured
The Results section ('Clonal Hematopoiesis and Subsequent Hematologic Cancer and Death'; page not provided) reports a hazard ratio of 12.9 for subsequent hematologic cancer in participants with clonal hematopoiesis. That supports the approximately 13-fold figure, but the estimate is for hematologic cancers overall, not specifically myeloid malignancies. (LLM, conf=0.86)
- Partly supportedcites [2] Jaiswal, 2014, Age-related clonal hematopoiesis associated with adverse outcomes, N Engl J Med sourceExperimental — accuracy not yet measured
The Results section (“Association of Somatic Mutations with the Risk of Hematologic Cancer”; page not provided) reports an 11.1-fold higher risk in people with detectable mutations. It does not report a 13-fold estimate specifically for myeloid malignancies; its estimate covers hematologic cancers more broadly. (LLM, conf=0.88)
- Partly supportedcites [3] Xie, 2014, Age-related mutations associated with clonal hematopoietic expansion and malignancies, Nat Med sourceExperimental — accuracy not yet measured
The Discussion (page not provided) says clonal hematopoietic changes may contribute to hematologic malignancies, but it does not report a 13-fold risk. It explicitly says the researchers could not determine whether participants with leukemia-associated mutations later developed a malignant hematologic disease. (LLM, conf=0.85)
- Partly supportedcites [4] Jaiswal, 2019, Clonal haematopoiesis: connecting ageing and inflammation in cardiovascular disease, Nat Rev Cardiol sourceExperimental — accuracy not yet measured
The Clinical associations of CHIP section reports an approximately tenfold increased risk of haematological cancer in CHIP carriers and says most cancers that develop are myeloid. It does not report a 13-fold estimate specifically for myeloid malignancies. (LLM, conf=0.88)
plaindirect- Asserted: passes — The authors put it forward as true.
- Checkable: passes — It can be checked against evidence.
- Load-bearing: fails — The paper’s conclusions may not depend on it.
- Based: passes — The paper gives a reason why it holds.
Probably not a substantial claim. The paper’s conclusions may not depend on it.
- Partly supported
The cited sources support only part of this claim — read each source’s verdict below.
In the paper
“Loss-of-function heterozygous mutations in epigenetic regulators DNMT3A (cytosine methyltransferase) and TET2 (methylcytosine dioxygenase) are the most frequently detected mutations in CHIP, accounting for about 50% to 60% and 10% to 30% of mutations found in CHIP carriers, respectively.1, 2, 3,7,8”
§ Aging drives Tet2+/− clonal hematopoiesis via IL-1 signaling > Introduction
What the sources say
- Partly supportedcites [1] Genovese, 2014, Clonal hematopoiesis and blood-cancer risk inferred from blood DNA sequence, N Engl J Med sourceExperimental — accuracy not yet measured
The Results section (page unavailable) reports 31 TET2 mutations among 327 candidate driver mutations in participants with clonal hematopoiesis—about 9.5%, consistent with the claim’s approximate lower bound. It describes TET2 mutations as tending to disrupt protein-coding sequences, but does not establish that all 31 were loss-of-function heterozygous mutations or support a proportion approaching 30%. (LLM, conf=0.84)
- Partly supportedcites [2] Jaiswal, 2014, Age-related clonal hematopoiesis associated with adverse outcomes, N Engl J Med sourceExperimental — accuracy not yet measured
The Results section reports 72 TET2 variants among 805 detected mutations—about 9%—and cautions that TET2 mutations were probably undercounted because only about half the coding region was captured. It supports TET2 as a frequently mutated gene in clonal hematopoiesis, but does not establish a 10%–30% share or identify those variants collectively as heterozygous loss-of-function mutations. The indexed copy provides no page numbers for these passages. (LLM, conf=0.86)
- Partly supportedcites [3] Xie, 2014, Age-related mutations associated with clonal hematopoietic expansion and malignancies, Nat Med sourceExperimental — accuracy not yet measured
The Results (page unavailable) report TET2 mutations in 9 of 58 cases with blood-specific mutations, a proportion within the claimed 10%–30% range, and give examples of TET2 frameshift and nonsense mutations. However, the paper does not establish that all TET2 mutations counted were heterozygous loss-of-function mutations, so it does not support that more specific percentage claim. (LLM, conf=0.83)
- Partly supportedcites [7] Buscarlet, 2017, DNMT3A and TET2 dominate clonal hematopoiesis and demonstrate benign phenotypes and different genetic predispositions, Blood sourceExperimental — accuracy not yet measured
The Prevalence of mutations section identifies TET2 as one of the most frequently affected genes, but reports 33.3% (134/402) of documented mutations, above the claimed 10%–30% range. The Type of mutations section lists truncating and other TET2 variants, but does not establish that heterozygous loss-of-function TET2 mutations account for the claimed proportion. Page numbers are unavailable in our copy. (LLM, conf=0.86)
- Partly supportedcites [8] Fabre, 2022, The longitudinal dynamics and natural history of clonal haematopoiesis, Nature sourceExperimental — accuracy not yet measured
The Mutational landscape of clonal haematopoiesis section says TET2 and DNMT3A mutations were the most common in the studied cohort. It does not give the claimed 10%–30% share for TET2 mutations in CHIP carriers or establish that those mutations were heterozygous loss-of-function mutations. The Determinants of clonal growth rate section discusses truncating and missense TET2 mutations but does not establish those qualifiers or the percentage. (LLM, conf=0.83)
plaincorrelational- Asserted: passes — The authors put it forward as true.
- Checkable: passes — It can be checked against evidence.
- Load-bearing: fails — The paper’s conclusions may not depend on it.
- Based: passes — The paper gives a reason why it holds.
Probably not a substantial claim. The paper’s conclusions may not depend on it.
- Partly supported
The sources with a verdict support this claim; the rest weren’t checked yet, have no full text we could read, or their verdicts aren’t rated yet.
In the paper
“Indeed, Tet2 loss of function in murine HSPCs leads to increased self-renewal and pool expansion, higher competitive repopulation capacity, and a predisposition to hematological malignancy development.11, 12, 13”
§ Aging drives Tet2+/− clonal hematopoiesis via IL-1 signaling > Introduction
What the sources say
- Not checked — no full text of the sourcecites [11] Ko, 2011, Ten-eleven-translocation 2 (TET2) negatively regulates homeostasis and differentiation of hematopoietic stem cells in mice, Proc Natl Acad Sci U S A source
- Supportedcites [12] Moran-Crusio, 2011, Tet2 loss leads to increased hematopoietic stem cell self-renewal and myeloid transformation, Cancer Cell source
The Results section reports expansion of the stem-cell compartment, increased self-renewal, and Tet2-deficient HSCs outcompeting wild-type cells in competitive transplants. It also reports progressive myeloproliferation in Tet2-deficient mice with features resembling human CMML, supporting the stated predisposition to hematologic malignancy. Page numbers are unavailable in our copy. (LLM, conf=0.93)
- Not checked — no full text of the sourcecites [13] Quivoron, 2011, TET2 inactivation results in pleiotropic hematopoietic abnormalities in mouse and is a recurrent event during human lymphomagenesis, Cancer Cell source
plaindirect- Asserted: passes — The authors put it forward as true.
- Checkable: passes — It can be checked against evidence.
- Load-bearing: passes — The paper’s conclusions depend on it.
- Based: passes — The paper gives a reason why it holds.
It may state two separate claims as one.
The cited sources support only part of this claim — read each source’s verdict below.
In the paper
“More important, advanced age is the best predictor of CHIP, with a 5.6% or 18.4% prevalence in the sixth or ninth decade of life, respectively.2”
§ Aging drives Tet2+/− clonal hematopoiesis via IL-1 signaling > Introduction
What the sources say
- Partly supportedcites [2] Jaiswal, 2014, Age-related clonal hematopoiesis associated with adverse outcomes, N Engl J Med sourceExperimental — accuracy not yet measured
The Results section, “Increase in the Frequency of Clonal Somatic Mutations with Age” (page not provided), reports that mutations become more frequent with age and gives the cited percentages. But 5.6% applies to ages 60–69 and 18.4% to ages 90 and older—not the sixth and ninth decades of life, respectively. The passage also does not establish that age is the best predictor relative to other factors. (LLM, conf=0.88)
plaincorrelational- Asserted: passes — The authors put it forward as true.
- Checkable: passes — It can be checked against evidence.
- Load-bearing: fails — The paper’s conclusions may not depend on it.
- Based: passes — The paper gives a reason why it holds.
Probably not a substantial claim. The paper’s conclusions may not depend on it. It may state two separate claims as one.
- Partly supported
Every source the paper cites for this claim was checked and supports it.
In the paper
“Given the contribution of IL-1 to inflammaging and its detrimental impacts on WT HSC function,23,28 we further focused on the IL-1 pathway.”
§ Aging drives Tet2+/− clonal hematopoiesis via IL-1 signaling > Results > Increased Tet2+/− clonal expansion rates associate with high BM IL-1 levels on aging
What the sources say
- Supportedcites [23] Kovtonyuk, 2022, IL-1 mediates microbiome-induced inflammaging of hematopoietic stem cells in mice, Blood source
The transplantation-results section reports that older WT HSCs produced myeloid-biased output, whereas older IL-1R1KO HSCs retained balanced or lymphoid-biased output. This supports a detrimental effect of IL-1 signaling on WT HSC differentiation function; the paper does not find a significant effect on engraftment or repopulation. (LLM, conf=0.88)
- Supportedcites [28] Pietras, 2016, Chronic interleukin-1 exposure drives haematopoietic stem cells towards precocious myeloid differentiation at the expense of self-renewal, Nat Cell Biol source
The Results section (‘Chronic IL-1 exposure impairs HSC function’) reports reduced self-renewal and regenerative function in IL-1-treated HSCs. The Discussion likewise states that chronic IL-1 exposure significantly impairs HSC function; the detrimental effect is specifically associated with chronic exposure, not acute stimulation. (LLM, conf=0.90)
plaindirect- Asserted: passes — The authors put it forward as true.
- Checkable: passes — It can be checked against evidence.
- Load-bearing: passes — The paper’s conclusions depend on it.
- Based: passes — The paper gives a reason why it holds.
Probably not a substantial claim.
- Supported
The sources with a verdict support this claim; the rest weren’t checked yet, have no full text we could read, or their verdicts aren’t rated yet.
In the paper
“Aging associates with chronic low-grade inflammation (ie, inflammaging).18,19”
§ Aging drives Tet2+/− clonal hematopoiesis via IL-1 signaling > Introduction
What the sources say
- Not checked — no full text of the sourcecites [18] Franceschi, 2000, Inflamm-aging: an evolutionary perspective on immunosenescence, Ann N Y Acad Sci source
- Supportedcites [19] Kovtonyuk, 2016, Inflamm-aging of hematopoiesis, hematopoietic stem cells, and the bone marrow microenvironment, Front Immunol source
The “Aging-Associated Inflammation: ‘Inflamm-Aging’” section (page not provided) describes increased inflammatory markers in healthy elderly people and defines inflamm-aging as a subclinical grade of chronic inflammation. This supports the citing sentence’s association between aging and chronic low-grade inflammation. (LLM, conf=0.93)
plaincorrelational- Asserted: passes — The authors put it forward as true.
- Checkable: passes — It can be checked against evidence.
- Load-bearing: passes — The paper’s conclusions depend on it.
- Based: passes — The paper gives a reason why it holds.
Probably not a substantial claim.
Every source the paper cites for this claim was checked and supports it.
In the paper
“HSPC divisions can be differentiating and self-renewing, particularly in less committed populations.29”
§ Aging drives Tet2+/− clonal hematopoiesis via IL-1 signaling > Results > Tet2+/− HSPCs maintain higher proliferative and repopulation capacity than WT in response to long-term IL-1α
What the sources say
- Supportedcites [29] Wilkinson, 2020, Haematopoietic stem cell self-renewal in vivo and ex vivo, Nat Rev Genet source
The ‘Identification of self-renewing HSCs’ section describes both self-renewing and differentiating HSC divisions. Its ‘HSC transplantation assay’ subsection contrasts the potent self-renewal of long-term HSCs with the limited reconstitution capacity of progenitor cells, supporting the emphasis on less committed populations. Page numbers were not available in our copy. (LLM, conf=0.88)
plain- Asserted: passes — The authors put it forward as true.
- Checkable: passes — It can be checked against evidence.
- Load-bearing: passes — The paper’s conclusions depend on it.
- Based: passes — The paper gives a reason why it holds.
Probably not a substantial claim.
- Supported
The cited sources support only part of this claim — read each source’s verdict below.
In the paper
“Furthermore, progression to hematological malignancies depends on the type and complexity of mutations in CHIP.2,5,6”
§ Aging drives Tet2+/− clonal hematopoiesis via IL-1 signaling > Introduction
What the sources say
- Partly supportedcites [2] Jaiswal, 2014, Age-related clonal hematopoiesis associated with adverse outcomes, N Engl J Med sourceExperimental — accuracy not yet measured
The Results sections on mutation frequency and hematologic-cancer risk report that clonal hematopoiesis usually involved one detected mutation, whereas hematologic cancers often have multiple driver mutations; they also link detectable mutations to higher cancer risk. The paper does not establish that progression depends on mutation type or complexity: its reported risk comparisons concern mutation presence and variant allele fraction, and it could not assess whether later tumors arose from the preceding mutant clones. Page numbers were not available in our copy. (LLM, conf=0.84)
- Partly supportedcites [5] Abelson, 2018, Prediction of acute myeloid leukaemia risk in healthy individuals, Nature sourceExperimental — accuracy not yet measured
The Abstract reports that particular mutated genes and the number of mutations affect progression risk, supporting the claim for acute myeloid leukaemia (AML). It does not establish the same relationship for haematological malignancies generally; the study’s stated outcome is progression to AML. No page number is supplied for the passage. (LLM, conf=0.86)
- Partly supportedcites [6] Desai, 2018, Somatic mutations precede acute myeloid leukemia years before diagnosis, Nat Med sourceExperimental — accuracy not yet measured
The Discussion reports that mutation type, high allelic fractions, and clonal complexity are associated with higher risk of progression to AML; the baseline-mutations section also reports different AML risks for different mutated genes. The study addresses AML specifically, not hematological malignancies generally, and reports associations rather than establishing that progression depends on these features. (LLM, conf=0.86)
plaindirect- Asserted: passes — The authors put it forward as true.
- Checkable: passes — It can be checked against evidence.
- Load-bearing: fails — The paper’s conclusions may not depend on it.
- Based: passes — The paper gives a reason why it holds.
Probably not a substantial claim. The paper’s conclusions may not depend on it.
- Partly supported
The cited sources support only part of this claim — read each source’s verdict below.
In the paper
“Loss-of-function heterozygous mutations in epigenetic regulators DNMT3A (cytosine methyltransferase) and TET2 (methylcytosine dioxygenase) are the most frequently detected mutations in CHIP, accounting for about 50% to 60% and 10% to 30% of mutations found in CHIP carriers, respectively.1, 2, 3,7,8”
§ Aging drives Tet2+/− clonal hematopoiesis via IL-1 signaling > Introduction
What the sources say
- Partly supportedcites [1] Genovese, 2014, Clonal hematopoiesis and blood-cancer risk inferred from blood DNA sequence, N Engl J Med sourceExperimental — accuracy not yet measured
The Results section reports 190 DNMT3A mutations among 327 candidate driver mutations in clonal hematopoiesis, or about 58%. But that count includes missense as well as disruptive mutations; the paper does not establish that 50%–60% were loss-of-function heterozygous DNMT3A mutations. Page numbers are unavailable in our copy. (LLM, conf=0.88)
- Partly supportedcites [2] Jaiswal, 2014, Age-related clonal hematopoiesis associated with adverse outcomes, N Engl J Med sourceExperimental — accuracy not yet measured
The Results (Identification of Candidate Somatic Mutations; Increase in the Frequency of Clonal Somatic Mutations with Age; page unavailable) report 403 DNMT3A variants among 805 mutations, or about 50%, and identify DNMT3A as the most commonly mutated gene. Our copy does not establish that those DNMT3A mutations were heterozygous loss-of-function mutations, so it does not support that qualification of the percentage. (LLM, conf=0.88)
- Partly supportedcites [3] Xie, 2014, Age-related mutations associated with clonal hematopoietic expansion and malignancies, Nat Med sourceExperimental — accuracy not yet measured
The Results section, “Variants contributing to hematopoietic clonal expansion” (page unavailable), identifies DNMT3A as a recurrently mutated gene, with mutations in 18 cases. But it reports 64 blood-specific mutations in hematological-malignancy-associated genes, making the DNMT3A share about 28%, not 50%–60%. The passages also do not establish that the DNMT3A mutations were heterozygous loss-of-function mutations. (LLM, conf=0.88)
- Partly supportedcites [7] Buscarlet, 2017, DNMT3A and TET2 dominate clonal hematopoiesis and demonstrate benign phenotypes and different genetic predispositions, Blood sourceExperimental — accuracy not yet measured
The ‘Prevalence of mutations’ section reports that DNMT3A accounts for 57.2% (230/402) of documented somatic mutations, supporting the approximate 50%–60% figure. But the ‘Type of mutations’ section includes 142 missense mutations among those 230; the paper does not establish that all mutations counted in the 57.2% are loss-of-function or heterozygous. Page numbers were not available in our copy. (LLM, conf=0.88)
- Partly supportedcites [8] Fabre, 2022, The longitudinal dynamics and natural history of clonal haematopoiesis, Nature sourceExperimental — accuracy not yet measured
The Mutational landscape section (page unavailable) says DNMT3A and TET2 were the most commonly mutated epigenetic regulator genes, and the Discussion (page unavailable) calls DNMT3A reportedly the most common clonal-haematopoiesis driver gene. Neither passage establishes that heterozygous loss-of-function DNMT3A mutations account for 50%–60% of mutations in CHIP carriers. (LLM, conf=0.86)
plaincorrelational- Asserted: passes — The authors put it forward as true.
- Checkable: passes — It can be checked against evidence.
- Load-bearing: fails — The paper’s conclusions may not depend on it.
- Based: passes — The paper gives a reason why it holds.
Probably not a substantial claim. The paper’s conclusions may not depend on it.
- Partly supported
The cited sources support only part of this claim — read each source’s verdict below.
In the paper
“and exhibit a toll-like receptor–TNF receptor associated factor 6A (TLR-TRAF6A) and noncanonical NF-κB–dependent competitive advantage during low-grade inflammation.17”
§ Aging drives Tet2+/− clonal hematopoiesis via IL-1 signaling > Introduction
What the sources say
- Partly supportedcites [17] Muto, 2020, Adaptive response to inflammation contributes to sustained myelopoiesis and confers a competitive advantage in myelodysplastic syndrome HSCs, Nat Immunol sourceExperimental — accuracy not yet measured
The Results section on TET2-deficient HSPCs (page unavailable) reports increased myeloid contribution after competitive transplantation under low-dose LPS, preservation of Tet2-deficient HSPCs, and TRAF6-dependent activation of noncanonical NF-κB. It does not establish that the competitive advantage of Tet2-deficient HSPCs itself depends on noncanonical NF-κB; the long-term competitive-advantage experiment in the separate TLR–TRAF6-primed HSPCs section used TRAF6-overexpressing cells. (LLM, conf=0.85)
plaindirect- Asserted: passes — The authors put it forward as true.
- Checkable: passes — It can be checked against evidence.
- Load-bearing: fails — The paper’s conclusions may not depend on it.
- Based: passes — The paper gives a reason why it holds.
Probably not a substantial claim. The paper’s conclusions may not depend on it.
- Partly supported
The cited sources support only part of this claim — read each source’s verdict below.
In the paper
“In the context of CHIP, TET2 mutations show highest clonal expansion rates over time (with an estimated 10% annual growth rate compared with 5% of DNMT3A mutations7,8,10).”
§ Aging drives Tet2+/− clonal hematopoiesis via IL-1 signaling > Introduction
What the sources say
- Partly supportedcites [7] Buscarlet, 2017, DNMT3A and TET2 dominate clonal hematopoiesis and demonstrate benign phenotypes and different genetic predispositions, Blood sourceExperimental — accuracy not yet measured
The 'Effect of DNMT3A and TET2 somatic mutations on clonal expansion' section reports an estimated 9.98% yearly increase in mean variant allele frequency (VAF) for TET2, compared with 3.95% for DNMT3A—not 5%. The Discussion explains that these estimates use age at sampling as a surrogate for growth because the cohort was not resampled over time. The paper suggests TET2 may expand faster than DNMT3A, but does not establish that it has the highest rate among all CHIP mutations. (LLM, conf=0.88)
- Partly supportedcites [8] Fabre, 2022, The longitudinal dynamics and natural history of clonal haematopoiesis, Nature sourceExperimental — accuracy not yet measured
The ‘Determinants of clonal growth rate’ section (page not provided) reports average annual growth of about 10% for TET2-mutant clones versus 5% for DNMT3A-mutant clones. It does not support calling TET2 the highest: SRSF2-, PTPN11- and U2AF1-mutant clones grew faster, at 15–20% per year on average. (LLM, conf=0.91)
- Not checked — no full text of the sourcecites [10] Watson, 2020, The evolutionary dynamics and fitness landscape of clonal hematopoiesis, Science source
hedgedcorrelational- Asserted: passes — The authors put it forward as true.
- Checkable: passes — It can be checked against evidence.
- Load-bearing: unclear — It is unclear whether the paper’s conclusions depend on it.
- Based: passes — The paper gives a reason why it holds.
It may state two separate claims as one.
- Partly supported
The cited sources support only part of this claim — read each source’s verdict below.
In the paper
“Although alternatives have been established via adoptive transfer of unfractionated BM cells into nonirradiated mice, these models are limited by a fixed availability of BM niche space and, thus, restricted starting clonal fractions.40,41”
§ Aging drives Tet2+/− clonal hematopoiesis via IL-1 signaling > Discussion
What the sources say
- Partly supportedcites [40] Wang, 2020, Tet2-mediated clonal hematopoiesis in nonconditioned mice accelerates age-associated cardiac dysfunction, JCI Insight sourceExperimental — accuracy not yet measured
The Results (p. 2) describe transfer of unfractionated bone marrow into nonirradiated mice and report low donor-cell engraftment compared with irradiated recipients. The Discussion (p. 8) likewise describes low but stable engraftment. These passages support limited donor contribution, but do not establish that fixed availability of bone marrow niche space causes restricted starting clonal fractions. (LLM, conf=0.82)
- Partly supportedcites [41] Fuster, 2020, TET2-loss-of-function-driven clonal hematopoiesis exacerbates experimental insulin resistance in aging and obesity, Cell Rep sourceExperimental — accuracy not yet measured
STAR★METHODS, Method Details (page unavailable), describes transfer of unfractionated bone marrow cells into nonirradiated mice. The Results on age-related insulin resistance (page unavailable) report a small initial donor-cell fraction, but neither passage attributes that fraction to fixed bone-marrow niche space or states that niche space restricts starting clonal fractions. (LLM, conf=0.84)
plaindirect- Asserted: passes — The authors put it forward as true.
- Checkable: passes — It can be checked against evidence.
- Load-bearing: passes — The paper’s conclusions depend on it.
- Based: passes — The paper gives a reason why it holds.
It may state two separate claims as one.
- Partly supported
The cited sources support only part of this claim — read each source’s verdict below.
In the paper
“Indeed, IL-1 can stimulate HSC proliferation, driving their myeloid differentiation at the expense of self-renewal, thus eroding their repopulating capacity.28,49,50”
§ Aging drives Tet2+/− clonal hematopoiesis via IL-1 signaling > Discussion
What the sources say
- Partly supportedcites [28] Pietras, 2016, Chronic interleukin-1 exposure drives haematopoietic stem cells towards precocious myeloid differentiation at the expense of self-renewal, Nat Cell Biol sourceExperimental — accuracy not yet measured
The Results sections on IL-1-accelerated differentiation and chronic exposure report faster HSC division, increased myeloid differentiation, and impaired self-renewal and transplantation capacity. But the claim omits the crucial duration qualifier: the Results section on acute stimulation says acute IL-1 exposure promotes myeloid recovery without impairing HSC self-renewal. Page numbers were not provided in our copy. (LLM, conf=0.88)
- Partly supportedcites [49] Ueda, 2009, IL-1R type I-dependent hemopoietic stem cell proliferation is necessary for inflammatory granulopoiesis and reactive neutrophilia, J Immunol sourceExperimental — accuracy not yet measured
The Discussion (page not supplied) reports that HSC proliferate in response to IL-1 in vitro and that IL-1RI-dependent signaling supports HSC proliferation during alum-induced granulopoiesis. It does not establish that this proliferation drives myeloid differentiation at the expense of self-renewal or erodes HSC repopulating capacity; those outcomes are not reported in the passages retrieved. (LLM, conf=0.88)
- Partly supportedcites [50] Chavez, 2021, 1 enforces quiescence and limits hematopoietic stem cell expansion during inflammatory stress, J Exp Med sourceExperimental — accuracy not yet measured
The Introduction and Discussion report that IL-1 can induce HSC cell-cycle activity and precocious myeloid differentiation. But the Discussion emphasizes that IL-1–activated PU.1 restricts proliferation in long-term HSCs, and the passages do not establish the claimed chain from proliferation through lost self-renewal to eroded repopulating capacity. No page numbers are available in our copy. (LLM, conf=0.84)
plaindirect- Asserted: passes — The authors put it forward as true.
- Checkable: passes — It can be checked against evidence.
- Load-bearing: passes — The paper’s conclusions depend on it.
- Based: passes — The paper gives a reason why it holds.
It may state two separate claims as one.
- Partly supported
The cited sources support only part of this claim — read each source’s verdict below.
In the paper
“and mortality from heart failure (VAF > 2%).38”
§ Aging drives Tet2+/− clonal hematopoiesis via IL-1 signaling > Discussion
What the sources say
- Partly supportedcites [38] Dorsheimer, 2019, Association of mutations contributing to clonal hematopoiesis with prognosis in chronic ischemic heart failure, JAMA Cardiol sourceExperimental — accuracy not yet measured
The Results (Prognostic Significance of CHIP in Patients With Heart Failure; page unavailable) report a dose-response association between clone size and survival, including a VAF group of at least 0.02. The Discussion says increased mortality was mainly driven by heart-failure progression. However, the clone-size analysis groups TET2 with DNMT3A; it does not establish the stated association for TET2 alone. (LLM, conf=0.84)
plaincorrelational- Asserted: passes — The authors put it forward as true.
- Checkable: passes — It can be checked against evidence.
- Load-bearing: fails — The paper’s conclusions may not depend on it.
- Based: passes — The paper gives a reason why it holds.
Probably not a substantial claim. The paper’s conclusions may not depend on it.
- Partly supported
The cited sources support only part of this claim — read each source’s verdict below.
In the paper
“are predicted to have high expansion rates (10% increase in mean VAF per year1, 2, 3,7)”
§ Aging drives Tet2+/− clonal hematopoiesis via IL-1 signaling > Discussion
What the sources say
- Partly supportedcites [1] Genovese, 2014, Clonal hematopoiesis and blood-cancer risk inferred from blood DNA sequence, N Engl J Med sourceExperimental — accuracy not yet measured
The Results section on characteristic mutations identifies disruptive TET2 mutations as candidate drivers of clonal hematopoiesis, and the Discussion reports a competitive growth advantage from TET2 loss (page numbers unavailable). Neither passage predicts a high expansion rate or a 10% annual increase in mean VAF for heterozygous TET2 loss-of-function mutations. (LLM, conf=0.85)
- Partly supportedcites [2] Jaiswal, 2014, Age-related clonal hematopoiesis associated with adverse outcomes, N Engl J Med sourceExperimental — accuracy not yet measured
The Discussion (page unavailable) reports that TET2 loss-of-function cells have a competitive advantage in mouse models. The Results section on persistence over time (page unavailable) reports increases in variant allele fraction for some mutations, but gives no TET2-specific expansion rate. Neither passage supports the predicted 10% increase in mean VAF per year for heterozygous TET2 loss-of-function mutations. (LLM, conf=0.85)
- Partly supportedcites [3] Xie, 2014, Age-related mutations associated with clonal hematopoietic expansion and malignancies, Nat Med sourceExperimental — accuracy not yet measured
The Results (Variants contributing to hematopoietic clonal expansion; page unavailable) associate TET2 mutations with age, and the Discussion identifies TET2 among genes involved in clonal expansion. Neither passage predicts an expansion rate for heterozygous TET2 loss-of-function mutations or reports a 10% increase in mean VAF per year. (LLM, conf=0.87)
- Partly supportedcites [7] Buscarlet, 2017, DNMT3A and TET2 dominate clonal hematopoiesis and demonstrate benign phenotypes and different genetic predispositions, Blood sourceExperimental — accuracy not yet measured
The clonal-expansion section reports a 9.98% increase in estimated mean TET2 VAF per year of age, supporting the approximate 10% figure. But it estimates this relationship across TET2 mutations generally, without establishing that the rate applies specifically to heterozygous loss-of-function mutations; the study also lacked serial resampling. (LLM, conf=0.87)
plaindirect- Asserted: passes — The authors put it forward as true.
- Checkable: passes — It can be checked against evidence.
- Load-bearing: fails — The paper’s conclusions may not depend on it.
- Based: passes — The paper gives a reason why it holds.
Probably not a substantial claim. The paper’s conclusions may not depend on it.
- Partly supported
Every source the paper cites for this claim was checked and supports it.
In the paper
“Higher TET2 mutant clone sizes associate with higher risk of progression to AML (VAF > 10%)6”
§ Aging drives Tet2+/− clonal hematopoiesis via IL-1 signaling > Discussion
What the sources say
- Supportedcites [6] Desai, 2018, Somatic mutations precede acute myeloid leukemia years before diagnosis, Nat Med source
In “Mutations at any VAF are associated with increased AML risk” (page not provided), higher-VAF TET2 mutations were almost exclusively seen in AML cases. The adjusted analysis reports higher odds of developing AML for TET2 mutations at VAF ≥10% than at VAF <10%, supporting the claimed association; the paper uses ≥10%, rather than >10%, as its cutoff. (LLM, conf=0.92)
plaincorrelational- Asserted: passes — The authors put it forward as true.
- Checkable: passes — It can be checked against evidence.
- Load-bearing: fails — The paper’s conclusions may not depend on it.
- Based: passes — The paper gives a reason why it holds.
Probably not a substantial claim. The paper’s conclusions may not depend on it.
- Supported
The sources with a verdict support this claim; the rest weren’t checked yet, have no full text we could read, or their verdicts aren’t rated yet.
In the paper
“This likely results from a higher basal level of self-renewal, repopulation capacity, and general fitness reported in Tet2 loss-of-function HSPCs.11, 12, 13”
§ Aging drives Tet2+/− clonal hematopoiesis via IL-1 signaling > Discussion
What the sources say
- Not checked — no full text of the sourcecites [11] Ko, 2011, Ten-eleven-translocation 2 (TET2) negatively regulates homeostasis and differentiation of hematopoietic stem cells in mice, Proc Natl Acad Sci U S A source
- Supportedcites [12] Moran-Crusio, 2011, Tet2 loss leads to increased hematopoietic stem cell self-renewal and myeloid transformation, Cancer Cell source
The Results section on HSC self-renewal in vivo reports that Tet2-deficient cells outcompeted wild-type cells in competitive transplants, supporting the claim of greater repopulating capacity and competitive fitness. The Results also report increased self-renewal and serial replating of Tet2-deficient stem and progenitor cells. The paper does not use the phrase “basal level,” but the cited findings support the paraphrase. (LLM, conf=0.91)
- Not checked — no full text of the sourcecites [13] Quivoron, 2011, TET2 inactivation results in pleiotropic hematopoietic abnormalities in mouse and is a recurrent event during human lymphomagenesis, Cancer Cell source
hedged- Asserted: passes — The authors put it forward as true.
- Checkable: passes — It can be checked against evidence.
- Load-bearing: passes — The paper’s conclusions depend on it.
- Based: passes — The paper gives a reason why it holds.
It may state two separate claims as one.
The sources with a verdict support this claim; the rest weren’t checked yet, have no full text we could read, or their verdicts aren’t rated yet.
In the paper
“in the context of CHIP, Tet2 loss-of-function mutations in myeloid cells result in increased proinflammatory responses, with reported increases in both IL-124,43 and IL-6 production,27”
§ Aging drives Tet2+/− clonal hematopoiesis via IL-1 signaling > Discussion
What the sources say
- Supportedcites [24] Fuster, 2017, Clonal hematopoiesis associated with TET2 deficiency accelerates atherosclerosis development in mice, Science source
The paper reports increased proinflammatory cytokine expression and IL-6 protein in TET2-deficient macrophage cultures. It also reports increased IL-1β secretion from stimulated TET2-deficient macrophages. The findings are conditional on the macrophage stimulation used in those experiments; the citing sentence does not specify those conditions. (LLM, conf=0.91)
- Not checked — no full text of the sourcecites [43] Cull, 2017, Tet2 restrains inflammatory gene expression in macrophages, Exp Hematol source
- Supportedcites [27] Zhang, 2015, Tet2 is required to resolve inflammation by recruiting Hdac2 to specifically repress IL-6, Nature source
The source supports the IL-6 production increase attributed to it: the Abstract reports increased IL-6 in Tet2-deficient mice, and the passage describing LPS-stimulated dendritic cells and macrophages reports increased IL-6 protein after Tet2 deficiency or knockdown. The IL-1 claim is attached to other citations, not this source. (LLM, conf=0.91)
plaindirect- Asserted: passes — The authors put it forward as true.
- Checkable: passes — It can be checked against evidence.
- Load-bearing: passes — The paper’s conclusions depend on it.
- Based: passes — The paper gives a reason why it holds.
It may state two separate claims as one.
- Supported
Every source the paper cites for this claim was checked and supports it.
In the paper
“Burns et al reported that progression of Tet2–/– hematopoiesis into myeloid malignancy is abrogated in the absence of Il1r1,56”
§ Aging drives Tet2+/− clonal hematopoiesis via IL-1 signaling > Discussion
What the sources say
- Supportedcites [56] Burns, 2022, Il-1r1 drives leukemogenesis induced by Tet2 loss, Leukemia source
In “Il-1r1 drives leukemogenesis induced by Tet2 loss” (page not supplied), the authors state that loss of IL-1R1-dependent signaling rescues disruptions caused by Tet2 deficiency, “abrogating myeloid disease.” They also conclude that Il-1r1 loss abrogates hematological malignancy in their mouse experiments. (LLM, conf=0.91)
plaindirect- Asserted: passes — The authors put it forward as true.
- Checkable: passes — It can be checked against evidence.
- Load-bearing: fails — The paper’s conclusions may not depend on it.
- Based: passes — The paper gives a reason why it holds.
Probably not a substantial claim. The paper’s conclusions may not depend on it.
- Supported
A result the paper reports from its own data — it cites no other source for it, so there is none to check. The quote shows it is in the paper.
In the paper
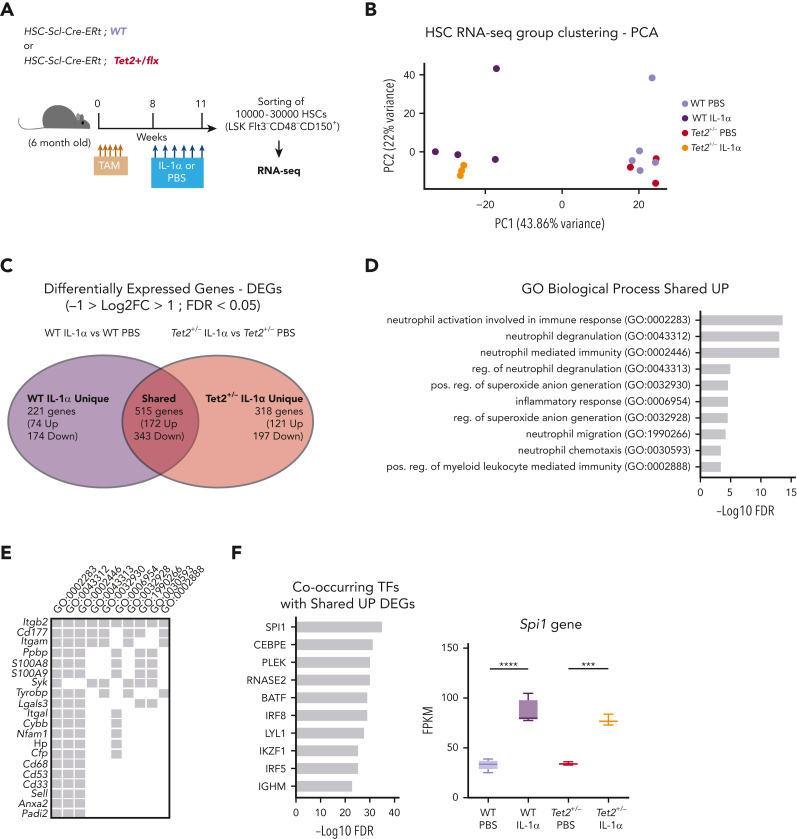
“By intersecting DEGs induced by IL-1α in WT and Tet2+/− samples, we obtained DEGs that are unique to IL-1α–treated WT HSCs (221 genes), unique to IL-1α–treated Tet2+/− HSCs (318 genes), and shared by both genotypes on IL-1α treatment (515 genes; Figure 5C; supplemental Table 1).”
§ Aging drives Tet2+/− clonal hematopoiesis via IL-1 signaling > Results > Tet2+/− HSCs exposed to IL-1α upregulate proliferation and maintain self-renewal transcriptomic signatures
plain- Asserted: passes — The authors put it forward as true.
- Checkable: passes — It can be checked against evidence.
- Load-bearing: passes — The paper’s conclusions depend on it.
- Based: passes — The paper gives a reason why it holds.
It may state two separate claims as one.
A result the paper reports from its own data — it cites no other source for it, so there is none to check. The quote shows it is in the paper.
In the paper
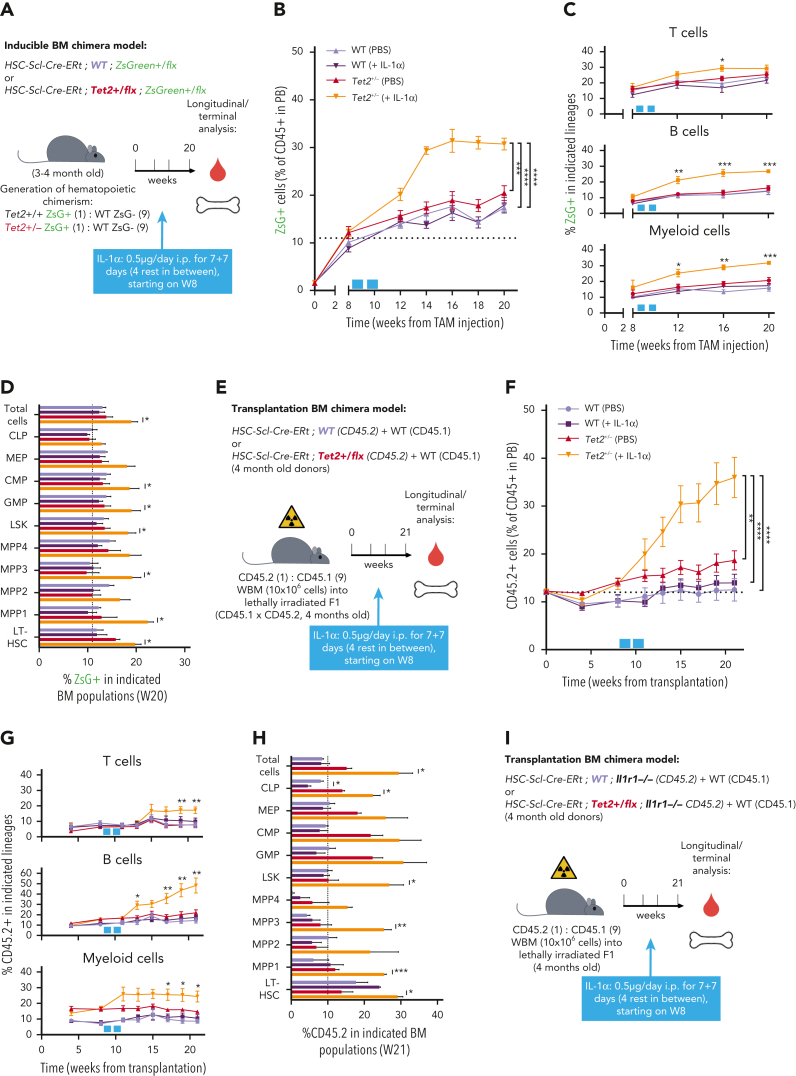
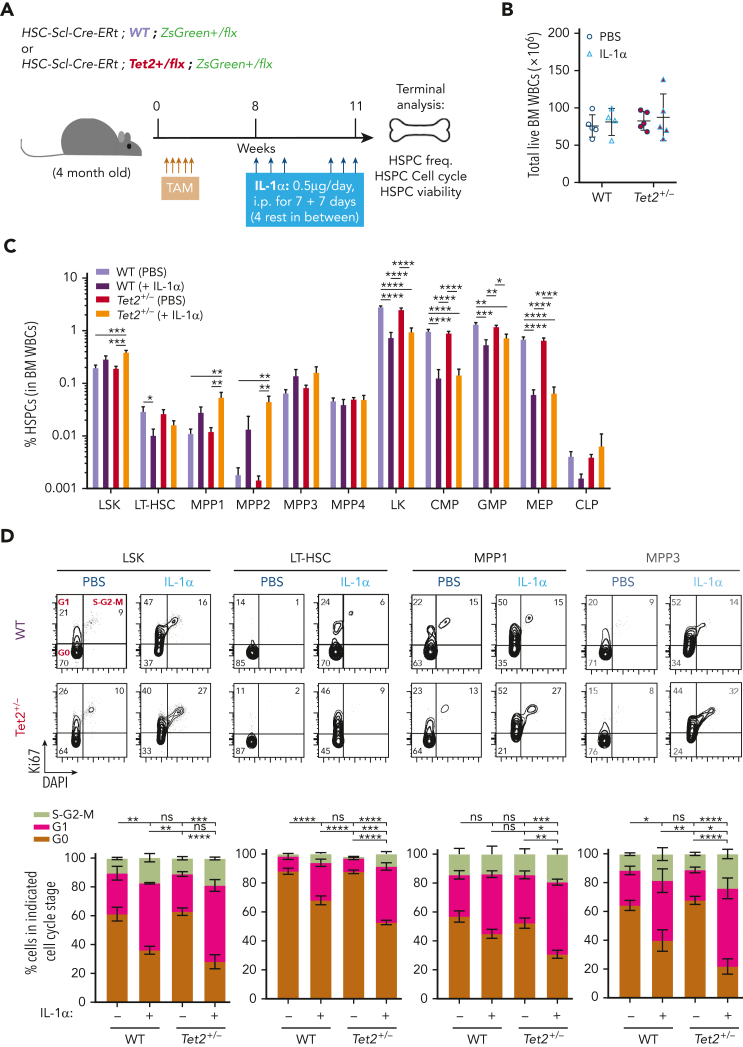
“More important, terminal assessment of CD45.2+ chimerism in BM HSPCs revealed that although IL-1α–treated HSPCs were overall underrepresented, the fold reduction observed in WT HSPCs was of a much higher magnitude compared with Tet2+/− (Figure 4J).”
§ Aging drives Tet2+/− clonal hematopoiesis via IL-1 signaling > Results > Tet2+/− HSPCs maintain higher proliferative and repopulation capacity than WT in response to long-term IL-1α
plaincorrelational- Asserted: passes — The authors put it forward as true.
- Checkable: passes — It can be checked against evidence.
- Load-bearing: passes — The paper’s conclusions depend on it.
- Based: passes — The paper gives a reason why it holds.
It may state two separate claims as one.
A result the paper reports from its own data — it cites no other source for it, so there is none to check. The quote shows it is in the paper.
In the paper
“Concerning the BM HSPC frequencies, we observed a general trend for IL-1α treatment to reduce the LK compartment (Lin–c-Kit+Sca-1– cells: CMPs, granulocyte-macrophage progenitors, and megakaryocyte-erythrocyte progenitors) in both genotypes, whereas expansion of the LSK compartment (Lin–c-Kit+Sca-1+: MPP1, MPP2, and MPP3) was more evident in Tet2+/− HSPCs (Figure 4C).”
§ Aging drives Tet2+/− clonal hematopoiesis via IL-1 signaling > Results > Tet2+/− HSPCs maintain higher proliferative and repopulation capacity than WT in response to long-term IL-1α
hedgeddirect- Asserted: passes — The authors put it forward as true.
- Checkable: passes — It can be checked against evidence.
- Load-bearing: passes — The paper’s conclusions depend on it.
- Based: passes — The paper gives a reason why it holds.
It may state two separate claims as one.
A result the paper reports from its own data — it cites no other source for it, so there is none to check. The quote shows it is in the paper.
In the paper
“Principal component analysis of obtained transcriptomes revealed that in vivo PBS-treated HSC samples separate from IL-1α–treated ones, according to principal component 1, whereas IL-1α–treated WT further separate from IL-1α–treated Tet2+/− HSCs, according to principal component 2 (Figure 5B).”
§ Aging drives Tet2+/− clonal hematopoiesis via IL-1 signaling > Results > Tet2+/− HSCs exposed to IL-1α upregulate proliferation and maintain self-renewal transcriptomic signatures
plaincorrelational- Asserted: passes — The authors put it forward as true.
- Checkable: passes — It can be checked against evidence.
- Load-bearing: passes — The paper’s conclusions depend on it.
- Based: passes — The paper gives a reason why it holds.
It may state two separate claims as one.
A result the paper reports from its own data — it cites no other source for it, so there is none to check. The quote shows it is in the paper.
In the paper
“Strikingly, IL-1α exposure resulted in a significant increase uniquely in ZsG+Tet2+/− clonal fraction in PB CD45+ leukocytes (Figure 3B), whereas this was not observed in respective controls.”
§ Aging drives Tet2+/− clonal hematopoiesis via IL-1 signaling > Results > IL-1α–IL-1R1 axis drives directly Tet2+/− clonal expansion via increased multilineage differentiation
boosteddirect- Asserted: passes — The authors put it forward as true.
- Checkable: passes — It can be checked against evidence.
- Load-bearing: passes — The paper’s conclusions depend on it.
- Based: passes — The paper gives a reason why it holds.
It may state two separate claims as one.
A result the paper reports from its own data — it cites no other source for it, so there is none to check. The quote shows it is in the paper.
In the paper
“In detail, IL-1α exposure decreased the frequency of cells in G0 in both genotypes, although this effect was significantly stronger in Tet2+/− LT-HSCs, MPP1s, and MPP3 (Figure 4D).”
§ Aging drives Tet2+/− clonal hematopoiesis via IL-1 signaling > Results > Tet2+/− HSPCs maintain higher proliferative and repopulation capacity than WT in response to long-term IL-1α
plaindirect- Asserted: passes — The authors put it forward as true.
- Checkable: passes — It can be checked against evidence.
- Load-bearing: passes — The paper’s conclusions depend on it.
- Based: passes — The paper gives a reason why it holds.
It may state two separate claims as one.
A result the paper reports from its own data — it cites no other source for it, so there is none to check. The quote shows it is in the paper.
In the paper
“Interestingly, although IL-1α exposure reduced the replating capacity of HSPCs in both genotypes, the Tet2+/− HSPCs were more resistant to this effect and were able to form colonies up to the fourth replating cycle (Figure 4F)”
§ Aging drives Tet2+/− clonal hematopoiesis via IL-1 signaling > Results > Tet2+/− HSPCs maintain higher proliferative and repopulation capacity than WT in response to long-term IL-1α
plaindirect- Asserted: passes — The authors put it forward as true.
- Checkable: passes — It can be checked against evidence.
- Load-bearing: passes — The paper’s conclusions depend on it.
- Based: passes — The paper gives a reason why it holds.
It may state two separate claims as one.
A result the paper reports from its own data — it cites no other source for it, so there is none to check. The quote shows it is in the paper.
In the paper
“IL-1 pathway member quantification in aged WT and Tet2+/− total BM cells showed no differences in Il1r1 and Il1r2 gene expression and a decrease in Ilr1rn (IL1R antagonist) expression in Tet2+/− cells (Figure 2G).”
§ Aging drives Tet2+/− clonal hematopoiesis via IL-1 signaling > Results > Increased Tet2+/− clonal expansion rates associate with high BM IL-1 levels on aging
plain- Asserted: passes — The authors put it forward as true.
- Checkable: passes — It can be checked against evidence.
- Load-bearing: passes — The paper’s conclusions depend on it.
- Based: passes — The paper gives a reason why it holds.
It may state two separate claims as one.
A result the paper reports from its own data — it cites no other source for it, so there is none to check. The quote shows it is in the paper.
In the paper
“More important, Tet2+/− clonal expansion in PB leukocytes and HSPCs was further increased in animals aged for 28 months (supplemental Figure 2C-E) and in animals induced at a more advanced age (supplemental Figure 2F-H)”
§ Aging drives Tet2+/− clonal hematopoiesis via IL-1 signaling > Results > Increased Tet2+/− clonal expansion rates associate with high BM IL-1 levels on aging
plaindirect- Asserted: passes — The authors put it forward as true.
- Checkable: passes — It can be checked against evidence.
- Load-bearing: passes — The paper’s conclusions depend on it.
- Based: passes — The paper gives a reason why it holds.
It may state two separate claims as one.
A result the paper reports from its own data — it cites no other source for it, so there is none to check. The quote shows it is in the paper.
In the paper
“Viability analysis showed no effect of IL-1α exposure on HSPC apoptotic levels, except for CLPs that showed decreased viability in both genotypes (supplemental Figure 4B).”
§ Aging drives Tet2+/− clonal hematopoiesis via IL-1 signaling > Results > Tet2+/− HSPCs maintain higher proliferative and repopulation capacity than WT in response to long-term IL-1α
plain- Asserted: passes — The authors put it forward as true.
- Checkable: passes — It can be checked against evidence.
- Load-bearing: unclear — It is unclear whether the paper’s conclusions depend on it.
- Based: passes — The paper gives a reason why it holds.
It may state two separate claims as one.
A result the paper reports from its own data — it cites no other source for it, so there is none to check. The quote shows it is in the paper.
In the paper
“Moreover, although IL-1α pretreatment reduced significantly PB CD45.2+ chimerism in all lineages in both genotypes, Tet2+/− cells were more resistant to this effect (Figure 4H-I).”
§ Aging drives Tet2+/− clonal hematopoiesis via IL-1 signaling > Results > Tet2+/− HSPCs maintain higher proliferative and repopulation capacity than WT in response to long-term IL-1α
plaindirect- Asserted: passes — The authors put it forward as true.
- Checkable: passes — It can be checked against evidence.
- Load-bearing: passes — The paper’s conclusions depend on it.
- Based: passes — The paper gives a reason why it holds.
It may state two separate claims as one.
A result the paper reports from its own data — it cites no other source for it, so there is none to check. The quote shows it is in the paper.
In the paper
“Accordingly, we observed that IL-1α induces myeloid differentiation gene expression in both WT and Tet2+/− HSCs (with enrichment in GO BPs implicated in neutrophil biology, inflammatory response, and myeloid differentiation; Figure 5D)”
§ Aging drives Tet2+/− clonal hematopoiesis via IL-1 signaling > Results > Tet2+/− HSCs exposed to IL-1α upregulate proliferation and maintain self-renewal transcriptomic signatures
plaindirect- Asserted: passes — The authors put it forward as true.
- Checkable: passes — It can be checked against evidence.
- Load-bearing: passes — The paper’s conclusions depend on it.
- Based: passes — The paper gives a reason why it holds.
It may state two separate claims as one.
A result the paper reports from its own data — it cites no other source for it, so there is none to check. The quote shows it is in the paper.
In the paper
“Tet2+/− HSCs exposed to IL-1α showed an enrichment in BPs implicated in DNA replication initiation (associated with overexpression of Mcm2-4 and 10, Cdc6, and Orc1 genes), cell cycle progression (associated with increased e2f1 expression and downstream transcriptional program), and DNA repair pathways (associated with overexpression of Rad51, Rad51b, and Fanca/i genes) (Figure 5G-I).”
§ Aging drives Tet2+/− clonal hematopoiesis via IL-1 signaling > Results > Tet2+/− HSCs exposed to IL-1α upregulate proliferation and maintain self-renewal transcriptomic signatures
plaincorrelational- Asserted: passes — The authors put it forward as true.
- Checkable: passes — It can be checked against evidence.
- Load-bearing: passes — The paper’s conclusions depend on it.
- Based: passes — The paper gives a reason why it holds.
It may state two separate claims as one.
A result the paper reports from its own data — it cites no other source for it, so there is none to check. The quote shows it is in the paper.
In the paper
“In contrast, cell cycle analysis revealed a major impact of IL-1α exposure on HSPC proliferative responses, particularly in the LSK compartment (minor impact in LK cells; supplemental Figure 4C).”
§ Aging drives Tet2+/− clonal hematopoiesis via IL-1 signaling > Results > Tet2+/− HSPCs maintain higher proliferative and repopulation capacity than WT in response to long-term IL-1α
plaindirect- Asserted: passes — The authors put it forward as true.
- Checkable: passes — It can be checked against evidence.
- Load-bearing: passes — The paper’s conclusions depend on it.
- Based: passes — The paper gives a reason why it holds.
It may state two separate claims as one.
A result the paper reports from its own data — it cites no other source for it, so there is none to check. The quote shows it is in the paper.
In the paper
“Longitudinal quantification of ZsG+ WT and ZsG+Tet2+/− clonal fractions in PB CD45+ leukocytes showed that, although both clonal fractions increase over time, there was a significantly higher expansion of the Tet2+/− clone compared with the WT (Figure 2B-C).”
§ Aging drives Tet2+/− clonal hematopoiesis via IL-1 signaling > Results > Increased Tet2+/− clonal expansion rates associate with high BM IL-1 levels on aging
plaindirect- Asserted: passes — The authors put it forward as true.
- Checkable: passes — It can be checked against evidence.
- Load-bearing: passes — The paper’s conclusions depend on it.
- Based: passes — The paper gives a reason why it holds.
It may state two separate claims as one.
- Rests on an assumption: The HSC-SCL-Cre-ERT; Tet2+/flox; R26+/tm6(CAG-ZsGreen1)Hze model's ZsG+ cells faithfully represent Tet2+/− HSPC-derived hematopoiesis throughout aging.
- Rests on an assumption: The 10% TAM-induced clonal hematopoietic fraction mimics the clonal fractions and behavior of human CHIP.
A result the paper reports from its own data — it cites no other source for it, so there is none to check. The quote shows it is in the paper.
In the paper
“As observed in the inducible BM chimera model, IL-1α exposure led to a specific and significant expansion of CD45.2+ Tet2+/− clone size in all leukocyte lineages (Figure 3F-G) and in multiple hematopoietic progenitors (CLPs, LSKs, MPP1,3, and LT-HSCs; Figure 3H).”
§ Aging drives Tet2+/− clonal hematopoiesis via IL-1 signaling > Results > IL-1α–IL-1R1 axis drives directly Tet2+/− clonal expansion via increased multilineage differentiation
plaindirect- Asserted: passes — The authors put it forward as true.
- Checkable: passes — It can be checked against evidence.
- Load-bearing: passes — The paper’s conclusions depend on it.
- Based: passes — The paper gives a reason why it holds.
It may state two separate claims as one.
A result the paper reports from its own data — it cites no other source for it, so there is none to check. The quote shows it is in the paper.
In the paper
“the anakinra regimen used was not sufficient to fully prevent Tet2+/− HSPC clonal expansion (Figure 6H)”
- Also stated in: § Genetic and pharmacologic blockage of IL-1–IL-1R1 signaling reduces Tet2+/− clonal expansion during aging · hedged
“suggesting that the anakinra treatment doses and timing used were not sufficient to revert an already established clonal dominance.”
- Also stated in: § Discussion · plain
“IL-1R antagonist treatment prevented HSPC differentiation but did not revert an established clonal dominance in the HSPC pool.”
§ Aging drives Tet2+/− clonal hematopoiesis via IL-1 signaling > Results > Genetic and pharmacologic blockage of IL-1–IL-1R1 signaling reduces Tet2+/− clonal expansion during aging
plaindirect- Asserted: passes — The authors put it forward as true.
- Checkable: passes — It can be checked against evidence.
- Load-bearing: passes — The paper’s conclusions depend on it.
- Based: passes — The paper gives a reason why it holds.
It may state two separate claims as one.
- Also stated in: § Genetic and pharmacologic blockage of IL-1–IL-1R1 signaling reduces Tet2+/− clonal expansion during aging · hedged
A result the paper reports from its own data — it cites no other source for it, so there is none to check. The quote shows it is in the paper.
In the paper
“we observed 2 separate phases of Tet2+/− expansion: an initial expansion within the first 2 months after transplantation (possibly resulting from irradiation-derived inflammation), which is not observed in the inducible model; and a later expansion between months 7 and 9, which is shared with the inducible model (Figure 6C).”
§ Aging drives Tet2+/− clonal hematopoiesis via IL-1 signaling > Results > Genetic and pharmacologic blockage of IL-1–IL-1R1 signaling reduces Tet2+/− clonal expansion during aging
hedged- Asserted: passes — The authors put it forward as true.
- Checkable: passes — It can be checked against evidence.
- Load-bearing: passes — The paper’s conclusions depend on it.
- Based: passes — The paper gives a reason why it holds.
It may state two separate claims as one.
A result the paper reports from its own data — it cites no other source for it, so there is none to check. The quote shows it is in the paper.
In the paper
“(a) murine Tet2+/− clonal expansion rates increase with age and associate with increased BM levels of myeloid-derived inflammatory cytokine IL-1”
§ Aging drives Tet2+/− clonal hematopoiesis via IL-1 signaling > Discussion
plaincorrelational- Asserted: passes — The authors put it forward as true.
- Checkable: passes — It can be checked against evidence.
- Load-bearing: passes — The paper’s conclusions depend on it.
- Based: passes — The paper gives a reason why it holds.
It may state two separate claims as one.
A result the paper reports from its own data — it cites no other source for it, so there is none to check. The quote shows it is in the paper.
In the paper
“this approach revealed a Tet2+/− clonal expansion stage exclusive to advanced aged and associated with increased BM IL-1 levels”
§ Aging drives Tet2+/− clonal hematopoiesis via IL-1 signaling > Discussion
plaincorrelational- Asserted: passes — The authors put it forward as true.
- Checkable: passes — It can be checked against evidence.
- Load-bearing: passes — The paper’s conclusions depend on it.
- Based: passes — The paper gives a reason why it holds.
It may state two separate claims as one.
What the paper did — it cites no source for this, so there is none to check. The quote shows it is in the paper.
In the paper
“Data are a pool of at least 2 independent experiments for all graphs, except J through L.”
§ Aging drives Tet2+/− clonal hematopoiesis via IL-1 signaling > Results > Increased Tet2+/− clonal expansion rates associate with high BM IL-1 levels on aging
plain- Asserted: passes — The authors put it forward as true.
- Checkable: passes — It can be checked against evidence.
- Load-bearing: fails — The paper’s conclusions may not depend on it.
- Based: passes — The paper gives a reason why it holds.
Probably not a substantial claim. The paper’s conclusions may not depend on it.
A conclusion the paper draws from its own results — it cites no other source for it, so there is none to check. The quote shows it is in the paper.
In the paper
“Collectively, these data indicate that during aging, starting at about 7 to 8 months, there is a multilineage Tet2+/− hematopoietic clonal expansion, which associates with increased cell-extrinsic proinflammatory IL-1 levels, produced mainly by the myeloid BM compartment.”
§ Aging drives Tet2+/− clonal hematopoiesis via IL-1 signaling > Results > Increased Tet2+/− clonal expansion rates associate with high BM IL-1 levels on aging
hedgedcorrelational- Asserted: passes — The authors put it forward as true.
- Checkable: passes — It can be checked against evidence.
- Load-bearing: passes — The paper’s conclusions depend on it.
- Based: passes — The paper gives a reason why it holds.
It may state two separate claims as one.
- Rests on an assumption: BM IL-1 protein levels measured in lysates reflect bioactive IL-1 signaling in the BM niche.
What the paper did — it cites no source for this, so there is none to check. The quote shows it is in the paper.
In the paper
“Further characterization of the model revealed ZsG expression leakiness, with low expression levels in the absence of TAM injection, which was independent of sex but increased with age (up to 2.5% frequency at 10 months of age; Figure 1E).”
§ Aging drives Tet2+/− clonal hematopoiesis via IL-1 signaling > Results > Generation of an irradiation- and transplantation-independent genetic chimerism mouse model of Tet2+/− clonal hematopoiesis
plaindirect- Asserted: passes — The authors put it forward as true.
- Checkable: passes — It can be checked against evidence.
- Load-bearing: unclear — It is unclear whether the paper’s conclusions depend on it.
- Based: passes — The paper gives a reason why it holds.
It may state two separate claims as one.
What the paper did — it cites no source for this, so there is none to check. The quote shows it is in the paper.
In the paper
“To validate the model, we exposed triple-transgenic mice to 5 consecutive injections of TAM at 100 mg/kg and observed high ZsG expression in all BM hematopoietic mature and progenitor/stem populations (range, 80%-100%) and low ZsG expression in nonhematopoietic cells (range, 3%-5%), thus confirming the relatively high hematopoietic specificity of CreERT activity”
§ Aging drives Tet2+/− clonal hematopoiesis via IL-1 signaling > Results > Generation of an irradiation- and transplantation-independent genetic chimerism mouse model of Tet2+/− clonal hematopoiesis
plain- Asserted: passes — The authors put it forward as true.
- Checkable: passes — It can be checked against evidence.
- Load-bearing: passes — The paper’s conclusions depend on it.
- Based: passes — The paper gives a reason why it holds.
It may state two separate claims as one.
A conclusion the paper draws from its own results — it cites no other source for it, so there is none to check. The quote shows it is in the paper.
In the paper
“Overall, these data establish the IL-1α–IL-1R1 axis as a direct driver of increased Tet2+/− multilineage differentiation, leading to Tet2+/− hematopoietic clonal fitness gain and dominance over WT hematopoiesis.”
§ Aging drives Tet2+/− clonal hematopoiesis via IL-1 signaling > Results > IL-1α–IL-1R1 axis drives directly Tet2+/− clonal expansion via increased multilineage differentiation
boosteddirect- Asserted: passes — The authors put it forward as true.
- Checkable: passes — It can be checked against evidence.
- Load-bearing: passes — The paper’s conclusions depend on it.
- Based: passes — The paper gives a reason why it holds.
It may state two separate claims as one.
What the paper did — it cites no source for this, so there is none to check. The quote shows it is in the paper.
In the paper
“Altogether, these data validate the generation of an irradiation/transplantation-independent, TAM-dose–dependent inducible, and traceable genetic chimerism model to study Tet2+/− clonal hematopoiesis.”
§ Aging drives Tet2+/− clonal hematopoiesis via IL-1 signaling > Results > Generation of an irradiation- and transplantation-independent genetic chimerism mouse model of Tet2+/− clonal hematopoiesis
boosted- Asserted: passes — The authors put it forward as true.
- Checkable: passes — It can be checked against evidence.
- Load-bearing: passes — The paper’s conclusions depend on it.
- Based: passes — The paper gives a reason why it holds.
It may state two separate claims as one.
- Rests on an assumption: The HSC-SCL-Cre-ERT; Tet2+/flox; R26+/tm6(CAG-ZsGreen1)Hze model's ZsG+ cells faithfully represent Tet2+/− HSPC-derived hematopoiesis throughout aging.
A conclusion the paper draws from its own results — it cites no other source for it, so there is none to check. The quote shows it is in the paper.
In the paper
“Collectively, these data demonstrate that Tet2+/− HSPCs maintain higher proliferative responses on long-term IL-1α exposure that result in a higher repopulation capacity compared with WT, thus contributing to an overall enhanced cellular competitive fitness in this setting.”
§ Aging drives Tet2+/− clonal hematopoiesis via IL-1 signaling > Results > Tet2+/− HSPCs maintain higher proliferative and repopulation capacity than WT in response to long-term IL-1α
boosteddirect- Asserted: passes — The authors put it forward as true.
- Checkable: passes — It can be checked against evidence.
- Load-bearing: passes — The paper’s conclusions depend on it.
- Based: passes — The paper gives a reason why it holds.
It may state two separate claims as one.
What the paper did — it cites no source for this, so there is none to check. The quote shows it is in the paper.
In the paper
“All mice were housed and handled according to the guidelines of the Swiss Federal Veterinary Office under specific pathogen-free conditions. All experiments were approved by the Veterinaramt Kanton Zurich (Zurich, Switzerland).”
§ Aging drives Tet2+/− clonal hematopoiesis via IL-1 signaling > Materials and methods > Mice
plain- Asserted: passes — The authors put it forward as true.
- Checkable: passes — It can be checked against evidence.
- Load-bearing: fails — The paper’s conclusions may not depend on it.
- Based: passes — The paper gives a reason why it holds.
Probably not a substantial claim. The paper’s conclusions may not depend on it. It may state two separate claims as one.
A conclusion the paper draws from its own results — it cites no other source for it, so there is none to check. The quote shows it is in the paper.
In the paper
“This suggests that these cells are more sensitive to IL-1α–mediated proliferation and possibly less likely to return to a quiescent state after long-term IL-1α stimulation than WT.”
§ Aging drives Tet2+/− clonal hematopoiesis via IL-1 signaling > Results > Tet2+/− HSPCs maintain higher proliferative and repopulation capacity than WT in response to long-term IL-1α
hedgedconditional- Asserted: passes — The authors put it forward as true.
- Checkable: passes — It can be checked against evidence.
- Load-bearing: passes — The paper’s conclusions depend on it.
- Based: passes — The paper gives a reason why it holds.
It may state two separate claims as one.
A conclusion the paper draws from its own results — it cites no other source for it, so there is none to check. The quote shows it is in the paper.
In the paper
“suggesting that IL-1–dependent increased proliferative activity in Tet2+/− HSPCs is both differentiating and self-renewing.”
§ Aging drives Tet2+/− clonal hematopoiesis via IL-1 signaling > Results > Tet2+/− HSPCs maintain higher proliferative and repopulation capacity than WT in response to long-term IL-1α
hedgeddirect- Asserted: passes — The authors put it forward as true.
- Checkable: passes — It can be checked against evidence.
- Load-bearing: passes — The paper’s conclusions depend on it.
- Based: passes — The paper gives a reason why it holds.
It may state two separate claims as one.
The paper states this without a source or data behind it here, so there is nothing to check it against. The quote shows it is in the paper.
In the paper
“TET2 heterozygous loss-of-function mutations are frequent in CHIP (about 10%-30% prevalence)”
§ Aging drives Tet2+/− clonal hematopoiesis via IL-1 signaling > Discussion
plain- Asserted: passes — The authors put it forward as true.
- Checkable: passes — It can be checked against evidence.
- Load-bearing: fails — The paper’s conclusions may not depend on it.
- Based: passes — The paper gives a reason why it holds.
Probably not a substantial claim. The paper’s conclusions may not depend on it.
A conclusion the paper draws from its own results — it cites no other source for it, so there is none to check. The quote shows it is in the paper.
In the paper
“IL-1 is sensed directly by the HSPC pool via IL-1R1 and favors the dominance of Tet2+/− HSPCs via enhanced proliferation and differentiation into mature blood cells, increasing Tet2+/− cell frequency over WT cells.”
§ Aging drives Tet2+/− clonal hematopoiesis via IL-1 signaling > Discussion
plaindirect- Asserted: passes — The authors put it forward as true.
- Checkable: passes — It can be checked against evidence.
- Load-bearing: passes — The paper’s conclusions depend on it.
- Based: passes — The paper gives a reason why it holds.
It may state two separate claims as one.
A conclusion the paper draws from its own results — it cites no other source for it, so there is none to check. The quote shows it is in the paper.
In the paper
“According to our data, this IL-1–mediated proliferative response resulted in increased differentiation of Tet2+/− over WT HSPCs, leading to expansion of the Tet2+/− clone in all blood lineages.”
§ Aging drives Tet2+/− clonal hematopoiesis via IL-1 signaling > Discussion
plaindirect- Asserted: passes — The authors put it forward as true.
- Checkable: passes — It can be checked against evidence.
- Load-bearing: passes — The paper’s conclusions depend on it.
- Based: passes — The paper gives a reason why it holds.
It may state two separate claims as one.
A conclusion the paper draws from its own results — it cites no other source for it, so there is none to check. The quote shows it is in the paper.
In the paper
“whereby the oncogenic Tet2 mutation, by endowing mutant HSPCs more resistant to the deleterious effects of high IL-1 levels, increases cellular fitness exclusively in the context of an aged and inflammatory environment, whereas the same mutation in a younger and noninflammatory milieu is less selectively expanded.”
§ Aging drives Tet2+/− clonal hematopoiesis via IL-1 signaling > Discussion
plaindirect- Asserted: passes — The authors put it forward as true.
- Checkable: passes — It can be checked against evidence.
- Load-bearing: passes — The paper’s conclusions depend on it.
- Based: passes — The paper gives a reason why it holds.
It may state two separate claims as one.
A conclusion the paper draws from its own results — it cites no other source for it, so there is none to check. The quote shows it is in the paper.
In the paper
“These data suggest that in the context of both artificial IL-1α exposure in young mice and physiological inflammaging, Tet2+/− HSPCs show higher clonal fitness.”
§ Aging drives Tet2+/− clonal hematopoiesis via IL-1 signaling > Results > Genetic and pharmacologic blockage of IL-1–IL-1R1 signaling reduces Tet2+/− clonal expansion during aging
hedgedcorrelational- Asserted: passes — The authors put it forward as true.
- Checkable: passes — It can be checked against evidence.
- Load-bearing: passes — The paper’s conclusions depend on it.
- Based: passes — The paper gives a reason why it holds.
It may state two separate claims as one.
The paper relies on this without support.
The HSC-SCL-Cre-ERT; Tet2+/flox; R26+/tm6(CAG-ZsGreen1)Hze model's ZsG+ cells faithfully represent Tet2+/− HSPC-derived hematopoiesis throughout aging.
“Altogether, these data validate the generation of an irradiation/transplantation-independent, TAM-dose–dependent inducible, and traceable genetic chimerism model to study Tet2+/− clonal hematopoiesis.”
The paper relies on this without support.
BM IL-1 protein levels measured in lysates reflect bioactive IL-1 signaling in the BM niche.
“In agreement with gene expression data, we detected increased IL-1α protein levels in Tet2+/− BM (Figure 2H)”
The paper relies on this without support.
Findings in the mouse Tet2+/− clonal hematopoiesis model are relevant to human CHIP.
“Understanding the drivers of clonal expansion in CHIP-carrying individuals during aging is key to devise potential therapeutic interventions for this population.”
The paper relies on this without support.
The 10% TAM-induced clonal hematopoietic fraction mimics the clonal fractions and behavior of human CHIP.
“triple-transgenic mice carrying wild-type (WT group) or a heterozygous floxed Tet2 gene (Tet2+/− group) were induced with a single TAM injection to generate an about 10% clonal hematopoietic fraction and aged for 12 months (Figure 2A).”
Claims other papers make about this one
Each is checked against this paper’s own text: does it say what the citing paper says it does?
The cited source says what the claim attributes to it.
In the citing paper
“Indeed, Tet2-deficient HSPC exhibit similar characteristics to PU.1-deficient HSPC, namely the capacity to undergo accelerated expansion in the context of chronic inflammation, coupled with altered cell cycle activity (Consortium et al., 2007; Caiado et al., 2022).”
From PU.1 is required to restrain myelopoiesis during chronic inflammatory stress (2023) · cites this paper as Caiado et al., 2022
Self-check
Percentages, sums and reported differences re-computed from the paper’s own numbers.
Each contradiction between two passages listed here was confirmed by an independent check.
Rated minor: it would not touch a result — a value no result rests on, a p-value that stays on the same side of the significance level, or a conflict that is clerical, resolved elsewhere in the paper, or outside its own findings.
In the paper
§ Aging drives Tet2+/− clonal hematopoiesis via IL-1 signaling > Materials and methods > In vivo assays
“Anakinra (Kineret; Sobi) was injected intraperitoneally at a dose of 37 μg/mouse in 100 μL of PBS every other day for 2 months, starting 11 months after tamoxifen injection.”
§ Aging drives Tet2+/− clonal hematopoiesis via IL-1 signaling > Results > Genetic and pharmacologic blockage of IL-1–IL-1R1 signaling reduces Tet2+/− clonal expansion during aging
“For this, we used noninjected triple-transgenic mice carrying minor (≈2%) WT or Tet2+/− ZsG+ clonal fractions”
Citations
Cites
Inflamm‐aging: An Evolutionary Perspective on Immunosenescence
FRANCESCHI, C., BONAFÈ, M., VALENSIN, S., OLIVIERI, F., DE LUCA, M., OTTAVIANI, E., & DE BENEDICTIS, G. (2000) · Annals of the New York Academy of Sciences · doi:10.1111/j.1749-6632.2000.tb06651.x · Cited by 5,358
Age-related clonal hematopoiesis associated with adverse outcomes
Jaiswal, S., Fontanillas, P., Flannick, J., Manning, A., Grauman, P. V., Mar, B. G., Lindsley, R. C., Mermel, C. H., Burtt, N., Chavez, A., et al. (2014) · New England Journal of Medicine · doi:10.1056/nejmoa1408617 · Cited by 4,841
Clonal hematopoiesis and blood-cancer risk inferred from blood DNA sequence
Genovese, G., Kähler, A. K., Handsaker, R. E., Lindberg, J., Rose, S. A., Bakhoum, S. F., Chambert, K., Mick, E., Neale, B. M., Fromer, M., et al. (2014) · New England Journal of Medicine · doi:10.1056/nejmoa1409405 · Cited by 3,531
Age-related mutations associated with clonal hematopoietic expansion and malignancies
Xie, M., Lu, C., Wang, J., McLellan, M. D., Johnson, K. J., Wendl, M. C., McMichael, J. F., Schmidt, H. K., Yellapantula, V., Miller, C. A., et al. (2014) · Nature Medicine · doi:10.1038/nm.3733 · Cited by 1,874
Clonal hematopoiesis associated with TET2 deficiency accelerates atherosclerosis development in mice
Fuster, J. J., MacLauchlan, S., Zuriaga, M. A., Polackal, M. N., Ostriker, A. C., Chakraborty, R., Wu, C.-L., Sano, S., Muralidharan, S., Rius, C., et al. (2017) · Science · doi:10.1126/science.aag1381 · Cited by 1,536
Tet2 loss leads to increased hematopoietic stem cell self-renewal and myeloid transformation
Moran-Crusio, K., Reavie, L., Shih, A., Abdel-Wahab, O., Ndiaye-Lobry, D., Lobry, C., Figueroa, M. E., Vasanthakumar, A., Patel, J., Zhao, X., et al. (2011) · Cancer Cell · doi:10.1016/j.ccr.2011.06.001 · Cited by 1,339
Quivoron, C., Couronné, L., Della Valle, V., Lopez, C. K., Plo, I., Wagner-Ballon, O., Do Cruzeiro, M., Delhommeau, F., Arnulf, B., Stern, M.-H., et al. (2011) · Cancer Cell · doi:10.1016/j.ccr.2011.06.003 · Cited by 924
Prediction of acute myeloid leukaemia risk in healthy individuals
Abelson, S., Collord, G., Ng, S. W. K., Weissbrod, O., Mendelson Cohen, N., Niemeyer, E., Barda, N., Zuzarte, P. C., Heisler, L., Sundaravadanam, Y., et al. (2018) · Nature · doi:10.1038/s41586-018-0317-6 · Cited by 850
Tet2 is required to resolve inflammation by recruiting Hdac2 to specifically repress IL-6
Zhang, Q., Zhao, K., Shen, Q., Han, Y., Gu, Y., Li, X., Zhao, D., Liu, Y., Wang, C., Zhang, X., et al. (2015) · Nature · doi:10.1038/nature15252 · Cited by 807
Inherited causes of clonal haematopoiesis in 97,691 whole genomes
Bick, A. G., Weinstock, J. S., Nandakumar, S. K., Fulco, C. P., Bao, E. L., Zekavat, S. M., Szeto, M. D., Liao, X., Leventhal, M. J., Nasser, J., et al. (2020) · Nature · doi:10.1038/s41586-020-2819-2 · Cited by 733
Cited by
Sorted by citations
Bao, H., Cao, J., Chen, M., Min, C., Chen, W., Chen, X., Chen, Y., Chen, Y., Chen, Y., Chen, Z., et al. (2023) · Science China Life Sciences · doi:10.1007/s11427-023-2305-0 · Cited by 402
Hematopoietic aging promotes cancer by fueling IL-1⍺–driven emergency myelopoiesis
Park, M. D., Bérichel, J. L., Hamon, P., Wilk, C. M., Belabed, M., Yatim, N., Saffon, A., Boumelha, J., Falcomatà, C., Tepper, A., et al. (2024) · Science · doi:10.1126/science.adn0327 · Cited by 149
“The high levels of these two cytokines in lung tumors of old mice further rationalized our study of the functional relevance of IL-1 in lung cancer progression in old mice.”
BackgroundChallenges and advances in the management of inflammation in atherosclerosis
Xing, Y., & Lin, X. (2024) · Journal of Advanced Research · doi:10.1016/j.jare.2024.06.016 · Cited by 147
“Specifically, TET2 mutations disrupt normal DNA demethylation processes, thereby upregulating pro-inflammatory genes and contributing to endothelial dysfunction and the development of atherosclerotic plaques [102,103].”
Jakobsen, N. A., Turkalj, S., Zeng, A. G. X., Stoilova, B., Metzner, M., Rahmig, S., Nagree, M. S., Shah, S., Moore, R., Usukhbayar, B., et al. (2024) · Cell Stem Cell · doi:10.1016/j.stem.2024.05.010 · Cited by 130
Hematopoietic stem cells through the ages: A lifetime of adaptation to organismal demands
Kasbekar, M., Mitchell, C. A., Proven, M. A., & Passegue, E. A. (2023) · Cell stem cell · doi:10.1016/j.stem.2023.09.013 · Cited by 130
Metadata
- Authors
- Caiado, F., Kovtonyuk, L. V., Gonullu, N. G., Fullin, J., Boettcher, S., & Manz, M. G.
- Affiliations
- University of Zurich (CH)
- ORCID
- Venue
- Blood
- Publisher
- American Society of Hematology
- Published
- 2023-02-23
- Volume
- 141
- Issue
- 8
- Pages
- 886-903
- ISSN
- 0006-4971 (ISSN-L)
- 1528-0020
- PMC
- PMC10651783
- OpenAlex
- W4309088916
- Semantic Scholar
- b985dc02b2dc30638813f151f894dcbd404d3ab4
- Cited by
- 161
- References
- 60
- Citations by year
- 2026: 47 · 2025: 47 · 2024: 44 · 2023: 23
- FWCI
- 17.75
- Type
- journal article
- Language
- en
- Open access
- hybrid
- doi.org
- Licence
- Locations
- Blood (publishedVersion, cc-by-nc-nd)
- PubMed (publishedVersion)
- Zurich Open Repository and Archive (University of Zurich) (acceptedVersion, cc-by-nc-nd)
- PubMed Central (submittedVersion, cc-by-nc-nd)
- Zurich Open Repository and Archive (University of Zurich) (submittedVersion, cc-by-nc-nd)
- Zurich Open Repository and Archive (University of Zurich)
- Funders
- National Science Foundation
- Schweizerischer Nationalfonds zur Förderung der Wissenschaftlichen Forschung (310030_184747/1, 310030)
- Topics
- Health Sciences › Medicine › Hematology › Acute Myeloid Leukemia Research
- Health Sciences › Medicine › Hematology › Hematopoietic Stem Cell Transplantation
- Health Sciences › Medicine › Hematology › Blood disorders and treatments
- Keywords
- clonal hematopoiesis of indeterminate potential, TET2, aging, IL-1 signaling, IL-1 receptor 1, hematopoietic stem and progenitor cells, clonal expansion, inflammation, DNA replication and repair, self-renewal, multilineage differentiation, hematological malignancy risk, bone marrow transplantation, genetic mosaicism
- MeSH terms
- Clonal Hematopoiesis, Aging, Animals, Cardiovascular Diseases, DNA-Binding Proteins, Hematopoiesis, Interleukin-1, Mutation, Dioxygenases, Mice
About these checks
Registry, retraction, Cites and statistics results are computed, not judged, with one exception: a printed reference that no index lists is read once by a model before it counts as a citation error. Claims are extracted by a model and kept only when their quote appears verbatim in the text; each cited source is then checked, with a model’s help, for whether it says what the claim relies on. Those verdicts can be wrong — read the claim’s quote and the cited source before relying on one.
A language model drew the claims from the paper on 2026-10-28, under version 3 of the claim definition (model deepseek-v4.1-flash, prompt extract-v3).
A second model labelled each claim on 2026-10-28 (model jev-1.13-20260917, definition revision gold-guideline-v0.2).
Cited sources are checked with a language model’s help (gpt-6-sol).
Statistics and arithmetic are recomputed, not judged.
Confidence bands are shown only for fields calibrated on our annotated test set. None is calibrated yet, so no band is shown.
What counts as a claim ›How we measure confidence ›How we check this ›
Are you an author, or do you see a problem with this page? Request a review
