

The DOI matches its Crossref record; 45 of the 45 references it cites were found in a registry or an index.
Aβ reduction in BACE1 heterozygous null 5XFAD mice is associated with transgenic APP level
Open accessAbstract
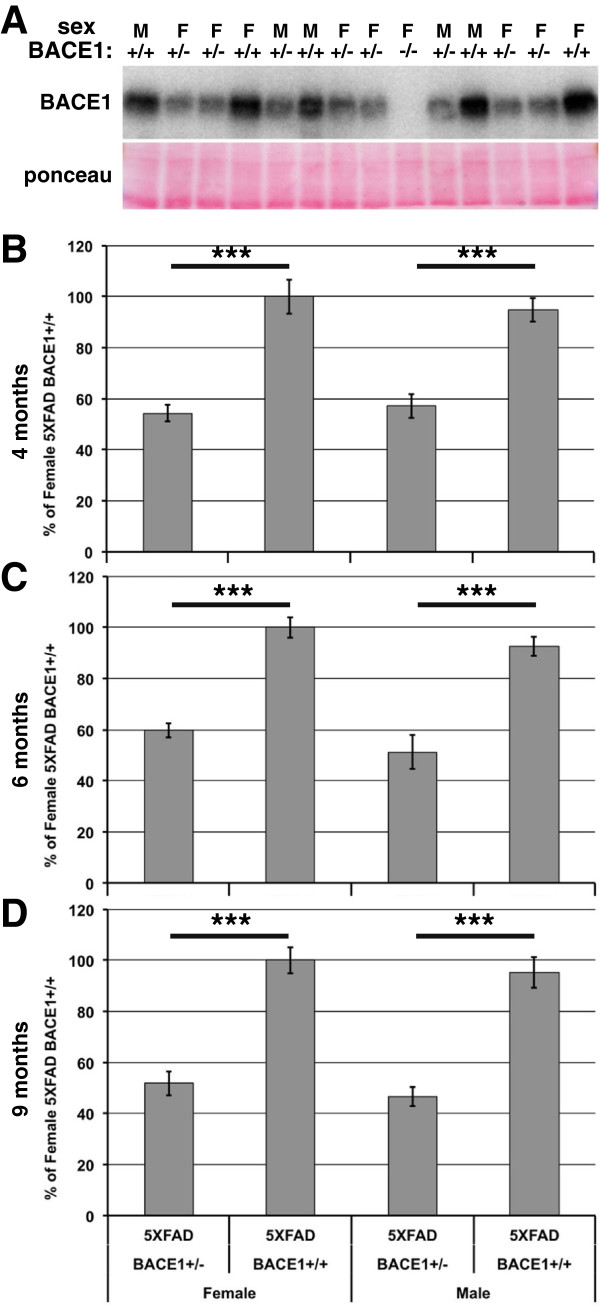
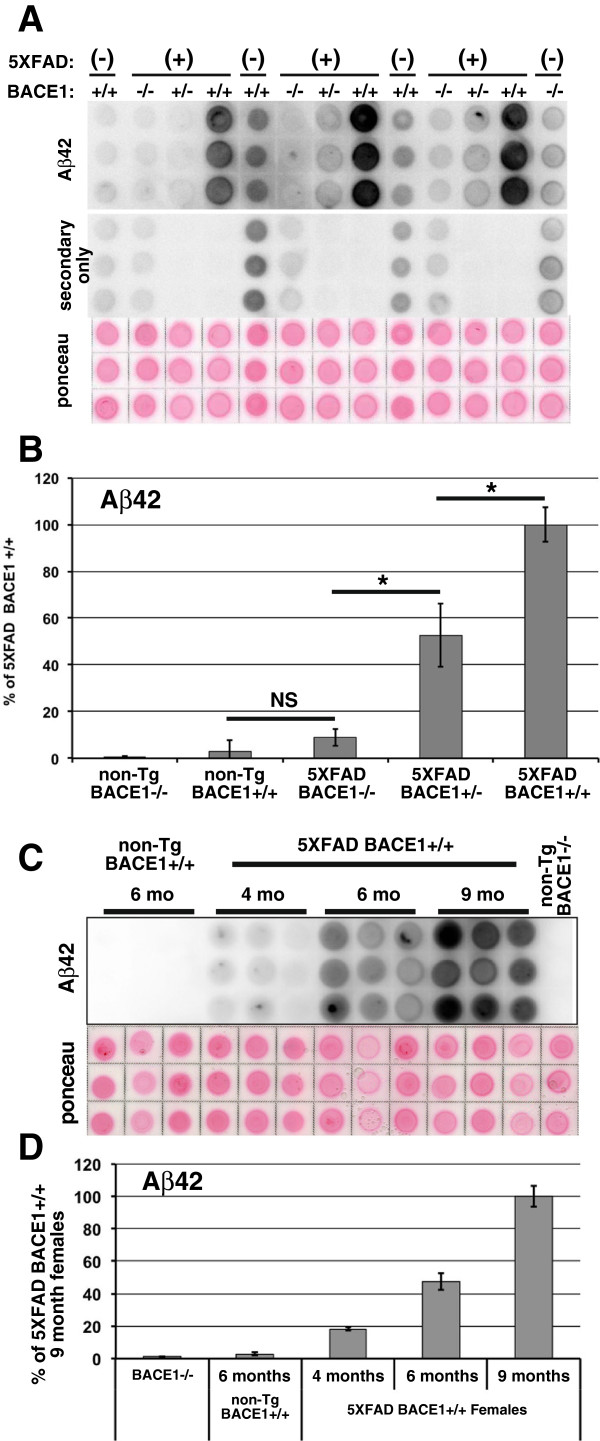
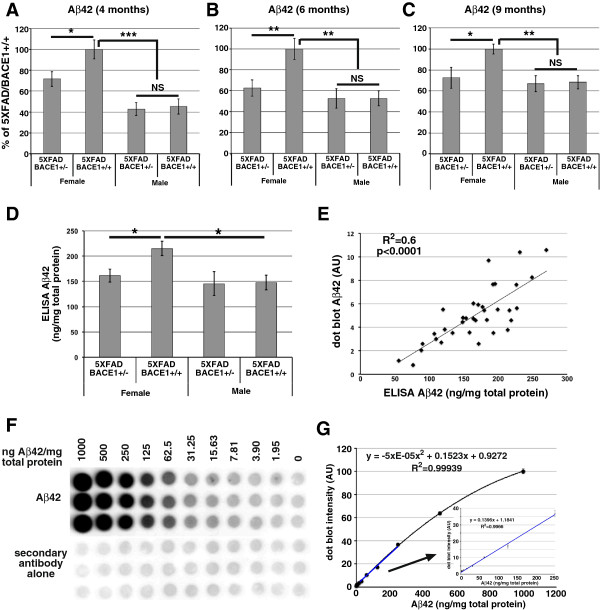
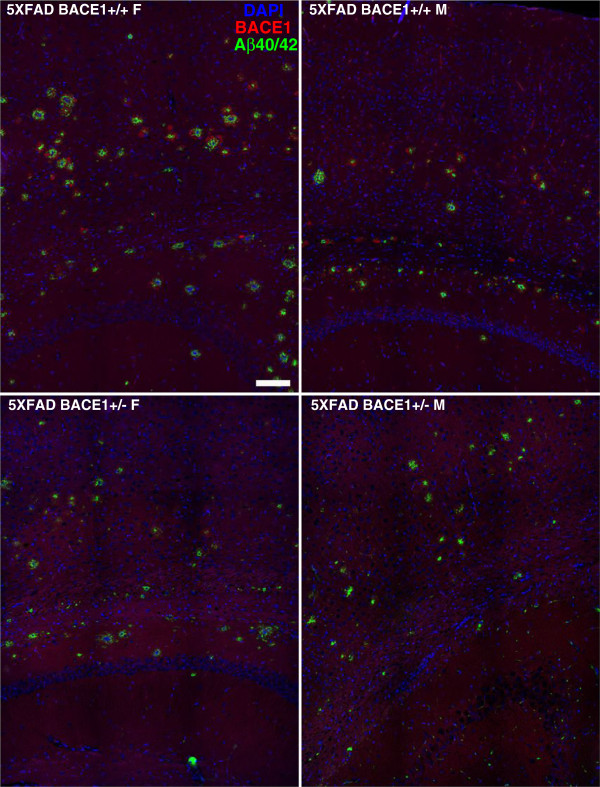
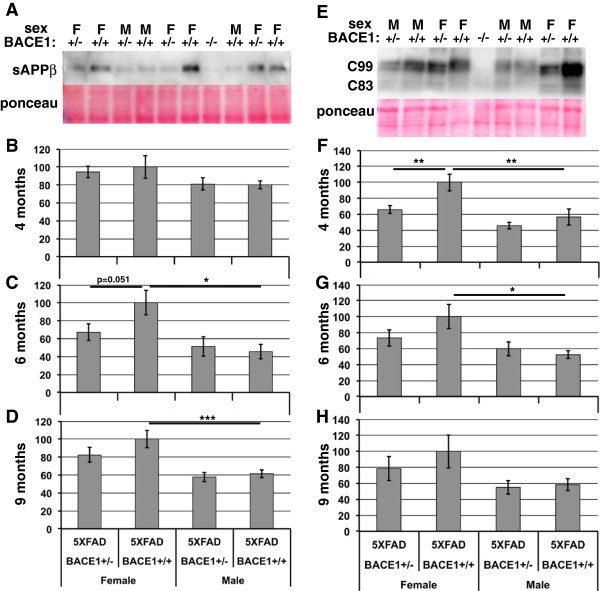
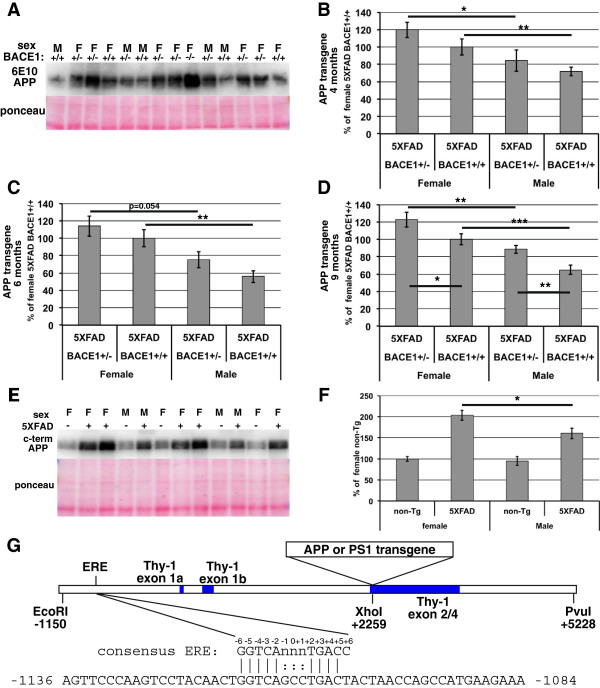
BACKGROUND: The β-secretase, BACE1, cleaves APP to initiate generation of the β-amyloid peptide, Aβ, that comprises amyloid plaques in Alzheimer's disease (AD). Reducing BACE1 activity is an attractive therapeutic approach to AD, but complete inhibition of BACE1 could have mechanism-based side-effects as BACE1-/- mice show deficits in axon guidance, myelination, memory, and other neurological processes. Since BACE1+/- mice appear normal there is interest in determining whether 50% reduction in BACE1 is potentially effective in preventing or treating AD. APP transgenic mice heterozygous for BACE1 have decreased Aβ but the extent of reduction varies greatly from study to study. Here we assess the effects of 50% BACE1 reduction on the widely used 5XFAD mouse model of AD. RESULTS: 50% BACE1 reduction reduces Aβ42, plaques, and BACE1-cleaved APP fragments in female, but not in male, 5XFAD/BACE1+/- mice. 5XFAD/BACE1+/+ females have higher levels of Aβ42 and steady-state transgenic APP than males, likely caused by an estrogen response element in the transgene Thy-1 promoter. We hypothesize that higher transgenic APP level in female 5XFAD mice causes BACE1 to no longer be in excess over APP so that 50% BACE1 reduction has a significant Aβ42 lowering effect. In contrast, the lower APP level in 5XFAD males allows BACE1 to be in excess over APP even at 50% BACE1 reduction, preventing lowering of Aβ42 in 5XFAD/BACE1+/- males. We also developed and validated a dot blot assay with an Aβ42-selective antibody as an accurate and cost-effective alternative to ELISA for measuring cerebral Aβ42 levels. CONCLUSIONS: 50% BACE1 reduction lowers Aβ42 in female 5XFAD mice only, potentially because BACE1 is not in excess over APP in 5XFAD females with higher transgene expression, while BACE1 is in excess over APP in 5XFAD males with lower transgene expression. Our results suggest that greater than 50% BACE1 inhibition might be necessary to significantly lower Aβ, given that BACE1 is likely to be in excess over APP in the human brain. Additionally, in experiments using the 5XFAD mouse model, or other Thy-1 promoter transgenic mice, equal numbers of male and female mice should be used, in order to avoid artifactual gender-related differences.
Overview
The claims and statistics of this paper haven’t been checked yet.
Run the check — free, no account needed. It reads the open-access text and checks the sources it cites.
Integrity signals
Registry
Cites
Statistics
Figures
Verification
Claims the paper makes
The claims and statistics of this paper haven’t been checked yet.
Run the check — free, no account needed. It reads the open-access text and checks the sources it cites.
Claims other papers make about this one
Each is checked against this paper’s own text: does it say what the citing paper says it does?
The source backs part of the claim, not all of it — or backs it for a different population, condition or comparison.
In the citing paper
“Consistent with the reported phenotypes of the 5XFAD model17, we found that Aβ accumulation in females was almost double that of males.”
From Effects of SPI1-mediated transcriptome remodeling on Alzheimer's disease-related phenotypes in mouse models of Aβ amyloidosis (2024) · cites this paper as [17]
Experimental — accuracy not yet measuredThe source backs part of the claim, not all of it — or backs it for a different population, condition or comparison.
In the citing paper
“Consistent with the reported phenotypes of the 5XFAD model17, we found that Aβ accumulation in females was almost double that of males.”
From Effects of SPI1-mediated transcriptome remodeling on Alzheimer's disease-related phenotypes in mouse models of Aβ amyloidosis (2024) · cites this paper as [17]
Experimental — accuracy not yet measuredThe cited source says what the claim attributes to it.
In the citing paper
“Because 5XFAD mouse model has a significant sex difference in Aβ levels and amyloid deposition17, we performed all statistical analyses for males and females separately.”
From Effects of SPI1-mediated transcriptome remodeling on Alzheimer's disease-related phenotypes in mouse models of Aβ amyloidosis (2024) · cites this paper as [17]
The cited source says what the claim attributes to it.
In the citing paper
“Because 5XFAD mice are known to have a sex-dependent difference in the extent of amyloid accumulation (25), we designed our study to consider sex difference, analyzing the results separately between male and female mice.”
From Deletion of Abi3 gene locus exacerbates neuropathological features of Alzheimer’s disease in a mouse model of Aβ amyloidosis (2021) · cites this paper as [25]
In the citing paper
“Females also appear to have increased BACE1 activity, a β-secretase processing enzyme which cleaves pAPP and produces pathogenic Aβ fragments [40,41], ultimately leading to increased amyloid plaque burden compared to male 5XFAD mice [41,42].”
From Centella Asiatica Improves Memory and Promotes Antioxidative Signaling in 5XFAD Mice (2019) · cites this paper as [40]
Self-check
Percentages, sums and reported differences re-computed from the paper’s own numbers.
The self-check needs the paper’s full text.
Citations
Cites
Oakley, H., Cole, S. L., Logan, S., Maus, E., Shao, P., Craft, J., Guillozet-Bongaarts, A., Ohno, M., Disterhoft, J., Van Eldik, L., et al. (2006) · The Journal of Neuroscience · doi:10.1523/jneurosci.1202-06.2006 · Cited by 3,530 · cited 5×
“To accomplish these goals, we modeled partial BACE1 inhibition by crossing BACE1 mice [3,5,11] with 5XFAD transgenic mice that exhibit aggressive, early-onset amyloid pathology [27].”
BackgroundMethodInfluentialAlzheimer-type neuropathology in transgenic mice overexpressing V717F β-amyloid precursor protein
Games, D., Adams, D., Alessandrini, R., Barbour, R., Borthelette, P., Blackwell, C., Carr, T., Clemens, J., Donaldson, T., Gillespie, F., et al. (1995) · Nature · doi:10.1038/373523a0 · Cited by 2,516
Citron, M., Oltersdorf, T., Haass, C., McConlogue, L., Hung, A. Y., Seubert, P., Vigo-Pelfrey, C., Lieberburg, I., & Selkoe, D. J. (1992) · Nature · doi:10.1038/360672a0 · Cited by 1,757
BACE1 is the major β-secretase for generation of Aβ peptides by neurons
Cai, H., Wang, Y., McCarthy, D. B., Wen, H., Borchelt, D., Price, D. L., & Wong, P. C. (2001) · Nature Neuroscience · doi:10.1038/85064 · Cited by 1,087
Trafficking and Proteolytic Processing of APP
Haass, C., Kaether, C., Thinakaran, G., & Sisodia, S. (2012) · Cold Spring Harbor Perspectives in Medicine · doi:10.1101/cshperspect.a006270 · Cited by 1,075
Luo, Y., Bolon, B., Kahn, S., Bennett, B. D., Babu-Khan, S., Denis, P., Fan, W., Kha, H., Zhang, J., Gong, Y., et al. (2001) · Nature Neuroscience · doi:10.1038/85059 · Cited by 1,001
The Genetics of Alzheimer's Disease
Bertram, L., & Tanzi, R. E. (2012) · Progress in molecular biology and translational science · doi:10.1016/b978-0-12-385883-2.00008-4 · Cited by 794
The genetics of Alzheimer disease
Tanzi, R. E. (2012) · Cold Spring Harbor Perspectives in Medicine · doi:10.1101/cshperspect.a006296 · Cited by 727
Roberds, S. L. (2001) · Human Molecular Genetics · doi:10.1093/hmg/10.12.1317 · Cited by 705
Control of Peripheral Nerve Myelination by the ß-Secretase BACE1
Willem, M., Garratt, A. N., Novak, B., Citron, M., Kaufmann, S., Rittger, A., DeStrooper, B., Saftig, P., Birchmeier, C., & Haass, C. (2006) · Science · doi:10.1126/science.1132341 · Cited by 703
Cited by
Sorted by citations
Systematic phenotyping and characterization of the 5xFAD mouse model of Alzheimer’s disease.
Forner, S., Kawauchi, S., Balderrama-Gutierrez, G., Kramár, E. A., Matheos, D. P., Phan, J., Javonillo, D. I., Tran, K. M., Hingco, E., da Cunha, C., et al. (2021) · Scientific Data · doi:10.1038/s41597-021-01054-y · Cited by 501
MAPT mutations, tauopathy, and mechanisms of neurodegeneration
Strang, K. H., Golde, T. E., & Giasson, B. I. (2019) · Laboratory Investigation · doi:10.1038/s41374-019-0197-x · Cited by 424
Lee, C. Y. D., Daggett, A., Gu, X., Jiang, L.-L., Langfelder, P., Li, X., Wang, N., Zhao, Y., Park, C. S., Cooper, Y., et al. (2018) · Neuron · doi:10.1016/j.neuron.2018.02.002 · Cited by 396
“Prior studies of APP transgenic models including 5xFAD showed earlier and more severe disease-related phenotypes such as amyloid plaque pathology in female compared to male mice (Oakley et al., 2006; Sadleir et al., 2015), which is reminiscent of sex differences in AD (Mazure and Swendsen, 2016).”
BackgroundResultMechanisms of sex differences in Alzheimer’s disease
Lopez-Lee, C., Torres, E. R. S., Carling, G., & Gan, L. (2024) · Neuron · doi:10.1016/j.neuron.2024.01.024 · Cited by 376
“159 This review primarily focuses on molecular contributors to sex differences in AD-related processes.”
APOE and Alzheimer’s Disease: From Lipid Transport to Physiopathology and Therapeutics
Husain, M. A., Laurent, B., & Plourde, M. (2021) · Frontiers in Neuroscience · doi:10.3389/fnins.2021.630502 · Cited by 353
Alzheimer’s disease, dementia, and stem cell therapy
Duncan, T., & Valenzuela, M. (2017) · Stem Cell Research & Therapy · doi:10.1186/s13287-017-0567-5 · Cited by 347
Altered Gut Microbiome Composition and Tryptic Activity of the 5xFAD Alzheimer’s Mouse Model
Brandscheid, C., Schuck, F., Reinhardt, S., Schäfer, K.-H., Pietrzik, C. U., Grimm, M., Hartmann, T., Schwiertz, A., & Endres, K. (2017) · Journal of Alzheimer s Disease · doi:10.3233/jad-160926 · Cited by 318
“…male 5xFAD animals displayed an early reduced body weight in comparison to wild type littermates: on one hand expression of the transgenes has been reported to be higher in the females due to estrogen-response element of the Thy1 promoter which is used for expression of the transgenes [44].”
Implications of GABAergic Neurotransmission in Alzheimer’s Disease
Li, Y., Sun, H., Chen, Z., Xu, H., Bu, G., & Zheng, H. (2016) · Frontiers in Aging Neuroscience · doi:10.3389/fnagi.2016.00031 · Cited by 282
“…carboxyl terminal fragment (βCTF) will be further cleaved by γ-secretase within the cell membrane, releasing neurotoxic Aβ peptides and amyloid intracellular domain (AICD; Li et al., 2014; Ohki et al., 2014; Jung et al., 2015; Neumann et al., 2015; Sadleir et al., 2015; Zhang et al., 2015).”
BackgroundInfluentialBahn, G., Park, J.-S., Yun, U. J., Lee, Y. J., Choi, Y., Park, J. S., Baek, S. H., Choi, B. Y., Cho, Y. S., Kim, H. K., et al. (2019) · Proceedings of the National Academy of Sciences · doi:10.1073/pnas.1819541116 · Cited by 210
Neuner, S. M., Heuer, S. E., Huentelman, M. J., O’Connell, K. M. S., & Kaczorowski, C. C. (2019) · Neuron · doi:10.1016/j.neuron.2018.11.040 · Cited by 202
“The lack of a sex difference on either transgene expression or amyloid levels is in contrast to a previous report using a single genetic background demonstrating the 5XFAD transgene is differentially expressed based on sex (Sadleir et al., 2015), suggesting that sex-specific effects may vary across genetic backgrounds.”
Systematic Phenotyping and Characterization of the 3xTg-AD Mouse Model of Alzheimer’s Disease
Javonillo, D. I., Tran, K. M., Phan, J., Hingco, E., Kramár, E. A., da Cunha, C., Forner, S., Kawauchi, S., Milinkeviciute, G., Gomez-Arboledas, A., et al. (2022) · Frontiers in Neuroscience · doi:10.3389/fnins.2021.785276 · Cited by 203
Updates on mouse models of Alzheimer’s disease
Zhong, M. Z., Peng, T., Duarte, M. L., Wang, M., & Cai, D. (2024) · Molecular Neurodegeneration · doi:10.1186/s13024-024-00712-0 · Cited by 189
“Additionally, amyloid pathology was more severe in females than in males, possibly because of an estrogen response element in the Thy-1 promoter [78–80].”
BackgroundMolecular and cellular pathways contributing to brain aging
Zia, A., Pourbagher‐Shahri, A. M., Farkhondeh, T., & Samarghandian, S. (2021) · Behavioral and Brain Functions · doi:10.1186/s12993-021-00179-9 · Cited by 195
Rocchi, A., Yamamoto, S., Ting, T., Fan, Y., Sadleir, K., Wang, Y., Zhang, W., Huang, S., Levine, B., Vassar, R., et al. (2017) · PLOS Genetics · doi:10.1371/journal.pgen.1006962 · Cited by 166
Self-citationTargeting Amyloidogenic Processing of APP in Alzheimer’s Disease
Zhao, J., Liu, X., Xia, W., Zhang, Y., & Wang, C. (2020) · Frontiers in Molecular Neuroscience · doi:10.3389/fnmol.2020.00137 · Cited by 178
Soluble phospho-tau from Alzheimer’s disease hippocampus drives microglial degeneration
Sanchez-Mejias, E., Navarro, V., Jimenez, S., Sanchez-Mico, M., Sanchez-Varo, R., Nuñez-Diaz, C., Trujillo-Estrada, L., Davila, J. C., Vizuete, M., Gutierrez, A., et al. (2016) · Acta Neuropathologica · doi:10.1007/s00401-016-1630-5 · Cited by 175
Ellwanger, D. C., Wang, S., Brioschi, S., Shao, Z., Green, L. B., Case, R. B., Yoo, D., Weishuhn, D., Rathanaswami, P., Bradley, J., et al. (2021) · Proceedings of the National Academy of Sciences · doi:10.1073/pnas.2017742118 · Cited by 144
Hoeijmakers, L., Ruigrok, S. R., Amelianchik, A., Ivan, D., van Dam, A.-M., Lucassen, P. J., & Korosi, A. (2017) · Brain, Behavior, and Immunity · doi:10.1016/j.bbi.2016.12.023 · Cited by 138
Rijsketic, D. R., Wu, J., Geva, M., Kusko, R. L., Grossman, I., Hayden, M. R., & Борисович, Б. И. (2016) · Neurobiology of Disease · doi:10.1016/j.nbd.2016.10.006 · Cited by 132
Hu, X., Das, B., Hou, H., He, W., & Yan, R. (2018) · The Journal of Experimental Medicine · doi:10.1084/jem.20171831 · Cited by 129
“, by 50% in heterozygous BACE1 KO mice, is not sufficient to dramatically reduce amyloid plaques in all age groups (Sadleir et al., 2015).”
Functional regulatory variants implicate distinct transcriptional networks in dementia
Cooper, Y. A., Teyssier, N., Dräger, N. M., Guo, Q., Davis, J. E., Sattler, S. M., Yang, Z., Patel, A. M., Wu, S. J., Kosuri, S., et al. (2022) · Science · doi:10.1126/science.abi8654 · Cited by 121
Southwell, A. L., Smith-Dijak, A., Kay, C., Sepers, M. D., Villanueva, E. B., Parsons, M. P., Xie, Y., Anderson, L. M., Felczak, B., Waltl, S., et al. (2016) · Human Molecular Genetics · doi:10.1093/hmg/ddw212 · Cited by 123
El Gaamouch, F., Audrain, M., Lin, W.-J., Beckmann, N., Jiang, C., Hariharan, S., Heeger, P. S., Schadt, E. E., Gandy, S., Ehrlich, M. E., et al. (2020) · Molecular Neurodegeneration · doi:10.1186/s13024-020-0357-x · Cited by 92
Sex Differences in Behavior and Molecular Pathology in the 5XFAD Model
Sil, A., Erfani, A., Lamb, N., Copland, R., Riedel, G., & Platt, B. (2022) · Journal of Alzheimer's Disease · doi:10.3233/jad-210523 · Cited by 109
Zhu, K., Xiang, X., Filser, S., Marinković, P., Dorostkar, M. M., Crux, S., Neumann, U., Shimshek, D. R., Rammes, G., Haass, C., et al. (2018) · Biological Psychiatry · doi:10.1016/j.biopsych.2016.12.023 · Cited by 107
Gopinath, P. M., Twayana, K. S., Ravanan, P., Thomas, J., Mukherjee, A., Jenkins, D., & Chandrasekaran, N. (2021) · Particle and Fibre Toxicology · doi:10.1186/s12989-021-00428-9 · Cited by 111
The Role of Astrocytic Aquaporin-4 in Synaptic Plasticity and Learning and Memory
Szu, J. I., & Binder, D. K. (2016) · Frontiers in Integrative Neuroscience · doi:10.3389/fnint.2016.00008 · Cited by 117
Desale, S. E., Chidambaram, H., & Chinnathambi, S. (2021) · Molecular Biomedicine · doi:10.1186/s43556-021-00036-1 · Cited by 99
Piras, I. S., Krate, J., Delvaux, E., Nolz, J., Mastroeni, D., Persico, A. M., Jepsen, W. M., Beach, T. G., Huentelman, M. J., & Coleman, P. D. (2019) · Journal of Alzheimer s Disease · doi:10.3233/jad-181113 · Cited by 100
Bundy, J. L., Vied, C., Badger, C., & Nowakowski, R. S. (2019) · Journal of Comparative Neurology · doi:10.1002/cne.24551 · Cited by 90
BACE1 inhibition more effectively suppresses initiation than progression of β-amyloid pathology
Peters, F., Salihoglu, H., Rodrigues, E. F., Herzog, É., Blume, T., Filser, S., Dorostkar, M. M., Shimshek, D. R., Brose, N., Neumann, U., et al. (2018) · Acta Neuropathologica · doi:10.1007/s00401-017-1804-9 · Cited by 86
“This observation is in line with a previous study on β-amyloid deposition in 5XFAD mice [66] and likely caused by the presence of an estrogen response element in the Thy-1 promoter driving expression of APP and PS1 in these transgenic AD mice.”
Age‐related deterioration of motor function in male and female 5xFAD mice from 3 to 16 months of age
O’Leary, T. P., Mantolino, H. M., Stover, K. R., & Brown, R. E. (2018) · Genes Brain & Behavior · doi:10.1111/gbb.12538 · Cited by 90
“…show more ADrelated pathology than males, including increased Aβ-plaque load,33,34 and elevated levels of APP and Aβ-42 as early as 4-6 months of age (Sadleir et al., 2015).31 These sex differences cannot simply be attributed to differences in transgene expression, given similar levels of hAPP and…”
BackgroundCentella Asiatica Improves Memory and Promotes Antioxidative Signaling in 5XFAD Mice
Matthews, D. G., Caruso, M., Murchison, C. F., Zhu, J. Y., Wright, K. M., Harris, C. J., Gray, N. E., Quinn, J. F., & Soumyanath, A. (2019) · Antioxidants · doi:10.3390/antiox8120630 · Cited by 86
“Females also appear to have increased BACE1 activity, a β-secretase processing enzyme which cleaves pAPP and produces pathogenic Aβ fragments [40,41], ultimately leading to increased amyloid plaque burden compared to male 5XFAD mice [41,42].”
BackgroundMaiti, P., Paladugu, L., & Dunbar, G. L. (2018) · BMC Neuroscience · doi:10.1186/s12868-018-0406-3 · Cited by 87
“All mice were genotyped at 3 weeks of age by polymerase chain reaction (PCR) to confirm their transgenic characteristics, as reported previously [41].”
RetractedZhang, J., Zhou, S., Wang, Q., Guo, J., Liang, H., Deng, J.-B., & He, W. (2016) · Neuroscience · doi:10.1016/j.neuroscience.2016.03.024 · Cited by 87
Greve, H. J., Dunbar, A. L., Lombo, C. G., Ahmed, C., Thang, M., Messenger, E. J., Mumaw, C. L., Johnson, J. A., Kodavanti, U. P., Oblak, A. L., et al. (2023) · Brain · doi:10.1093/brain/awac113 · Cited by 82
ApoE-2 Brain-Targeted Gene Therapy Through Transferrin and Penetratin Tagged Liposomal Nanoparticles
Rodrigues, B. D. S., Kanekiyo, T., & Singh, J. (2019) · Pharmaceutical Research · doi:10.1007/s11095-019-2691-7 · Cited by 82
Chen, L., Dar, N. J., Na, R., McLane, K. D., Yoo, K., Han, X., & Ran, Q. (2022) · Free Radical Biology and Medicine · doi:10.1016/j.freeradbiomed.2022.01.002 · Cited by 80
The TGF-β Family inCaenorhabditis elegansPreprint
Savage‐Dunn, C., & Padgett, R. W. (2017) · Cold Spring Harbor Perspectives in Biology · doi:10.1101/cshperspect.a022178 · Cited by 76
Gold, B. T., Shao, X., Sudduth, T. L., Jicha, G. A., Wilcock, D. M., Seago, E. R., & Wang, D. J. J. (2021) · Alzheimer s & Dementia · doi:10.1002/alz.12357 · Cited by 80
Endothelial Control of Cerebral Blood Flow
Ashby, J. W., & Mack, J. J. (2021) · American Journal Of Pathology · doi:10.1016/j.ajpath.2021.02.023 · Cited by 87
Maiti, P., Hall, T. C., Paladugu, L., Kolli, N., Learman, C. R., Rossignol, J., & Dunbar, G. L. (2016) · Histochemistry and Cell Biology · doi:10.1007/s00418-016-1464-1 · Cited by 76
“All mice were genotyped at 3 weeks of age by polymerase chain reaction (PCR) to confirm their transgenic characteristics, as reported previously (Sadleir et al. 2015).”
MethodMelatonin as a mitochondrial protector in neurodegenerative diseases
Wongprayoon, P., & Govitrapong, P. (2017) · Cellular and Molecular Life Sciences · doi:10.1007/s00018-017-2614-x · Cited by 76
Johnson, E. C. B., Ho, K., Yu, G.-Q., Das, M., Sanchez, P. E., Djukic, B., Lopez, I., Yu, X., Gill, M., Zhang, W., et al. (2020) · Molecular Neurodegeneration · doi:10.1186/s13024-020-00393-5 · Cited by 73
Loss of Ataxin-1 Potentiates Alzheimer’s Pathogenesis by Elevating Cerebral BACE1 Transcription
Suh, J., Romano, D., Nitschke, L., Herrick, S. P., DiMarzio, B. A., Dzhala, V. I., Bae, J., Oram, M. K., Zheng, Y., Hooli, B. V., et al. (2019) · Cell · doi:10.1016/j.cell.2019.07.043 · Cited by 68
“APP-CTFβ levels were higher in female than male, as previously reported in other AD mouse models (Sadleir et al., 2015; Schafer et al., 2007), and modestly increased in APP-PS1/ATXN1-KO mice as compared to the same sex of APP-PS1 mice (Figures 3D and 3E).”
ResultLiebsch, F., Kulic, L., Teunissen, C., Shobo, A., Ulku, I., Engelschalt, V., Hancock, M. A., van der Flier, W. M., Kunach, P., Rosa-Neto, P., et al. (2019) · Nature Communications · doi:10.1038/s41467-019-10152-w · Cited by 68
Rare TREM2 variants associated with Alzheimer’s disease display reduced cell surface expression
Sirkis, D. W., Bonham, L. W., Aparicio, R. E., Geier, E. G., Ramos, E. M., Wang, Q., Karydas, A., Miller, Z. A., Miller, B. L., Coppola, G., et al. (2016) · Acta Neuropathologica Communications · doi:10.1186/s40478-016-0367-7 · Cited by 61
O’Leary, T. P., & Brown, R. E. (2022) · Genes Brain & Behavior · doi:10.1111/gbb.12794 · Cited by 61
Shukla, A., McIntyre, L. L., Marsh, S. E., Schneider, C. A., Hoover, E. M., Walsh, C. M., Lodoen, M. B., Blurton-Jones, M. M., & Inlay, M. A. (2018) · Glia · doi:10.1002/glia.23575 · Cited by 59
Matthews, D. G., Caruso, M. A., Magaña, A. A., Wright, K. M., Maier, C. S., Stevens, J. F., Gray, N. E., Quinn, J. F., & Soumyanath, A. (2020) · Nutrients · doi:10.3390/nu12113488 · Cited by 59
Karahan, H., Smith, D. C., Kim, B., Dabin, L. C., Al-Amin, M. M., Wijeratne, H. R. S., Pennington, T., Viana di Prisco, G., McCord, B., Lin, P. B.-C., et al. (2021) · Science Advances · doi:10.1126/sciadv.abe3954 · Cited by 53
Rajani, R. M., Ellingford, R., Hellmuth, M., Harris, S. S., Taso, O. S., Graykowski, D., Lam, F. K. W., Arber, C., Fertan, E., Danial, J. S. H., et al. (2024) · PLOS Biology · doi:10.1371/journal.pbio.3002727 · Cited by 62
Singh, S., & Kumar, P. (2017) · Neuroscience Research · doi:10.1016/j.neures.2017.10.006 · Cited by 56
ER stress is not elevated in the 5XFAD mouse model of Alzheimer's disease
Sadleir, K. R., Popović, J., & Vassar, R. J. (2018) · Journal of Biological Chemistry · doi:10.1074/jbc.ra118.005769 · Cited by 61
“Therefore, we subtracted the signal of the secondary antibody alone from the A 42 signal before normalizing to Ponceau stain intensity (21).”
BackgroundMethodInfluentialAndrew, R. J., De Rossi, P., Nguyen, P., Kowalski, H. R., Recupero, A. J., Guerbette, T., Krause, S. V., Rice, R. C., Laury-Kleintop, L., Wagner, S. L., et al. (2019) · Journal of Biological Chemistry · doi:10.1074/jbc.ra118.006379 · Cited by 55
“It has previously been reported that in the 5XFAD line, females develop pathology at an earlier time point than males because of the presence of an estrogen response element in the transgene Thy-1 promoter (33, 34) and thus only mice of the same sex were directly compared.”
BackgroundChambers, N., Lanza, K., & Bishop, C. (2020) · Frontiers in Pharmacology · doi:10.3389/fphar.2019.01494 · Cited by 58
Song, Z., Xie, X., Chen, Y., Zhang, B., Li, X., Yang, Y., Mo, W., Zhang, J., & Xu, D. (2025) · Immunity · doi:10.1016/j.immuni.2025.07.024 · Cited by 62
Quan, Q., Qian, Y., Li, X., & Li, M. (2019) · Frontiers in Aging Neuroscience · doi:10.3389/fnagi.2019.00178 · Cited by 59
“The former degrades Aβ (Li et al., 2015), whereas the latter hydrolyzes APP to produce Aβ (Sadleir et al., 2015).”
BackgroundPoon, C. H., Wong, S. T. N., Roy, J., Wang, Y., Chan, H. W. H., Steinbusch, H. W. M., Blokland, A., Temel, Y., Aquili, L., & Lim, L. W. (2023) · Cells · doi:10.3390/cells12050780 · Cited by 58
“This sex difference has been hypothesised to be due to the effects of oestrogen on the oestrogen response element in the Thy1 promoter used to drive transgene expression in 5xFAD mice, and thus is an experimental artefact rather than a true physiological difference [12].”
BackgroundInfluentialDarvesh, S., & Reid, G. A. (2016) · Chemico-Biological Interactions · doi:10.1016/j.cbi.2016.04.022 · Cited by 53
Clusterin Is Required for β-Amyloid Toxicity in Human iPSC-Derived Neurons
Robbins, J. P., Perfect, L., Ribé, E. M., Maresca, M., Dangla-Valls, A., Foster, E. M., Killick, R., Nowosiad, P., Reid, M. J., Polit, L. D., et al. (2018) · Frontiers in Neuroscience · doi:10.3389/fnins.2018.00504 · Cited by 53
Expression of BC1 Impairs Spatial Learning and Memory in Alzheimer’s Disease Via APP Translation
Zhang, T., Pang, P., Fang, Z., Guo, Y., Li, H., Li, X., Tian, T., Yang, X., Chen, W., Shu, S., et al. (2018) · Molecular Neurobiology · doi:10.1007/s12035-017-0820-z · Cited by 52
Glymphatic pathways in the gyrencephalic brain
Bèchet, N. B., Shanbhag, N. C., & Lundgaard, I. (2021) · Journal of Cerebral Blood Flow & Metabolism · doi:10.1177/0271678x21996175 · Cited by 58
Xu, M., Xiao, M., Li, S., & Yang, B. (2017) · Advances in experimental medicine and biology · doi:10.1007/978-94-024-1057-0_5 · Cited by 53
Consequences of Pharmacological BACE Inhibition on Synaptic Structure and Function
Zhu, K., Peters, F., Filser, S., & Herms, J. W. (2018) · Biological Psychiatry · doi:10.1016/j.biopsych.2018.04.022 · Cited by 52
Cerebrovascular phenotypes in mouse models of Alzheimer’s disease
Szu, J. I., & Obenaus, A. (2021) · Journal of Cerebral Blood Flow & Metabolism · doi:10.1177/0271678x21992462 · Cited by 49
The role of mTORC1 activation in seizure-induced exacerbation of Alzheimer's disease
Gourmaud, S., Stewart, D. A., Irwin, D. J., Roberts, N., Barbour, A. J., Eberwine, G., O’Brien, W. T., Vassar, R. J., Talos, D. M., & Jensen, F. E. (2021) · Brain · doi:10.1093/brain/awab268 · Cited by 50
Wang, Y., Wu, Z., Bai, Y.-T., Wu, G.-Y., & Chen, G. (2017) · Molecular Neurodegeneration · doi:10.1186/s13024-017-0213-9 · Cited by 47
“The 5xFAD transgene is driven by a Thy-1 promoter, which contains an estrogen responsive element, and is known to display a gender difference in Aβ burden [21]; thus, we kept the female/male ratio comparable cross the 4 genotypes.”
Stress Granules and ALS: A Case of Causation or Correlation?
Fernandes, N., Eshleman, N., & Buchan, J. R. (2018) · Advances in neurobiology · doi:10.1007/978-3-319-89689-2_7 · Cited by 46
Prajapati, S. K., Garabadu, D., & Krishnamurthy, S. (2017) · Neurotoxicity Research · doi:10.1007/s12640-016-9693-6 · Cited by 44
Peters, F., Salihoglu, H., Pratsch, K., Herzog, É., Pigoni, M., Sgobio, C., Lichtenthaler, S. F., Neumann, U., & Herms, J. W. (2019) · The EMBO Journal · doi:10.15252/embj.2019102345 · Cited by 44
“Increased A b deposition is likely caused by the presence of an estrogen response element in the Thy-1 promoter driving expression of APP and PS1 in these transgenic mice (Sadleir et al , 2015).”
Liu, P., Reichl, J. H., Rao, E. R., McNellis, B. M., Huang, E. S., Hemmy, L. S., Forster, C. L., Kuskowski, M. A., Borchelt, D., Vassar, R. J., et al. (2016) · Journal of Alzheimer s Disease · doi:10.3233/jad-161027 · Cited by 41
“Because the kinetics of plaque deposition have been reported to be gender-dependent [13–16], we selected cohorts containing only a single gender within each line; with this criterion, we had available tissue from female 5XFAD mice and from male mice of the other three lines.”
Novel animal model defines genetic contributions for neuron-to-neuron transfer of α-synuclein
Tyson, T., Senchuk, M. M., Cooper, J. F., George, S., Raamsdonk, J. M. V., & Brundin, P. (2017) · Scientific Reports · doi:10.1038/s41598-017-07383-6 · Cited by 45
Borreca, A., Gironi, K., Amadoro, G., & Ammassari‐Teule, M. (2015) · Molecular Neurobiology · doi:10.1007/s12035-015-9229-8 · Cited by 41
El‐Dessouki, A. M., Galal, M. A., Awad, A. S., & Zaki, H. F. (2016) · Molecular Neurobiology · doi:10.1007/s12035-016-0051-8 · Cited by 39
Targeted genetic analysis of cerebral blood flow imaging phenotypes implicates the INPP5D gene
Yao, X., Risacher, S. L., Nho, K., Saykin, A. J., Wang, Z., & Shen, L. (2019) · Neurobiology of Aging · doi:10.1016/j.neurobiolaging.2019.06.003 · Cited by 40
Lazić, D., Tešić, V., Jovanović, M., Brkić, M., Milanović, D., Zloković, B. V., Kanazir, S., & Perović, M. (2020) · Neurobiology of Disease · doi:10.1016/j.nbd.2020.104745 · Cited by 40
“environment or genetic manipulations (Bhattacharya et al., 2014; Devi et al., 2010; Dinkins et al., 2015; Fragkouli et al., 2014; Sadleir et al., 2015).”
Schmid, S., Rammes, G., Blobner, M., Kellermann, K., Bratke, S., Fendl, D., Zhu, K., Schneider, G. H., & Jungwirth, B. (2018) · Behavioural Brain Research · doi:10.1016/j.bbr.2018.11.022 · Cited by 41
Targeting alpha-synuclein via the immune system in Parkinson's disease: Current vaccine therapies
Fleming, S. M., Davis, A., & Simons, E. (2021) · Neuropharmacology · doi:10.1016/j.neuropharm.2021.108870 · Cited by 37
Caminiti, S. P., Carli, G., Avenali, M., Blandini, F., & Perani, D. (2021) · Movement Disorders · doi:10.1002/mds.28818 · Cited by 35
Lee, J., Lee, H., Lee, H. G., Shin, M., Shin, M.-G., Seo, J., Lee, E. J., Park, S. A., & Park, S. (2023) · Nature Communications · doi:10.1038/s41467-023-44319-3 · Cited by 37
Bocharova, O. V., Pandit, N. P., Molesworth, K., Fisher, A., Mychko, O., Makarava, N., & Baskakov, I. V. (2021) · Journal of Biological Chemistry · doi:10.1016/j.jbc.2021.100845 · Cited by 34
“Indeed, female 5XFAD mice generate higher levels of Aβ peptides relative to males (32, 34).”
BackgroundQuintanilla‐Sánchez, C., Schmitt, F. W., Curdt, N., Westhoff, A. C., Bänfer, I. W. H., Bayer, T. A., & Bouter, Y. (2023) · Biomedicines · doi:10.3390/biomedicines11020599 · Cited by 33
Kim, W., Ma, L., Lomoio, S., Willen, R., Lombardo, S., Dong, J., Haydon, P. G., & Tesco, G. (2018) · Molecular Neurodegeneration · doi:10.1186/s13024-018-0239-7 · Cited by 32
“Our findings are in agreement with a previous study showing that female 5XFAD mice have higher steady-state transgenic APP levels than males and proposing that such elevation is due to the presence of an ERE in the 5′ upstream regulatory region of the murine Thy-1 transgene promoter [15].”
InfluentialIntact olfactory memory in the 5xFAD mouse model of Alzheimer’s disease from 3 to 15 months of age
O’Leary, T. P., Stover, K. R., Mantolino, H. M., Darvesh, S., & Brown, R. E. (2020) · Behavioural Brain Research · doi:10.1016/j.bbr.2020.112731 · Cited by 30
Kumar, V., Singh, C., & Singh, A. (2021) · Molecular Biology Reports · doi:10.1007/s11033-021-06787-y · Cited by 32
Bahlakeh, G., Rahbarghazi, R., Mohammadnejad, D., Abedelahi, A., & Karimipour, M. (2021) · Cell & Bioscience · doi:10.1186/s13578-021-00694-2 · Cited by 33
Duwa, R., Jeong, J., & Yook, S. (2021) · Journal of Pharmaceutical Investigation · doi:10.1007/s40005-021-00521-3 · Cited by 31
Roles of TREM2 in Alzheimer’s disease
Qi, X., Zhu, K., Ke, W., Wang, J., Mao, S., & Chen, G. (2025) · Translational Neurodegeneration · doi:10.1186/s40035-025-00515-3 · Cited by 38
“However, it is important to note that many of the sex effects in the 5 × FAD mice may be caused by the Thy-1 driven expression of the transgenes (human APP and PS1 with multiple familial AD mutations) [384].”
Wu, L., Liu, M., Shan, W., Cui, Y., Zhang, Z., & Huang, Y. (2017) · International Journal of Pharmaceutics · doi:10.1016/j.ijpharm.2017.02.015 · Cited by 29
Zhi, D., Wang, D., Yang, W., Duan, Z., Zhu, S., Dong, J., Wang, N., Wang, N., Fei, D., Zhang, Z., et al. (2017) · Scientific Reports · doi:10.1038/s41598-017-11628-9 · Cited by 29
Post-Translational Modifications of BACE1 in Alzheimer's Disease
Wen, W., Li, P., Liu, P., Xu, S., Wang, F., & Huang, J. H. (2021) · Current Neuropharmacology · doi:10.2174/1570159x19666210121163224 · Cited by 33
Influence of membrane lipid composition on the structure and activity of γ-secretase
Aguayo‐Ortiz, R., Straub, J. E., & Domı́nguez, L. (2018) · Physical Chemistry Chemical Physics · doi:10.1039/c8cp04138e · Cited by 29
Wang, H., Wu, M., Diao, J.-L., Li, J., Sun, Y., & Xiao, X. (2019) · Acta Pharmacologica Sinica · doi:10.1038/s41401-019-0257-1 · Cited by 28
“There is a positive correlation between BACE1 levels and plaque numbers in AD brains [59, 60].”
BackgroundCholinergic neurodegeneration in Alzheimer disease mouse models
Shekari, A., & Fahnestock, M. L. (2021) · Handbook of clinical neurology · doi:10.1016/b978-0-12-819973-2.00013-7 · Cited by 30
Kim, B., Dabin, L. C., Tate, M. D., Karahan, H., Sharify, A. D., Acri, D. J., Al-Amin, M. M., Philtjens, S., Smith, D. C., Wijeratne, H. R. S., et al. (2024) · Nature Communications · doi:10.1038/s41467-024-48484-x · Cited by 28
Characterization of Apathy-Like Behaviors in the 5xFAD Mouse Model of Alzheimer's Disease
Keszycki, R. M., Rodríguez, G., Dunn, J. T., Locci, A., Orellana, H., Haupfear, I., Dominguez, S., Fisher, D. W., & Dong, H. (2022) · Neurobiology of Aging · doi:10.1016/j.neurobiolaging.2023.02.012 · Cited by 31
Molecular mechanisms of selective autophagy in Drosophila
Gohel, R., Kournoutis, A., Petridi, S., & Nezis, I. P. (2020) · International review of cytology · doi:10.1016/bs.ircmb.2019.08.003 · Cited by 27
Discovery of Sulforaphane as a Potent BACE1 Inhibitor Based on Kinetics and Computational Studies
Youn, K., Yoon, J.-H., Lee, N., Lim, G., Lee, J., Sang, S., Ho, C., & Jun, M. (2020) · Nutrients · doi:10.3390/nu12103026 · Cited by 27
“It has been demonstrated that BACE1 gene deletion leads to the inhibition of Aβ accumulation and improvement of cognitive impairments in APP transgenic mice [4,5].”
BackgroundQuan, Q., Li, X., Feng, J., Hou, J., Li, M., & Zhang, B. (2020) · Molecular Medicine Reports · doi:10.3892/mmr.2020.11424 · Cited by 26
“a previous study has reported that PParγ inhibits Bace1 expression by binding to the PPre on the Bace1 gene promoter in n2a/aPP695 cells (30), which is an essential enzyme in the generation of aβ as it hydrolyzes aPP to form aβ (31).”
Background
Metadata
- Authors
- Sadleir, K. R., Eimer, W. A., Cole, S. L., & Vassar, R.
- Affiliations
- Northwestern University (US)
- Corresponding author
- Vassar, Robert
- Venue
- Molecular Neurodegeneration
- Published
- 2015-01-07
- Volume
- 10
- Issue
- 1
- Pages
- 1-1
- ISSN
- 1750-1326 (ISSN-L)
- PMC
- PMC4297413
- OpenAlex
- W2137860879
- Cited by
- 213
- References
- 45
- Citations by year
- 2026: 15 · 2025: 18 · 2024: 14 · 2023: 12 · 2022: 12 · 2021: 42 · 2020: 18 · 2019: 22 · 2018: 18 · 2017: 22 · 2016: 18 · 2015: 2
- FWCI
- 14.74
- Type
- journal article
- Language
- en
- Open access
- gold
- doi.org
- Licence
- cc-by
- Locations
- Molecular Neurodegeneration (publishedVersion, cc-by)
- Europe PMC (PubMed Central) (publishedVersion, cc-by)
- PubMed Central (publishedVersion, cc-by)
- PubMed (publishedVersion)
- Funders
- Northwestern University (CA060553, NCI CA060553)
- National Institutes of Health (CA-060553, AG022560, NCI CA060553)
- National Institute on Aging (RF1AG022560, R01AG030142, R01AG022560, 5T32AG00026, F32AG033445)
- National Cancer Institute (CA 060553, NCI CA060553, P30CA060553)
- Topics
- Life Sciences › Neuroscience › Cellular and Molecular Neuroscience › Alzheimer's disease research and treatments
- Health Sciences › Medicine › Psychiatry and Mental health › Dementia and Cognitive Impairment Research
- Life Sciences › Neuroscience › Neurology › Neuroinflammation and Neurodegeneration Mechanisms
- Keywords
- BACE1, amyloid-beta, amyloid-beta 42, 5xFAD mice, Alzheimer's disease, sex differences, estrogen response element, dot blot, amyloid plaques, BACE1 inhibition, axon guidance, myelination, memory impairment
- MeSH terms
- Alzheimer Disease, Animals, Brain, Disease Models, Animal, Heterozygote, Humans, Memory, Mice, Transgenic, Amyloid beta-Peptides, Aspartic Acid Endopeptidases, Mice, Knockout, Amyloid Precursor Protein Secretases, Plaque, Amyloid
About these checks
Registry, retraction, Cites and statistics results are computed, not judged, with one exception: a printed reference that no index lists is read once by a model before it counts as a citation error. Claims are extracted by a model and kept only when their quote appears verbatim in the text; each cited source is then checked, with a model’s help, for whether it says what the claim relies on. Those verdicts can be wrong — read the claim’s quote and the cited source before relying on one.
Statistics and arithmetic are recomputed, not judged.
Confidence bands are shown only for fields calibrated on our annotated test set. None is calibrated yet, so no band is shown.
What counts as a claim ›How we measure confidence ›How we check this ›
Are you an author, or do you see a problem with this page? Request a review
