

The DOI matches its Crossref record; 31 of the 31 references it cites were found in a registry or an index.
Quartz-Seq: a highly reproducible and sensitive single-cell RNA sequencing method, reveals non-genetic gene-expression heterogeneity
Open accessAbstract
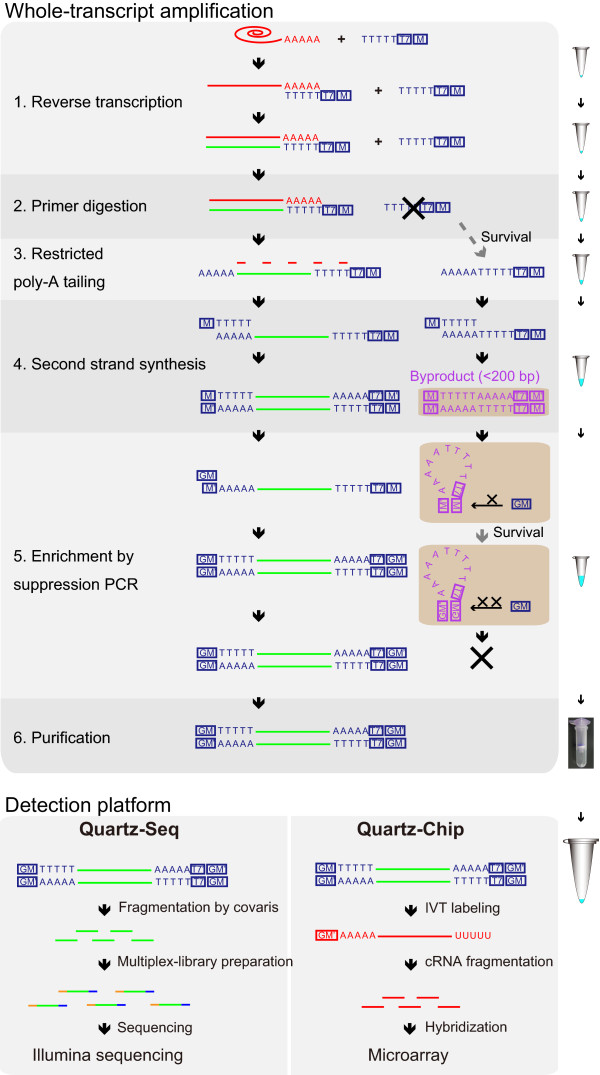
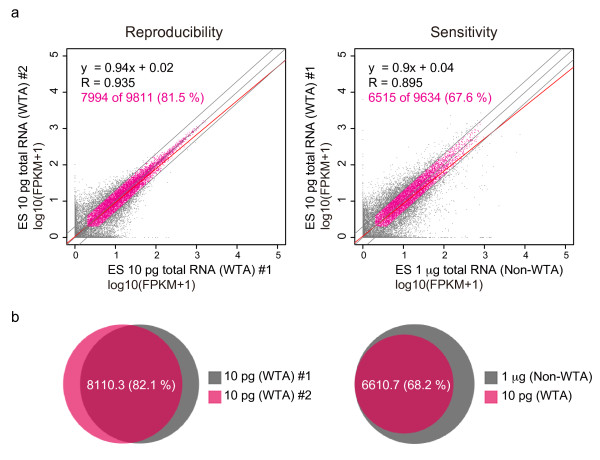
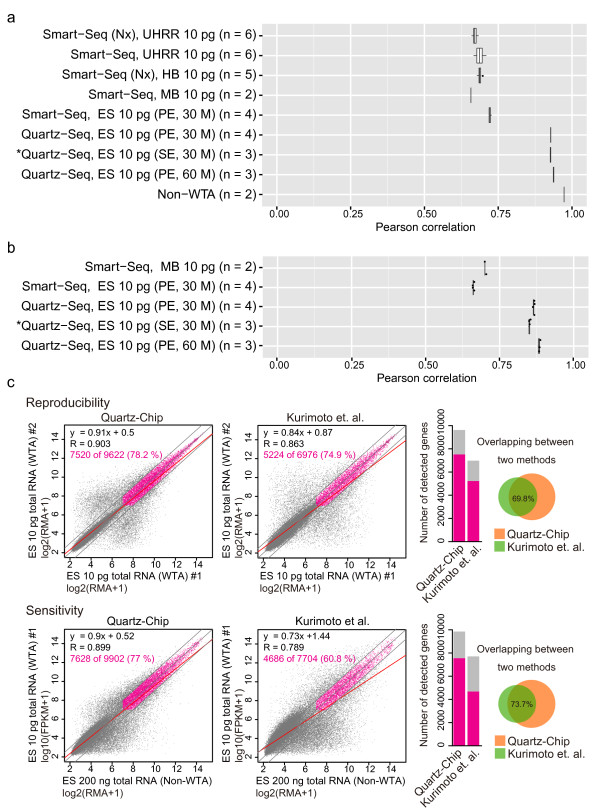
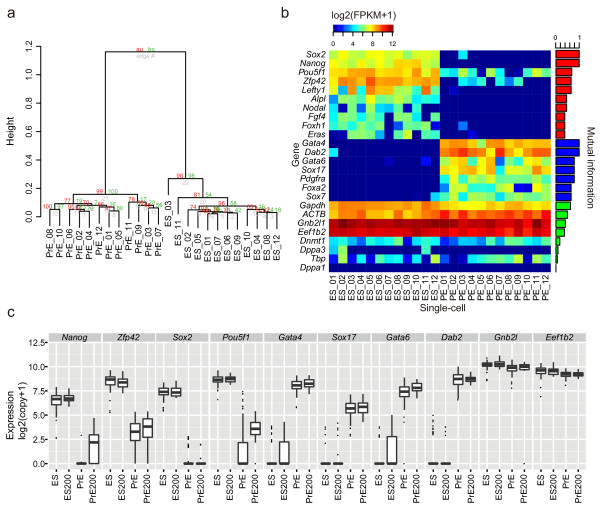
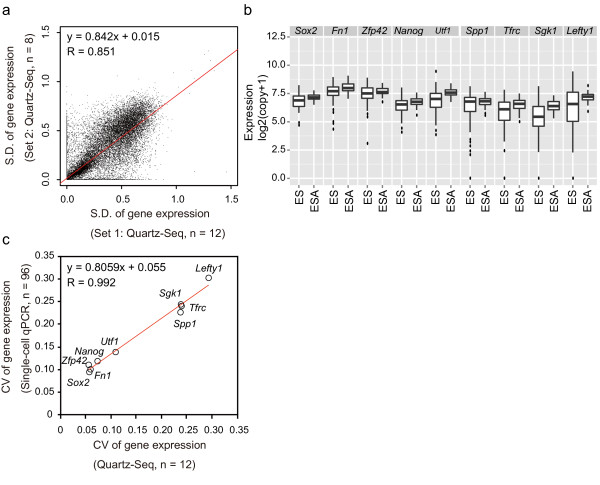
Development of a highly reproducible and sensitive single-cell RNA sequencing (RNA-seq) method would facilitate the understanding of the biological roles and underlying mechanisms of non-genetic cellular heterogeneity. In this study, we report a novel single-cell RNA-seq method called Quartz-Seq that has a simpler protocol and higher reproducibility and sensitivity than existing methods. We show that single-cell Quartz-Seq can quantitatively detect various kinds of non-genetic cellular heterogeneity, and can detect different cell types and different cell-cycle phases of a single cell type. Moreover, this method can comprehensively reveal gene-expression heterogeneity between single cells of the same cell type in the same cell-cycle phase.
Overview
The claims and statistics of this paper haven’t been checked yet.
Run the check — free, no account needed. It reads the open-access text and checks the sources it cites.
Integrity signals
Registry
Cites
Statistics
Figures
Verification
Claims the paper makes
The claims and statistics of this paper haven’t been checked yet.
Run the check — free, no account needed. It reads the open-access text and checks the sources it cites.
Claims other papers make about this one
Each is checked against this paper’s own text: does it say what the citing paper says it does?
In the citing paper
“Several scRNA-seq methods developed in the recent decade have become essential for capturing intercellular variation and its impact on cell functions at the population scale15–19.”
From The technological landscape and applications of single-cell multi-omics (2023) · cites this paper as [19]
Self-check
Percentages, sums and reported differences re-computed from the paper’s own numbers.
The self-check needs the paper’s full text.
Citations
Cites
TopHat: discovering splice junctions with RNA-Seq
Trapnell, C., Pachter, L. S., & Salzberg, S. L. (2009) · Bioinformatics · doi:10.1093/bioinformatics/btp120 · Cited by 11,682
Summaries of Affymetrix GeneChip probe level data
Irizarry, R. A. (2003) · Nucleic Acids Research · doi:10.1093/nar/gng015 · Cited by 4,837
mRNA-Seq whole-transcriptome analysis of a single cell
Tang, F., Barbacioru, C., Wang, Y., Nordman, E., Lee, C., Xu, N., Wang, X., Bodeau, J., Tuch, B. B., Siddiqui, A., et al. (2009) · Nature Methods · doi:10.1038/nmeth.1315 · Cited by 3,969
Quantifying E. coli Proteome and Transcriptome with Single-Molecule Sensitivity in Single Cells
Taniguchi, Y., Choi, P. J., Li, G.-W., Chen, H., Babu, M., Hearn, J., Emili, A., & Xie, X. S. (2010) · Science · doi:10.1126/science.1188308 · Cited by 1,982 · cited 1×
“Although gene-expression heterogeneities have been quantitatively measured for several target genes using single-molecule imaging or singlecell quantitative (q)PCR, comprehensive studies on the quantification of gene-expression heterogeneity are limited [9] and thus further work is required.”
BackgroundImproving RNA-Seq expression estimates by correcting for fragment bias
Roberts, A., Trapnell, C., Donaghey, J., Rinn, J. L., & Pachter, L. (2011) · Genome Biology · doi:10.1186/gb-2011-12-3-r22 · Cited by 1,725
Full-length mRNA-Seq from single-cell levels of RNA and individual circulating tumor cells
Ramsköld, D., Luo, S., Wang, Y.-C., Li, R., Deng, Q., Faridani, O. R., Daniels, G. A., Khrebtukova, I., Loring, J. F., Laurent, L. C., et al. (2012) · Nature Biotechnology · doi:10.1038/nbt.2282 · Cited by 1,609
Functional roles for noise in genetic circuits
Eldar, A., & Elowitz, M. B. (2010) · Nature · doi:10.1038/nature09326 · Cited by 1,482
CEL-seq: single-cell RNA-seq by multiplexed linear amplification
Hashimshony, T., Wagner, F., Sher, N., & Yanai, I. (2012) · Cell Reports · doi:10.1016/j.celrep.2012.08.003 · Cited by 1,231
Transcriptome-wide noise controls lineage choice in mammalian progenitor cells
Chang, H. H., Hemberg, M., Barahona, M., Ingber, D. E., & Huang, S. (2008) · Nature · doi:10.1038/nature06965 · Cited by 1,067
An improved PCR method for walking in uncloned genomic DNA
Siebert, P. D., Chenchik, A. A., Kellogg, D. E., Lukyanov, K. A., & Lukyanov, S. (1995) · Nucleic Acids Research · doi:10.1093/nar/23.6.1087 · Cited by 1,014
Cited by
Sorted by citations
Full-length RNA-seq from single cells using Smart-seq2
Picelli, S., Faridani, O. R., Björklund, Å. K., Winberg, G., Sagasser, S., & Sandberg, R. (2014) · Nature Protocols · doi:10.1038/nprot.2014.006 · Cited by 4,137
Smart-seq2 for sensitive full-length transcriptome profiling in single cells
Picelli, S., Björklund, Å. K., Faridani, O. R., Sagasser, S., Winberg, G., & Sandberg, R. (2013) · Nature Methods · doi:10.1038/nmeth.2639 · Cited by 2,358
Single-cell RNA sequencing technologies and bioinformatics pipelines
Hwang, B., Lee, J. H., & Bang, D. (2018) · Experimental & Molecular Medicine · doi:10.1038/s12276-018-0071-8 · Cited by 1,866
Massively parallel single-cell RNA-seq for marker-free decomposition of tissues into cell types
Jaitin, D. A., Kenigsberg, E., Keren-Shaul, H., Elefant, N., Paul, F., Zaretsky, I., Mildner, A., Cohen, N., Jung, S., Tanay, A., et al. (2014) · Science · doi:10.1126/science.1247651 · Cited by 1,795
The Technology and Biology of Single-Cell RNA Sequencing
Kolodziejczyk, A. A., Kim, J. K., Svensson, V., Marioni, J. C., & Teichmann, S. A. (2015) · Molecular Cell · doi:10.1016/j.molcel.2015.04.005 · Cited by 1,487
Cao, J., Packer, J. S., Ramani, V., Cusanovich, D. A., Huynh, C., Daza, R., Qiu, X., Lee, C., Furlan, S. N., Steemers, F. J., et al. (2017) · doi:10.1101/104844 · Cited by 1,402
Reconstructing lineage hierarchies of the distal lung epithelium using single-cell RNA-seq
Treutlein, B., Brownfield, D. G., Wu, A. R., Neff, N. F., Mantalas, G. L., Espinoza, F. H., Desai, T. J., Krasnow, M. A., & Quake, S. R. (2014) · Nature · doi:10.1038/nature13173 · Cited by 1,342
Single-cell sequencing-based technologies will revolutionize whole-organism science
Shapiro, E., Biezuner, T., & Linnarsson, S. (2013) · Nature Reviews Genetics · doi:10.1038/nrg3542 · Cited by 1,177
Computational and analytical challenges in single-cell transcriptomics
Stegle, O., Teichmann, S. A., & Marioni, J. C. (2015) · Nature Reviews Genetics · doi:10.1038/nrg3833 · Cited by 1,170
Buettner, F., Natarajan, K. N., Casale, F. P., Proserpio, V., Scialdone, A., Theis, F. J., Teichmann, S. A., Marioni, J. C., & Stegle, O. (2015) · Nature Biotechnology · doi:10.1038/nbt.3102 · Cited by 1,136
A practical guide to single-cell RNA-sequencing for biomedical research and clinical applications
Haque, A., Engel, J., Teichmann, S. A., & Lönnberg, T. (2017) · Genome Medicine · doi:10.1186/s13073-017-0467-4 · Cited by 1,071
The technological landscape and applications of single-cell multi-omics
Baysoy, A., Bai, Z., Satija, R., & Fan, R. (2023) · Nature Reviews Molecular Cell Biology · doi:10.1038/s41580-023-00615-w · Cited by 1,037
Single-Cell RNA-Seq Technologies and Related Computational Data Analysis
Chen, G., Ning, B., & Shi, T. (2019) · Frontiers in Genetics · doi:10.3389/fgene.2019.00317 · Cited by 966
Human haematopoietic stem cell lineage commitment is a continuous process
Velten, L., Haas, S. F., Raffel, S., Blaszkiewicz, S., Islam, S., Hennig, B. P., Hirche, C., Lutz, C., Buss, E. C., Nowak, D., et al. (2017) · Nature Cell Biology · doi:10.1038/ncb3493 · Cited by 925
Kukurba, K. R., & Montgomery, S. B. (2015) · Cold Spring Harbor Protocols · doi:10.1101/pdb.top084970 · Cited by 924
Single-cell RNA-seq: advances and future challenges
Saliba, A.-E., Westermann, A. J., Gorski, S. A., & Vogel, J. (2014) · Nucleic Acids Research · doi:10.1093/nar/gku555 · Cited by 847
Single-cell barcoding and sequencing using droplet microfluidics
Žilionis, R., Nainys, J., Veres, A., Savova, V., Zemmour, D., Klein, A. M., & Mažutis, L. (2016) · Nature Protocols · doi:10.1038/nprot.2016.154 · Cited by 735
Validation of noise models for single-cell transcriptomics
Grün, D., Kester, L., & van Oudenaarden, A. (2014) · Nature Methods · doi:10.1038/nmeth.2930 · Cited by 721
Quantitative assessment of single-cell RNA-sequencing methods
Wu, A. R., Neff, N. F., Kalisky, T., Dalerba, P., Treutlein, B., Rothenberg, M. E., Mburu, F. M., Mantalas, G. L., Sim, S., Clarke, M. F., et al. (2014) · Nature Methods · doi:10.1038/nmeth.2694 · Cited by 696
RNA ‐Seq methods for transcriptome analysis
Hrdličková, R., Toloue, M., & Tian, B. (2016) · Wiley Interdisciplinary Reviews - RNA · doi:10.1002/wrna.1364 · Cited by 746
Library construction for next-generation sequencing: Overviews and challenges
Head, S. R., Komori, H. K., LaMere, S. A., Whisenant, T. C., Nieuwerburgh, F. V., Salomon, D. R., & Ordoukhanian, P. T. (2014) · BioTechniques · doi:10.2144/000114133 · Cited by 716
Hou, Y., Guo, H., Cao, C., Li, X., Hu, B., Zhu, P., Wu, X., Wen, L., Tang, F., Huang, Y., et al. (2016) · Cell Research · doi:10.1038/cr.2016.23 · Cited by 647
Design and Analysis of Single-Cell Sequencing Experiments
Grün, D., & van Oudenaarden, A. (2015) · Cell · doi:10.1016/j.cell.2015.10.039 · Cited by 536
Single-cell multiomics: technologies and data analysis methods
Lee, J., Hyeon, D. Y., & Hwang, D. (2020) · Experimental & Molecular Medicine · doi:10.1038/s12276-020-0420-2 · Cited by 524
Benchmarking single-cell RNA-sequencing protocols for cell atlas projects
Mereu, E., Lafzi, A., Moutinho, C., Ziegenhain, C., McCarthy, D. J., Álvarez-Varela, A., Batlle, E., Sagar, Grün, D., Lau, J. K., et al. (2020) · Nature Biotechnology · doi:10.1038/s41587-020-0469-4 · Cited by 499
Self-citationHaas, S., Hansson, J., Klimmeck, D., Loeffler, D., Velten, L., Uckelmann, H., Wurzer, S., Prendergast, Á. M., Schnell, A., Hexel, K., et al. (2015) · Cell Stem Cell · doi:10.1016/j.stem.2015.07.007 · Cited by 471
Combinatorial labeling of single cells for gene expression cytometry
Fan, H. C., Fu, G. K., & Fodor, S. P. A. (2015) · Science · doi:10.1126/science.1258367 · Cited by 455
Design and computational analysis of single-cell RNA-sequencing experiments
Bacher, R. L., & Kendziorski, C. M. (2016) · Genome biology · doi:10.1186/s13059-016-0927-y · Cited by 460
Fan, X., Zhang, X., Wu, X., Guo, H., Hu, Y., Tang, F., & Huang, Y. (2015) · Genome biology · doi:10.1186/s13059-015-0706-1 · Cited by 415
Computational assignment of cell-cycle stage from single-cell transcriptome data
Scialdone, A., Natarajan, K. N., Saraiva, L. R., Proserpio, V., Teichmann, S. A., Stegle, O., Marioni, J. C., & Buettner, F. (2015) · Methods · doi:10.1016/j.ymeth.2015.06.021 · Cited by 394
Single-cell RNA sequencing: Technical advancements and biological applications
Hedlund, E., & Deng, Q. (2017) · Molecular Aspects of Medicine · doi:10.1016/j.mam.2017.07.003 · Cited by 410
Single Cell Genomics: Advances and Future Perspectives
Macaulay, I. C., & Voet, T. (2014) · PLoS Genetics · doi:10.1371/journal.pgen.1004126 · Cited by 384
Genome-wide detection of DNase I hypersensitive sites in single cells and FFPE tissue samples
Jin, W., Tang, Q., Wan, M., Cui, K., Zhang, Y., Ren, G., Ni, B., Sklar, J., Przytycka, T. M., Childs, R., et al. (2015) · Nature · doi:10.1038/nature15740 · Cited by 332
Highly multiplexed simultaneous detection of RNAs and proteins in single cells
Frei, A. P., Bava, F.-A., Zunder, E. R., Hsieh, E. W. Y., Chen, S.-Y., Nolan, G. P., & Gherardini, P. F. (2016) · Nature Methods · doi:10.1038/nmeth.3742 · Cited by 330
Lescroart, F., Chabab, S., Lin, X., Rulands, S., Paulissen, C., Rodolosse, A., Auer, H., Achouri, Y., Dubois, C., Bondue, A., et al. (2014) · Nature Cell Biology · doi:10.1038/ncb3024 · Cited by 330
Cancer genomics: one cell at a time
Navin, N. E. (2014) · Genome biology · doi:10.1186/s13059-014-0452-9 · Cited by 318
Disentangling neural cell diversity using single-cell transcriptomics
Poulin, J.-F., Tasic, B., Hjerling-Leffler, J., Trimarchi, J. M., & Awatramani, R. (2016) · Nature Neuroscience · doi:10.1038/nn.4366 · Cited by 293
Hayashi, T., Ozaki, H., Sasagawa, Y., Umeda, M., Danno, H., & Nikaido, I. (2018) · Nature Communications · doi:10.1038/s41467-018-02866-0 · Cited by 284
Self-citationKeren-Shaul, H., Kenigsberg, E., Jaitin, D. A., David, E., Paul, F., Tanay, A., & Amit, I. (2019) · Nature Protocols · doi:10.1038/s41596-019-0164-4 · Cited by 292
Microfluidic single-cell whole-transcriptome sequencing
Streets, A., Zhang, X., Cao, C., Pang, Y., Wu, X., Xiong, L., Yang, L., Fu, Y., Zhao, L., Tang, F., et al. (2014) · Proceedings of the National Academy of Sciences · doi:10.1073/pnas.1402030111 · Cited by 274
Single‐Cell Analysis Using Droplet Microfluidics
Matuła, K., Rivello, F., & Huck, W. T. S. (2019) · Advanced Biosystems · doi:10.1002/adbi.201900188 · Cited by 284
Hughes, T. K., Wadsworth, M. H., Gierahn, T. M., Do, T. H., Weiss, D. I., Andrade, P. R., Ma, F., Silva, B. J. D. A., Shao, S., Tsoi, L. C., et al. (2020) · Immunity · doi:10.1016/j.immuni.2020.09.015 · Cited by 291
Single-cell sequencing techniques from individual to multiomics analyses
Kashima, Y., Sakamoto, Y., Kaneko, K., Seki, M., Suzuki, Y., & Suzuki, A. (2020) · Experimental & Molecular Medicine · doi:10.1038/s12276-020-00499-2 · Cited by 270
Clark, S. J., Smallwood, S. A., Lee, H. J., Krueger, F., Reik, W., & Kelsey, G. (2017) · Nature Protocols · doi:10.1038/nprot.2016.187 · Cited by 270
Ren, G., Jin, W., Cui, K., Rodrigez, J., Hu, G., Zhang, Z., Larson, D. R., & Zhao, K. (2017) · Molecular Cell · doi:10.1016/j.molcel.2017.08.026 · Cited by 265
Ding, S., Chen, X., & Shen, K. (2020) · 癌症:英文版 · doi:10.1002/cac2.12078 · Cited by 275
Non-coding RNAs in cancer: platforms and strategies for investigating the genomic “dark matter”
Grillone, K., Riillo, C., Scionti, F., Rocca, R., Tradigo, G., Guzzi, P. H., Alcaro, S., Martino, M. T. D., Tagliaferri, P., & Tassone, P. (2020) · Journal of Experimental & Clinical Cancer Research · doi:10.1186/s13046-020-01622-x · Cited by 253
Single-cell RNA-sequencing: The future of genome biology is now
Picelli, S. (2016) · RNA Biology · doi:10.1080/15476286.2016.1201618 · Cited by 237
Single-cell transcriptome sequencing: recent advances and remaining challenges
Liu, S., & Trapnell, C. (2016) · F1000Research · doi:10.12688/f1000research.7223.1 · Cited by 230
Cancer proteogenomics: current impact and future prospects
Mani, D. R., Krug, K., Zhang, B., Satpathy, S., Clauser, K. R., Ding, L., Ellis, M., Gillette, M. A., & Carr, S. A. (2022) · Nature Reviews Cancer · doi:10.1038/s41568-022-00446-5 · Cited by 229
Tutorial: guidelines for the experimental design of single-cell RNA sequencing studies
Lafzi, A., Moutinho, C., Picelli, S., & Heyn, H. (2018) · Nature Protocols · doi:10.1038/s41596-018-0073-y · Cited by 218
A distinct subpopulation of CD25 − T-follicular regulatory cells localizes in the germinal centers
Wing, J. B., Kitagawa, Y., Locci, M., Hume, H., Tay, C., Morita, T., Kidani, Y., Matsuda, K., Inoue, T., Kurosaki, T., et al. (2017) · Proceedings of the National Academy of Sciences · doi:10.1073/pnas.1705551114 · Cited by 211
Advances in single-cell RNA sequencing and its applications in cancer research
Huang, D., Ma, N., Li, X., Gou, Y., Duan, Y., Liu, B., Xia, J., Zhao, X., Wang, X., Li, Q., et al. (2023) · Journal of Hematology & Oncology · doi:10.1186/s13045-023-01494-6 · Cited by 224
Kashi, K., Henderson, L., Bonetti, A., & Carninci, P. (2015) · Biochimica et Biophysica Acta (BBA) - Gene Regulatory Mechanisms · doi:10.1016/j.bbagrm.2015.10.010 · Cited by 205
Single-cell sequencing in stem cell biology
Wen, L., & Tang, F. (2016) · Genome biology · doi:10.1186/s13059-016-0941-0 · Cited by 195
Single Cell Multi-Omics Technology: Methodology and Application
Hu, Y., An, Q., Sheu, K. M., Trejo, B. M., Fan, S., & Guo, Y. Q. (2018) · Frontiers in Cell and Developmental Biology · doi:10.3389/fcell.2018.00028 · Cited by 201
Loganathan, T., & Doss, C. G. P. (2023) · Functional & Integrative Genomics · doi:10.1007/s10142-022-00947-4 · Cited by 196
Generation of ovarian follicles from mouse pluripotent stem cells
Yoshino, T., Suzuki, T., Nagamatsu, G., Yabukami, H., Ikegaya, M., Kishima, M., Kita, H., Imamura, T., Nakashima, K., Nishinakamura, R., et al. (2021) · Science · doi:10.1126/science.abe0237 · Cited by 188
Lee, M.-C. W., López-Díaz, F. J., Khan, S. Y., Tariq, M., Dayn, Y., Vaske, C. J., Radenbaugh, A., Kim, H. J., Emerson, B. M., & Pourmand, N. (2014) · Proceedings of the National Academy of Sciences · doi:10.1073/pnas.1404656111 · Cited by 174
Separation and parallel sequencing of the genomes and transcriptomes of single cells using G&T-seq
Macaulay, I. C., Teng, M. J., Haerty, W., Kumar, P., Ponting, C. P., & Voet, T. (2016) · Nature Protocols · doi:10.1038/nprot.2016.138 · Cited by 170
The Evolution of Single-Cell RNA Sequencing Technology and Application: Progress and Perspectives
Wang, S., Sun, S.-T., Zhang, X., Ding, H.-R., Yu, Y., He, J., Wang, M.-S., Yang, B., & Li, Y. (2023) · International Journal of Molecular Sciences · doi:10.3390/ijms24032943 · Cited by 183
Reconstructing cell cycle pseudo time-series via single-cell transcriptome data
Liu, Z., Lou, H., Xie, K., Wang, H. E., Chen, N., Aparicio, O. M., Zhang, M. Q., Jiang, R., & Chen, T. (2017) · Nature Communications · doi:10.1038/s41467-017-00039-z · Cited by 160
Satoh‐Takayama, N., Kato, T., Motomura, Y., Kageyama, T., Taguchi‐Atarashi, N., Kinoshita-Daitoku, R., Kuroda, E., Santo, J. P. D., Mimuro, H., Moro, K., et al. (2020) · Immunity · doi:10.1016/j.immuni.2020.03.002 · Cited by 149
Understanding cell‐cell communication and signaling in the colorectal cancer microenvironment
AlMusawi, S., Ahmed, M., & Nateri, A. S. (2021) · Clinical and Translational Medicine · doi:10.1002/ctm2.308 · Cited by 153
SIDR: simultaneous isolation and parallel sequencing of genomic DNA and total RNA from single cells
Han, K. Y., Kim, K.-T., Joung, J.-G., Son, D.-S., Kim, Y. J., Jo, A., Jeon, H.-J., Moon, H.-S., Yoo, C. E., Chung, W., et al. (2018) · Genome Research · doi:10.1101/gr.223263.117 · Cited by 143
LncRNAs: From Basic Research to Medical Application
Wu, T., & Du, Y. (2017) · International Journal of Biological Sciences · doi:10.7150/ijbs.16968 · Cited by 140
Sasagawa, Y., Danno, H., Takada, H., Ebisawa, M., Tanaka, K. Y., Hayashi, T., Kurisaki, A., & Nikaido, I. (2018) · Genome biology · doi:10.1186/s13059-018-1407-3 · Cited by 135
Self-citationMaenohara, S., Unoki, M., Toh, H., Ohishi, H., Sharif, J., Koseki, H., & Sasaki, H. (2017) · PLoS Genetics · doi:10.1371/journal.pgen.1007042 · Cited by 136
Deciphering Tumour Heterogeneity: From Tissue to Liquid Biopsy
Gilson, P., Merlin, J., & Harlé, A. (2022) · Cancers · doi:10.3390/cancers14061384 · Cited by 138
Single-cell omics in ageing: a young and growing field
He, X., Memczak, S., Qu, J. T., Belmonte, J. C. I., & Liu, G. (2020) · Nature Metabolism · doi:10.1038/s42255-020-0196-7 · Cited by 129
Manifold learning-based methods for analyzing single-cell RNA-sequencing data
Moon, K. R., Stanley, J. S., Burkhardt, D. B., van Dijk, D., Wolf, G., & Krishnaswamy, S. (2017) · Current Opinion in Systems Biology · doi:10.1016/j.coisb.2017.12.008 · Cited by 133
Understanding development and stem cells using single cell-based analyses of gene expression
Kumar, P., Tan, Y., & Cahan, P. (2017) · Development · doi:10.1242/dev.133058 · Cited by 117
Single-Cell Sequencing for Precise Cancer Research: Progress and Prospects
Zhang, X., Marjani, S. L., Hu, Z., Weissman, S. M., Pan, X., & Wu, S. (2016) · Cancer Research · doi:10.1158/0008-5472.can-15-1907 · Cited by 122
Dissecting Cellular Heterogeneity Using Single-Cell RNA Sequencing.
Choi, Y. H., & Kim, J. K. (2019) · Europe PMC (PubMed Central) · doi:10.14348/molcells.2019.2446 · Cited by 126
SC3-seq: a method for highly parallel and quantitative measurement of single-cell gene expression
Nakamura, T., Yabuta, Y., Okamoto, I., Aramaki, S., Yokobayashi, S., Kurimoto, K., Sekiguchi, K., Nakagawa, M., Yamamoto, T., & Saitou, M. (2015) · Nucleic Acids Research · doi:10.1093/nar/gkv134 · Cited by 120
Single cell analysis of cancer genomes
Loo, P. V., & Voet, T. (2014) · Current Opinion in Genetics & Development · doi:10.1016/j.gde.2013.12.004 · Cited by 118
From tissues to cell types and back: single-cell gene expression analysis of tissue architecture
Chen, X., Teichmann, S. A., & Meyer, K. B. (2018) · Annual Review of Biomedical Data Science · doi:10.1146/annurev-biodatasci-080917-013452 · Cited by 112
Fast and accurate single-cell RNA-seq analysis by clustering of transcript-compatibility counts
Ntranos, V., Kamath, G. M., Zhang, J. M., Pachter, L. S., & Tse, D. N. C. (2016) · Genome biology · doi:10.1186/s13059-016-0970-8 · Cited by 110
Constrained vertebrate evolution by pleiotropic genes
Hu, H., Uesaka, M., Guo, S., Shimai, K., Lu, T.-M., Li, F., Fujimoto, S., Ishikawa, M., Liu, S., Sasagawa, Y., et al. (2017) · Nature Ecology & Evolution · doi:10.1038/s41559-017-0318-0 · Cited by 106
Self-citationSingle-Cell Transcriptional Analysis
Wu, A. R., Wang, J., Streets, A., & Huang, Y. (2017) · Annual Review of Analytical Chemistry · doi:10.1146/annurev-anchem-061516-045228 · Cited by 107
Sun, Y., & Chen, Y.-Q. (2020) · Journal of Hematology & Oncology · doi:10.1186/s13045-020-00945-8 · Cited by 114
Alternative Polyadenylation: Methods, Findings, and Impacts
Chen, W., Jia, Q., Song, Y., Fu, H., Wei, G., & Ni, T. (2017) · Genomics Proteomics & Bioinformatics · doi:10.1016/j.gpb.2017.06.001 · Cited by 108
Cherif, H., Mannarino, M., Pacis, A., Ragoussis, J., Rabau, O., Ouellet, J. A., & Haglund, L. (2022) · International Journal of Molecular Sciences · doi:10.3390/ijms23073993 · Cited by 105
Identifying and removing the cell-cycle effect from single-cell RNA-Sequencing data
Barron, M., & Li, J. (2016) · Scientific Reports · doi:10.1038/srep33892 · Cited by 105
Wang, M., Song, W., Chen, M., Wang, Q., Zhou, X., Xu, P., Krek, A., Yoon, Y., Ho, L., Orr, M. E., et al. (2022) · Molecular Neurodegeneration · doi:10.1186/s13024-022-00517-z · Cited by 104
Single-Cell Sequencing Technologies: Current and Future
Liang, J., Cai, W., & Sun, Z. S. (2014) · Journal of genetics and genomics/Journal of Genetics and Genomics · doi:10.1016/j.jgg.2014.09.005 · Cited by 101
Advances in single-cell RNA sequencing and its applications in cancer research
Zhu, S., Qing, T., Zheng, Y., Li, J., & Shi, L. M. (2017) · Oncotarget · doi:10.18632/oncotarget.17893 · Cited by 98
Inferring Cell-State Transition Dynamics from Lineage Trees and Endpoint Single-Cell Measurements
Hormoz, S., Singer, Z. S., Linton, J. M., Antebi, Y. E., Shraiman, B. I., & Elowitz, M. B. (2016) · Cell Systems · doi:10.1016/j.cels.2016.10.015 · Cited by 94
Innate Lymphoid Cells in the Induction of Obesity
Sasaki, T., Moro, K., Kubota, T., Kubota, N., Kato, T., Ohno, H., Nakae, S., Saito, H., & Koyasu, S. (2019) · Cell Reports · doi:10.1016/j.celrep.2019.06.016 · Cited by 90
Single-cell sequencing technology applied to epigenetics for the study of tumor heterogeneity
Hu, Y., Shen, F., Yang, X., Han, T., Long, Z., Wen, J., Huang, J., Shen, J., & Guo, Q. (2023) · Clinical Epigenetics · doi:10.1186/s13148-023-01574-x · Cited by 101
Microfluidics for Neuronal Cell and Circuit Engineering
Habibey, R., Arias, J. E. R., Striebel, J., & Busskamp, V. (2022) · Chemical Reviews · doi:10.1021/acs.chemrev.2c00212 · Cited by 88
Kawai, H., Kawaguchi, D., Kuebrich, B. D., Kitamoto, T., Yamaguchi, M., Gotoh, Y., & Furutachi, S. (2017) · The Journal of Neuroscience · doi:10.1523/jneurosci.0001-17.2017 · Cited by 85
Technical Variations in Low-Input RNA-seq Methodologies
Bhargava, V., Head, S. R., Ordoukhanian, P. T., Mercola, M. A., & Subramaniam, S. (2014) · Scientific Reports · doi:10.1038/srep03678 · Cited by 86
Dynamics in Transcriptomics: Advancements in RNA-seq Time Course and Downstream Analysis
Spies, D., & Ciaudo, C. (2015) · Computational and Structural Biotechnology Journal · doi:10.1016/j.csbj.2015.08.004 · Cited by 86
Machine Intelligence in Single-Cell Data Analysis: Advances and New Challenges
Liu, J., Fan, Z., Zhao, W., & Zhou, X. (2021) · Frontiers in Genetics · doi:10.3389/fgene.2021.655536 · Cited by 86
Single-cell omics: experimental workflow, data analyses and applications
Sun, F., Li, H., Sun, D., Fu, S., Gu, L., Shao, X., Wang, Q., Dong, X., Duan, B., Xing, F., et al. (2024) · Science China Life Sciences · doi:10.1007/s11427-023-2561-0 · Cited by 90
den Akker, S. E., Lilley, C. J., Jones, J. T., & Urwin, P. E. (2014) · PLoS Pathogens · doi:10.1371/journal.ppat.1004391 · Cited by 80
Guo, G., Pinello, L., Han, X., Lai, S., Shen, L., Lin, T.-W., Zou, K., Yuan, G., & Orkin, S. H. (2016) · Cell Reports · doi:10.1016/j.celrep.2015.12.089 · Cited by 82
Single‐cell technologies are revolutionizing the approach to rare cells
Proserpio, V., & Lönnberg, T. (2015) · Immunology and Cell Biology · doi:10.1038/icb.2015.106 · Cited by 77
Variation is function: Are single cell differences functionally important?
Dueck, H., Eberwine, J. H., & Kim, J. (2015) · BioEssays · doi:10.1002/bies.201500124 · Cited by 84
Metadata
- Authors
- Sasagawa, Y., Nikaido, I., Hayashi, T., Danno, H., Uno, K. D., Imai, T., & Ueda, H. R.
- Affiliations
- RIKEN (JP)
- Japan Science and Technology Agency (JP)
- Corresponding author
- Sasagawa, Yohei
- Nikaido, Itoshi
- Ueda, Hiroki R
- Venue
- Genome Biology
- Published
- 2013-04-17
- Volume
- 14
- Issue
- 4
- Pages
- 9-9
- ISSN
- 1465-6906 (ISSN-L)
- 1474-760X
- PMC
- PMC4054835
- OpenAlex
- W2045317504
- Cited by
- 455
- References
- 31
- Citations by year
- 2026: 14 · 2025: 16 · 2024: 33 · 2023: 30 · 2022: 46 · 2021: 35 · 2020: 40 · 2019: 54 · 2018: 32 · 2017: 42 · 2016: 34 · 2015: 39 · 2014: 30 · 2013: 8
- FWCI
- 16.56
- Type
- journal article
- Language
- en
- Update notices
- correction (2017-01-18)
- Open access
- gold
- doi.org
- Locations
- Genome biology (publishedVersion, cc-by)
- Europe PMC (PubMed Central) (publishedVersion, cc-by)
- PubMed Central (publishedVersion, cc-by)
- PubMed (publishedVersion)
- Funders
- Research Organization of Information and Systems
- Ministry of Education, Culture, Sports, Science and Technology
- Japan Society for the Promotion of Science (23115006, 23680038)
- RIKEN
- Institute of Genetics
- Topics
- Life Sciences › Biochemistry, Genetics and Molecular Biology › Molecular Biology › Single-cell and spatial transcriptomics
- Life Sciences › Biochemistry, Genetics and Molecular Biology › Molecular Biology › Genomics and Phylogenetic Studies
- Life Sciences › Biochemistry, Genetics and Molecular Biology › Molecular Biology › Molecular Biology Techniques and Applications
- Keywords
- single-cell RNA sequencing, non-genetic heterogeneity, gene expression heterogeneity, cell cycle, cell type annotation, sequencing sensitivity
- MeSH terms
- Animals, Cell Line, Organ Specificity, Sensitivity and Specificity, Transcription, Genetic, Sequence Analysis, RNA, Mice, Single-Cell Analysis
About these checks
Registry, retraction, Cites and statistics results are computed, not judged, with one exception: a printed reference that no index lists is read once by a model before it counts as a citation error. Claims are extracted by a model and kept only when their quote appears verbatim in the text; each cited source is then checked, with a model’s help, for whether it says what the claim relies on. Those verdicts can be wrong — read the claim’s quote and the cited source before relying on one.
Statistics and arithmetic are recomputed, not judged.
Confidence bands are shown only for fields calibrated on our annotated test set. None is calibrated yet, so no band is shown.
What counts as a claim ›How we measure confidence ›How we check this ›
Are you an author, or do you see a problem with this page? Request a review
