

The DOI matches its Crossref record; 40 of the 40 references it cites were found in a registry or an index.
Bile acid is a significant host factor shaping the gut microbiome of diet-induced obese mice
Open accessAbstract
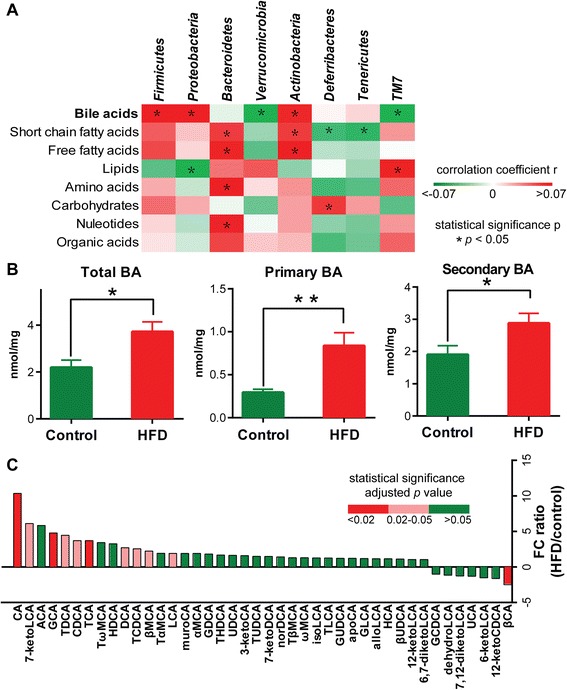
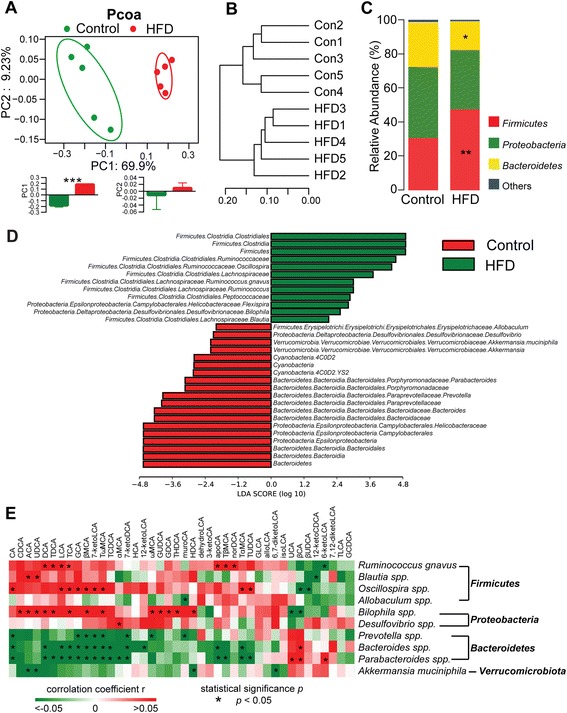
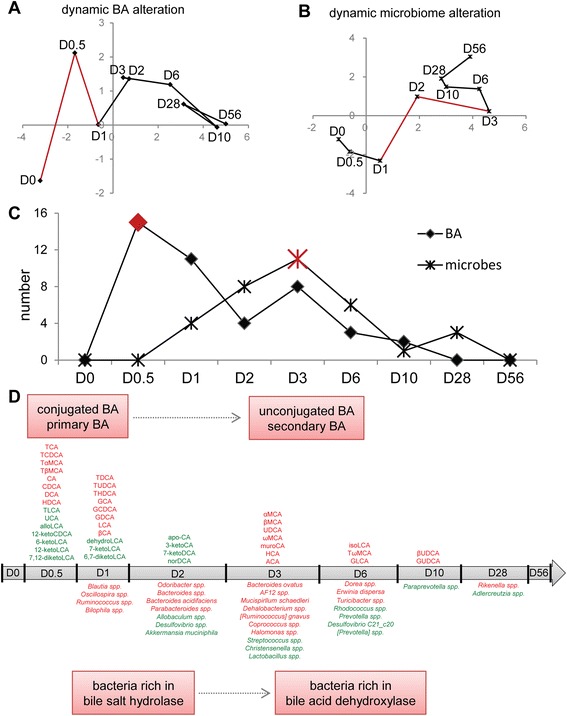
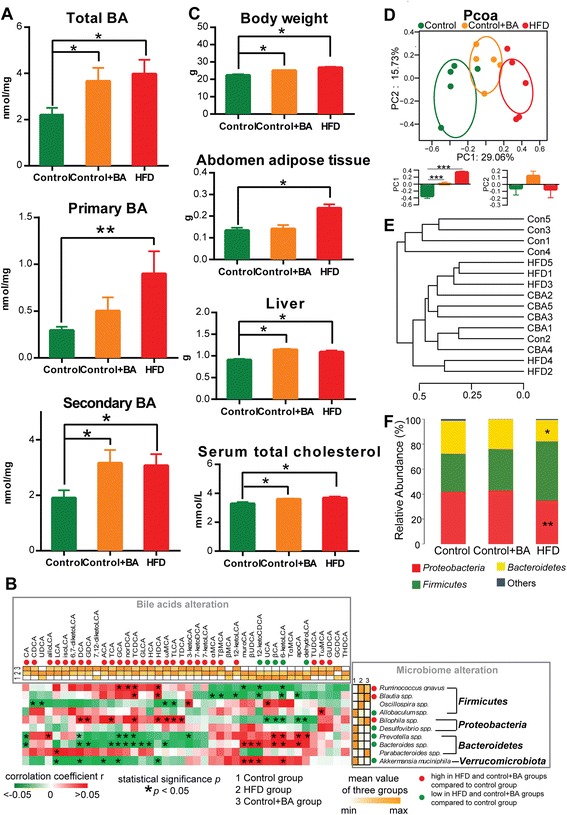
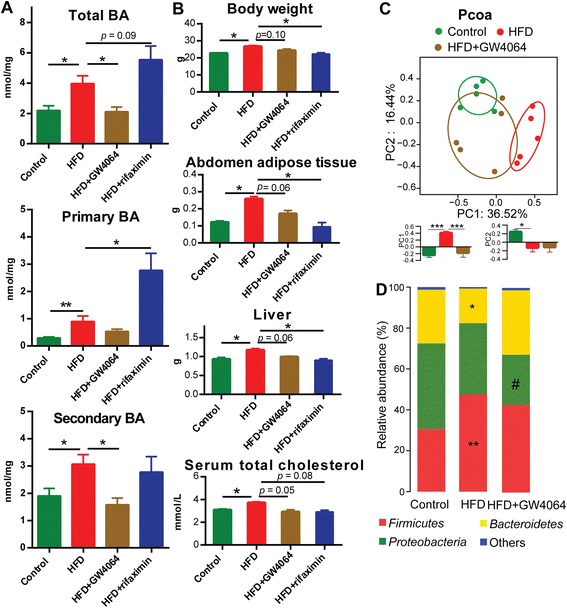
BACKGROUND: Intestinal bacteria are known to regulate bile acid (BA) homeostasis via intestinal biotransformation of BAs and stimulation of the expression of fibroblast growth factor 19 through intestinal nuclear farnesoid X receptor (FXR). On the other hand, BAs directly regulate the gut microbiota with their strong antimicrobial activities. It remains unclear, however, how mammalian BAs cross-talk with gut microbiome and shape microbial composition in a dynamic and interactive way. RESULTS: We quantitatively profiled small molecule metabolites derived from host-microbial co-metabolism in mice, demonstrating that BAs were the most significant factor correlated with microbial alterations among all types of endogenous metabolites. A high-fat diet (HFD) intervention resulted in a rapid and significant increase in the intestinal BA pool within 12 h, followed by an alteration in microbial composition at 24 h, providing supporting evidence that BAs are major dietary factors regulating gut microbiota. Feeding mice with BAs along with a normal diet induced an obese phenotype and obesity-associated gut microbial composition, similar to HFD-fed mice. Inhibition of hepatic BA biosynthesis under HFD conditions attenuated the HFD-induced gut microbiome alterations. Both inhibition of BAs and direct suppression of microbiota improved obese phenotypes. CONCLUSIONS: Our study highlights a liver-BA-gut microbiome metabolic axis that drives significant modifications of BA and microbiota compositions capable of triggering metabolic disorders, suggesting new therapeutic strategies targeting BA metabolism for metabolic diseases.
Overview
The claims and statistics of this paper haven’t been checked yet.
Run the check — free, no account needed. It reads the open-access text and checks the sources it cites.
Integrity signals
Registry
Cites
Statistics
Figures
Verification
Claims the paper makes
The claims and statistics of this paper haven’t been checked yet.
Run the check — free, no account needed. It reads the open-access text and checks the sources it cites.
Claims other papers make about this one
Each is checked against this paper’s own text: does it say what the citing paper says it does?
The cited source says what the claim attributes to it.
In the citing paper
“In mice fed a high‐fat diet, there is a significant change in the profile of intestinal bile acids, while total BAs, primary BAs, and secondary BAs, including CA, GCA, TDCA, DCA, and LCA, are greatly increased (Zheng et al., 2017).”
From Akkermansia muciniphila alleviates high‐fat‐diet ‐related metabolic‐associated fatty liver disease by modulating gut microbiota and bile acids (2023) · cites this paper as Zheng et al., 2017
The cited source says what the claim attributes to it.
In the citing paper
“The abundance of Bilophila and Blautia immediately increase after 1 day of intervention with a high‐fat diet, which may be related to their ability to tolerate bile salts (Zheng et al., 2017).”
From Akkermansia muciniphila alleviates high‐fat‐diet ‐related metabolic‐associated fatty liver disease by modulating gut microbiota and bile acids (2023) · cites this paper as Zheng et al., 2017
Self-check
Percentages, sums and reported differences re-computed from the paper’s own numbers.
The self-check needs the paper’s full text.
Citations
Cites
Schloss, P. D., Westcott, S. L., Ryabin, T., Hall, J. R., Hartmann, M., Hollister, E. B., Lesniewski, R. A., Oakley, B. B., Parks, D. H., Robinson, C. J., et al. (2009) · Applied and Environmental Microbiology · doi:10.1128/aem.01541-09 · Cited by 19,549
Metagenomic biomarker discovery and explanation
Segata, N., Izard, J., Waldron, L., Gevers, D., Miropolsky, L., Garrett, W. S., & Huttenhower, C. (2011) · Genome Biology · doi:10.1186/gb-2011-12-6-r60 · Cited by 16,192
Diet rapidly and reproducibly alters the human gut microbiome
David, L. A., Maurice, C. F., Carmody, R. N., Gootenberg, D. B., Button, J. E., Wolfe, B. E., Ling, A. V., Devlin, A. S., Varma, Y., Fischbach, M. A., et al. (2014) · Nature · doi:10.1038/nature12820 · Cited by 10,100
UniFrac: a New Phylogenetic Method for Comparing Microbial Communities
Lozupone, C., & Knight, R. (2005) · Applied and Environmental Microbiology · doi:10.1128/aem.71.12.8228-8235.2005 · Cited by 8,227
Cross-talk between Akkermansia muciniphila and intestinal epithelium controls diet-induced obesity
Everard, A., Belzer, C., Geurts, L., Ouwerkerk, J. P., Druart, C., Bindels, L. B., Guiot, Y., Derrien, M., Muccioli, G. G., Delzenne, N. M., et al. (2013) · Proceedings of the National Academy of Sciences · doi:10.1073/pnas.1219451110 · Cited by 4,511
Functional interactions between the gut microbiota and host metabolism
Tremaroli, V., & Bäckhed, F. (2012) · Nature · doi:10.1038/nature11552 · Cited by 4,387
The Effect of Diet on the Human Gut Microbiome: A Metagenomic Analysis in Humanized Gnotobiotic Mice
Turnbaugh, P. J., Ridaura, V. K., Faith, J. J., Rey, F. E., Knight, R., & Gordon, J. I. (2009) · Science Translational Medicine · doi:10.1126/scitranslmed.3000322 · Cited by 3,058 · cited 8×
“Bacteroides spp. concentrations were increased at day 2 but were low at 8 weeks.”
InfluentialBile Acids: Natural Ligands for an Orphan Nuclear Receptor
Parks, D. J., Blanchard, S. G., Bledsoe, R. K., Chandra, G., Consler, T. G., Kliewer, S. A., Stimmel, J. B., Willson, T. M., Zavacki, A. M., Moore, D. D., et al. (1999) · Science · doi:10.1126/science.284.5418.1365 · Cited by 2,274
Dao, M. C., Everard, A., Aron-Wisnewsky, J., Sokolovska, N., Prifti, E., Verger, E. O., Kayser, B. D., Levenez, F., Chilloux, J., Hoyles, L., et al. (2016) · Gut · doi:10.1136/gutjnl-2014-308778 · Cited by 1,931
Dietary-fat-induced taurocholic acid promotes pathobiont expansion and colitis in Il10-/- mice
Devkota, S., Wang, Y., Musch, M. W., Leone, V., Fehlner-Peach, H., Nadimpalli, A., Antonopoulos, D. A., Jabri, B., & Chang, E. B. (2012) · Nature · doi:10.1038/nature11225 · Cited by 1,904
Cited by
Sorted by citations
Huang, F., Zheng, X., Ma, X., Jiang, R., Zhou, W., Zhou, S., Zhang, Y., Lei, S., Wang, S., Kuang, J., et al. (2019) · Nature Communications · doi:10.1038/s41467-019-12896-x · Cited by 799
Self-citationZheng, X., Chen, T., Jiang, R., Zhao, A., Wu, Q., Kuang, J., Han, X., Li, M., Li, M., 黄凤杰, et al. (2020) · Cell Metabolism · doi:10.1016/j.cmet.2020.11.017 · Cited by 464
Self-citationFoley, M. H., O’Flaherty, S., Barrangou, R., & Theriot, C. M. (2019) · PLOS Pathogens · doi:10.1371/journal.ppat.1007581 · Cited by 271
The gut microbiota drives the impact of bile acids and fat source in diet on mouse metabolism
Just, S., Mondot, S., Ecker, J., Wegner, K., Rath, E., Gau, L., Streidl, T., Hery-Arnaud, G., Schmidt, S., Lesker, T. R., et al. (2018) · Microbiome · doi:10.1186/s40168-018-0510-8 · Cited by 269
Zhao, L., Lou, H., Peng, Y., Chen, S., Zhang, Y., & Li, X. (2019) · Endocrine · doi:10.1007/s12020-019-02103-8 · Cited by 238
Self-citationDuttaroy, A. K. (2021) · Nutrients · doi:10.3390/nu13010144 · Cited by 239
The Role of Gut Microbiota in Atherosclerosis and Hypertension
Ma, J., & Li, H. (2018) · Frontiers in Pharmacology · doi:10.3389/fphar.2018.01082 · Cited by 234
Impact of Gut Microbiota on Host Glycemic Control
Gérard, C., & Vidal, H. (2019) · Frontiers in Endocrinology · doi:10.3389/fendo.2019.00029 · Cited by 220
Foley, M. H., O’Flaherty, S., Allen, G., Rivera, A. J., Stewart, A. K., Barrangou, R., & Theriot, C. M. (2021) · Proceedings of the National Academy of Sciences · doi:10.1073/pnas.2017709118 · Cited by 205
Zhao, L., Yang, W., Chen, Y., Huang, F., Lu, L., Lin, C., Huang, T., Ning, Z., Zhai, L., Zhong, L. L. D., et al. (2019) · Journal of Clinical Investigation · doi:10.1172/jci130976 · Cited by 202
Self-citationCarbajo‐Pescador, S., Porras, D., García‐Mediavilla, M. V., Martínez‐Flórez, S., Juárez‐Fernández, M., Cuevas, M. J., Mauriz, J. L., González‐Gallego, J., Nistal, E., & Sánchez‐Campos, S. (2019) · Disease Models & Mechanisms · doi:10.1242/dmm.039206 · Cited by 179
Mendez, K. M., Reinke, S. N., & Broadhurst, D. (2019) · Metabolomics · doi:10.1007/s11306-019-1612-4 · Cited by 179
The curious case of Prevotella copri
Abdelsalam, N. A., Hegazy, S. M., & Aziz, R. K. (2023) · Gut Microbes · doi:10.1080/19490976.2023.2249152 · Cited by 174
Rodrigues, R. R., Gurung, M., Li, Z., García‐Jaramillo, M., Greer, R. L., Gaulke, C. A., Bauchinger, F., You, H., Pederson, J. W., Vasquez‐Perez, S., et al. (2021) · Nature Communications · doi:10.1038/s41467-020-20313-x · Cited by 163
Gut Microbiota-Derived Metabolites in Irritable Bowel Syndrome
Xiao, L., Liu, Q., Luo, M., & Xiong, L. (2021) · Frontiers in Cellular and Infection Microbiology · doi:10.3389/fcimb.2021.729346 · Cited by 168
Lipopolysaccharide and the gut microbiota: considering structural variation
Mohr, A. E., Crawford, M. S., Jasbi, P., Fessler, S. N., & Sweazea, K. L. (2022) · FEBS Letters · doi:10.1002/1873-3468.14328 · Cited by 165
Chen, J., Thomsen, M., & Vitetta, L. (2018) · Journal of Cellular Biochemistry · doi:10.1002/jcb.27635 · Cited by 155
Hyocholic acid species as novel biomarkers for metabolic disorders
Zheng, X., Chen, T., Zhao, A., Ning, Z., Kuang, J., Wang, S., You, Y., Bao, Y., Ma, X., Yu, H., et al. (2021) · Nature Communications · doi:10.1038/s41467-021-21744-w · Cited by 152
Self-citationRomano, N., Kumar, V., Yang, G., Kajbaf, K., Rubio, M. B., Overturf, K., Brezas, A., & Hardy, R. W. (2020) · Reviews in Aquaculture · doi:10.1111/raq.12410 · Cited by 152
Genetic determinants of gut microbiota composition and bile acid profiles in mice
Kemis, J. H., Linke, V., Barrett, K. L., Boehm, F. J., Traeger, L. L., Keller, M. P., Rabaglia, M. E., Schueler, K. L., Stapleton, D. S., Gatti, D. M., et al. (2019) · PLOS Genetics · doi:10.1371/journal.pgen.1008073 · Cited by 136
Bifarin, O. O. (2023) · PLoS ONE · doi:10.1371/journal.pone.0284315 · Cited by 143
Wang, T., Han, J., Dai, H., Sun, J., Ren, J., Wang, W., Qiao, S., Liu, C., Sun, L., Liu, S., et al. (2022) · Carbohydrate Polymers · doi:10.1016/j.carbpol.2022.119862 · Cited by 139
Self-citationBoland, M. L., Oró, D., Tølbøl, K. S., Thrane, S. T., Nielsen, J. C., Cohen, T. S., Tabor, D. E., Fernandes, F., Tovchigrechko, A., Veidal, S. S., et al. (2019) · World Journal of Gastroenterology · doi:10.3748/wjg.v25.i33.4904 · Cited by 129
Pushpass, R.-A. G., Alzoufairi, S., Jackson, K. G., & Lovegrove, J. A. (2021) · Nutrition Research Reviews · doi:10.1017/s0954422421000081 · Cited by 136
Ruuskanen, M. O., Erawijantari, P. P., Havulinna, A. S., Liu, Y., Méric, G., Tuomilehto, J. O., Inouye, M., Jousilahti, P., Salomaa, V. V., Jain, M., et al. (2022) · Diabetes Care · doi:10.2337/dc21-2358 · Cited by 132
Wu, W., Kaicen, W., Bian, X., Yang, L., Ding, S., Li, Y., Li, S., Zhuge, A., & Li, L. (2023) · Microbial Biotechnology · doi:10.1111/1751-7915.14293 · Cited by 129
The role of the gut microbiota in health and cardiovascular diseases
Wang, L., Wang, S., Zhang, Q., He, C., Fu, C., & Wei, Q. (2022) · Molecular Biomedicine · doi:10.1186/s43556-022-00091-2 · Cited by 132
Bai, Y., Li, Y., Marion, T. N., Tong, Y., Zaiss, M. M., Tang, Z., Zhang, Q., Liu, Y., & Luo, Y. (2020) · Journal of Autoimmunity · doi:10.1016/j.jaut.2020.102564 · Cited by 121
Conjugated secondary 12α-hydroxylated bile acids promote liver fibrogenesis
Xie, G., Jiang, R., Wang, X., Liu, P., Zhao, A., Wu, Y.-R., Huang, F.-J., Liu, Z., Rajani, C., Zheng, X.-J., et al. (2021) · EBioMedicine · doi:10.1016/j.ebiom.2021.103290 · Cited by 116
Self-citationNMR: Unique Strengths That Enhance Modern Metabolomics Research
Edison, A. S., Colonna, M. B., Gouveia, G. J., Holderman, N. R., Judge, M. T., Shen, X., & Zhang, S. (2020) · Analytical Chemistry · doi:10.1021/acs.analchem.0c04414 · Cited by 107
Alteration of gut microbiota induced by DPP-4i treatment improves glucose homeostasis
Liao, X., Song, L., Zeng, B., Liu, B., Qiu, Y., Qu, H., Zheng, Y., Long, M., Zhou, H., Wang, Y., et al. (2019) · EBioMedicine · doi:10.1016/j.ebiom.2019.03.057 · Cited by 98
Luo, Z., Xu, W., Zhang, Y., Di, L., & Shan, J. (2020) · Pharmacological Research · doi:10.1016/j.phrs.2020.105088 · Cited by 96
Self-citationGut adaptation after metabolic surgery and its influences on the brain, liver and cancer
Sinclair, P., Brennan, D. J., & le Roux, C. W. (2018) · Nature Reviews Gastroenterology & Hepatology · doi:10.1038/s41575-018-0057-y · Cited by 91
Gao, J., Guo, X., Wei, W., Li, R., Hu, K., Liu, X., Jiang, W., Liu, S., Wang, W., Sun, H., et al. (2021) · Diabetes Care · doi:10.2337/dc21-0099 · Cited by 93
Self-citationYouness, R. A., Dawoud, A., Eltahtawy, O., & Farag, M. A. (2022) · Nutrition & Metabolism · doi:10.1186/s12986-022-00696-y · Cited by 99
Prebiotic Potential of Herbal Medicines Used in Digestive Health and Disease
Peterson, C. T., Sharma, V., Uchitel, S., Denniston, K., Chopra, D., Mills, P. J., & Peterson, S. N. (2018) · The Journal of Alternative and Complementary Medicine · doi:10.1089/acm.2017.0422 · Cited by 95
Lv, Y., Qin, X., Jia, H., Chen, S., Sun, W., & Wang, X. (2019) · British Journal Of Nutrition · doi:10.1017/s0007114519001909 · Cited by 90
Xu, J., Xie, S., Chi, S., Zhang, S., Cao, J., & Tan, B. (2022) · Food & Function · doi:10.1039/d1fo04085e · Cited by 84
Metabolic and functional interplay between gut microbiota and fat-soluble vitamins
Stacchiotti, V., Rezzi, S., Eggersdorfer, M. L., & Galli, F. (2020) · Critical Reviews in Food Science and Nutrition · doi:10.1080/10408398.2020.1793728 · Cited by 84
Targeting gut barrier dysfunction with phytotherapies: Effective strategy against chronic diseases
Dey, P. (2020) · Pharmacological Research · doi:10.1016/j.phrs.2020.105135 · Cited by 86
Xiao, S., Zhang, Z., Chen, M., Zou, J., Jiang, S., Qian, D., & Duan, J. (2019) · Journal of Ethnopharmacology · doi:10.1016/j.jep.2019.112032 · Cited by 83
Mokkala, K., Houttu, N., Cansev, T., & Laitinen, K. (2019) · Clinical Nutrition · doi:10.1016/j.clnu.2019.05.003 · Cited by 82
Adams, L. A., Wang, Z., Liddle, C., Melton, P. E., Ariff, A., Chandraratna, H. S., Tan, J. T. H., Ching, H. L., Coulter, S., de Boer, B., et al. (2020) · Liver International · doi:10.1111/liv.14453 · Cited by 79
High-fat diet impairs gut barrier through intestinal microbiota-derived reactive oxygen species
Zeng, N., Wu, F., Lu, J.-Q., Li, X., Lin, S., Zhou, L., Wang, Z., Wu, G., Huang, Q.-F., Zheng, D., et al. (2023) · Science China Life Sciences · doi:10.1007/s11427-022-2283-4 · Cited by 83
Advances in the Involvement of Gut Microbiota in Pathophysiology of NAFLD
Jiang, X., Zheng, J., Zhang, S., Wang, B., Wu, C., & Guo, X. (2020) · Frontiers in Medicine · doi:10.3389/fmed.2020.00361 · Cited by 80
Vitamin D receptor promotes healthy microbial metabolites and microbiome
Chatterjee, I., Lu, R., Zhang, Y., Zhang, J., Dai, Y. D., Xia, Y., & Sun, J. (2020) · Scientific Reports · doi:10.1038/s41598-020-64226-7 · Cited by 77
Self-citationMicrobiome, bile acids, and obesity: How microbially modified metabolites shape anti‐tumor immunity
Sipe, L. M., Chaib, M., Pingili, A. K., Pierre, J. F., & Makowski, L. (2020) · Immunological Reviews · doi:10.1111/imr.12856 · Cited by 75
Song, X., An, Y., Chen, D., Zhang, W., Wu, X., Li, C., Wang, S., Dong, W., Wang, B., Liu, T., et al. (2021) · Cancer Science · doi:10.1111/cas.15208 · Cited by 72
Tang, Y., Zhang, J., Li, J., Lei, X., Xu, D., Wang, Y., Li, C., Li, X., & Mao, Y. (2019) · Biochimica et Biophysica Acta (BBA) - Molecular and Cell Biology of Lipids · doi:10.1016/j.bbalip.2019.05.016 · Cited by 69
Iwao, M., Gotoh, K., Arakawa, M., Endo, M., Honda, K., Seike, M., Murakami, K., & Shibata, H. (2020) · Scientific Reports · doi:10.1038/s41598-020-75542-3 · Cited by 69
Kuang, J., Zheng, X., Huang, F., Wang, S., Li, M., Zhao, M., Sang, C., Ge, K., Li, Y., Li, J., et al. (2020) · Metabolites · doi:10.3390/metabo10110475 · Cited by 67
Self-citationHost-microbial interactions in the metabolism of different dietary fats
Chadaideh, K. S., & Carmody, R. N. (2021) · Cell Metabolism · doi:10.1016/j.cmet.2021.04.011 · Cited by 63
Zheng, C., Wang, L., Zou, T., Lian, S., Luo, J., Lu, Y., Hao, H., Xu, Y., Xiang, Y., Zhang, X., et al. (2024) · Journal of Hepatology · doi:10.1016/j.jhep.2023.12.024 · Cited by 70
The Microbiome and Prostate Cancer Risk
Wheeler, K. M., & Liss, M. A. (2019) · Current Urology Reports · doi:10.1007/s11934-019-0922-4 · Cited by 62
Role of Bile Acids in Dysbiosis and Treatment of Nonalcoholic Fatty Liver Disease
Wang, C., Zhu, C., Shao, L., Ye, J., Shen, Y., & Ren, Y. (2019) · Mediators of Inflammation · doi:10.1155/2019/7659509 · Cited by 67
Specific Microbial Taxa and Functional Capacity Contribute to Chicken Abdominal Fat Deposition
Xiang, H., Gan, J., Zeng, D., Li, J., Yu, H. W., Haiquan, Z., Yang, Y., Tan, S., Li, G., Luo, C., et al. (2021) · Frontiers in Microbiology · doi:10.3389/fmicb.2021.643025 · Cited by 62
Xu, J., Xie, S., Chi, S., Zhang, S., Cao, J., & Tan, B. (2021) · Aquaculture · doi:10.1016/j.aquaculture.2021.737453 · Cited by 61
Yang, B., Huang, S., Zhao, G., & Ma, Q. (2022) · Animal nutrition · doi:10.1016/j.aninu.2022.08.003 · Cited by 59
Bile acid toxicity in Paneth cells contributes to gut dysbiosis induced by high-fat feeding
Zhou, H. J., Zhou, S.-Y., Gillilland, M. G., Li, J., Lee, A. A., Gao, J. L., Zhang, G., Xu, X., & Owyang, C. (2020) · JCI Insight · doi:10.1172/jci.insight.138881 · Cited by 59
Sleep and circadian disruption and the gut microbiome-possible links to dysregulated metabolism
Withrow, D., Bowers, S. J., Depner, C. M., González, A., Reynolds, A. C., & Wright, K. P. (2020) · Current Opinion in Endocrine and Metabolic Research · doi:10.1016/j.coemr.2020.11.009 · Cited by 58
Zhang, Y., Feng, H., Liang, X., He, S., Lan, J., & Li, L. (2022) · Fish & Shellfish Immunology · doi:10.1016/j.fsi.2022.01.010 · Cited by 60
Self-citationBai, Z., Huang, X., Wu, G., Zhang, Y. L., Xu, H., Chen, Y., Yang, H., & Nie, S. (2023) · Food Hydrocolloids · doi:10.1016/j.foodhyd.2023.108670 · Cited by 57
Self-citationA Gut-Restricted Lithocholic Acid Analog as an Inhibitor of Gut Bacterial Bile Salt Hydrolases
Adhikari, A. A., Ramachandran, D., Chaudhari, S. N., Powell, C. E., Li, W., McCurry, M. D., Banks, A. S., & Devlin, A. S. (2021) · ACS Chemical Biology · doi:10.1021/acschembio.1c00192 · Cited by 56
Iqbal, M., Qian, Y., Tang, J., & Xiang, J. (2025) · Journal of Bacteriology · doi:10.1128/jb.00479-24 · Cited by 72
Hagi, T., Geerlings, S. Y., Nijsse, B., & Belzer, C. (2020) · Applied Microbiology and Biotechnology · doi:10.1007/s00253-020-10976-3 · Cited by 55
Wang, Y., Ablimit, N., Zhang, Y., Li, J., Wang, X., Liu, J., Miao, T., Wu, L., Wang, H., Wang, Z., et al. (2021) · International Journal of Biological Macromolecules · doi:10.1016/j.ijbiomac.2021.09.150 · Cited by 53
Self-citationXu, J., Li, X., Yao, X., Xie, S., Chi, S., Zhang, S., Cao, J., & Tan, B. (2022) · Frontiers in Nutrition · doi:10.3389/fnut.2022.813249 · Cited by 51
Gut-liver axis: Pathophysiological concepts and medical perspective in chronic liver diseases
Rodrigues, S. G., der Merwe, V., Krag, A. A., & Wiest, R. (2024) · Seminars in Immunology · doi:10.1016/j.smim.2023.101859 · Cited by 51
Xiao, X., Cheng, Y., Fu, J., Lu, Z., Wang, F., Jin, M., Zong, X., & Wang, Y. (2021) · Oxidative Medicine and Cellular Longevity · doi:10.1155/2021/6634821 · Cited by 51
Kim, S., Choi, S., Dutta, M., Asubonteng, J. O., Polunas, M., Goedken, M. J., Gonzalez, F. J., Cui, J. Y., & Gyamfi, M. A. (2021) · Biochemical Pharmacology · doi:10.1016/j.bcp.2021.114698 · Cited by 52
Hyoju, S. K., Zaborin, A., Keskey, R. C., Sharma, A., Arnold, W., van den Berg, F. F., Kim, S. M., Gottel, N., Bethel, C., Charnot‐Katsikas, A., et al. (2019) · mBio · doi:10.1128/mbio.00903-19 · Cited by 51
Su, C., Liu, X., Li, J., Zhang, M., Pan, L., Lu, Y., Wang, Y., & Ding, Y. (2021) · Aquaculture Nutrition · doi:10.1111/anu.13338 · Cited by 49
Xiong, F., Wu, S., Zhang, J., Jakovlić, I., Li, W.-X., Zou, H., Li, M., & Wang, G.-T. (2018) · Frontiers in Microbiology · doi:10.3389/fmicb.2018.02209 · Cited by 52
Park, S., Zhang, T., Yue, Y., & Wu, X. (2022) · International Journal of Molecular Sciences · doi:10.3390/ijms23115935 · Cited by 47
Liu, X., Zheng, H., Lu, R., Huang, H., Zhu, H., Yin, C., Mo, Y.-Y., Wu, J., Liu, X., Deng, M., et al. (2019) · Frontiers in Microbiology · doi:10.3389/fmicb.2019.01151 · Cited by 48
Self-citationXu, J., Li, M., Zhang, Y., Chu, S., Huo, Y., Zhao, J., & Wan, C. C. (2020) · Molecular Nutrition & Food Research · doi:10.1002/mnfr.202000353 · Cited by 48
Self-citationShi, Z., Chen, G., Cao, Z., Wu, F., Lei, H., Chen, C., Song, Y., Liu, C., Li, J., Zhou, J., et al. (2021) · Journal of Agricultural and Food Chemistry · doi:10.1021/acs.jafc.0c07467 · Cited by 47
Associations between Maternal Diet, Body Composition and Gut Microbial Ecology in Pregnancy
Ruebel, M. L., Gilley, S. P., Sims, C. R., Zhong, Y., Turner, D., Chintapalli, S. V., Piccolo, B. D., Andres, A., & Shankar, K. (2021) · Nutrients · doi:10.3390/nu13093295 · Cited by 46
Yan, S., Wang, D., Teng, M., Meng, Z., Yan, J., Li, R., Jia, M., Yao, C., Sheng, J., Tian, S., et al. (2018) · Environmental Pollution · doi:10.1016/j.envpol.2018.08.082 · Cited by 42
Naudhani, M., Thakur, K., Ni, Z., Zhang, J., & Wei, Z. (2021) · Food & Function · doi:10.1039/d1fo02942h · Cited by 44
Qu, Y., Yang, H., Li, S., Li, L., Li, Y., & Wang, D. (2023) · International Journal of Biological Macromolecules · doi:10.1016/j.ijbiomac.2023.123927 · Cited by 47
The Role of Bile Acids in Cardiovascular Diseases: from Mechanisms to Clinical Implications
Zhang, S., Zhou, J., Wu, W., Zhu, Y. S., & Liu, X. (2022) · Aging and Disease · doi:10.14336/ad.2022.0817 · Cited by 43
Disruptions in gut microbial-host co-metabolism and the development of metabolic disorders
Rajani, C., & Jia, W. P. (2018) · Clinical Science · doi:10.1042/cs20171328 · Cited by 44
Self-citationLei, S., He, S., Li, X., Zheng, B., Zhang, Y., & Zeng, H. (2022) · Food Chemistry · doi:10.1016/j.foodchem.2022.134599 · Cited by 41
Self-citationZhang, B., Sun, Z., Yu, Z., Li, H., Luo, H., & Wang, B. (2022) · Food Research International · doi:10.1016/j.foodres.2022.111941 · Cited by 40
James, C. S., Fraser, K., Young, W., McNabb, W. C., & Roy, N. C. (2019) · Journal of Nutrition · doi:10.1093/jn/nxz302 · Cited by 41
Wen, X., Feng, X., Xin, F., An, R. F., Huang, H., Mao, L., Liu, P., Zhang, J., Huang, H., Liu, X., et al. (2024) · Gut Microbes · doi:10.1080/19490976.2024.2423040 · Cited by 38
Bile Acids: Key Regulators and Novel Treatment Targets for Type 2 Diabetes
Wu, Y., Zhou, A., Tang, L., Lei, Y., Tang, B., & Zhang, L. (2020) · Journal of Diabetes Research · doi:10.1155/2020/6138438 · Cited by 38
Li, R., Chen, X., Liu, Z., Chen, Y., Liu, C., Ye, L., Xiao, L., Yang, Z., He, J., Wang, W., et al. (2020) · BMC Gastroenterology · doi:10.1186/s12876-020-01510-w · Cited by 38
Kim, T., Kim, S., Kim, Y., Lee, Y., Lee, S., Lee, S.-H., & Kweon, M. (2021) · Cellular and Molecular Gastroenterology and Hepatology · doi:10.1016/j.jcmgh.2021.12.015 · Cited by 39
Zhang, K., Zhang, Q., Qiu, H., Ma, Y., Hou, N., Zhang, J., Kan, C., Han, F., Sun, X., & Shi, J. (2024) · Heliyon · doi:10.1016/j.heliyon.2024.e37609 · Cited by 43
Li, Q., Li, M., Li, F., Zhou, W., Dang, Y., Zhang, L. R., & Ji, G. (2020) · Journal of Ethnopharmacology · doi:10.1016/j.jep.2020.112896 · Cited by 38
Huang, D., Xiong, M., Xu, X., Wu, X., Xu, J., Cai, X., Lu, L., & Zhou, H. J. (2020) · Biochemical and Biophysical Research Communications · doi:10.1016/j.bbrc.2020.05.226 · Cited by 37
Regulating bile acids signaling for NAFLD: molecular insights and novel therapeutic interventions
Wei, M., Tu, W., & Huang, G. (2024) · Frontiers in Microbiology · doi:10.3389/fmicb.2024.1341938 · Cited by 39
Li, G.-H., Huang, S., Li, X., Liu, X.-S., & Du, Q. (2020) · World Journal of Gastroenterology · doi:10.3748/wjg.v26.i46.7338 · Cited by 36
Guo, S., Peng, Y., Lou, Y., Cao, L., Liu, J., Lin, N., Cai, S., Kang, Y., Zeng, S., & Yu, L. (2022) · Pharmacological Research · doi:10.1016/j.phrs.2022.106101 · Cited by 36
Wei, L., He, Y., Bi, S., Li, X., Zhang, J., & Zhang, S. (2020) · Oncology Reports · doi:10.3892/or.2020.7895 · Cited by 35
Yang, C., Wan, M., Xu, D., Pan, D., Xia, H., Yang, L., & Sun, G. (2021) · International Journal of Molecular Sciences · doi:10.3390/ijms221910858 · Cited by 35
Hou, J.-J., Wang, X., Wang, Y.-M., & Wang, B.-M. (2021) · Critical Reviews in Microbiology · doi:10.1080/1040841x.2021.2018401 · Cited by 36
McMillan, A. S., & Theriot, C. M. (2024) · Gut Microbes · doi:10.1080/19490976.2024.2393766 · Cited by 41
Metadata
- Authors
- Zheng, X., Huang, F., Zhao, A., Lei, S., Zhang, Y., Xie, G., Chen, T., Qu, C., Rajani, C., Dong, B., Li, D., & Jia, W.
- Affiliations
- Shanghai Jiao Tong University (CN)
- University of Hawaii Cancer Center (US)
- China Agricultural University (CN)
- Corresponding author
- Jia, Wei
- ORCID
- Venue
- BMC Biology
- Published
- 2017-12
- Volume
- 15
- Issue
- 1
- Pages
- 120-120
- ISSN
- 1741-7007 (ISSN-L)
- PMC
- PMC5731064
- OpenAlex
- W2774287749
- Cited by
- 323
- References
- 40
- Citations by year
- 2026: 18 · 2025: 36 · 2024: 40 · 2023: 61 · 2022: 44 · 2021: 47 · 2020: 36 · 2019: 29 · 2018: 12
- FWCI
- 8.83
- Type
- journal article
- Language
- en
- Open access
- gold
- doi.org
- Licence
- cc-by
- Locations
- BMC Biology (publishedVersion, cc-by)
- PubMed Central (publishedVersion, cc-by)
- PubMed (publishedVersion)
- DOAJ (DOAJ: Directory of Open Access Journals) (submittedVersion, cc-by-sa)
- Funders
- National Natural Science Foundation of China (31500954)
- Science and Technology Committee of Shanghai Municipality Government (15YF1409100)
- Topics
- Life Sciences › Biochemistry, Genetics and Molecular Biology › Molecular Biology › Gut microbiota and health
- Health Sciences › Medicine › Oncology › Drug Transport and Resistance Mechanisms
- Health Sciences › Medicine › Pharmacology (medical) › Berberine and alkaloids research
- Keywords
- bile acids, gut microbiota, diet-induced obesity, high-fat diet, bile acid synthesis, FGF19, farnesoid X receptor, small molecule metabolites, metabolic disorders
- MeSH terms
- Gastrointestinal Microbiome, Receptor, Farnesoid X-Activated, Animals, Bile Acids and Salts, Isoxazoles, Male, Mice, Inbred C57BL, Mice, Obese, Signal Transduction, Receptors, Cytoplasmic and Nuclear, Mice, Diet, High-Fat
About these checks
Registry, retraction, Cites and statistics results are computed, not judged, with one exception: a printed reference that no index lists is read once by a model before it counts as a citation error. Claims are extracted by a model and kept only when their quote appears verbatim in the text; each cited source is then checked, with a model’s help, for whether it says what the claim relies on. Those verdicts can be wrong — read the claim’s quote and the cited source before relying on one.
Statistics and arithmetic are recomputed, not judged.
Confidence bands are shown only for fields calibrated on our annotated test set. None is calibrated yet, so no band is shown.
What counts as a claim ›How we measure confidence ›How we check this ›
Are you an author, or do you see a problem with this page? Request a review
