Cited by 47

The DOI matches its Crossref record; 9 of the 9 references it cites were found in a registry or an index.

Tetrandrine ameliorates cognitive deficits and mitigates tau aggregation in cell and animal models of tauopathies

Tong, Benjamin Chun-Kit, Huang, Alexis Shiying, Wu, Aston Jiaxi, Iyaswamy, Ashok, Ho, Olivia Ka-Yi, Kong, Anna Hau-Yee, Sreenivasmurthy, Sravan Gopalkrishnashetty, Zhu, Zhou, Su, Chengfu, Liu, Jia, Song, Juxian, Li, Min, Cheung, King-Ho·2022·Journal of Biomedical Science

Abstract

Background: Tauopathies are neurodegenerative diseases that are associated with the pathological accumulation of tau-containing tangles in the brain. Tauopathy can impair cognitive and motor functions and has been observed in Alzheimer’s disease (AD) and frontotemporal dementia (FTD). The aetiology of tauopathy remains mysterious; however, recent studies suggest that the autophagic-endolysosomal function plays an essential role in the degradation and transmission of pathological tau. We previously demonstrated that tetrandrine could ameliorate memory functions and clear amyloid plaques in transgenic AD mice by restoring autophagic-endolysosomal function. However, the efficacy of tetrandrine and the associated therapeutic mechanism in tauopathies have not been evaluated and elucidated. Methods: Novel object recognition, fear conditioning and electrophysiology were used to evaluate the effects of tetrandrine on memory functions in transgenic tau mice. Western blotting and immunofluorescence staining were employed to determine the effect of tetrandrine on autophagy and tau clearance in vivo. Calcium (Ca 2+) imaging and flow cytometry were used to delineate the role of pathological tau and tetrandrine in lysosomal Ca 2+ and pH homeostasis. Biochemical BiFC fluorescence, Western blotting and immunofluorescence staining were used to evaluate degradation of hyperphosphorylated tau in vitro, whereas coculture of brain slices with isolated microglia was used to evaluate tau clearance ex vivo. Results: We observed that tetrandrine treatment mitigated tau tangle development and corrected memory impairment in Thy1-hTau.P301S transgenic mice. Mechanistically, we showed that mutant tau expression disrupts lysosome pH by increasing two-pore channel 2 (TPC2)-mediated Ca 2+ release, thereby contributing to lysosome alkalinization. Tetrandrine inhibits TPC2, thereby restoring the lysosomal pH, promotes tau degradation via autophagy, and ameliorates tau aggregation. Furthermore, in an ex vivo assay, we demonstrated that tetrandrine treatment promotes pathological tau clearance by microglia. Conclusions: Together, these findings suggest that pathological tau disturbs endolysosomal homeostasis to impair tau clearance. This impairment results in a vicious cycle that accelerates disease pathogenesis. The success of tetrandrine in reducing tau aggregation suggests first, that tetrandrine could be an effective drug for tauopathies and second, that rescuing lysosomal Ca 2+ homeostasis, thereby restoring ALP function, could be an effective general strategy for the development of novel therapies for tauopathies.

Overview

The claims and statistics of this paper haven’t been checked yet.

Run the check — free, no account needed. It reads the open-access text and checks the sources it cites.

A few free checks a day · papers already verified open instantly · results are public

Integrity signals

Registry

Crossref · 10.1186/s12929-022-00871-6

Cites

9 of 9 references verified0 citation errors · 0 not checkable

Statistics

Figures

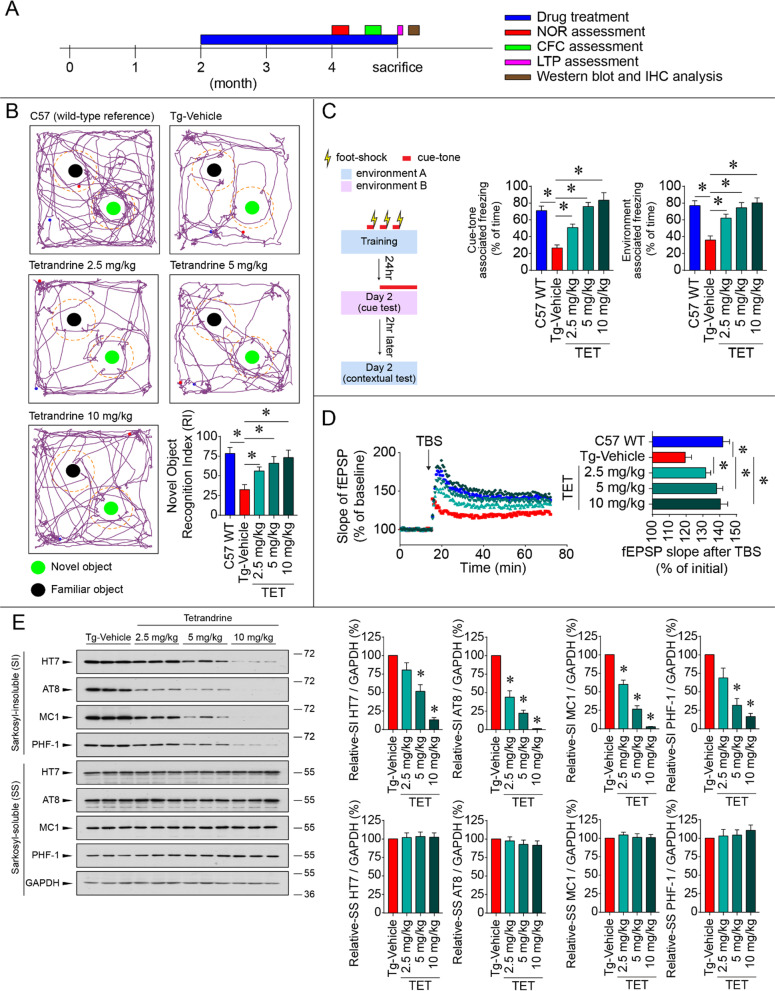
Fig. 1 Tetrandrine ameliorates memory dysfunction and tau aggregation in tau mice. A A timeline diagram depicting the drug treatment and experimental plan of the study. Tau mice (Thy1-hTau.P301S, Tg) were treated with saline (Tg-vehicle), and different concentrations of tetrandrine (Tg-TET; 2.5 mg/kg, 5 mg/kg, and 10 mg/kg) via intraperitoneal (i.p.) injections every two days starting when the mice were 2 months old. When the mice reached 4 months old, they were subjected to behavioural and electrophysiological tests and Western blot and immunohistochemical analyses. B The novel object recognition test (NOR) was used to assay memory function. Mice were allowed to freely explore a familiar arena and were exposed to two identical objects (familiar object) prior to the experiment. Representative graphs show the exploration tracks of the mice after one of the objects was replaced by a new object (novel object). The familiar object and novel object are shown as black and green circles, respectively. The wild-type C57 mice spent more time in the exploration zone (shown as a dotted line) of the novel object than the Tg mice. Treatment with tetrandrine increased the exploration of novel objects by Tg mice in a dose-dependent manner. The bar chart depicts the recognition index (RI) calculated by the time the mice spent with each object. Data are summarized as the mean ± SEM from 8 mice in each group. C The contextual fear conditioning test (CFC) was used to assay learning and memory functions. The experiment was conducted as shown on the left. A mouse was placed in a specially designed sound-proof chamber and was stimulated by a foot shock coupled with a cue tone three times. The mice were then assayed in a novel environment with cue tones played after 3 min of exploration or in the same environment without cue tones to assay cue tone-associated and context-associated fear memory. Freezing behaviour represented the recall of memory associated with the electrical shocks. Bar charts depict the percentage of freezing in contextual and cued tests. Data are summarized as the mean ± SEM from 8 mice in each group. D Representative traces showing the electrophysiological fEPSP measurements evoked by 5 trains of theta burst stimulation (TBS) in brain slices isolated from C57 WT mice treated with different concentrations of tetrandrine (Tg-TET) or vehicle (Tg-Vehicle). The bar chart summarizes the fEPSP after TBS stimulation. Data are summarized as the mean ± SEM from 8 mice with 3 brain slices each from each group. E Western blot analyses showing the amount of phosphor-tau protein in Sarkosyl-soluble (SS) and Sarkosyl-insoluble (SI) fractions in wild-type C57 mice (C57 WT) or mice treated with different concentrations of tetrandrine (Tg-TET) or vehicle (Tg-Vehicle) probed with different tau antibodies. Bar charts depict the amount of tau protein normalized to GAPDH in the SS and SI fractions. Data are summarized as the mean ± SEM from 8 mice in each group. *Indicates p < 0.05 compared with the C57 WT group or tau mice treated with saline (Tg-Vehicle)
Fig. 1 Tetrandrine ameliorates memory dysfunction and tau aggregation in tau mice. A A timeline diagram depicting the drug treatment and experimental plan of the study. Tau mice (Thy1-hTau.P301S, Tg) were treated with saline (Tg-vehicle), and different concentrations of tetrandrine (Tg-TET; 2.5 mg/kg, 5 mg/kg, and 10 mg/kg) via intraperitoneal (i.p.) injections every two days starting when the mice were 2 months old. When the mice reached 4 months old, they were subjected to behavioural and electrophysiological tests and Western blot and immunohistochemical analyses. B The novel object recognition test (NOR) was used to assay memory function. Mice were allowed to freely explore a familiar arena and were exposed to two identical objects (familiar object) prior to the experiment. Representative graphs show the exploration tracks of the mice after one of the objects was replaced by a new object (novel object). The familiar object and novel object are shown as black and green circles, respectively. The wild-type C57 mice spent more time in the exploration zone (shown as a dotted line) of the novel object than the Tg mice. Treatment with tetrandrine increased the exploration of novel objects by Tg mice in a dose-dependent manner. The bar chart depicts the recognition index (RI) calculated by the time the mice spent with each object. Data are summarized as the mean ± SEM from 8 mice in each group. C The contextual fear conditioning test (CFC) was used to assay learning and memory functions. The experiment was conducted as shown on the left. A mouse was placed in a specially designed sound-proof chamber and was stimulated by a foot shock coupled with a cue tone three times. The mice were then assayed in a novel environment with cue tones played after 3 min of exploration or in the same environment without cue tones to assay cue tone-associated and context-associated fear memory. Freezing behaviour represented the recall of memory associated with the electrical shocks. Bar charts depict the percentage of freezing in contextual and cued tests. Data are summarized as the mean ± SEM from 8 mice in each group. D Representative traces showing the electrophysiological fEPSP measurements evoked by 5 trains of theta burst stimulation (TBS) in brain slices isolated from C57 WT mice treated with different concentrations of tetrandrine (Tg-TET) or vehicle (Tg-Vehicle). The bar chart summarizes the fEPSP after TBS stimulation. Data are summarized as the mean ± SEM from 8 mice with 3 brain slices each from each group. E Western blot analyses showing the amount of phosphor-tau protein in Sarkosyl-soluble (SS) and Sarkosyl-insoluble (SI) fractions in wild-type C57 mice (C57 WT) or mice treated with different concentrations of tetrandrine (Tg-TET) or vehicle (Tg-Vehicle) probed with different tau antibodies. Bar charts depict the amount of tau protein normalized to GAPDH in the SS and SI fractions. Data are summarized as the mean ± SEM from 8 mice in each group. *Indicates p < 0.05 compared with the C57 WT group or tau mice treated with saline (Tg-Vehicle)CC BY · PubMed Central
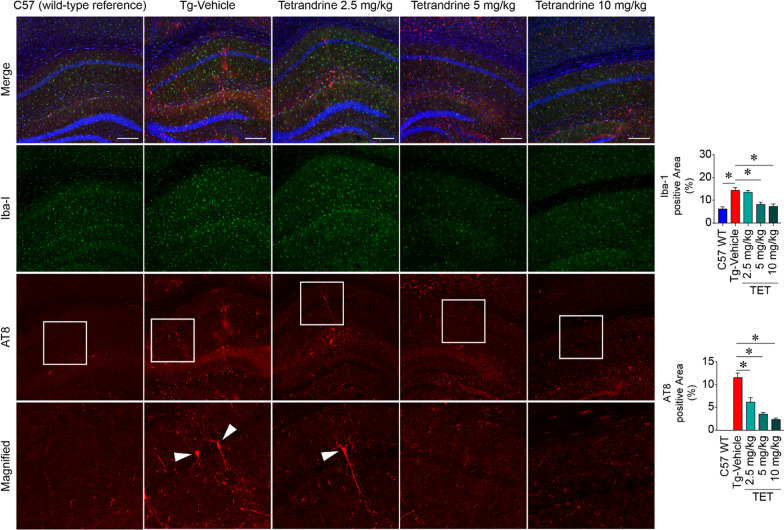
Fig. 2 Tetrandrine reduces Iba-1 (gliosis) and AT8 (phosphorylated tau) signals in Thy1-hTau.P301S mice. Micrographs showing representative immunofluorescence staining of gliosis and phosphor-tau in hippocampal regions of control wild-type C57 (C57 WT) or Thy1-hTau.P301S mice treated with saline (Tg-Vehicle) or different concentrations of tetrandrine (TET; 2.5 mg/kg, 5 mg/kg, and 10 mg/kg, ip injection every two days from 2 months old to 4 months old). After the treatment, brain slices were immuno-probed with Iba-1 and AT8 antibodies to reveal gliosis and hyperphosphorylated tau. The bottom panel shows the magnified region in the white boxes in the AT8 immunostaining panels. The arrowheads of the magnified micrographs depict neurons with hyperphosphorylated tau. Quantifications of Iba1 and AT8 levels are shown in the bar charts. Data are summarized as the mean ± SEM from 8 mice, with 24 images analysed in each group. *Indicates p < 0.05 compared with C57 WT or vehicle-treated tau mice control
Fig. 2 Tetrandrine reduces Iba-1 (gliosis) and AT8 (phosphorylated tau) signals in Thy1-hTau.P301S mice. Micrographs showing representative immunofluorescence staining of gliosis and phosphor-tau in hippocampal regions of control wild-type C57 (C57 WT) or Thy1-hTau.P301S mice treated with saline (Tg-Vehicle) or different concentrations of tetrandrine (TET; 2.5 mg/kg, 5 mg/kg, and 10 mg/kg, ip injection every two days from 2 months old to 4 months old). After the treatment, brain slices were immuno-probed with Iba-1 and AT8 antibodies to reveal gliosis and hyperphosphorylated tau. The bottom panel shows the magnified region in the white boxes in the AT8 immunostaining panels. The arrowheads of the magnified micrographs depict neurons with hyperphosphorylated tau. Quantifications of Iba1 and AT8 levels are shown in the bar charts. Data are summarized as the mean ± SEM from 8 mice, with 24 images analysed in each group. *Indicates p < 0.05 compared with C57 WT or vehicle-treated tau mice controlCC BY · PubMed Central
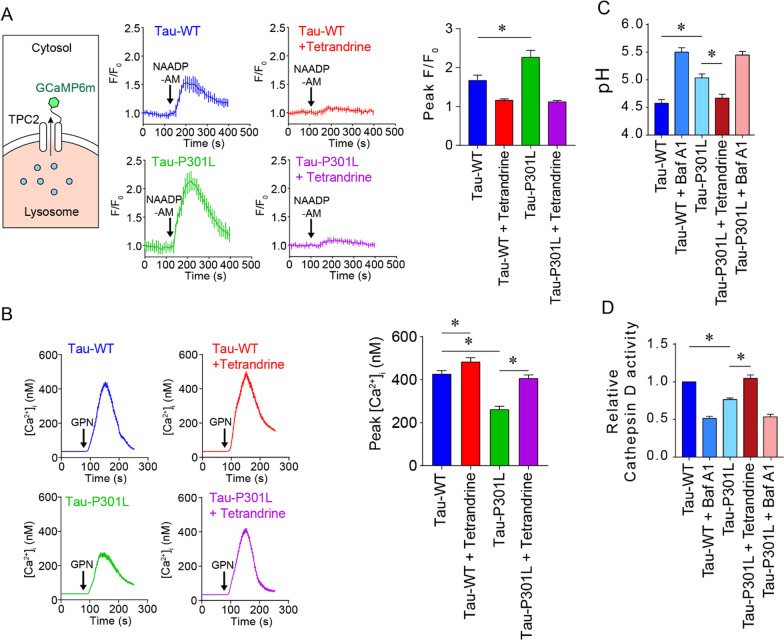
Fig. 3 Pathological tau disrupts lysosomal Ca2+ and pH homeostasis by increasing TPC2 activity. A Left, a diagram depicts the topological representation of transfected GCaMP6m-TPC2 in the lysosome. Ca2+-sensitive GCaMP6 is located on the cytoplasmic side and can sense Ca2+ released from lysosomes. Middle, representative Ca2+ traces showing lysosome Ca2+ efflux measured by the expressed GCaMP6m-TPC2 in WT or mutant tau-expressing SH-SY5Y cells. The bar chart on the right shows the normalized peak fluorescence intensity (F/F0) of GCaMP6m-TPC2, summarized as the mean ± SEM from 3 individual experiments, with 90 cells analysed in each group. B Representative Ca2+ traces depict the changes in cytoplasmic Ca2+ content measured by the Ca2+ indicator Fura-2AM after the addition of GPN to SHSY5Y cells expressing Tau-WT or Tau-P301L with or without tetrandrine treatment. Each trace summarizes the changes in cytoplasmic Ca2+ in 90 cells from 3 experiments. The bar chart on the right shows the peaks of GPN-induced cytoplasmic Ca2+ changes. C Lysosomal pH measurements of SH-SY5Y cells expressing Tau-WT or Tau-P301L. The V-ATPase inhibitor bafilomycin A1 (BafA1) was used as a control. D Lysosomal cathepsin D (Cat D) activity measured in SH-SY5Y cells expressing Tau-WT or Tau-P301L. BafA1 was used as a control. Unless otherwise specified, all data are summarized as the mean ± SEM from at least 3 individual experiments; *Indicates p < 0.05
Fig. 3 Pathological tau disrupts lysosomal Ca2+ and pH homeostasis by increasing TPC2 activity. A Left, a diagram depicts the topological representation of transfected GCaMP6m-TPC2 in the lysosome. Ca2+-sensitive GCaMP6 is located on the cytoplasmic side and can sense Ca2+ released from lysosomes. Middle, representative Ca2+ traces showing lysosome Ca2+ efflux measured by the expressed GCaMP6m-TPC2 in WT or mutant tau-expressing SH-SY5Y cells. The bar chart on the right shows the normalized peak fluorescence intensity (F/F0) of GCaMP6m-TPC2, summarized as the mean ± SEM from 3 individual experiments, with 90 cells analysed in each group. B Representative Ca2+ traces depict the changes in cytoplasmic Ca2+ content measured by the Ca2+ indicator Fura-2AM after the addition of GPN to SHSY5Y cells expressing Tau-WT or Tau-P301L with or without tetrandrine treatment. Each trace summarizes the changes in cytoplasmic Ca2+ in 90 cells from 3 experiments. The bar chart on the right shows the peaks of GPN-induced cytoplasmic Ca2+ changes. C Lysosomal pH measurements of SH-SY5Y cells expressing Tau-WT or Tau-P301L. The V-ATPase inhibitor bafilomycin A1 (BafA1) was used as a control. D Lysosomal cathepsin D (Cat D) activity measured in SH-SY5Y cells expressing Tau-WT or Tau-P301L. BafA1 was used as a control. Unless otherwise specified, all data are summarized as the mean ± SEM from at least 3 individual experiments; *Indicates p < 0.05CC BY · PubMed Central
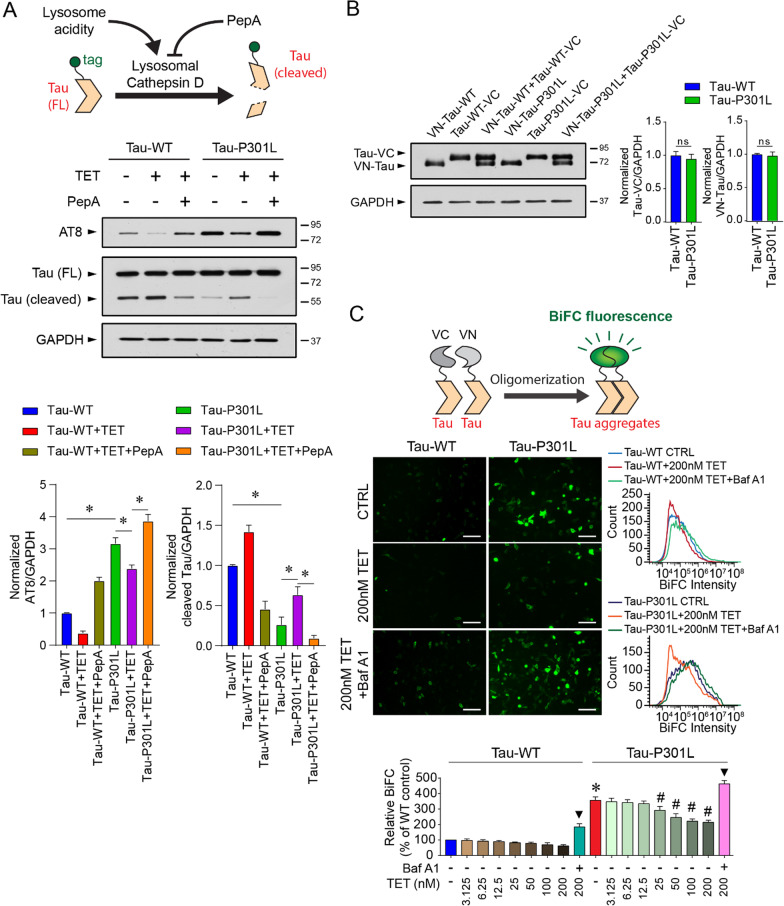
Fig. 4 Tetrandrine ameliorates tau aggregation through endolysosomal degradation. A Top, schematic representation showing the manipulation of cathepsin D activity by tetrandrine or pepstatin A (Pep A) on the aggregation of tagged-tau ion SH-SY5Y cells. Middle, Western blot analyses of tau aggregation under the influence of tetrandrine and pepstatin A in Tau-WT- or Tau-301L-expressing SH-SY5Y cells. Cathepsin D activity was modulated by the addition of tetrandrine (TET) or Pep A. Bar charts depict the protein amount of cleaved and uncleaved tau normalized to GAPDH. Data are summarized as the mean ± SEM from 3 individual experiments; *Indicates p < 0.05. B Western blot analysis of the expression levels of VN and VC fragments of biomolecular fluorescence complementation (BiFC) in Tau-WT- or Tau-P301L-expressing cells. The bar chart depicts the protein levels of VN-tagged and VC-tagged tau when they were coexpressed. Expression of Tau-WT or Tau-P301L did not affect the expression of VN- and VC-fragments in cells. Data are summarized as the mean ± SEM from 3 individual experiments. n.s. denotes no statistical significance. C Top, a schematic showing the formation of BiFC by the expressed VN- and VC-fragments. Middle, representative micrographs showing the fluorescence levels of BiFC in Tau-WT- or Tau-P301L-expressing cells under the influence of tetrandrine with or without BafA1 cotreatment. Bottom, representative flow cytometry data depict the effect of tetrandrine (TET) or Baf A1 on tau aggregation. The bar chart depicts data summarized as the mean ± SEM from 3 individual experiments; * and #Indicate p < 0.05 compared to the WT and untreated mutant tau groups, respectively. ▼ indicates p < 0.05 compared to the 200 nM tetrandrine-treated groups
Fig. 4 Tetrandrine ameliorates tau aggregation through endolysosomal degradation. A Top, schematic representation showing the manipulation of cathepsin D activity by tetrandrine or pepstatin A (Pep A) on the aggregation of tagged-tau ion SH-SY5Y cells. Middle, Western blot analyses of tau aggregation under the influence of tetrandrine and pepstatin A in Tau-WT- or Tau-301L-expressing SH-SY5Y cells. Cathepsin D activity was modulated by the addition of tetrandrine (TET) or Pep A. Bar charts depict the protein amount of cleaved and uncleaved tau normalized to GAPDH. Data are summarized as the mean ± SEM from 3 individual experiments; *Indicates p < 0.05. B Western blot analysis of the expression levels of VN and VC fragments of biomolecular fluorescence complementation (BiFC) in Tau-WT- or Tau-P301L-expressing cells. The bar chart depicts the protein levels of VN-tagged and VC-tagged tau when they were coexpressed. Expression of Tau-WT or Tau-P301L did not affect the expression of VN- and VC-fragments in cells. Data are summarized as the mean ± SEM from 3 individual experiments. n.s. denotes no statistical significance. C Top, a schematic showing the formation of BiFC by the expressed VN- and VC-fragments. Middle, representative micrographs showing the fluorescence levels of BiFC in Tau-WT- or Tau-P301L-expressing cells under the influence of tetrandrine with or without BafA1 cotreatment. Bottom, representative flow cytometry data depict the effect of tetrandrine (TET) or Baf A1 on tau aggregation. The bar chart depicts data summarized as the mean ± SEM from 3 individual experiments; * and #Indicate p < 0.05 compared to the WT and untreated mutant tau groups, respectively. ▼ indicates p < 0.05 compared to the 200 nM tetrandrine-treated groupsCC BY · PubMed Central
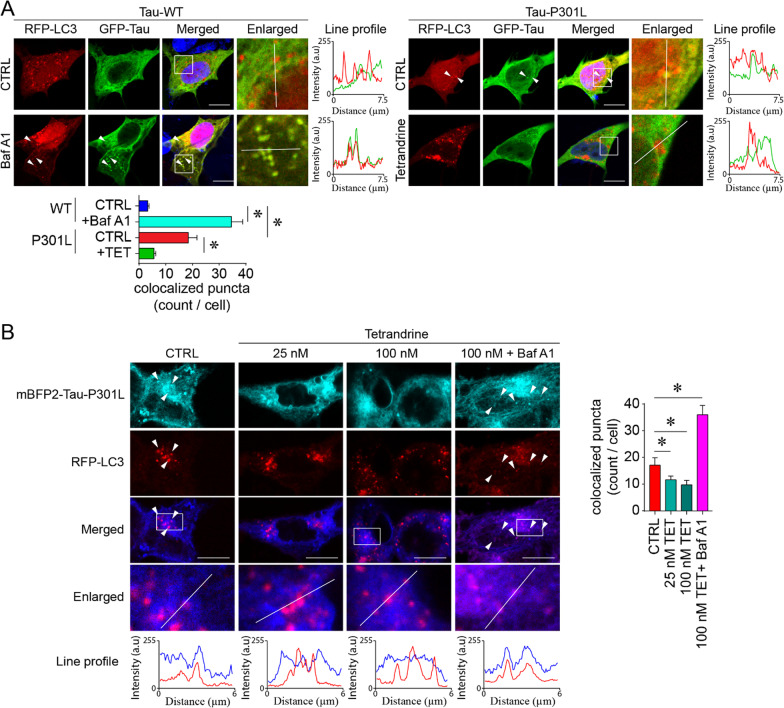
Fig. 5 Tetrandrine promotes pathological tau degradation. A Representative micrographs showing autophagic degradation of tau tracked by GFP-Tau and RFP-LC3 in Tau-WT- or Tau-P301L-expressing SH-SY5Y cells. The enlarged images are the magnified regions indicated in the white boxes of the merged images. White arrowheads indicate the colocalization of tau and LC3 puncta, and their degree of colocalization was analysed by ImageJ with the colocalization analysis plugin. The red and green traces in the line profile show the intensity of red and green colour in arbitrary units (a.u.) along the white line indicated in the enlarged images. The bar chart depicts data summarized as the mean ± SEM from 3 individual experiments, with 30 cells counted in each group. *Indicates p < 0.05. B An analogous tau degradation experiment was performed using acid-resistant mBFP2-tagged tau P301L. The enlarged images are the magnified region indicated by the white boxes in the merged images. White arrowheads indicate the colocalization of tau-P301L—LC3 puncta under the influence of tetrandrine (TET) and bafilomycin A (BafA1). The degree of colocalization was analysed with ImageJ. The red and blue traces in the line profile show the intensity of red and blue colour in arbitrary units (a.u.) along the white line indicated in the enlarged images. The bar chart depicts data summarized as the mean ± SEM from 3 individual experiments, with 30 cells counted in each group. *Indicates p < 0.05
Fig. 5 Tetrandrine promotes pathological tau degradation. A Representative micrographs showing autophagic degradation of tau tracked by GFP-Tau and RFP-LC3 in Tau-WT- or Tau-P301L-expressing SH-SY5Y cells. The enlarged images are the magnified regions indicated in the white boxes of the merged images. White arrowheads indicate the colocalization of tau and LC3 puncta, and their degree of colocalization was analysed by ImageJ with the colocalization analysis plugin. The red and green traces in the line profile show the intensity of red and green colour in arbitrary units (a.u.) along the white line indicated in the enlarged images. The bar chart depicts data summarized as the mean ± SEM from 3 individual experiments, with 30 cells counted in each group. *Indicates p < 0.05. B An analogous tau degradation experiment was performed using acid-resistant mBFP2-tagged tau P301L. The enlarged images are the magnified region indicated by the white boxes in the merged images. White arrowheads indicate the colocalization of tau-P301L—LC3 puncta under the influence of tetrandrine (TET) and bafilomycin A (BafA1). The degree of colocalization was analysed with ImageJ. The red and blue traces in the line profile show the intensity of red and blue colour in arbitrary units (a.u.) along the white line indicated in the enlarged images. The bar chart depicts data summarized as the mean ± SEM from 3 individual experiments, with 30 cells counted in each group. *Indicates p < 0.05CC BY · PubMed Central
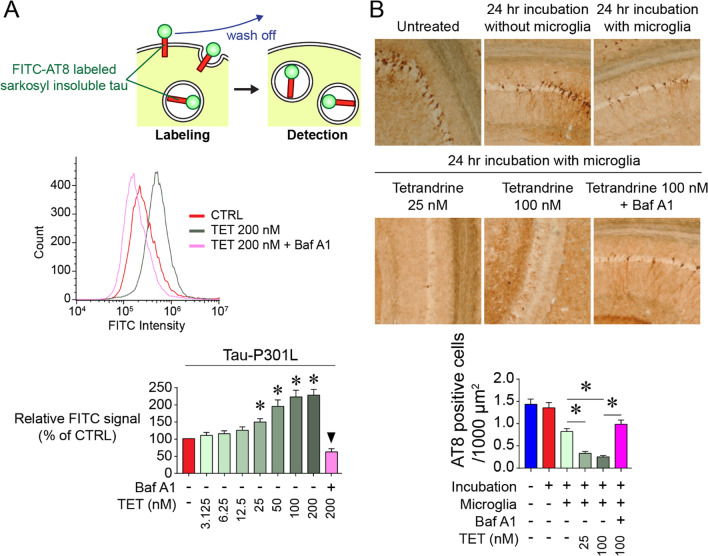
Fig. 6 Tetrandrine promotes tau internalization and degradation by microglia. A Top, a schematic showing the internalization assay using FITC-AT8-labelled tau isolated from the Sarkosyl insoluble fraction of tau-P301S tau mouse brain homogenates. Middle, flow cytometry analysis depicting the internalization of FITC-AT8-labelled insoluble tau aggregates isolated from P301S tau mouse brain homogenates by microglia under the influence of TET and BafA1. Bottom, bar chart showing data summarized as the mean ± SEM from 5 individual experiments, *Indicates p < 0.05. ▼ indicates p < 0.05 compared to the 200 nM tetrandrine-treated group. B Representative micrographs showing the ex vivo tau-tangle clearance in 24 h in tau-P301S mouse brain slices under the influence of tetrandrine treatment at different concentrations. The bar chart depicts data summarized as the mean ± SEM from 5 individual experiments; *Indicates p < 0.05
Fig. 6 Tetrandrine promotes tau internalization and degradation by microglia. A Top, a schematic showing the internalization assay using FITC-AT8-labelled tau isolated from the Sarkosyl insoluble fraction of tau-P301S tau mouse brain homogenates. Middle, flow cytometry analysis depicting the internalization of FITC-AT8-labelled insoluble tau aggregates isolated from P301S tau mouse brain homogenates by microglia under the influence of TET and BafA1. Bottom, bar chart showing data summarized as the mean ± SEM from 5 individual experiments, *Indicates p < 0.05. ▼ indicates p < 0.05 compared to the 200 nM tetrandrine-treated group. B Representative micrographs showing the ex vivo tau-tangle clearance in 24 h in tau-P301S mouse brain slices under the influence of tetrandrine treatment at different concentrations. The bar chart depicts data summarized as the mean ± SEM from 5 individual experiments; *Indicates p < 0.05CC BY · PubMed Central
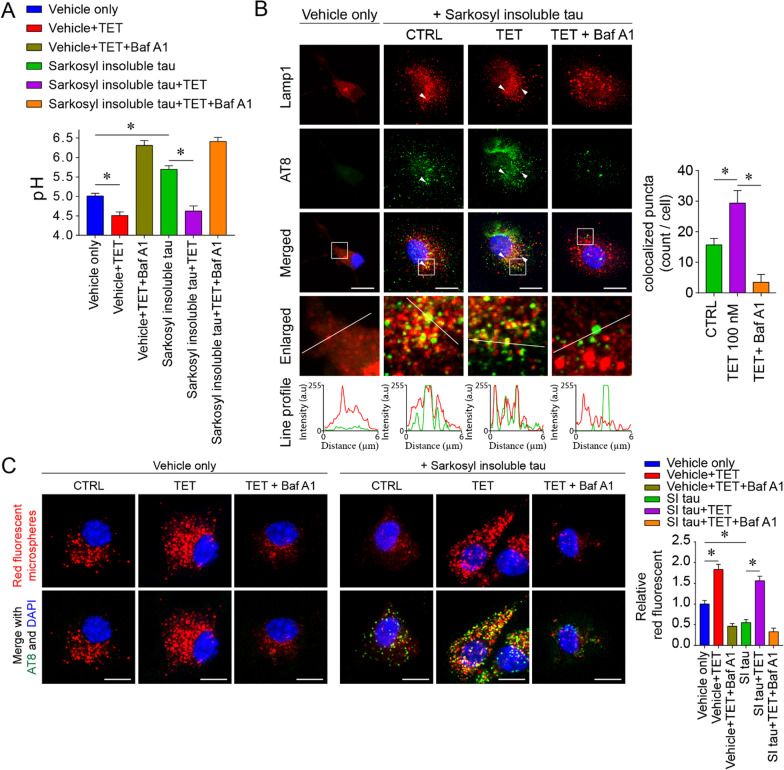
Fig. 7 Tetrandrine restores the microglial phagocytosis impairment induced by pathological tau. A Lysosomal pH measurements in primary microglia 24 h after incubation with Sarkosyl-insoluble fractions from tau-P301S mouse brain homogenates with or without tetrandrine treatment. The Sarkosyl vehicle was used as the control. BafA1 was used to induce lysosomal alkalinization. Data are summarized as the mean ± SEM from 3 independent experiments. *Indicates p < 0.05. B Representative micrographs showing the localization of phagocytosed tau in microglia. Lamp1 and AT-8 were employed to label lysosomes and phosphor-tau, respectively. The enlarged images show the magnified region in the white boxes from the merged images. White arrowheads indicate the colocalization of tau and Lamp1, and their degree of colocalization was analysed with ImageJ with the colocalization plugin. The red and green traces in the line profile show the intensity of red and green colour in arbitrary units (a.u.) along the white line indicated in the enlarged images. Data are summarized as the mean ± SEM from 15 images analysed in each group. *Indicates p < 0.05. C Representative micrographs showing the phagocytosis assay of red fluorescent microspheres under the influence of tetrandrine (TET) and bafilomycin A1 (BafA1) in primary microglia 24 h after incubation with Sarkosyl-insoluble (SI) fractions of P301S tau mouse brain homogenates or Sarkosyl vehicle only. Data are summarized as the mean ± SEM from 15 images analysed in each group. *Indicates p < 0.05
Fig. 7 Tetrandrine restores the microglial phagocytosis impairment induced by pathological tau. A Lysosomal pH measurements in primary microglia 24 h after incubation with Sarkosyl-insoluble fractions from tau-P301S mouse brain homogenates with or without tetrandrine treatment. The Sarkosyl vehicle was used as the control. BafA1 was used to induce lysosomal alkalinization. Data are summarized as the mean ± SEM from 3 independent experiments. *Indicates p < 0.05. B Representative micrographs showing the localization of phagocytosed tau in microglia. Lamp1 and AT-8 were employed to label lysosomes and phosphor-tau, respectively. The enlarged images show the magnified region in the white boxes from the merged images. White arrowheads indicate the colocalization of tau and Lamp1, and their degree of colocalization was analysed with ImageJ with the colocalization plugin. The red and green traces in the line profile show the intensity of red and green colour in arbitrary units (a.u.) along the white line indicated in the enlarged images. Data are summarized as the mean ± SEM from 15 images analysed in each group. *Indicates p < 0.05. C Representative micrographs showing the phagocytosis assay of red fluorescent microspheres under the influence of tetrandrine (TET) and bafilomycin A1 (BafA1) in primary microglia 24 h after incubation with Sarkosyl-insoluble (SI) fractions of P301S tau mouse brain homogenates or Sarkosyl vehicle only. Data are summarized as the mean ± SEM from 15 images analysed in each group. *Indicates p < 0.05CC BY · PubMed Central
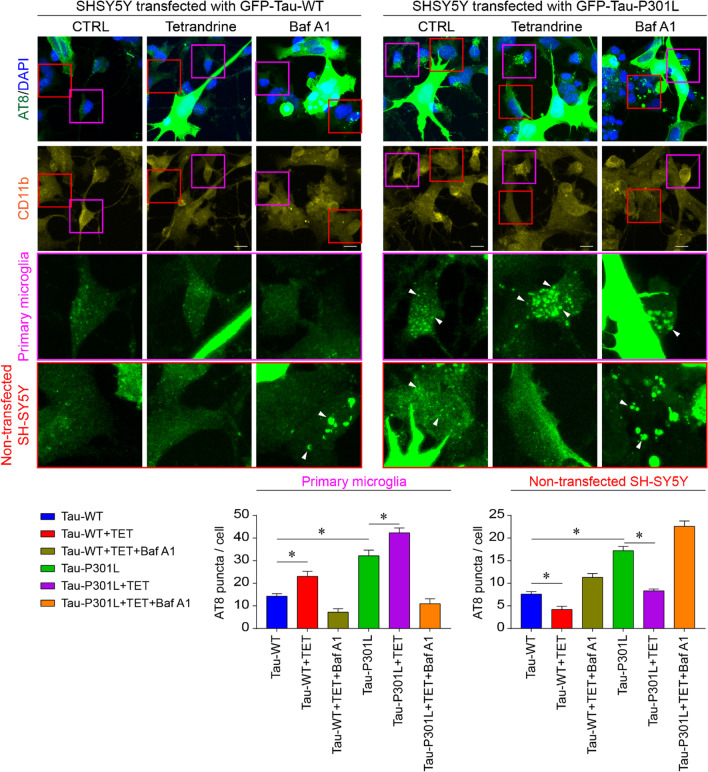
Fig. 8 Tetrandrine reduces pathological tau transmission. Representative micrograph showing coculture of SH-SY5Y cells transfected with GFP-Tau-WT or GFP-tau-P301L with primary microglia. Hyperphosphorylated tau aggregates and primary microglial cells were stained with AT8 and CD11b, respectively. Red and purple boxes indicate the magnified regions for nontransfected SH-SY5Y cells and microglia, respectively. White arrowheads indicate transmission of AT8-positive puncta to primary microglia and nontransfected SH-SY5Y cells with or without tetrandrine or with BafA1. Bar charts depict the number of AT8-positive puncta transmitted to microglia or nontransfected SH-SY5Y cells. Data are summarized as the mean ± SEM from 15 images analysed in each group. *Indicates p < 0.05
Fig. 8 Tetrandrine reduces pathological tau transmission. Representative micrograph showing coculture of SH-SY5Y cells transfected with GFP-Tau-WT or GFP-tau-P301L with primary microglia. Hyperphosphorylated tau aggregates and primary microglial cells were stained with AT8 and CD11b, respectively. Red and purple boxes indicate the magnified regions for nontransfected SH-SY5Y cells and microglia, respectively. White arrowheads indicate transmission of AT8-positive puncta to primary microglia and nontransfected SH-SY5Y cells with or without tetrandrine or with BafA1. Bar charts depict the number of AT8-positive puncta transmitted to microglia or nontransfected SH-SY5Y cells. Data are summarized as the mean ± SEM from 15 images analysed in each group. *Indicates p < 0.05CC BY · PubMed Central

Verification

Claims the paper makes

The claims and statistics of this paper haven’t been checked yet.

Run the check — free, no account needed. It reads the open-access text and checks the sources it cites.

A few free checks a day · papers already verified open instantly · results are public

Claims other papers make about this one

Each is checked against this paper’s own text: does it say what the citing paper says it does?

Self-check

Percentages, sums and reported differences re-computed from the paper’s own numbers.

The self-check needs the paper’s full text.

Citations

Cites

Research works printed but not linked: 70

  1. As A. 2017 Alzheimer’s disease facts and figures. Alzheimers Dement. 2017;13(4):325–73. · DOI
  2. Hardy J, Selkoe DJ. The amyloid hypothesis of Alzheimer’s disease: progress and problems on the road to therapeutics. Science. 2002;297(5580):353–6. · DOI · Paper page
  3. Nixon RA, Yang D-S. Autophagy failure in Alzheimer’s disease—locating the primary defect. Neurobiol Dis. 2011;43(1):38–45. · DOI · Paper page
  4. Xin S-H, Tan L, Cao X, Yu J-T, Tan L. Clearance of amyloid beta and tau in Alzheimer’s disease: from mechanisms to therapy. Neurotox Res. 2018;34(3):733–48. · DOI
  5. Song JX, Malampati S, Zeng Y, Durairajan SSK, Yang CB, Tong BCK, et al. A small molecule transcription factor EB activator ameliorates beta-amyloid precursor protein and Tau pathology in Alzheimer’s disease models. Aging Cell. 2020;19(2): e13069.
  6. Luo R, Su L-Y, Li G, Yang J, Liu Q, Yang L-X, et al. Activation of PPARA-mediated autophagy reduces Alzheimer disease-like pathology and cognitive decline in a murine model. Autophagy. 2020;16(1):52–69. · DOI · Paper page
  7. Uddin M, Stachowiak A, Mamun AA, Tzvetkov NT, Takeda S, Atanasov AG, et al. Autophagy and Alzheimer’s disease: from molecular mechanisms to therapeutic implications. Frontiers in Aging Neuroscience. 2018;10:4. · DOI · Paper page
  8. Mizushima N. Autophagy: process and function. Genes Dev. 2007;21(22):2861–73. · DOI
  9. Coffey EE, Beckel JM, Laties AM, Mitchell CH. Lysosomal alkalization and dysfunction in human fibroblasts with the Alzheimer’s disease-linked presenilin 1 A246E mutation can be reversed with cAMP. Neuroscience. 2014;263:111–24. · DOI
  10. Neely KM, Green KN, LaFerla FM. Presenilin is necessary for efficient proteolysis through the autophagy–lysosome system in a γ-secretase-independent manner. J Neurosci. 2011;31(8):2781–91. · DOI · Paper page
  11. Neely KM, Green KN. Presenilins mediate efficient proteolysis via the autophagosome-lysosome system. Autophagy. 2011;7(6):664–5. · DOI
  12. Lee J-H, Yu WH, Kumar A, Lee S, Mohan PS, Peterhoff CM, et al. Lysosomal proteolysis and autophagy require presenilin 1 and are disrupted by Alzheimer-related PS1 mutations. Cell. 2010;141(7):1146–58. · DOI · Paper page
  13. Ittner LM, Götz J. Amyloid-β and tau—a toxic pas de deux in Alzheimer’s disease. Nat Rev Neurosci. 2011;12(2):67. · DOI · Paper page
  14. Stamer K, Vogel R, Thies E, Mandelkow E, Mandelkow E-M. Tau blocks traffic of organelles, neurofilaments, and APP vesicles in neurons and enhances oxidative stress. J Cell Biol. 2002;156(6):1051–63. · DOI · Paper page
  15. Chong FP, Ng KY, Koh RY, Chye SM. Tau proteins and tauopathies in Alzheimer’s disease. Cell Mol Neurobiol. 2018;38(5):965–80. · DOI
  16. Dumanchin C, Camuzat A, Campion D, Verpillat P, Hannequin D, Dubois B, et al. Segregation of a missense mutation in the microtubule-associated protein tau gene with familial frontotemporal dementia and parkinsonism. Hum Mol Genet. 1998;7(11):1825–9. · DOI
  17. Iqbal K, Liu F, Gong C-X, Grundke-Iqbal I. Tau in Alzheimer disease and related tauopathies. Curr Alzheimer Res. 2010;7(8):656–64. · DOI
  18. Oddo S, Caccamo A, Kitazawa M, Tseng BP, LaFerla FM. Amyloid deposition precedes tangle formation in a triple transgenic model of Alzheimer’s disease. Neurobiol Aging. 2003;24(8):1063–70. · DOI · Paper page
  19. Yanamandra K, Kfoury N, Jiang H, Mahan TE, Ma S, Maloney SE, et al. Anti-tau antibodies that block tau aggregate seeding in vitro markedly decrease pathology and improve cognition in vivo. Neuron. 2013;80(2):402–14. · DOI · Paper page
  20. Allen B, Ingram E, Takao M, Smith MJ, Jakes R, Virdee K, et al. Abundant tau filaments and nonapoptotic neurodegeneration in transgenic mice expressing human P301S tau protein. J Neurosci. 2002;22(21):9340–51. · DOI
  21. Hampton DW, Webber DJ, Bilican B, Goedert M, Spillantini MG, Chandran S. Cell-mediated neuroprotection in a mouse model of human tauopathy. J Neurosci. 2010;30(30):9973–83. · DOI
  22. Scattoni ML, Gasparini L, Alleva E, Goedert M, Calamandrei G, Spillantini MG. Early behavioural markers of disease in P301S tau transgenic mice. Behav Brain Res. 2010;208(1):250–7. · DOI
  23. Xu H, Rosler WT, Carlsson T, de Andrade A, Fiala O, Hollerhage M, et al. Tau silencing by siRNA in the P301S mouse model of tauopathy. Curr Gene Ther. 2014;14(5):343–51. · DOI
  24. Schildge S, Bohrer C, Beck K, Schachtrup C. Isolation and culture of mouse cortical astrocytes. JoVE. 2013;71: e50079.
  25. Cheung K-H, Mei L, Mak D-OD, Hayashi I, Iwatsubo T, Kang DE, et al. Gain-of-function enhancement of IP3 receptor modal gating by familial Alzheimer’s disease–linked presenilin mutants in human cells and mouse neurons. Sci Signal. 2010;3(114):22.
  26. Tong BC-K, Lee CS-K, Cheng W-H, Lai K-O, Foskett JK, Cheung K-H. Familial Alzheimer’s disease–associated presenilin 1 mutants promote γ-secretase cleavage of STIM1 to impair store-operated Ca2+ entry. Sci Signal. 2016;9(444):ra89-ra.
  27. Ambrosio AL, Boyle JA, Di Pietro SM. TPC2 mediates new mechanisms of platelet dense granule membrane dynamics through regulation of Ca2+ release. Mol Biol Cell. 2015;26(18):3263–74. · DOI
  28. Edelstein AD, Tsuchida MA, Amodaj N, Pinkard H, Vale RD, Stuurman N. Advanced methods of microscope control using μManager software. J Biol Methods. 2014. https://doi.org/10.14440/jbm.2014.36. · DOI
  29. Wang X, Fan H, Ying Z, Li B, Wang H, Wang G. Degradation of TDP-43 and its pathogenic form by autophagy and the ubiquitin-proteasome system. Neurosci Lett. 2010;469(1):112–6. · DOI · Paper page
  30. Zhang Z-H, Wu Q-Y, Zheng R, Chen C, Chen Y, Liu Q, et al. Selenomethionine mitigates cognitive decline by targeting both tau hyperphosphorylation and autophagic clearance in an Alzheimer’s disease mouse model. J Neurosci. 2017;37(9):2449–62. · DOI
  31. Rosas LE, Elgamal OA, Mo X, Phelps MA, Schmittgen TD, Papenfuss TL. In vitro immunotoxicity assessment of culture-derived extracellular vesicles in human monocytes. J Immunotoxicol. 2016;13(5):652–65. · DOI
  32. Xu H, Rösler TW, Carlsson T, de Andrade A, Bruch J, Höllerhage M, et al. Memory deficits correlate with tau and spine pathology in P 301 S MAPT transgenic mice. Neuropathol Appl Neurobiol. 2014;40(7):833–43. · DOI
  33. Patel S, Docampo R. Acidic calcium stores open for business: expanding the potential for intracellular Ca2+ signaling. Trends Cell Biol. 2010;20(5):277–86. · DOI · Paper page
  34. Kenessey A, Nacharaju P, Ko LW, Yen SH. Degradation of tau by lysosomal enzyme cathepsin D: implication for Alzheimer neurofibrillary degeneration. J Neurochem. 1997;69(5):2026–38. · DOI
  35. Hamano T, Gendron TF, Causevic E, Yen SH, Lin WL, Isidoro C, et al. Autophagic-lysosomal perturbation enhances tau aggregation in transfectants with induced wild-type tau expression. Eur J Neurosci. 2008;27(5):1119–30. · DOI · Paper page
  36. Tak H, Haque MM, Kim MJ, Lee JH, Baik J-H, Kim Y, et al. Bimolecular fluorescence complementation; lighting-up tau-tau interaction in living cells. PLoS ONE. 2013;8(12): e81682.
  37. Small SA, Simoes-Spassov S, Mayeux R, Petsko GA. Endosomal traffic jams represent a pathogenic hub and therapeutic target in Alzheimer’s disease. Trends Neurosci. 2017;40(10):592–602. · DOI · Paper page
  38. Birgisdottir ÅB, Johansen T. Autophagy and endocytosis–interconnections and interdependencies. J Cell Sci. 2020;133(10):jcs228114. · DOI
  39. Vassileva K, Marsh M, Patel S. Two-pore channels as master regulators of membrane trafficking and endocytic well-being. Curr Opin Physio. 2020;17:163–8. · DOI
  40. Guha S, Baltazar GC, Coffey EE, Tu L-A, Lim JC, Beckel JM, et al. Lysosomal alkalinization, lipid oxidation, and reduced phagosome clearance triggered by activation of the P2X7 receptor. FASEB J. 2013;27(11):4500. · DOI
  41. Jiang L, Salao K, Li H, Rybicka JM, Yates RM, Luo XW, et al. Intracellular chloride channel protein CLIC1 regulates macrophage function through modulation of phagosomal acidification. J Cell Sci. 2012;125(22):5479–88.
  42. Zhang H, Cao Y, Ma L, Wei Y, Li H. Possible mechanisms of tau spread and toxicity in Alzheimer’s disease. Front Cell Dev Biol. 2021. https://doi.org/10.3389/fcell.2021.707268. · DOI
  43. Lee MJ, Lee JH, Rubinsztein DC. Tau degradation: the ubiquitin–proteasome system versus the autophagy-lysosome system. Prog Neurobiol. 2013;105:49–59. · DOI · Paper page
  44. Su T, Yang M, Wang P, Zhao Y, Ma C. Interplay between the ubiquitin proteasome system and ubiquitin-mediated autophagy in plants. Cells. 2020;9(10):2219. · DOI
  45. Jiang S, Bhaskar K. Degradation and transmission of tau by autophagic-endolysosomal networks and potential therapeutic targets for tauopathy. Front Mol Neurosci. 2020. https://doi.org/10.3389/fnmol.2020.586731. · DOI
  46. Subramanian M, Hyeon SJ, Das T, Suh YS, Kim YK, Lee J-S, et al. UBE4B, a microRNA-9 target gene, promotes autophagy-mediated Tau degradation. Nat Commun. 2021;12(1):1–15. · DOI · Paper page
  47. Mahoney R, Thomas EO, Ramirez P, Miller HE, Beckmann A, Zuniga G, et al. Pathogenic tau causes a toxic depletion of nuclear calcium. Cell Rep. 2020;32(2): 107900. · DOI
  48. Britti E, Ros J, Esteras N, Abramov AY. Tau inhibits mitochondrial calcium efflux and makes neurons vulnerable to calcium-induced cell death. Cell Calcium. 2020;86: 102150. · DOI
  49. Amal H, Gong G, Gjoneska E, Lewis SM, Wishnok JS, Tsai L-H, et al. S-nitrosylation of E3 ubiquitin-protein ligase RNF213 alters non-canonical Wnt/Ca+ 2 signaling in the P301S mouse model of tauopathy. Transl Psychiatry. 2019;9(1):1–12. · DOI
  50. Gunaratne GS, Brailoiu E, He S, Unterwald EM, Patel S, Slama JT, et al. Essential requirement for JPT2 in NAADP-evoked Ca2+ signaling. Sci Signal. 2021;14(675):eabd5605. · DOI
  51. Zhang Y, Chan L-H, Tunn R, Ruas M, Gay D, Todorcevic M, et al. Two-pore channel 2 is a key regulator of adipocyte differentiation via the cAMP signaling pathway with calpain as downstream effector. BioRxiv. 2021. https://doi.org/10.1101/2021.03.20.436264v1. · DOI
  52. Angelova PR, Choi ML, Berezhnov AV, Horrocks MH, Hughes CD, De S, et al. Alpha synuclein aggregation drives ferroptosis: an interplay of iron, calcium and lipid peroxidation. Cell Death Differ. 2020;27(10):2781–96. · DOI
  53. Kandel N, Zheng T, Huo Q, Tatulian SA. Membrane binding and pore formation by a cytotoxic fragment of amyloid β peptide. J Phys Chem B. 2017;121(45):10293–305. · DOI
  54. Flach K, Hilbrich I, Schiffmann A, Gärtner U, Krüger M, Leonhardt M, et al. Tau oligomers impair artificial membrane integrity and cellular viability. J Biol Chem. 2012;287(52):43223–33. · DOI · Paper page
  55. Gerndt S, Chen C-C, Chao Y-K, Yuan Y, Burgstaller S, Rosato AS, et al. Agonist-mediated switching of ion selectivity in TPC2 differentially promotes lysosomal function. Elife. 2020;9: e54712. · DOI
  56. Cosker F, Cheviron N, Yamasaki M, Menteyne A, Lund FE, Moutin M-J, et al. The ecto-enzyme CD38 is a nicotinic acid adenine dinucleotide phosphate (NAADP) synthase that couples receptor activation to Ca2+ mobilization from lysosomes in pancreatic acinar cells. J Biol Chem. 2010;285(49):38251–9. · DOI
  57. Morgan AJ, Galione A. NAADP induces pH changes in the lumen of acidic Ca2+ stores. Biochemical Journal. 2007;402(2):301–10. · DOI
  58. Yim WWY, Mizushima N. Lysosome biology in autophagy. Cell Discov. 2020;6(1):1–12.
  59. Krüger U, Wang Y, Kumar S, Mandelkow E-M. Autophagic degradation of tau in primary neurons and its enhancement by trehalose. Neurobiol Aging. 2012;33(10):2291–305. · DOI · Paper page
  60. Polanco JC, Hand GR, Briner A, Li C, Götz J. Exosomes induce endolysosomal permeabilization as a gateway by which exosomal tau seeds escape into the cytosol. Acta Neuropathol. 2021;141(2):235–56. · DOI
  61. Calafate S, Flavin W, Verstreken P, Moechars D. Loss of Bin1 promotes the propagation of tau pathology. Cell Rep. 2016;17(4):931–40. · DOI · Paper page
  62. Nixon RA, Wegiel J, Kumar A, Yu WH, Peterhoff C, Cataldo A, et al. Extensive involvement of autophagy in Alzheimer disease: an immuno-electron microscopy study. J Neuropathol Exp Neurol. 2005;64(2):113–22. · DOI · Paper page
  63. Zhang W, Bai J, Hang K, Xu J, Zhou C, Li L, et al. Role of lysosomal acidification dysfunction in mesenchymal stem cell senescence. Front Cell Dev Biol. 2022;10:817877. · DOI
  64. Hanger DP, Wray S. Tau cleavage and tau aggregation in neurodegenerative disease. Biochem Soc Trans. 2010;38(4):1016–20. · DOI
  65. Friedman LG, Qureshi YH, Yu WH. Promoting autophagic clearance: viable therapeutic targets in Alzheimer’s disease. Neurotherapeutics. 2015;12(1):94–108. · DOI
  66. Bednarski E, Lynch G. Selective suppression of cathepsin L results from elevations in lysosomal pH and is followed by proteolysis of tau protein. NeuroReport. 1998;9(9):2089–94. · DOI
  67. Perea JR, Llorens-Martín M, Ávila J, Bolós M. The role of microglia in the spread of tau: relevance for tauopathies. Front Cell Neurosci. 2018;12:172. · DOI
  68. de Araujo ME, Liebscher G, Hess MW, Huber LA. Lysosomal size matters. Traffic. 2020;21(1):60–75. · DOI
  69. Huotari J, Helenius A. Endosome maturation. EMBO J. 2011;30(17):3481–500. · DOI
  70. Bourdenx M, Daniel J, Genin E, Soria FN, Blanchard-Desce M, Bezard E, et al. Nanoparticles restore lysosomal acidification defects: Implications for Parkinson and other lysosomal-related diseases. Autophagy. 2016;12(3):472–83. · DOI

Cited by

Sorted by citations

See all 47

Metadata

Authors
Tong, B. C.-K., Huang, A. S., Wu, A. J., Iyaswamy, A., Ho, O. K.-Y., Kong, A. H.-Y., Sreenivasmurthy, S. G., Zhu, Z., Su, C., Liu, J., Song, J., Li, M., & Cheung, K.-H.
Venue
Journal of Biomedical Science
Published
2022-10-22
Volume
29
Issue
1
ISSN
1423-0127
Cited by
47
References
9
Language
en
Funders
  • University Grants Committee (HKBU/17104514, HKBU/12100321, HKBU/12100618)
  • Health and Medical Research Fund (15163421, 17182561)
  • Natural Science Foundation of Guangdong Province (2019A1515011756)

About these checks

Registry, retraction, Cites and statistics results are computed, not judged, with one exception: a printed reference that no index lists is read once by a model before it counts as a citation error. Claims are extracted by a model and kept only when their quote appears verbatim in the text; each cited source is then checked, with a model’s help, for whether it says what the claim relies on. Those verdicts can be wrong — read the claim’s quote and the cited source before relying on one.

Statistics and arithmetic are recomputed, not judged.

Confidence bands are shown only for fields calibrated on our annotated test set. None is calibrated yet, so no band is shown.

What counts as a claim ›How we measure confidence ›How we check this ›

Are you an author, or do you see a problem with this page? Request a review