

The DOI matches its Crossref record; 48 of the 48 references it cites were found in a registry or an index.
Effects of powdered Montmorency tart cherry supplementation on acute endurance exercise performance in aerobically trained individuals
Open accessAbstract
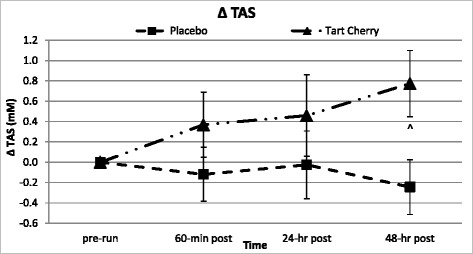
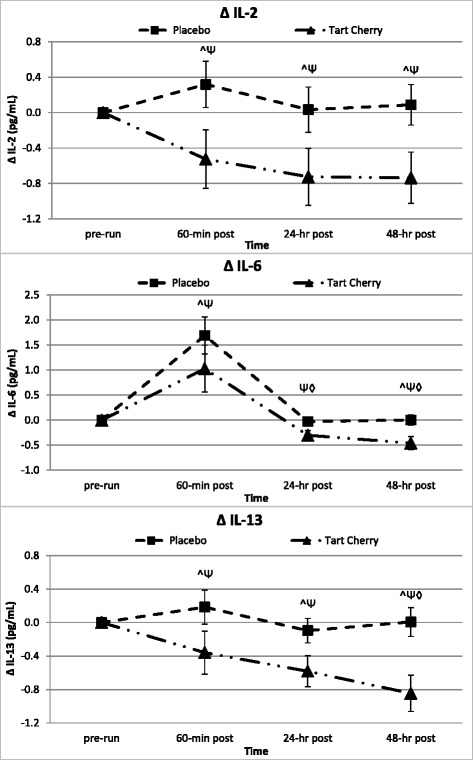
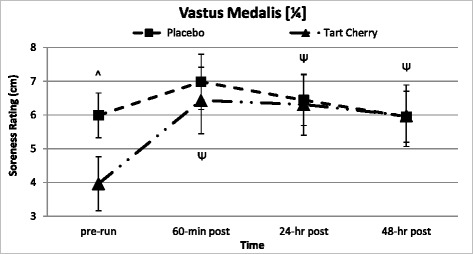
BACKGROUND: The purpose of this study was to determine whether short-term supplementation of a powdered tart cherry supplement prior to and following stressful endurance exercise would affect markers of muscle damage, inflammation, oxidative stress, and/or muscle soreness. METHODS: 27 endurance-trained runners or triathlete (21.8 ± 3.9 years, 15.0 ± 6.0 % body fat, 67.4 ± 11.8 kg) men (n = 18) and women (n = 9) were matched based on average reported race pace, age, body mass, and fat free mass. Subjects were randomly assigned to ingest, in a double-blind manner, capsules containing 480 mg of a rice flour placebo (P, n = 16) or powdered tart cherries [CherryPURE®] (TC, n = 11). Subjects supplemented one time daily (480 mg/day) for 10-d, including race day, up to 48-hr post-run. Subjects completed a half-marathon run (21.1 km) under 2-hr (111.98 ± 11.9 min). Fasting blood samples and quadriceps muscle soreness ratings using an algometer with a graphic pain rating scale were taken pre-run, 60-min, 24 and 48-h post-run and analyzed by MANOVA with repeated measures. RESULTS: Subjects in the TC group averaged 13 % faster half-marathon race finish times (p = 0.001) and tended to have smaller deviations from predicted race pace (p = 0.091) compared to P. Attenuations in TC muscle catabolic markers were reported over time for creatinine (p = 0.047), urea/blood urea nitrogen (p = 0.048), total protein (p = 0.081), and cortisol (p = 0.016) compared to P. Despite lower antioxidant activity pre-run in TC compared to P, changes from pre-run levels revealed a linear increase in antioxidant activity at 24 and 48-h of recovery in TC that was statistically different (16-39 %) from P and pre-run levels. Inflammatory markers were 47 % lower in TC compared to P over time (p = 0.053) coupled with a significant difference between groups (p = 0.017). Soreness perception between the groups was different over time in the medial quadriceps (p = 0.035) with 34 % lower pre-run soreness in TC compared to P. Over the 48-h recovery period, P changes in medial quadriceps soreness from pre-run measures were smaller compared to TC. CONCLUSION: Results revealed that short-term supplementation of Montmorency powdered tart cherries surrounding an endurance challenge attenuated markers of muscle catabolism, reduced immune and inflammatory stress, better maintained redox balance, and increased performance in aerobically trained individuals.
Overview
The claims and statistics of this paper haven’t been checked yet.
Run the check — free, no account needed. It reads the open-access text and checks the sources it cites.
Integrity signals
Registry
Cites
Statistics
Figures
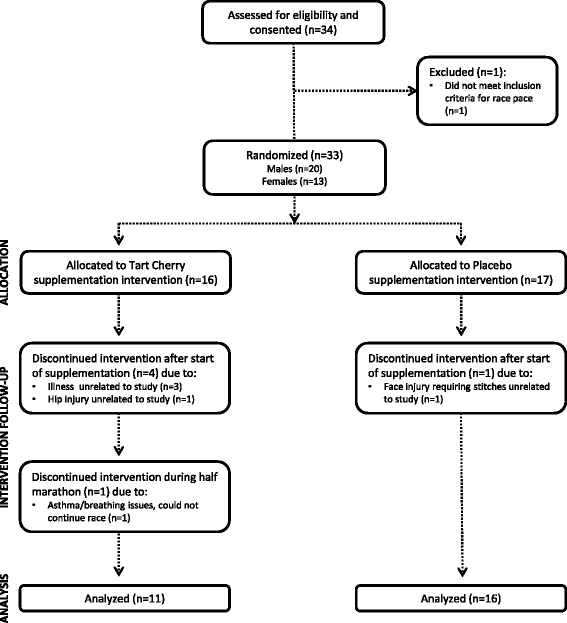
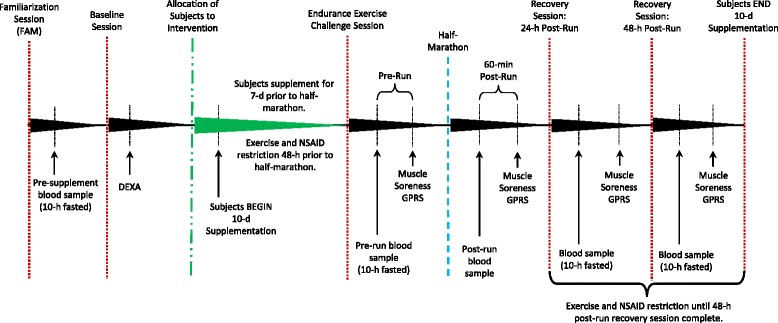
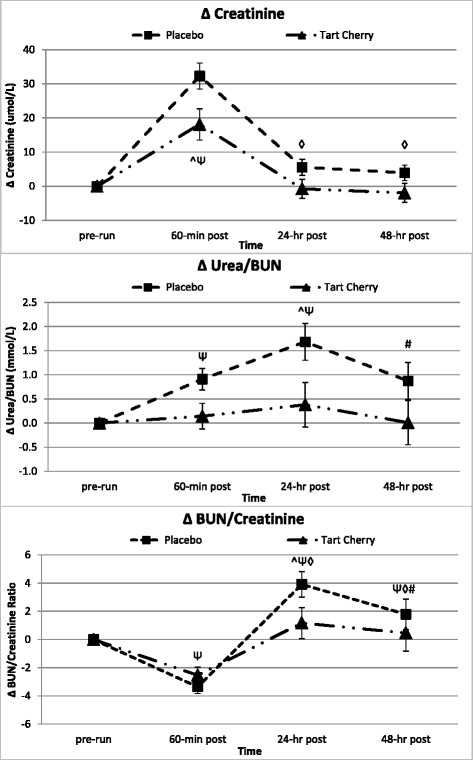
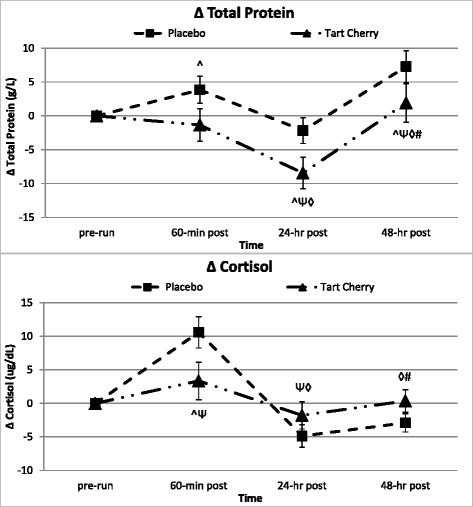
Verification
Claims the paper makes
The claims and statistics of this paper haven’t been checked yet.
Run the check — free, no account needed. It reads the open-access text and checks the sources it cites.
Claims other papers make about this one
Each is checked against this paper’s own text: does it say what the citing paper says it does?
In the citing paper
“For example, Levers et al. (2015) found significant beneficial effects on serum markers of muscle catabolism, physiological stress, and inflammatory mechanisms after a short-term supplementation with 480 mg·day−1 of Montmorency powdered tart cherries surrounding a single bout of resistance exercise [103].”
From The 4R’s Framework of Nutritional Strategies for Post-Exercise Recovery: A Review with Emphasis on New Generation of Carbohydrates (2020) · cites this paper as [103]
Self-check
Percentages, sums and reported differences re-computed from the paper’s own numbers.
The self-check needs the paper’s full text.
Citations
Cites
Exercise-Induced Oxidative Stress: Cellular Mechanisms and Impact on Muscle Force Production
Powers, S. K., & Jackson, M. J. (2008) · Physiological Reviews · doi:10.1152/physrev.00031.2007 · Cited by 2,459
Antioxidants prevent health-promoting effects of physical exercise in humans
Ristow, M., Zarse, K., Oberbach, A., Klöting, N., Birringer, M., Kiehntopf, M., Stumvoll, M., Kahn, C. R., & Blüher, M. (2009) · Proceedings of the National Academy of Sciences · doi:10.1073/pnas.0903485106 · Cited by 1,582
Proske, U., & Morgan, D. L. (2001) · The Journal of Physiology · doi:10.1111/j.1469-7793.2001.00333.x · Cited by 1,418
Oxidative stress, exercise, and antioxidant supplementation
Urso, M. L., & Clarkson, P. M. (2003) · Toxicology · doi:10.1016/s0300-483x(03)00151-3 · Cited by 1,067
Immune function in sport and exercise
Gleeson, M. (2007) · Journal of Applied Physiology · doi:10.1152/japplphysiol.00008.2007 · Cited by 1,016
Gomez-Cabrera, M.-C., Domenech, E., Romagnoli, M., Arduini, A., Borras, C., Pallardo, F. V., Sastre, J., & Viña, J. (2008) · The American Journal of Clinical Nutrition · doi:10.1093/ajcn/87.1.142 · Cited by 844
Wang, H., Nair, M. G., Strasburg, G. M., Chang, Y.-C., Booren, A. M., Gray, J. I., & DeWitt, D. L. (1999) · Journal of Natural Products · doi:10.1021/np990184z · Cited by 633
Wang, H., Nair, M. G., Strasburg, G. M., Chang, Y.-C., Booren, A. M., Gray, J. I., & DeWitt, D. L. (1999) · Journal of Natural Products · doi:10.1021/np980501m · Cited by 501
Reactive Oxygen Species Are Signalling Molecules for Skeletal Muscle Adaptation
Powers, S. K., Duarte, J., Kavazis, A. N., & Talbert, E. E. (2010) · Experimental Physiology · doi:10.1113/expphysiol.2009.050526 · Cited by 440
Effects of exercise on lymphocytes and cytokines
Pedersen, B. K., & Toft, A. D. (2000) · British Journal of Sports Medicine · doi:10.1136/bjsm.34.4.246 · Cited by 402
Assay of total antioxidant capacity: comparison of four methods as applied to human blood plasma
Janaszewska, A., & Bartosz, G. (2002) · Scandinavian Journal of Clinical and Laboratory Investigation · doi:10.1080/003655102317475498 · Cited by 395
Howatson, G., McHugh, M. P., Hill, J. A., Brouner, J., Jewell, A. P., Van Someren, K. A., Shave, R. E., & Howatson, S. A. (2010) · Scandinavian Journal of Medicine & Science in Sports · doi:10.1111/j.1600-0838.2009.01005.x · Cited by 394
Antioxidant Supplementation during Exercise Training: Beneficial or Detrimental?
Peternelj, T.-T., & Coombes, J. S. (2011) · Sports Medicine · doi:10.2165/11594400-000000000-00000 · Cited by 314
Fischer, C. P., Hiscock, N. J., Penkowa, M., Basu, S., Vessby, B., Kallner, A., Sjöberg, L., & Pedersen, B. K. (2004) · The Journal of Physiology · doi:10.1113/jphysiol.2004.066779 · Cited by 293 · cited 1×
“The use of antioxidant supplements, such as vitamins C [12–15] and E [4, 14, 15], in athletic applications to help fortify the body’s endogenous antioxidant response has spurred some success.”
BackgroundKratz, A. F., Lewandrowski, K. B., Siegel, A. J., Chun, K. Y., Flood, J. G., Cott, E. M. V., & Lee-Lewandrowski, E. (2002) · American Journal of Clinical Pathology · doi:10.1309/14ty-2tdj-1x0y-1v6v · Cited by 279
Mastaloudis, A., Morrow, J. D., Hopkins, D. W., Devaraj, S., & Traber, M. G. (2004) · Free Radical Biology and Medicine · doi:10.1016/j.freeradbiomed.2004.02.069 · Cited by 244
Antioxidant Supplementation Reduces Skeletal Muscle Mitochondrial Biogenesis
Strobel, N., Peake, J. M., Matsumoto, A., Marsh, S. A., Coombes, J. S., & Wadley, G. D. (2010) · Medicine & Science in Sports & Exercise · doi:10.1249/mss.0b013e318203afa3 · Cited by 194
Quercetin's Influence on Exercise Performance and Muscle Mitochondrial Biogenesis
NIEMAN, D. C., WILLIAMS, A. S., SHANELY, R. A., JIN, F., MCANULTY, S. R., TRIPLETT, N. T., AUSTIN, M. D., & HENSON, D. A. (2010) · Medicine & Science in Sports & Exercise · doi:10.1249/mss.0b013e3181b18fa3 · Cited by 194
Cytokines in exertion-induced skeletal muscle injury
Cannon, J., & Pierre, B. S. S. (1998) · Molecular and Cellular Biochemistry · doi:10.1023/a:1006828425418 · Cited by 191
Antioxidant Supplementation Does Not Alter Endurance Training Adaptation
Yfanti, C., Akerstrom, T. C. A., Nielsen, S. J., Nielsen, A. R., Mounier, R., Mortensen, O. H., Lykkesfeldt, J., Rose, A. J., Fischer, C. P., & Pedersen, B. K. (2010) · Medicine & Science in Sports & Exercise · doi:10.1249/mss.0b013e3181cd76be · Cited by 182
Bell, P., Walshe, I. H., Davison, G. W., Stevenson, E., & Howatson, G. (2014) · Nutrients · doi:10.3390/nu6020829 · Cited by 166
Contraction-induced muscle damage is unaffected by vitamin E supplementation
Beaton, L. J., ALLAN, D. A., Tarnopolsky, M. A., Tiidus, P. M., & Phillips, S. M. (2002) · Medicine & Science in Sports & Exercise · doi:10.1097/00005768-200205000-00012 · Cited by 161
Changes in Bone Mineral Content in Male Athletes: Mechanisms of Action and Intervention Effects
Klesges, R. C. (1996) · JAMA · doi:10.1001/jama.1996.03540030060033 · Cited by 157
Theodorou, A. A., Nikolaidis, M. G., Paschalis, V., Koutsias, S., Panayiotou, G., Fatouros, I. G., Koutedakis, Y., & Jamurtas, A. Z. (2011) · American Journal of Clinical Nutrition · doi:10.3945/ajcn.110.009266 · Cited by 152
Effects of Quercetin and EGCG on Mitochondrial Biogenesis and Immunity
Nieman, D. C., Henson, D. A., Maxwell, K. R., Williams, A. S., McAnulty, S. R., Jin, F., Shanely, R. A., & Lines, T. C. (2009) · Medicine & Science in Sports & Exercise · doi:10.1249/mss.0b013e318199491f · Cited by 148
Close, G. L., Ashton, T., Cable, N. T., Doran, D. A., Holloway, C., McArdle, F., & MacLaren, D. P. M. (2006) · British Journal Of Nutrition · doi:10.1079/bjn20061732 · Cited by 148
Lyall, K. A., Hurst, S. M., Cooney, J. M., Jensen, D., Lo, K., Hurst, R. D., & Stevenson, L. M. (2009) · American Journal of Physiology-Regulatory, Integrative and Comparative Physiology · doi:10.1152/ajpregu.90740.2008 · Cited by 146
McAnulty, L. S., Nieman, D. C., Dumke, C. L., Shooter, L. A., Henson, D. A., Utter, A. C., Milne, G., & McAnulty, S. R. (2011) · Applied Physiology, Nutrition, and Metabolism · doi:10.1139/h11-120 · Cited by 145
Efficacy of tart cherry juice in reducing muscle pain during running: a randomized controlled trial
Kuehl, K. S., Perrier, E. T., Elliot, D. L., & Chesnutt, J. C. (2010) · Journal of the International Society of Sports Nutrition · doi:10.1186/1550-2783-7-17 · Cited by 144
Bryer, S. C., & Goldfarb, A. H. (2006) · International Journal of Sport Nutrition and Exercise Metabolism · doi:10.1123/ijsnem.16.3.270 · Cited by 137
Bell, P. G., Walshe, I. H., Davison, G. W., Stevenson, E., & Howatson, G. (2014) · Applied Physiology, Nutrition, and Metabolism · doi:10.1139/apnm-2014-0244 · Cited by 126
Prolonged Vitamin C Supplementation and Recovery from Demanding Exercise
Thompson, D., Williams, C., McGregor, S. J., Nicholas, C. W., McArdle, F., Jackson, M. J., & Powell, J. R. (2001) · International Journal of Sport Nutrition and Exercise Metabolism · doi:10.1123/ijsnem.11.4.466 · Cited by 123
Does Antioxidant Vitamin Supplementation Protect against Muscle Damage?
McGinley, C., Shafat, A., & Donnelly, A. (2009) · Sports Medicine · doi:10.2165/11317890-000000000-00000 · Cited by 119
Acute immune response in respect to exercise-induced oxidative stress
Vider, J., Lehtmaa, J., Kullisaar, T., Vihalemm, T., Zilmer, K., Kairane, Č., Landõr, A., Karu, T., & Zilmer, M. (2001) · Pathophysiology · doi:10.1016/s0928-4680(00)00057-2 · Cited by 119
The Use of Nonsteroidal Anti-Inflammatory Drugs for Exercise-Induced Muscle Damage
Schoenfeld, B. J. (2012) · Sports Medicine · doi:10.1007/bf03262309 · Cited by 117
The role of cherries in exercise and health
Bell, P. G., McHugh, M. P., Stevenson, E., & Howatson, G. (2013) · Scandinavian Journal of Medicine and Science in Sports · doi:10.1111/sms.12085 · Cited by 102
Dietary strategies to recover from exercise-induced muscle damage
Sousa, M., Teixeira, V. H., & Soares, J. M. (2013) · International Journal of Food Sciences and Nutrition · doi:10.3109/09637486.2013.849662 · Cited by 98
Antioxidants Do Not Prevent Postexercise Peroxidation and May Delay Muscle Recovery
Teixeira, V. H., Valente, H., Casal, S. I. P., Marques, F., & Moreira, P. A. M. (2009) · Medicine & Science in Sports & Exercise · doi:10.1249/mss.0b013e31819fe8e3 · Cited by 97
Pilaczyńska-Szczȩśniak, Ł., Skarpańska-Stejnborn, A., Deskur-Śmielecka, E., Basta, P., & Horoszkiewicz-Hassan, M. (2005) · International Journal of Sport Nutrition and Exercise Metabolism · doi:10.1123/ijsnem.15.1.48 · Cited by 97
Grape extract improves antioxidant status and physical performance in elite male athletes.
Lafay, S., Jan, C., Nardon, K., Lemaire, B., Ibarra, A., Roller, M., Houvenaeghel, M., Juhel, C., & Cara, L. (2009) · Europe PMC (PubMed Central) · Cited by 76
Davison, G., & Gleeson, M. (2005) · International Journal of Sport Nutrition and Exercise Metabolism · doi:10.1123/ijsnem.15.5.465 · Cited by 55
Skarpańska-Stejnborn, A., Pilaczyńska-Szczȩśniak, Ł., Basta, P., Deskur-Śmielecka, E., & Horoszkiewicz-Hassan, M. (2008) · International Journal of Sport Nutrition and Exercise Metabolism · doi:10.1123/ijsnem.18.3.313 · Cited by 51
Acute phase immune responses in exercise
Cannon, J. G., & Blumberg, J. B. (2000) · Elsevier eBooks · doi:10.1016/b978-044482650-3/50008-0 · Cited by 43
Kang, S. W., Hahn, S., Kim, J.-K., Yang, S.-M., Park, B., & Lee, S. C. (2011) · Journal of Clinical Biochemistry and Nutrition · doi:10.3164/jcbn.11-46 · Cited by 42
Skarpańska-Stejnborn, A., Pilaczyńska-Szczȩśniak, Ł., Basta, P., & Deskur-Śmielecka, E. (2009) · International Journal of Sport Nutrition and Exercise Metabolism · doi:10.1123/ijsnem.19.2.186 · Cited by 41
An Evaluation of the Roche Cobas c 111
Bowling, J. L., & Katayev, A. (2010) · Laboratory Medicine · doi:10.1309/lm6t8d1lkqxvncac · Cited by 39
Moflehi, D., Kok, L.-Y., Kamalden, T. F. T., & Amri, S. (2012) · Global Journal of Health Science · doi:10.5539/gjhs.v4n4p48 · Cited by 32
Sureda, A., Ferrer, M. D., Mestre, A., Tur, J. A., & Pons, A. (2013) · International Journal of Sport Nutrition and Exercise Metabolism · doi:10.1123/ijsnem.23.1.31 · Cited by 21
Research works printed but not linked: 3
- Lafay S, 2009, J Sports Sci Med, 8, 468
- Almada A, Kreider R, Ransom J, Rasmussen C. Comparison of the reliability of repeated whole body DEXA scans to repeated spine and hip scans. J Bone Miner Res. 1999;14(9):S369.
- Skarpanska-Stejnborn A, 2009, Int J Sport Nutr, 19, 186
Cited by
Sorted by citations
A Review of the Health Benefits of Cherries
Kelley, D. S., Adkins, Y. C., & Laugero, K. D. (2018) · Nutrients · doi:10.3390/nu10030368 · Cited by 223
Harty, P. S., Cottet, M. L., Malloy, J. K., & Kerksick, C. M. (2019) · Sports Medicine - Open · doi:10.1186/s40798-018-0176-6 · Cited by 164
Heaton, L. E., Davis, J. K., Rawson, E. S., Nuccio, R. P., Witard, O. C., Stein, K. W., Baar, K., Carter, J. M., & Baker, L. B. (2017) · Sports Medicine · doi:10.1007/s40279-017-0759-2 · Cited by 158
Bell, P. G., Walshe, I. H., Davison, G. W., Stevenson, E., & Howatson, G. (2014) · Applied Physiology, Nutrition, and Metabolism · doi:10.1139/apnm-2014-0244 · Cited by 126
Martín-Rodríguez, A., Belinchón-deMiguel, P., Rubio-Zarapuz, A., Tornero-Aguilera, J. F., Martínez‐Guardado, I., Villanueva-Tobaldo, C. V., & Clemente‐Suárez, V. J. (2024) · Nutrients · doi:10.3390/nu16040571 · Cited by 130
Metadata
- Authors
- Levers, K., Dalton, R., Galvan, E., O’Connor, A., Goodenough, C., Simbo, S., Mertens-Talcott, S. U., Rasmussen, C., Greenwood, M., Riechman, S., Crouse, S., & Kreider, R. B.
- Affiliations
- Texas A&M University (US)
- Department of Nutrition and Food Science, Institute for Obesity Research and Program EvaluationTexas A&M University 77843-4243 College Station TX USA
- Corresponding author
- Kreider, Richard B.
- ORCID
- Venue
- Journal of the International Society of Sports Nutrition
- Publisher
- Informa UK Limited
- Published
- 2016-01-05
- Volume
- 13
- Issue
- 1
- Pages
- 22-22
- ISSN
- 1550-2783 (ISSN-L)
- PMC
- PMC4880859
- OpenAlex
- W2404670370
- Cited by
- 111
- References
- 48
- Citations by year
- 2026: 11 · 2025: 5 · 2024: 10 · 2023: 7 · 2022: 9 · 2021: 17 · 2020: 18 · 2019: 15 · 2018: 10 · 2017: 8
- FWCI
- 11.76
- Type
- journal article
- Language
- en
- Open access
- gold
- doi.org
- Licence
- Locations
- Journal of the International Society of Sports Nutrition (publishedVersion, cc-by)
- Europe PMC (PubMed Central) (publishedVersion, cc-by)
- PubMed Central (publishedVersion, cc-by)
- PubMed (publishedVersion)
- OakTrust (Texas A&M University Libraries) (submittedVersion)
- Funders
- Anderson Global Group (M1301858)
- Topics
- Health Sciences › Medicine › Physiology (medical) › Exercise and Physiological Responses
- Health Sciences › Nursing › Nutrition and Dietetics › Muscle metabolism and nutrition
- Health Sciences › Medicine › Orthopedics and Sports Medicine › Sports Performance and Training
- Keywords
- acute endurance exercise, half marathon, exercise performance, muscle damage, delayed onset muscle soreness, oxidative stress, antioxidant activity, inflammation, cortisol, creatine kinase, blood urea nitrogen, endurance-trained runners, triathletes, muscle catabolism
- MeSH terms
- Prunus avium, Adolescent, Adult, Antioxidants, Double-Blind Method, Female, Humans, Immunity, Inflammation, Male, Phytotherapy, Oxidation-Reduction, Physical Endurance, Placebos, Running, Biomarkers, Muscle, Skeletal, Dietary Supplements, Quadriceps Muscle, Young Adult, Myalgia
About these checks
Registry, retraction, Cites and statistics results are computed, not judged, with one exception: a printed reference that no index lists is read once by a model before it counts as a citation error. Claims are extracted by a model and kept only when their quote appears verbatim in the text; each cited source is then checked, with a model’s help, for whether it says what the claim relies on. Those verdicts can be wrong — read the claim’s quote and the cited source before relying on one.
Statistics and arithmetic are recomputed, not judged.
Confidence bands are shown only for fields calibrated on our annotated test set. None is calibrated yet, so no band is shown.
What counts as a claim ›How we measure confidence ›How we check this ›
Are you an author, or do you see a problem with this page? Request a review
