

The DOI matches its Crossref record; 34 of the 34 references it cites were found in a registry or an index; 45 of the 54 sources its claims cite were checked for support.
Crosstalk between astrocytes and microglia results in increased degradation of α-synuclein and amyloid-β aggregates
Open accessAbstract
Background: Alzheimer’s disease (AD) and Parkinson’s disease (PD) are characterized by brain accumulation of aggregated amyloid-beta (Aβ) and alpha-synuclein (αSYN), respectively. In order to develop effective therapies, it is crucial to understand how the Aβ/αSYN aggregates can be cleared. Compelling data indicate that neuroinflammatory cells, including astrocytes and microglia, play a central role in the pathogenesis of AD and PD. However, how the interplay between the two cell types affects their clearing capacity and consequently the disease progression remains unclear. Methods: The aim of the present study was to investigate in which way glial crosstalk influences αSYN and Aβ pathology, focusing on accumulation and degradation. For this purpose, human-induced pluripotent cell (hiPSC)-derived astrocytes and microglia were exposed to sonicated fibrils of αSYN or Aβ and analyzed over time. The capacity of the two cell types to clear extracellular and intracellular protein aggregates when either cultured separately or in co-culture was studied using immunocytochemistry and ELISA. Moreover, the capacity of cells to interact with and process protein aggregates was tracked using time-lapse microscopy and a customized “close-culture” chamber, in which the apical surfaces of astrocyte and microglia monocultures were separated by a <1 mm space. Results: Our data show that intracellular deposits of αSYN and Aβ are significantly reduced in co-cultures of astrocytes and microglia, compared to monocultures of either cell type. Analysis of conditioned medium and imaging data from the “close-culture” chamber experiments indicate that astrocytes secrete a high proportion of their internalized protein aggregates, while microglia do not. Moreover, co-cultured astrocytes and microglia are in constant contact with each other via tunneling nanotubes and other membrane structures. Notably, our live cell imaging data demonstrate that microglia, when attached to the cell membrane of an astrocyte, can attract and clear intracellular protein deposits from the astrocyte. Conclusions: Taken together, our data demonstrate the importance of astrocyte and microglia interactions in Aβ/αSYN clearance, highlighting the relevance of glial cellular crosstalk in the progression of AD- and PD-related brain pathology.
Overview
AI snapshot
Written from the paper’s full text.
TL;DR
Human iPSC-derived astrocytes and microglia were exposed to α-synuclein or amyloid-β fibrils in monoculture and co-culture to study glial crosstalk in aggregate clearance. Co-culture reduced intracellular αSYN and Aβ deposits, with astrocytes transferring aggregates to microglia via secretion and direct contact, including tunneling nanotubes.
Key findings
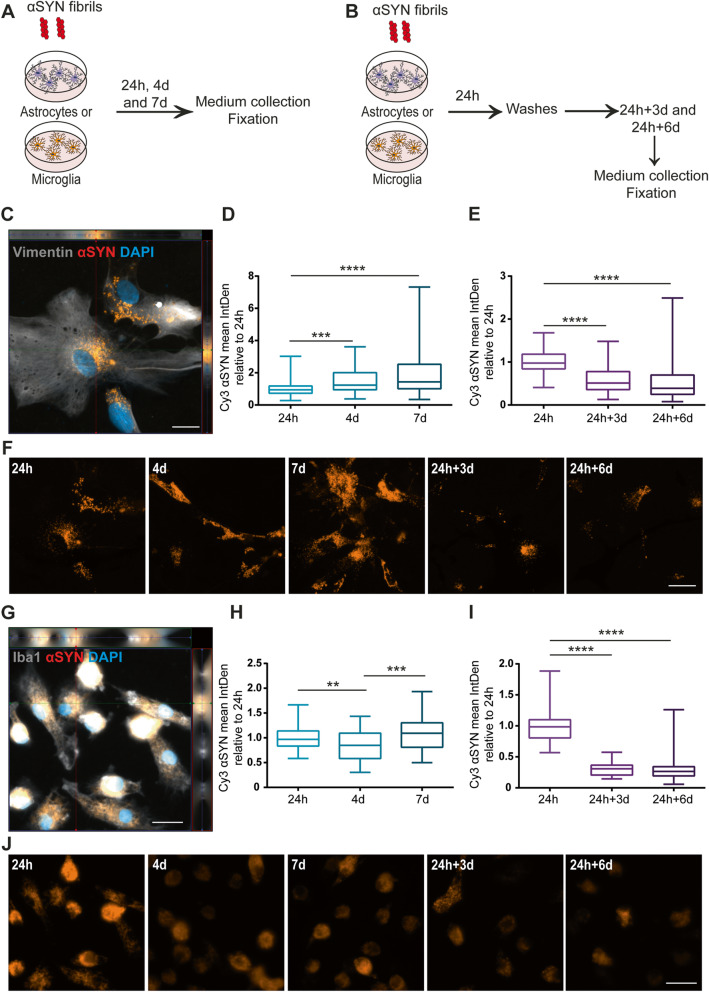
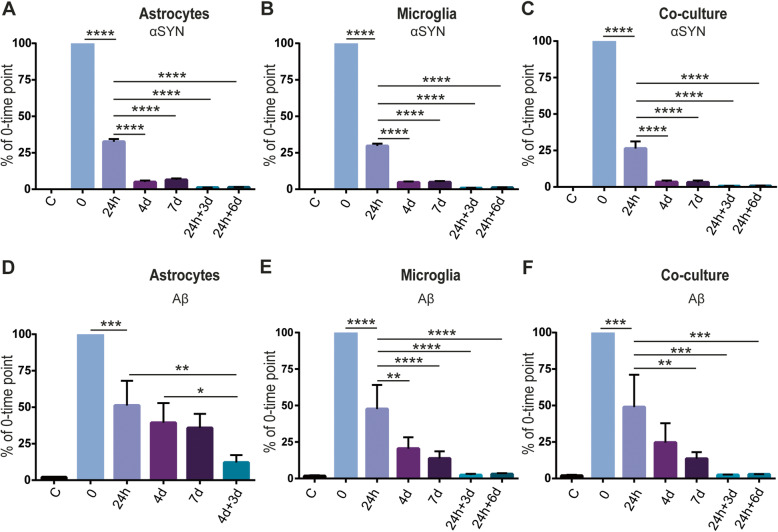
- In monocultures, astrocytes accumulated αSYN over 7 days, whereas microglia showed no increase from 24 h to 7 days and more effectively reduced intracellular αSYN after pulse-chase; some deposits remained in both monocultures at 24 h + 6 days.
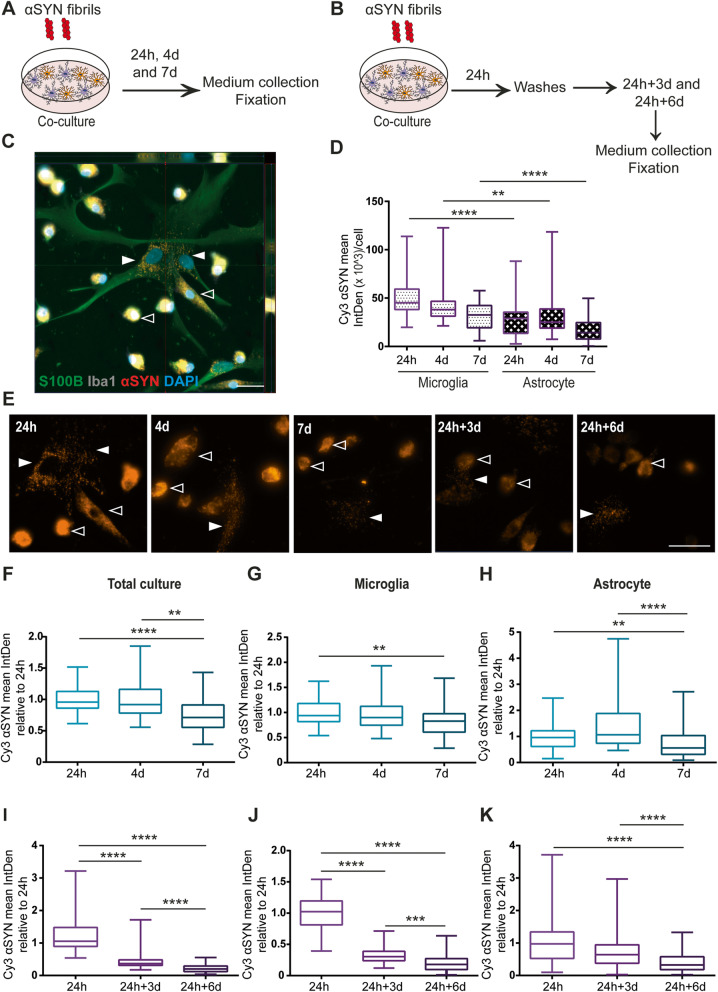
- In co-cultures, total intracellular αSYN was significantly reduced at day 7 versus 24 h, due to decreases in both microglia and astrocytes; astrocytic αSYN reduction was opposite to the accumulation seen in pure astrocyte cultures.
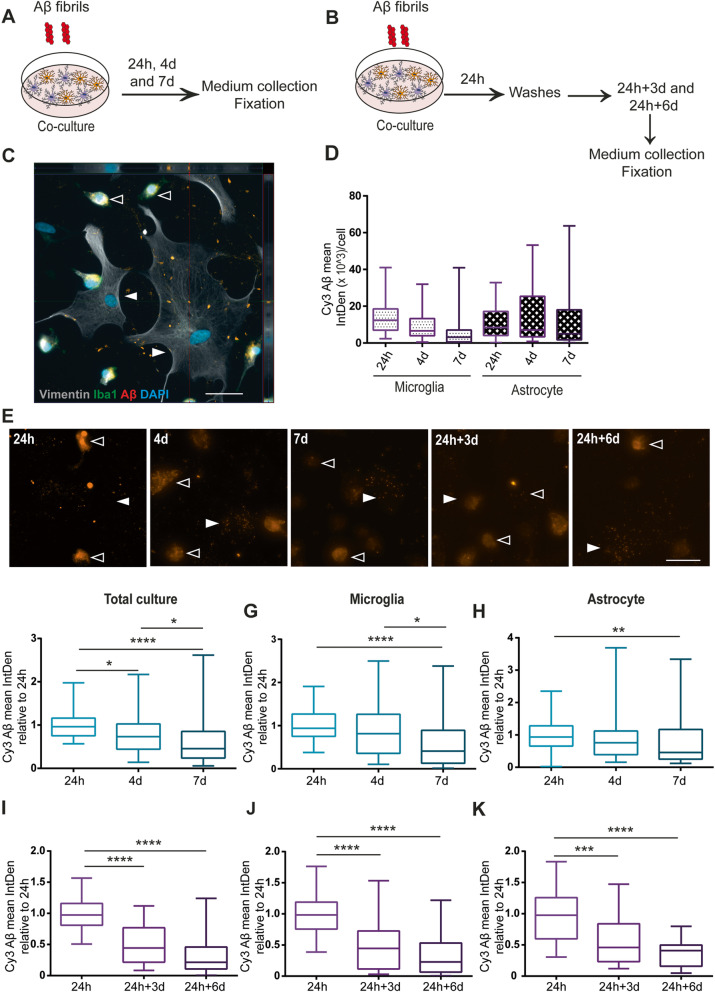
- For Aβ, co-culture reduced total intracellular Aβ at day 7 versus 24 h in both cell types, including a reduction in astrocytes that was not observed in astrocytic monocultures.
- ELISA showed that after 24 h, almost 75% of added αSYN was cleared from medium in all cultures; microglia cleared extracellular Aβ more effectively after 24 h, while astrocytes showed no significant Aβ uptake from 24 h to 7 days and had higher Aβ levels at 4 days + 3 days, suggesting greater secretion.
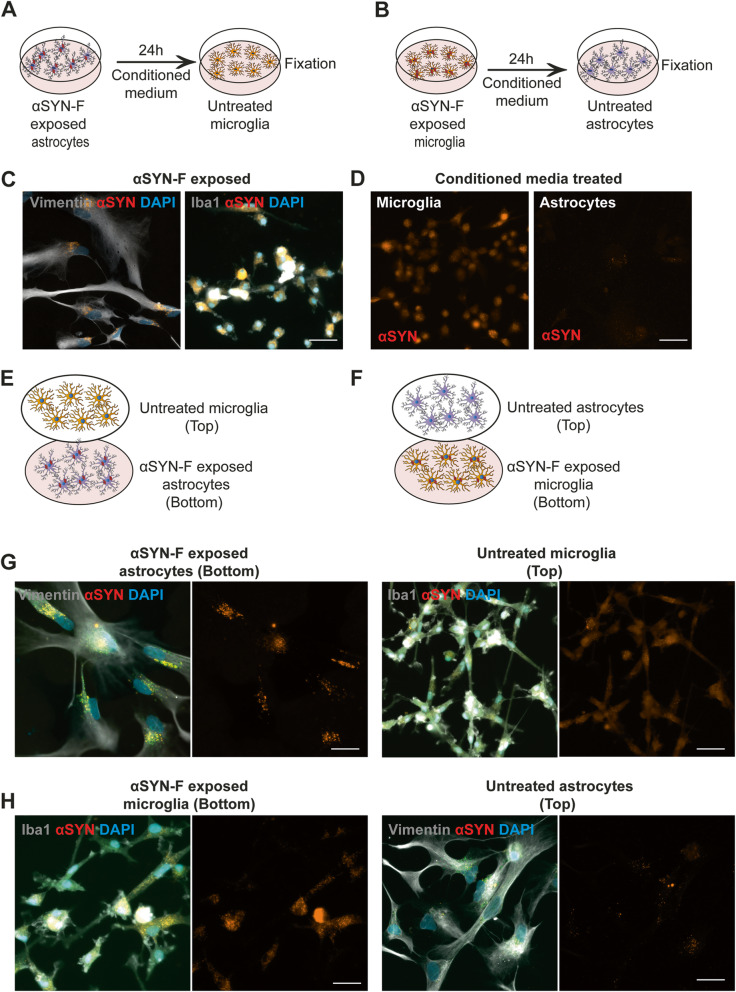
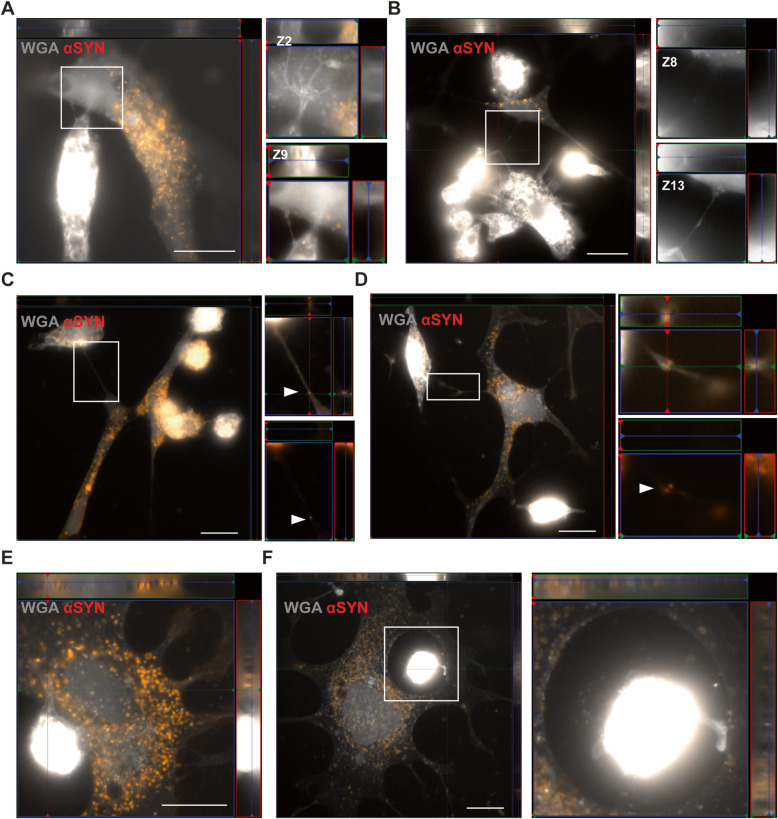
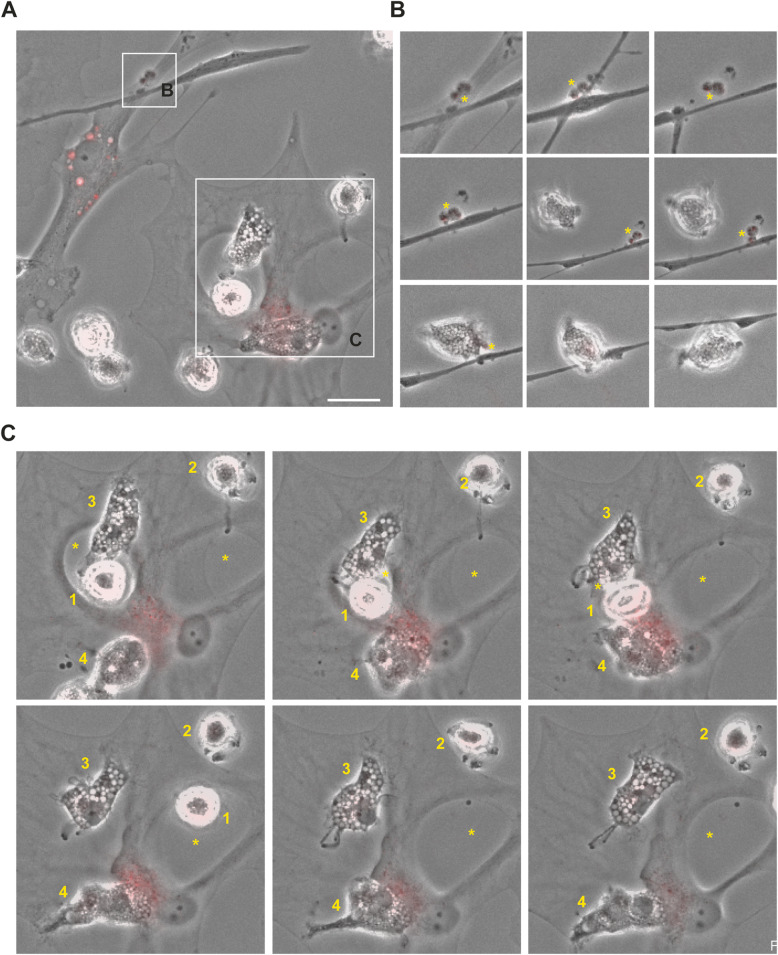
- Conditioned-media and close-culture chamber experiments showed astrocytes transfer a large proportion of internalized αSYN to microglia via secretory mechanisms, while microglia hardly transfer αSYN to astrocytes; TNTs and membrane contacts were observed, and live imaging showed microglia attracting and clearing intracellular αSYN deposits from astrocytes.
Methods
- Human iPSC-derived astrocytes and microglia were generated from the same Cntrl9 cell line and exposed to sonicated Cy3-labelled αSYN fibrils (0.5 μM) or Aβ fibrils (0.2 μM) for 24 h, 4 days, or 7 days, or given pulse-chase treatment, in monocultures and co-cultures.
- Analyses included immunocytochemistry, ELISA for total αSYN and Aβ in medium, cytokine array, time-lapse microscopy, and a customized “close-culture” chamber separating apical surfaces of astrocyte and microglia monocultures by <1 mm.
- Image analysis measured integrated density of αSYN/Aβ within Iba1- or vimentin-outlined cells; 60 Z-stack images per time point/treatment from three independent experiments were analyzed with Kruskal-Wallis/Dunn’s correction, and ELISA medium samples from four experiments were analyzed with one-way ANOVA/Tukey correction.
Limitations
- The paper states that further studies, for example using multi-photon microscopy, are needed to confirm the observed astrocyte–microglia transfer and clearance phenomenon in the living brain.
- Evident from the text: all experiments are in vitro with hiPSC-derived glia, with no in vivo AD/PD model or human brain tissue validation.
- Evident from the text: direct comparison of Cy3 intensity between Aβ and αSYN could not be done because labelling efficiency may differ, and the cytokine array showed very little effect of aggregated αSYN or Aβ on the cytokine profile.
Model-written summary. Check it against the paper before relying on it.
Integrity signals
Registry
Cites
Statistics
Figures
Verification
Claims the paper makes
60 Own result · 25 Own interpretation · 13 Partly supported · 7 Supported · 2 Own method · 1 No full text of the sources · accuracy not yet measured
Every source the paper cites for this claim was checked and supports it.
In the paper
“We have previously reported that cultured astrocytes accumulate αSYN and Aβ aggregates but not the monomeric form of the proteins [11, 12].”
§ Crosstalk between astrocytes and microglia results in increased degradation of α-synuclein and amyloid-β aggregates > Background
What the sources say
- Supportedcites [11] Rostami J, Holmqvist S, Lindström V, Sigvardson J, Westermark GT, Ingelsson M, et al. Human astrocytes transfer aggregated alpha-synuclein via tunneling nanotubes. J Neurosci. 2017;37(49):11835–53. https://doi.org/10.1523/JNEUROSCI.0983-17.2017. source
This source supports the αSYN portion of the jointly cited sentence. In Results (Figure 1 caption), oligomeric αSYN persisted in cultured human astrocytes with minimal degradation, whereas monomeric αSYN was completely degraded over six days. The Aβ portion is associated with the sentence’s other citation. (LLM, conf=0.91)
- Supportedcites [12] Söllvander S, Nikitidou E, Brolin R, Söderberg L, Sehlin D, Lannfelt L, et al. Accumulation of amyloid-β by astrocytes result in enlarged endosomes and microvesicle-induced apoptosis of neurons. Molecular Neurodegeneration. 2016;11(1):38. https://doi.org/10.1186/s13024-016-0098-z. source
The Results section reports that cultured astrocytes accumulated Aβ42 protofibrils, whereas cultures exposed to Aβ40 monomers showed no Aβ accumulation in astrocytes. This supports the Aβ portion attributed to this source; the sentence also cites another source for αSYN. (LLM, conf=0.93)
plain- Asserted: passes — The authors put it forward as true.
- Checkable: passes — It can be checked against evidence.
- Load-bearing: passes — The paper’s conclusions depend on it.
- Based: passes — The paper gives a reason why it holds.
- Supported
The cited sources support only part of this claim — read each source’s verdict below.
In the paper
“The αSYN and Aβ accumulation result in severe cellular stress, indicated by lysosomal and mitochondrial deficiencies [11, 12, 23].”
§ Crosstalk between astrocytes and microglia results in increased degradation of α-synuclein and amyloid-β aggregates > Background
What the sources say
- Partly supportedcites [11] Rostami J, Holmqvist S, Lindström V, Sigvardson J, Westermark GT, Ingelsson M, et al. Human astrocytes transfer aggregated alpha-synuclein via tunneling nanotubes. J Neurosci. 2017;37(49):11835–53. https://doi.org/10.1523/JNEUROSCI.0983-17.2017. sourceExperimental — accuracy not yet measured
The Results section reports mitochondrial defects after α-SYN oligomer exposure in human astrocytes, and the Discussion says α-SYN accumulation disrupts lysosomal machinery and is stressful to the cells. The cited paper does not establish the same effects for Aβ accumulation. Page numbers are not available in our copy. (LLM, conf=0.89)
- Partly supportedcites [12] Söllvander S, Nikitidou E, Brolin R, Söderberg L, Sehlin D, Lannfelt L, et al. Accumulation of amyloid-β by astrocytes result in enlarged endosomes and microvesicle-induced apoptosis of neurons. Molecular Neurodegeneration. 2016;11(1):38. https://doi.org/10.1186/s13024-016-0098-z. sourceExperimental — accuracy not yet measured
The Background and Conclusion (pages unavailable in our copy) state that intracellular Aβ accumulation in astrocytes causes severe endosomal and lysosomal defects. The paper does not establish the sentence’s claims about αSYN accumulation or mitochondrial deficiencies. (LLM, conf=0.88)
- Not checked — no full text of the sourcecites [23] Lindström V, Gustafsson G, Sanders LH, Howlett EH, Sigvardson J, Kasrayan A, et al. Extensive uptake of α-synuclein oligomers in astrocytes results in sustained intracellular deposits and mitochondrial damage. Mol Cell Neurosci. 2017;82:143–56. https://doi.org/10.1016/j.mcn.2017.04.009. source
plaindirect- Asserted: passes — The authors put it forward as true.
- Checkable: passes — It can be checked against evidence.
- Load-bearing: passes — The paper’s conclusions depend on it.
- Based: passes — The paper gives a reason why it holds.
- Partly supported
The cited sources support only part of this claim — read each source’s verdict below.
In the paper
“Several studies have demonstrated that astrocytes are capable of stimulating microglia phagocytosis by secretion of cytokines such as IL33 and the complement protein C3 [19, 34].”
§ Crosstalk between astrocytes and microglia results in increased degradation of α-synuclein and amyloid-β aggregates > Discussion
What the sources say
- Partly supportedcites [19] Batlle M, Ferri L, Andrade C, Ortega F-J, Vidal-Taboada JM, Pugliese M, et al. Astroglia-microglia cross talk during neurodegeneration in the rat hippocampus. Biomed Res Int. 2015;2015:102419. sourceExperimental — accuracy not yet measured
The Introduction says astrocytes release S100B, which modulates microglial activity, and the Discussion describes a change in microglial phagocytic morphology after astrocyte depletion. Neither passage says astrocyte-secreted factors stimulate microglial phagocytosis, and the searched passages do not identify IL33 or C3 as mediators. Page numbers were not available in our copy. (LLM, conf=0.83)
- Partly supportedcites [34] Park J, Wetzel I, Marriott I, Dréau D, D’Avanzo C, Kim DY, et al. A 3D human triculture system modeling neurodegeneration and neuroinflammation in Alzheimer’s disease. Nat Neurosci. 2018;21(7):941–51. https://doi.org/10.1038/s41593-018-0175-4. sourceExperimental — accuracy not yet measured
The Discussion reports that the neuron–astrocyte culture secreted chemokines, including CCL2/MCP-1, that contributed to microglial recruitment. It does not say that astrocytes stimulated microglial phagocytosis through IL-33 or C3; its separate discussion of complement concerns C1q and synapse engulfment in mouse models. (LLM, conf=0.82)
boosteddirect- Asserted: passes — The authors put it forward as true.
- Checkable: passes — It can be checked against evidence.
- Load-bearing: unclear — It is unclear whether the paper’s conclusions depend on it.
- Based: passes — The paper gives a reason why it holds.
- Partly supported
The cited sources support only part of this claim — read each source’s verdict below.
In the paper
“Damisah et al. provide support for this in their recent study, where microglia were eliminated from mice using a CSF1R antagonists, after which neuronal cell death was induced. They found that astrocytes engulfed the material which was intended for microglia but degraded it at a slower rate [10].”
§ Crosstalk between astrocytes and microglia results in increased degradation of α-synuclein and amyloid-β aggregates > Discussion
What the sources say
- Partly supportedcites [10] Damisah EC, Hill RA, Rai A, Chen F, Rothlin CV, Ghosh S, et al. Astrocytes and microglia play orchestrated roles and respect phagocytic territories during neuronal corpse removal in vivo. Sci Adv. 2020;6:eaba3239. sourceExperimental — accuracy not yet measured
The Results section, “A multicellular astrocytic reaction is responsible for cell body removal in the absence of microglia” (page unavailable), confirms CSF1R-antagonist treatment, induced neuronal apoptosis, astrocytic compensation, and slower cell-body removal. It does not establish a slower rate of degradation specifically; the authors also speculate that astrocytes digest cell bodies piecemeal rather than fully engulfing them. (LLM, conf=0.87)
plaindirect- Asserted: passes — The authors put it forward as true.
- Checkable: passes — It can be checked against evidence.
- Load-bearing: passes — The paper’s conclusions depend on it.
- Based: passes — The paper gives a reason why it holds.
- Partly supported
Every source the paper cites for this claim was checked and supports it.
In the paper
“In a recent publication, we showed that astrocytes, but not microglia, have the capacity to act as antigen-presenting cells (APCs) when exposed to αSYN fibrils [24].”
§ Crosstalk between astrocytes and microglia results in increased degradation of α-synuclein and amyloid-β aggregates > Discussion
What the sources say
- Supportedcites [24] Rostami J, Fotaki G, Sirois J, Mzezewa R, Bergström J, Essand M, et al. Astrocytes have the capacity to act as antigen-presenting cells in the Parkinson’s disease brain. Journal of Neuroinflammation. 2020;17(1):119. https://doi.org/10.1186/s12974-020-01776-7. source
The Discussion reports that αSYN-fibril-exposed astrocytes express molecules needed for antigen presentation. The Fig. 2 description states that microglia exposed to the fibrils did not express the co-stimulatory markers required to activate CD4+ T cells. This supports the comparison under the stated exposure condition, not a claim that microglia can never present antigens. (LLM, conf=0.92)
plain- Asserted: passes — The authors put it forward as true.
- Checkable: passes — It can be checked against evidence.
- Load-bearing: passes — The paper’s conclusions depend on it.
- Based: passes — The paper gives a reason why it holds.
- Supported
Every source the paper cites for this claim was checked and supports it.
In the paper
“Accordingly, astrocytes could be found in very close proximity to infiltrating T cells in the PD brain [24].”
§ Crosstalk between astrocytes and microglia results in increased degradation of α-synuclein and amyloid-β aggregates > Discussion
What the sources say
- Supportedcites [24] Rostami J, Fotaki G, Sirois J, Mzezewa R, Bergström J, Essand M, et al. Astrocytes have the capacity to act as antigen-presenting cells in the Parkinson’s disease brain. Journal of Neuroinflammation. 2020;17(1):119. https://doi.org/10.1186/s12974-020-01776-7. source
The Results section, “MHC-II expressing astrocytes are situated in close contact with CD4+ T cells,” reports that infiltrated T cells in post-mortem PD brain sections were in contact with and closely surrounded by astrocytes. This directly supports the claim of very close proximity. (LLM, conf=0.94)
hedgedcorrelational- Asserted: passes — The authors put it forward as true.
- Checkable: passes — It can be checked against evidence.
- Load-bearing: passes — The paper’s conclusions depend on it.
- Based: passes — The paper gives a reason why it holds.
- Supported
A result the paper reports from its own data — it cites no other source for it, so there is none to check. The quote shows it is in the paper.
In the paper
“Our data show that intracellular deposits of αSYN and Aβ are significantly reduced in co-cultures of astrocytes and microglia, compared to monocultures of either cell type.”
§ Crosstalk between astrocytes and microglia results in increased degradation of α-synuclein and amyloid-β aggregates > Abstract > Results
plaincorrelational- Asserted: passes — The authors put it forward as true.
- Checkable: passes — It can be checked against evidence.
- Load-bearing: passes — The paper’s conclusions depend on it.
- Based: passes — The paper gives a reason why it holds.
- Rests on an assumption: The hiPSC-derived astrocytes and microglia used in this study are representative of human brain astrocytes and microglia in AD and PD.
- Rests on an assumption: The cell markers used (Iba1, vimentin, S100B, etc.) specifically identify microglia and astrocytes in co-culture.
A result the paper reports from its own data — it cites no other source for it, so there is none to check. The quote shows it is in the paper.
In the paper
“Moreover, co-cultured astrocytes and microglia are in constant contact with each other via tunneling nanotubes and other membrane structures.”
§ Crosstalk between astrocytes and microglia results in increased degradation of α-synuclein and amyloid-β aggregates > Abstract > Results
plaincorrelational- Asserted: passes — The authors put it forward as true.
- Checkable: passes — It can be checked against evidence.
- Load-bearing: passes — The paper’s conclusions depend on it.
- Based: passes — The paper gives a reason why it holds.
- Rests on an assumption: The hiPSC-derived astrocytes and microglia used in this study are representative of human brain astrocytes and microglia in AD and PD.
A result the paper reports from its own data — it cites no other source for it, so there is none to check. The quote shows it is in the paper.
In the paper
“Notably, our live cell imaging data demonstrate that microglia, when attached to the cell membrane of an astrocyte, can attract and clear intracellular protein deposits from the astrocyte.”
§ Crosstalk between astrocytes and microglia results in increased degradation of α-synuclein and amyloid-β aggregates > Abstract > Results
boosteddirect- Asserted: passes — The authors put it forward as true.
- Checkable: passes — It can be checked against evidence.
- Load-bearing: passes — The paper’s conclusions depend on it.
- Based: passes — The paper gives a reason why it holds.
- Rests on an assumption: The hiPSC-derived astrocytes and microglia used in this study are representative of human brain astrocytes and microglia in AD and PD.
- Rests on an assumption: The cell markers used (Iba1, vimentin, S100B, etc.) specifically identify microglia and astrocytes in co-culture.
A result the paper reports from its own data — it cites no other source for it, so there is none to check. The quote shows it is in the paper.
In the paper
“Our data show that intracellular deposits of αSYN and Aβ are significantly reduced in co-cultures of astrocytes and microglia, compared to monocultures of either cell type.”
§ Crosstalk between astrocytes and microglia results in increased degradation of α-synuclein and amyloid-β aggregates > Abstract > Results
plaincorrelational- Asserted: passes — The authors put it forward as true.
- Checkable: passes — It can be checked against evidence.
- Load-bearing: passes — The paper’s conclusions depend on it.
- Based: passes — The paper gives a reason why it holds.
- Rests on an assumption: The hiPSC-derived astrocytes and microglia used in this study are representative of human brain astrocytes and microglia in AD and PD.
- Rests on an assumption: The cell markers used (Iba1, vimentin, S100B, etc.) specifically identify microglia and astrocytes in co-culture.
- Probably not a substantial claim. 15
- It may state two separate claims as one. 29
Every source the paper cites for this claim was checked and supports it.
In the paper
“The conversation between microglia and astrocytes starts already during early development and remains throughout life [1].”
§ Crosstalk between astrocytes and microglia results in increased degradation of α-synuclein and amyloid-β aggregates > Background
What the sources say
- Supportedcites [1] Matejuk A, Ransohoff RM. Crosstalk between astrocytes and microglia: an overview. Frontiers in Immunology. 2020;11:1416. https://doi.org/10.3389/fimmu.2020.01416. source
The section “Astrocytes Contribute to Formation of Neural Circuits” describes signaling between astrocytes and microglia during development and also discusses their roles in the adult mouse brain. The “Astrocyte-Microglia Communication” section describes their ongoing interactions, including in disease. Together, these passages support the claim’s broad developmental-to-later-life timeline; no page numbers are available in our copy. (LLM, conf=0.86)
plain- Asserted: passes — The authors put it forward as true.
- Checkable: passes — It can be checked against evidence.
- Load-bearing: fails — The paper’s conclusions may not depend on it.
- Based: passes — The paper gives a reason why it holds.
Probably not a substantial claim. The paper’s conclusions may not depend on it. It may state two separate claims as one.
- Supported
The cited sources support only part of this claim — read each source’s verdict below.
In the paper
“In the AD and PD brain, both astrocytes and microglia acquire reactive, inflammatory phenotypes and can effectively phagocytose aggregated proteins and cell debris, as well as secrete various cytokines and inflammatory mediators [8–13].”
§ Crosstalk between astrocytes and microglia results in increased degradation of α-synuclein and amyloid-β aggregates > Background
What the sources say
- Partly supportedcites [8] Peri F, Nüsslein-Volhard C. Live imaging of neuronal degradation by microglia reveals a role for v0-ATPase a1 in phagosomal fusion in vivo. Cell. 2008;133(5):916–27. https://doi.org/10.1016/j.cell.2008.04.037. sourceExperimental — accuracy not yet measured
The Introduction and the section on in vivo imaging of zebrafish embryos support that microglia engulf and digest apoptotic neurons. The paper does not establish the claim for AD or PD brains, or show that astrocytes and microglia phagocytose aggregated proteins or secrete cytokines and inflammatory mediators in those conditions. (LLM, conf=0.87)
- Not checked — no full text of the sourcecites [9] Sofroniew MV. Multiple roles for astrocytes as effectors of cytokines and inflammatory mediators. The Neuroscientist: A Review Journal Bringing Neurobiology, Neurology and Psychiatry. 2014;20(2):160–72. https://doi.org/10.1177/1073858413504466. source
- Partly supportedcites [10] Damisah EC, Hill RA, Rai A, Chen F, Rothlin CV, Ghosh S, et al. Astrocytes and microglia play orchestrated roles and respect phagocytic territories during neuronal corpse removal in vivo. Sci Adv. 2020;6:eaba3239. sourceExperimental — accuracy not yet measured
The Introduction and Discussion report that astrocytes and microglia remove dying neurons and cellular debris, supporting the debris-phagocytosis part of the claim. The paper does not establish this in AD or PD brains, or show that both cell types phagocytose aggregated proteins, acquire inflammatory phenotypes, or secrete cytokines and inflammatory mediators. (LLM, conf=0.88)
- Partly supportedcites [11] Rostami J, Holmqvist S, Lindström V, Sigvardson J, Westermark GT, Ingelsson M, et al. Human astrocytes transfer aggregated alpha-synuclein via tunneling nanotubes. J Neurosci. 2017;37(49):11835–53. https://doi.org/10.1523/JNEUROSCI.0983-17.2017. sourceExperimental — accuracy not yet measured
The Introduction (page not provided) says reactive astrocytes engulf dead cells and aggregates of amyloid β and α-synuclein, and that astrocytes can produce cytokines and chemokines. The paper does not establish the corresponding inflammatory, phagocytic, and secretory claims for microglia in both AD and PD brains. (LLM, conf=0.88)
- Partly supportedcites [12] Söllvander S, Nikitidou E, Brolin R, Söderberg L, Sehlin D, Lannfelt L, et al. Accumulation of amyloid-β by astrocytes result in enlarged endosomes and microvesicle-induced apoptosis of neurons. Molecular Neurodegeneration. 2016;11(1):38. https://doi.org/10.1186/s13024-016-0098-z. sourceExperimental — accuracy not yet measured
The Background (page unavailable) describes reactive astrocytes and microglia around amyloid plaques in AD, says both secrete cytokines, and reports that astrocytes engulf dead cells and protein aggregates. It does not establish the same combined account for both cell types in PD brains; the Discussion also cautions that astrocytes degrade ingested aggregates slowly. (LLM, conf=0.86)
- Partly supportedcites [13] Marín-Teva JL, Dusart I, Colin C, Gervais A, van Rooijen N, Mallat M. Microglia promote the death of developing Purkinje cells. Neuron. 2004;41(4):535–47. https://doi.org/10.1016/S0896-6273(04)00069-8. sourceExperimental — accuracy not yet measured
The passage on phagocytic behavior in cerebellar slices reports microglia engulfing dying Purkinje cells and says astroglial cells can occasionally ingest apoptotic cell bodies (page unavailable). It does not establish reactive phenotypes, clearance of aggregated proteins, or cytokine secretion by both cell types in AD or PD brains; the Molecular Mediators section instead examines microglial effects during development. (LLM, conf=0.85)
plain- Asserted: passes — The authors put it forward as true.
- Checkable: passes — It can be checked against evidence.
- Load-bearing: passes — The paper’s conclusions depend on it.
- Based: passes — The paper gives a reason why it holds.
Probably not a substantial claim. It may state two separate claims as one.
- Partly supported
The cited sources support only part of this claim — read each source’s verdict below.
In the paper
“The concentrations were selected based on our previous studies [11, 12, 23, 28, 29].”
§ Crosstalk between astrocytes and microglia results in increased degradation of α-synuclein and amyloid-β aggregates > Methods > Exposure to αSYN-F and Aβ-F
What the sources say
- Partly supportedcites [11] Rostami J, Holmqvist S, Lindström V, Sigvardson J, Westermark GT, Ingelsson M, et al. Human astrocytes transfer aggregated alpha-synuclein via tunneling nanotubes. J Neurosci. 2017;37(49):11835–53. https://doi.org/10.1523/JNEUROSCI.0983-17.2017. sourceExperimental — accuracy not yet measured
The Materials and Methods section says the 0.5 μM α-SYN exposure concentration was chosen based on previous investigations. It does not establish that the Aβ-F concentration was selected on that basis, so this source supports only the α-SYN part of the claim. (LLM, conf=0.87)
- Supportedcites [12] Söllvander S, Nikitidou E, Brolin R, Söderberg L, Sehlin D, Lannfelt L, et al. Accumulation of amyloid-β by astrocytes result in enlarged endosomes and microvesicle-induced apoptosis of neurons. Molecular Neurodegeneration. 2016;11(1):38. https://doi.org/10.1186/s13024-016-0098-z. source
The Methods section ('Aβ stimulation'; page not available) reports treating cultures with 0.1 μM Aβ42 protofibrils, either fluorescently labeled or unlabeled. This supports citing the paper as a previous study using a fluorescent Aβ concentration. It does not address αSYN-F, which the sentence also cites other studies for. (LLM, conf=0.88)
- Not checked — no full text of the sourcecites [23] Lindström V, Gustafsson G, Sanders LH, Howlett EH, Sigvardson J, Kasrayan A, et al. Extensive uptake of α-synuclein oligomers in astrocytes results in sustained intracellular deposits and mitochondrial damage. Mol Cell Neurosci. 2017;82:143–56. https://doi.org/10.1016/j.mcn.2017.04.009. source
- Partly supportedcites [28] Beretta C, Nikitidou E, Streubel-Gallasch L, Ingelsson M, Sehlin D, Erlandsson A. Extracellular vesicles from amyloid-β exposed cell cultures induce severe dysfunction in cortical neurons. Sci Rep. 2020;10(1):19656. https://doi.org/10.1038/s41598-020-72355-2. sourceExperimental — accuracy not yet measured
The Materials and methods sections report a 0.1 µM Aβ42 protofibril exposure and say the protofibrils were prepared using a previously established protocol (page not available in our copy). This supports a connection to prior Aβ work, but the paper does not say that the exposure concentration was selected on that basis and does not address αSYN-F concentrations. (LLM, conf=0.78)
- Could not verifycites [29] Nikitidou E, Khoonsari PE, Shevchenko G, Ingelsson M, Kultima K, Erlandsson A. Increased release of apolipoprotein E in extracellular vesicles following amyloid-β protofibril exposure of neuroglial co-cultures. J Alzheimers Dis. 2017;60(1):305–21. https://doi.org/10.3233/JAD-170278. sourceExperimental — accuracy not yet measured
The Materials and Methods sections on synthetic Aβ42 protofibrils and Aβ42 protofibril exposure describe a previously established preparation protocol and report a 0.1 μM exposure concentration. They do not say that this concentration was selected based on previous studies, and the searched passages do not address selection of an αSYN-F concentration. (LLM, conf=0.72)
plain- Asserted: passes — The authors put it forward as true.
- Checkable: passes — It can be checked against evidence.
- Load-bearing: fails — The paper’s conclusions may not depend on it.
- Based: passes — The paper gives a reason why it holds.
Probably not a substantial claim. The paper’s conclusions may not depend on it.
- Partly supported
The cited sources support only part of this claim — read each source’s verdict below.
In the paper
“Human astrocytes, expressing the astrocytic markers vimentin, S100β, ALDH1L1 and GFAP (Supplementary Figure 3 A), and human microglia, expressing the microglial markers Iba1 and P2Y12 (Supplementary Figure 3 B) were derived from the same hiPSC line [27].”
§ Crosstalk between astrocytes and microglia results in increased degradation of α-synuclein and amyloid-β aggregates > Results > Astrocytes, but not microglia, accumulate αSYN-F over time
What the sources say
- Partly supportedcites [27] McQuade A, Coburn M, Tu CH, Hasselmann J, Davtyan H, Blurton-Jones M. Development and validation of a simplified method to generate human microglia from pluripotent stem cells. Molecular Neurodegeneration. 2018;13(1):67. https://doi.org/10.1186/s13024-018-0297-x. sourceExperimental — accuracy not yet measured
The Results section on engraftment (Fig. 5; page unavailable) reports that the derived human microglia express Iba1 and P2RY12. The paper does not report astrocytes expressing vimentin, S100β, ALDH1L1 and GFAP, or establish that the astrocytes and microglia in the citing study came from the same hiPSC line. The citing study points to its own supplementary figures for the marker observations. (LLM, conf=0.86)
plain- Asserted: passes — The authors put it forward as true.
- Checkable: passes — It can be checked against evidence.
- Load-bearing: passes — The paper’s conclusions depend on it.
- Based: passes — The paper gives a reason why it holds.
It may state two separate claims as one.
- Partly supported
The cited sources support only part of this claim — read each source’s verdict below.
In the paper
“However, recent data indicate that microglia and astrocytes coordinate their functions in many ways, both in the healthy and diseased brain [14–21].”
§ Crosstalk between astrocytes and microglia results in increased degradation of α-synuclein and amyloid-β aggregates > Background
What the sources say
- Not checked — no full text of the sourcecites [14] Ali Khan MA, Yousef SA, Mullins CE. Percutaneous transluminal balloon pulmonary valvuloplasty for the relief of pulmonary valve stenosis with special reference to double-balloon technique. American Heart Journal. 1986;112(1):158–66. https://doi.org/10.1016/0002-8703(86)90695-2. source
- Partly supportedcites [15] Gadani SP, Walsh JT, Smirnov I, Zheng J, Kipnis J. The glia-derived alarmin IL-33 orchestrates the immune response and promotes recovery following CNS injury. Neuron. 2015;85(4):703–9. https://doi.org/10.1016/j.neuron.2015.01.013. sourceExperimental — accuracy not yet measured
The Introduction reports that IL-33 released after CNS injury acts on both astrocytes and microglia to induce chemokines, supporting an example of their coordinated response to injury. It reports IL-33 expression in the healthy brain, but not coordinated functions there, and does not establish that the two cell types coordinate in many ways. No page number is available in our copy. (LLM, conf=0.84)
- Partly supportedcites [16] Liddelow SA, Guttenplan KA, Clarke LE, Bennett FC, Bohlen CJ, Schirmer L, et al. Neurotoxic reactive astrocytes are induced by activated microglia. Nature. 2017;541(7638):481–7. https://doi.org/10.1038/nature21029. sourceExperimental — accuracy not yet measured
Section 2 shows one way microglia influence astrocytes: activated microglia secrete factors that induce A1 reactive astrocytes. The Introduction places this response in injury and disease. The paper does not establish that the two cell types coordinate their functions in many ways in the healthy brain; page numbers were not provided in our copy. (LLM, conf=0.86)
- Partly supportedcites [17] Shi Q, Chowdhury S, Ma R, Le KX, Hong S, Caldarone BJ, et al. Complement C3 deficiency protects against neurodegeneration in aged plaque-rich APP/PS1 mice. Sci Transl Med. 2017;9(392):eaaf6295. https://doi.org/10.1126/scitranslmed.aaf6295. sourceExperimental — accuracy not yet measured
The Discussion (page not provided) describes astrocyte-derived C3a acting on microglia in Alzheimer’s disease models, supporting an example of coordination in a diseased brain. It also says both cell types participate in synapse pruning, but does not establish that they coordinate their functions in many ways in both healthy and diseased brains. (LLM, conf=0.83)
- Partly supportedcites [18] Rothhammer V, Borucki DM, Tjon EC, Takenaka MC, Chao C-C, Ardura-Fabregat A, et al. Microglial control of astrocytes in response to microbial metabolites. Nature. 2018;557(7707):724–8. https://doi.org/10.1038/s41586-018-0119-x. sourceExperimental — accuracy not yet measured
The paper’s Abstract reports that microglial TGF-α and VEGF-B regulate astrocyte activity in an experimental model of multiple sclerosis, supporting coordination in a diseased CNS. It does not establish the broader claim that the cells coordinate their functions in many ways in both healthy and diseased brains. (LLM, conf=0.83)
- Partly supportedcites [19] Batlle M, Ferri L, Andrade C, Ortega F-J, Vidal-Taboada JM, Pugliese M, et al. Astroglia-microglia cross talk during neurodegeneration in the rat hippocampus. Biomed Res Int. 2015;2015:102419. sourceExperimental — accuracy not yet measured
The Introduction and Conclusions describe astrocyte–microglia interactions during neurodegeneration and brain injury, including astroglial influence on microglial responses. They do not establish coordination in the healthy brain, so that part of the cited sentence is not supported by this paper. (LLM, conf=0.86)
- Partly supportedcites [20] Lian H, Litvinchuk A, Chiang AC-A, Aithmitti N, Jankowsky JL, Zheng H. Astrocyte-microglia cross talk through complement activation modulates amyloid pathology in mouse models of Alzheimer’s disease. J Neurosci. 2016;36(2):577–89. https://doi.org/10.1523/JNEUROSCI.2117-15.2016. sourceExperimental — accuracy not yet measured
The Introduction describes an astrocyte-to-microglia C3/C3aR pathway affecting amyloid dynamics and Alzheimer’s pathology, supporting coordination in a diseased brain. It does not establish that the cells coordinate their functions in many ways or show functional coordination in the healthy brain; the cited wild-type observations concern expression of C3 and C3aR. (LLM, conf=0.84)
- Supportedcites [21] Wu T, Dejanovic B, Gandham VD, Gogineni A, Edmonds R, Schauer S, et al. Complement C3 is activated in human AD brain and is required for neurodegeneration in mouse models of amyloidosis and tauopathy. Cell Rep. 2019;28:2111–2123.e6. source
The Introduction describes complement components expressed by both microglia and astrocytes, their role in synapse removal during visual-system development, and reactivation of that pathway in amyloidosis models. This supports the cited paper as an example of coordination between these cells in healthy development and disease; the grouped citations need not each establish every way they coordinate. (LLM, conf=0.84)
hedgedcorrelational- Asserted: passes — The authors put it forward as true.
- Checkable: passes — It can be checked against evidence.
- Load-bearing: passes — The paper’s conclusions depend on it.
- Based: passes — The paper gives a reason why it holds.
Probably not a substantial claim.
The cited sources support only part of this claim — read each source’s verdict below.
In the paper
“Subsequently, stressed astrocytes respond by sending out tunneling nanotubes (TNTs), enabling intercellular transfer of pathogenic protein aggregates, as well as MHCII complexes to nearby cells [11, 24].”
§ Crosstalk between astrocytes and microglia results in increased degradation of α-synuclein and amyloid-β aggregates > Background
What the sources say
- Partly supportedcites [11] Rostami J, Holmqvist S, Lindström V, Sigvardson J, Westermark GT, Ingelsson M, et al. Human astrocytes transfer aggregated alpha-synuclein via tunneling nanotubes. J Neurosci. 2017;37(49):11835–53. https://doi.org/10.1523/JNEUROSCI.0983-17.2017. sourceExperimental — accuracy not yet measured
The Discussion states that stressed astrocytes send out TNTs that transfer aggregated α-synuclein to healthy astrocytes. The cited paper does not report TNT-mediated transfer of MHCII complexes, so that part of the sentence is unsupported by this source. No page numbers are provided in our copy. (LLM, conf=0.90)
- Supportedcites [24] Rostami J, Fotaki G, Sirois J, Mzezewa R, Bergström J, Essand M, et al. Astrocytes have the capacity to act as antigen-presenting cells in the Parkinson’s disease brain. Journal of Neuroinflammation. 2020;17(1):119. https://doi.org/10.1186/s12974-020-01776-7. source
The Background says stressed astrocytes send out tunneling nanotubes that transfer αSYN inclusions to nearby cells. The Discussion reports that both MHC-II and αSYN/MHC-II complexes transfer between astrocytes through those nanotubes. (LLM, conf=0.94)
plaindirect- Asserted: passes — The authors put it forward as true.
- Checkable: passes — It can be checked against evidence.
- Load-bearing: passes — The paper’s conclusions depend on it.
- Based: passes — The paper gives a reason why it holds.
It may state two separate claims as one.
- Partly supported
The cited sources support only part of this claim — read each source’s verdict below.
In the paper
“These observations are in line with our previous discoveries that astrocytes easily degrade αSYN and Aβ monomers, while they accumulate larger oligomers and fibrils [11, 12].”
§ Crosstalk between astrocytes and microglia results in increased degradation of α-synuclein and amyloid-β aggregates > Discussion
What the sources say
- Partly supportedcites [11] Rostami J, Holmqvist S, Lindström V, Sigvardson J, Westermark GT, Ingelsson M, et al. Human astrocytes transfer aggregated alpha-synuclein via tunneling nanotubes. J Neurosci. 2017;37(49):11835–53. https://doi.org/10.1523/JNEUROSCI.0983-17.2017. sourceExperimental — accuracy not yet measured
The Results section (page not provided) reports that human astrocytes rapidly degraded α-SYN monomers but retained α-SYN oligomers over six days. The Discussion also reports long-term storage of aggregated Aβ42. This paper does not establish degradation of Aβ monomers or accumulation of fibrils by astrocytes. (LLM, conf=0.88)
- Partly supportedcites [12] Söllvander S, Nikitidou E, Brolin R, Söderberg L, Sehlin D, Lannfelt L, et al. Accumulation of amyloid-β by astrocytes result in enlarged endosomes and microvesicle-induced apoptosis of neurons. Molecular Neurodegeneration. 2016;11(1):38. https://doi.org/10.1186/s13024-016-0098-z. sourceExperimental — accuracy not yet measured
The Results section reports that astrocytes did not accumulate Aβ40 monomers but retained Aβ42 protofibrils, degrading them only slowly. The Discussion interprets this as a contrast between monomers and aggregated Aβ. This paper does not establish the same pattern for αSYN or for mature fibrils; those parts of the sentence are not supported by this source. (LLM, conf=0.87)
plaindirect- Asserted: passes — The authors put it forward as true.
- Checkable: passes — It can be checked against evidence.
- Load-bearing: passes — The paper’s conclusions depend on it.
- Based: passes — The paper gives a reason why it holds.
It may state two separate claims as one.
- Partly supported
The cited sources support only part of this claim — read each source’s verdict below.
In the paper
“Microglia and astrocytes are known to be responsible for many inflammatory processes in affected brains, including phagocytosis of αSYN and Aβ aggregates, secretion of inflammatory mediators, and stimulation of the innate immune system [8–12].”
§ Crosstalk between astrocytes and microglia results in increased degradation of α-synuclein and amyloid-β aggregates > Discussion
What the sources say
- Partly supportedcites [8] Peri F, Nüsslein-Volhard C. Live imaging of neuronal degradation by microglia reveals a role for v0-ATPase a1 in phagosomal fusion in vivo. Cell. 2008;133(5):916–27. https://doi.org/10.1016/j.cell.2008.04.037. sourceExperimental — accuracy not yet measured
The Introduction and the section on neuronal–microglial interactions during brain development describe microglia as CNS immune cells that phagocytose apoptotic neurons, primarily in developing zebrafish brains. They do not establish that microglia or astrocytes phagocytose αSYN or Aβ aggregates in affected brains, secrete inflammatory mediators, or stimulate the innate immune system. (LLM, conf=0.88)
- Not checked — no full text of the sourcecites [9] Sofroniew MV. Multiple roles for astrocytes as effectors of cytokines and inflammatory mediators. The Neuroscientist: A Review Journal Bringing Neurobiology, Neurology and Psychiatry. 2014;20(2):160–72. https://doi.org/10.1177/1073858413504466. source
- Partly supportedcites [10] Damisah EC, Hill RA, Rai A, Chen F, Rothlin CV, Ghosh S, et al. Astrocytes and microglia play orchestrated roles and respect phagocytic territories during neuronal corpse removal in vivo. Sci Adv. 2020;6:eaba3239. sourceExperimental — accuracy not yet measured
The Introduction and Discussion report that microglia and astrocytes coordinate the phagocytic removal of dying neurons and their debris. They do not establish phagocytosis of αSYN or Aβ aggregates, secretion of inflammatory mediators, or stimulation of the innate immune system; the paper's findings concern neuronal corpse removal rather than that full list of inflammatory processes. (LLM, conf=0.87)
- Partly supportedcites [11] Rostami J, Holmqvist S, Lindström V, Sigvardson J, Westermark GT, Ingelsson M, et al. Human astrocytes transfer aggregated alpha-synuclein via tunneling nanotubes. J Neurosci. 2017;37(49):11835–53. https://doi.org/10.1523/JNEUROSCI.0983-17.2017. sourceExperimental — accuracy not yet measured
The Introduction reports that reactive astrocytes engulf Aβ and α-SYN aggregates and produce cytokines and chemokines. The paper does not establish the same activities for microglia or say that these cells stimulate the innate immune system; its Discussion instead mentions possible astrocyte involvement in T-cell activation. (LLM, conf=0.87)
- Partly supportedcites [12] Söllvander S, Nikitidou E, Brolin R, Söderberg L, Sehlin D, Lannfelt L, et al. Accumulation of amyloid-β by astrocytes result in enlarged endosomes and microvesicle-induced apoptosis of neurons. Molecular Neurodegeneration. 2016;11(1):38. https://doi.org/10.1186/s13024-016-0098-z. sourceExperimental — accuracy not yet measured
The Background (page not provided) says astrocytes engulf Aβ and α-synuclein aggregates, and that astrocytes and microglia secrete cytokines and neurotoxic products around Aβ plaques. It does not establish phagocytosis of both aggregates by microglia or state that these cells stimulate the innate immune system. (LLM, conf=0.86)
boosteddirect- Asserted: passes — The authors put it forward as true.
- Checkable: passes — It can be checked against evidence.
- Load-bearing: fails — The paper’s conclusions may not depend on it.
- Based: passes — The paper gives a reason why it holds.
Probably not a substantial claim. The paper’s conclusions may not depend on it. It may state two separate claims as one.
- Partly supported
The cited sources support only part of this claim — read each source’s verdict below.
In the paper
“Our previous results indicate that astrocytes are capable of transferring αSYN as well as MHCII to other astrocytes via direct membrane contact and through TNTs, implicating astrocytes as one of the important players in propagation of αSYN pathology [11, 24].”
§ Crosstalk between astrocytes and microglia results in increased degradation of α-synuclein and amyloid-β aggregates > Discussion
What the sources say
- Partly supportedcites [11] Rostami J, Holmqvist S, Lindström V, Sigvardson J, Westermark GT, Ingelsson M, et al. Human astrocytes transfer aggregated alpha-synuclein via tunneling nanotubes. J Neurosci. 2017;37(49):11835–53. https://doi.org/10.1523/JNEUROSCI.0983-17.2017. sourceExperimental — accuracy not yet measured
The Results section, “TNTs contribute to α-SYN transmission” (page unavailable), reports transfer of α-SYN between astrocytes through direct contact and TNTs. The cited paper does not report transfer of MHCII, so that part of the attributed claim is unsupported. (LLM, conf=0.88)
- Partly supportedcites [24] Rostami J, Fotaki G, Sirois J, Mzezewa R, Bergström J, Essand M, et al. Astrocytes have the capacity to act as antigen-presenting cells in the Parkinson’s disease brain. Journal of Neuroinflammation. 2020;17(1):119. https://doi.org/10.1186/s12974-020-01776-7. sourceExperimental — accuracy not yet measured
The Results section on transfer between astrocytes (Fig. 6) and the Discussion report that MHC-II and αSYN/MHC-II complexes move between human astrocytes through tunneling nanotubes. The passages do not establish transfer of either αSYN or MHC-II through direct membrane contact as a separate route. (LLM, conf=0.86)
hedgeddirect- Asserted: passes — The authors put it forward as true.
- Checkable: passes — It can be checked against evidence.
- Load-bearing: fails — The paper’s conclusions may not depend on it.
- Based: passes — The paper gives a reason why it holds.
Probably not a substantial claim. The paper’s conclusions may not depend on it.
- Partly supported
Every source the paper cites for this claim was checked and supports it.
In the paper
“A recent study showed that astrocytes and microglia degrade dead cells in a very organized and specialized manner; microglia degrade neuronal dendrites, cell bodies, and nuclei while astrocytes phagocytose apoptotic bodies that are released from the dying neurons [10].”
§ Crosstalk between astrocytes and microglia results in increased degradation of α-synuclein and amyloid-β aggregates > Discussion
What the sources say
- Supportedcites [10] Damisah EC, Hill RA, Rai A, Chen F, Rothlin CV, Ghosh S, et al. Astrocytes and microglia play orchestrated roles and respect phagocytic territories during neuronal corpse removal in vivo. Sci Adv. 2020;6:eaba3239. source
The Introduction describes coordinated, specialized removal of dying neurons: microglia predominantly engulf dendrites, cell bodies, and nuclei, while astrocytes engulf diffuse apoptotic bodies from their dendritic arbors. The Results section on neurite clearance further specifies that microglia favor branches near the soma and astrocytes favor distal fragments. (LLM, conf=0.94)
plaindirect- Asserted: passes — The authors put it forward as true.
- Checkable: passes — It can be checked against evidence.
- Load-bearing: fails — The paper’s conclusions may not depend on it.
- Based: passes — The paper gives a reason why it holds.
Probably not a substantial claim. The paper’s conclusions may not depend on it. It may state two separate claims as one.
- Supported
Every source the paper cites for this claim was checked and supports it.
In the paper
“We have previously shown that an incomplete degradation of Aβ42 protofibrils by astrocytes results in the release of extracellular vesicles containing N-truncated, neurotoxic Aβ [12].”
§ Crosstalk between astrocytes and microglia results in increased degradation of α-synuclein and amyloid-β aggregates > Discussion
What the sources say
- Supportedcites [12] Söllvander S, Nikitidou E, Brolin R, Söderberg L, Sehlin D, Lannfelt L, et al. Accumulation of amyloid-β by astrocytes result in enlarged endosomes and microvesicle-induced apoptosis of neurons. Molecular Neurodegeneration. 2016;11(1):38. https://doi.org/10.1186/s13024-016-0098-z. source
The Background says astrocytes incompletely degrade Aβ42 protofibrils. In Results, “Neuronal cell death is induced by secreted microvesicles,” the paper reports that released microvesicles contained primarily N-terminally truncated Aβ42 and increased neuronal apoptosis. (LLM, conf=0.91)
plaindirect- Asserted: passes — The authors put it forward as true.
- Checkable: passes — It can be checked against evidence.
- Load-bearing: fails — The paper’s conclusions may not depend on it.
- Based: passes — The paper gives a reason why it holds.
Probably not a substantial claim. The paper’s conclusions may not depend on it.
- Supported
Every source the paper cites for this claim was checked and supports it.
In the paper
“An accumulating body of evidence emphasizes astrocytes as one of the major secretory cells in the CNS, responsible for secretion of neurotransmitters, growth factors, inflammatory mediators, and toxic proteins [33].”
§ Crosstalk between astrocytes and microglia results in increased degradation of α-synuclein and amyloid-β aggregates > Discussion
What the sources say
- Supportedcites [33] Verkhratsky A, Matteoli M, Parpura V, Mothet J-P, Zorec R. Astrocytes as secretory cells of the central nervous system: idiosyncrasies of vesicular secretion. The EMBO journal. 2016;35(3):239–57. https://doi.org/10.15252/embj.201592705. source
The section “Astrocytes, secretory cells of the CNS” describes astrocytes as part of a CNS secretory network and lists neurotransmitters, growth factors, and inflammatory factors among their secretions. “Extracellular vesicles” also reports astrocyte secretion of exosomes containing the proapoptotic protein PAR4, supporting the reference to toxic proteins. The supplied copy gives no page numbers for these passages. (LLM, conf=0.91)
boosted- Asserted: passes — The authors put it forward as true.
- Checkable: passes — It can be checked against evidence.
- Load-bearing: fails — The paper’s conclusions may not depend on it.
- Based: passes — The paper gives a reason why it holds.
Probably not a substantial claim. The paper’s conclusions may not depend on it. It may state two separate claims as one.
- Supported
The cited sources support only part of this claim — read each source’s verdict below.
In the paper
“We have previously shown that astrocytes accumulate large amounts of αSYN and Aβ aggregates, resulting in severe cellular stress [11, 12, 23, 24].”
§ Crosstalk between astrocytes and microglia results in increased degradation of α-synuclein and amyloid-β aggregates > Discussion
What the sources say
- Partly supportedcites [11] Rostami J, Holmqvist S, Lindström V, Sigvardson J, Westermark GT, Ingelsson M, et al. Human astrocytes transfer aggregated alpha-synuclein via tunneling nanotubes. J Neurosci. 2017;37(49):11835–53. https://doi.org/10.1523/JNEUROSCI.0983-17.2017. sourceExperimental — accuracy not yet measured
The Discussion (page not provided) says that α-SYN accumulates in astrocytes and causes substantial cellular stress. It also reports that astrocytes engulf and store large amounts of aggregated Aβ42, but does not say that Aβ accumulation causes the stress described here. (LLM, conf=0.88)
- Supportedcites [12] Söllvander S, Nikitidou E, Brolin R, Söderberg L, Sehlin D, Lannfelt L, et al. Accumulation of amyloid-β by astrocytes result in enlarged endosomes and microvesicle-induced apoptosis of neurons. Molecular Neurodegeneration. 2016;11(1):38. https://doi.org/10.1186/s13024-016-0098-z. source
This source supports the Aβ portion of the multi-citation sentence; it is not needed to establish the αSYN portion. The Background reports that astrocytes accumulate large amounts of Aβ42 protofibrils and that this accumulation causes severe endosomal/lysosomal defects, consistent with severe cellular stress. (LLM, conf=0.90)
- Not checked — no full text of the sourcecites [23] Lindström V, Gustafsson G, Sanders LH, Howlett EH, Sigvardson J, Kasrayan A, et al. Extensive uptake of α-synuclein oligomers in astrocytes results in sustained intracellular deposits and mitochondrial damage. Mol Cell Neurosci. 2017;82:143–56. https://doi.org/10.1016/j.mcn.2017.04.009. source
- Partly supportedcites [24] Rostami J, Fotaki G, Sirois J, Mzezewa R, Bergström J, Essand M, et al. Astrocytes have the capacity to act as antigen-presenting cells in the Parkinson’s disease brain. Journal of Neuroinflammation. 2020;17(1):119. https://doi.org/10.1186/s12974-020-01776-7. sourceExperimental — accuracy not yet measured
The Background says αSYN accumulation in cultured human astrocytes causes severe cellular stress, and the section on intracellular αSYN deposits reports that these cells accumulated large amounts of aggregated αSYN. The passages do not establish the corresponding claim about Aβ aggregates or Aβ-induced stress. (LLM, conf=0.88)
plaindirect- Asserted: passes — The authors put it forward as true.
- Checkable: passes — It can be checked against evidence.
- Load-bearing: unclear — It is unclear whether the paper’s conclusions depend on it.
- Based: passes — The paper gives a reason why it holds.
It may state two separate claims as one.
- Partly supported
The cited sources support only part of this claim — read each source’s verdict below.
In the paper
“Growing evidence indicates that insufficient degradation of protein aggregates and chronic inflammation are driving forces of AD and PD brain pathology [30–32].”
§ Crosstalk between astrocytes and microglia results in increased degradation of α-synuclein and amyloid-β aggregates > Discussion
What the sources say
- Partly supportedcites [30] Nixon RA, Yang D-S, Lee J-H. Neurodegenerative lysosomal disorders: a continuum from development to late age. Autophagy. 2008;4(5):590–9. https://doi.org/10.4161/auto.6259. sourceExperimental — accuracy not yet measured
The sections on pathological consequences in Alzheimer’s disease and lysosomal-system defects in Parkinson disease link impaired protein degradation to AD pathology and impaired α-synuclein degradation to familial PD. They do not support the additional claim that chronic inflammation drives pathology in either disease. (LLM, conf=0.87)
- Not checked — no full text of the sourcecites [31] Nixon RA. Autophagy, amyloidogenesis and Alzheimer disease. Journal of Cell Science. 2007;120(23):4081–91. https://doi.org/10.1242/jcs.019265. source
- Partly supportedcites [32] Appelqvist H, Wäster P, Kågedal K, Öllinger K. The lysosome: from waste bag to potential therapeutic target. Journal of Molecular Cell Biology. 2013;5(4):214–26. https://doi.org/10.1093/jmcb/mjt022. sourceExperimental — accuracy not yet measured
The Neurodegenerative disorders section links defective autophagy and lysosomal dysfunction to neurodegeneration and says brain inflammation is observed in Alzheimer’s and Parkinson’s diseases. The Future targeting section also links impaired lysosomal degradation to protein-accumulation diseases. But the paper describes inflammation as a secondary pathological change and hedges the role of lysosomal disturbance; it does not establish that chronic inflammation and insufficient aggregate degradation are both driving forces of AD and PD pathology. (LLM, conf=0.86)
hedgeddirect- Asserted: passes — The authors put it forward as true.
- Checkable: passes — It can be checked against evidence.
- Load-bearing: passes — The paper’s conclusions depend on it.
- Based: passes — The paper gives a reason why it holds.
It may state two separate claims as one.
- Partly supported
A result the paper reports from its own data — it cites no other source for it, so there is none to check. The quote shows it is in the paper.
In the paper
“Analysis of conditioned medium and imaging data from the “close-culture” chamber experiments indicate that astrocytes secrete a high proportion of their internalized protein aggregates, while microglia do not.”
§ Crosstalk between astrocytes and microglia results in increased degradation of α-synuclein and amyloid-β aggregates > Abstract > Results
hedged- Asserted: passes — The authors put it forward as true.
- Checkable: passes — It can be checked against evidence.
- Load-bearing: passes — The paper’s conclusions depend on it.
- Based: passes — The paper gives a reason why it holds.
It may state two separate claims as one.
- Rests on an assumption: Cy3 labeling of αSYN and Aβ fibrils does not alter their uptake, accumulation, or degradation properties.
A result the paper reports from its own data — it cites no other source for it, so there is none to check. The quote shows it is in the paper.
In the paper
“Our data indicate that the exposure to aggregated αSYN or Aβ had very little effect on the cytokine profile.”
§ Crosstalk between astrocytes and microglia results in increased degradation of α-synuclein and amyloid-β aggregates > Results > Microglia degrade aggregated αSYN and Aβ better than astrocytes
hedged- Asserted: passes — The authors put it forward as true.
- Checkable: passes — It can be checked against evidence.
- Load-bearing: fails — The paper’s conclusions may not depend on it.
- Based: passes — The paper gives a reason why it holds.
Probably not a substantial claim. The paper’s conclusions may not depend on it.
A result the paper reports from its own data — it cites no other source for it, so there is none to check. The quote shows it is in the paper.
In the paper
“Since microglia continued to proliferate over the 7d, the αSYN signal per cell was reduced over time, although the total αSYN content in the culture was unchanged (Fig. 1h–j and Supplementary Figure 2).”
§ Crosstalk between astrocytes and microglia results in increased degradation of α-synuclein and amyloid-β aggregates > Results > Astrocytes, but not microglia, accumulate αSYN-F over time
plaindirect- Asserted: passes — The authors put it forward as true.
- Checkable: passes — It can be checked against evidence.
- Load-bearing: unclear — It is unclear whether the paper’s conclusions depend on it.
- Based: passes — The paper gives a reason why it holds.
It may state two separate claims as one.
A result the paper reports from its own data — it cites no other source for it, so there is none to check. The quote shows it is in the paper.
In the paper
“Together with the finding that intracellular αSYN increased over time in astrocytes, but remained unchanged in microglia cells”
§ Crosstalk between astrocytes and microglia results in increased degradation of α-synuclein and amyloid-β aggregates > Results > Microglia degrade aggregated αSYN and Aβ better than astrocytes
plain- Asserted: passes — The authors put it forward as true.
- Checkable: passes — It can be checked against evidence.
- Load-bearing: passes — The paper’s conclusions depend on it.
- Based: passes — The paper gives a reason why it holds.
It may state two separate claims as one.
A result the paper reports from its own data — it cites no other source for it, so there is none to check. The quote shows it is in the paper.
In the paper
“In line with the results from the monocultures, there was a clear reduction of intracellular deposits in the co-culture set-up, following removal of αSYN (24h+3d and 24h+6d, Fig. 2i–k), although there were some remaining deposits that were not cleared.”
§ Crosstalk between astrocytes and microglia results in increased degradation of α-synuclein and amyloid-β aggregates > Results > Co-culturing of microglia and astrocytes results in reduced αSYN accumulation
boosteddirect- Asserted: passes — The authors put it forward as true.
- Checkable: passes — It can be checked against evidence.
- Load-bearing: passes — The paper’s conclusions depend on it.
- Based: passes — The paper gives a reason why it holds.
It may state two separate claims as one.
A result the paper reports from its own data — it cites no other source for it, so there is none to check. The quote shows it is in the paper.
In the paper
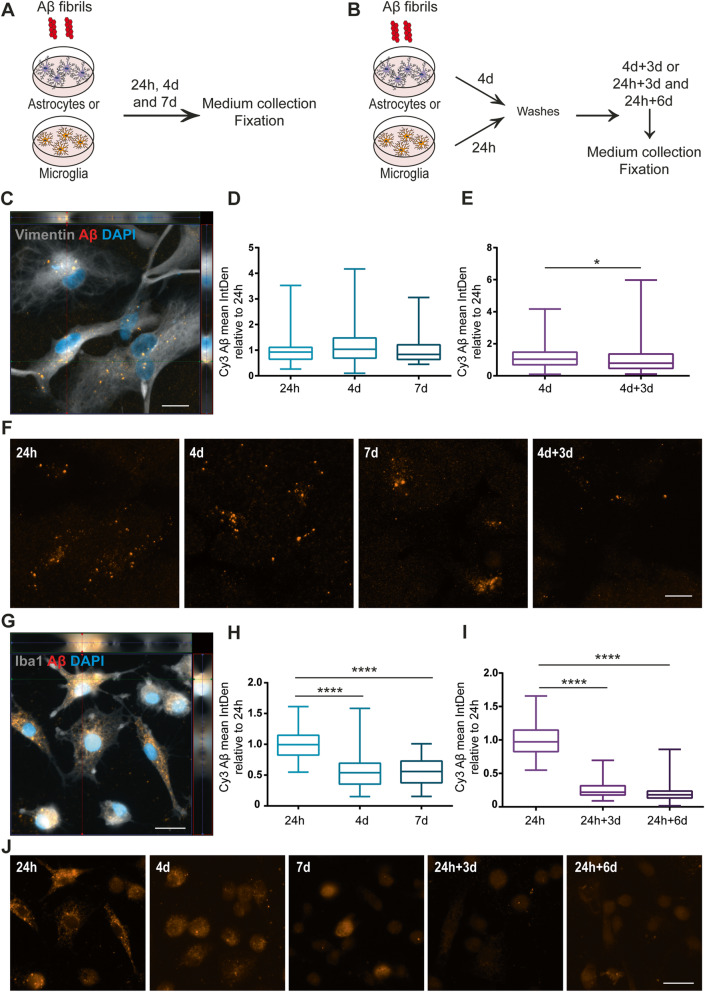
“In contrast to αSYN, the intracellular Aβ signal was significantly decreased at 4d. On the other hand, no change in intracellular Aβ was observed from 4 to 7d (Fig. 3h).”
§ Crosstalk between astrocytes and microglia results in increased degradation of α-synuclein and amyloid-β aggregates > Results > Intracellular Aβ levels remain stable in astrocytes, but decrease over time in microglia
plain- Asserted: passes — The authors put it forward as true.
- Checkable: passes — It can be checked against evidence.
- Load-bearing: passes — The paper’s conclusions depend on it.
- Based: passes — The paper gives a reason why it holds.
It may state two separate claims as one.
A result the paper reports from its own data — it cites no other source for it, so there is none to check. The quote shows it is in the paper.
In the paper
“The intracellular levels of Aβ-F at 24h in astrocytes appeared lower than the levels of αSYN-F (Fig. 3c).”
§ Crosstalk between astrocytes and microglia results in increased degradation of α-synuclein and amyloid-β aggregates > Results > Intracellular Aβ levels remain stable in astrocytes, but decrease over time in microglia
hedged- Asserted: passes — The authors put it forward as true.
- Checkable: passes — It can be checked against evidence.
- Load-bearing: fails — The paper’s conclusions may not depend on it.
- Based: passes — The paper gives a reason why it holds.
Probably not a substantial claim. The paper’s conclusions may not depend on it.
A result the paper reports from its own data — it cites no other source for it, so there is none to check. The quote shows it is in the paper.
In the paper
“Our data show that in the separate cultures, both microglia and astrocytes ingest αSYN and Aβ aggregates, but microglia appear to be more effective in degrading the protein aggregates.”
§ Crosstalk between astrocytes and microglia results in increased degradation of α-synuclein and amyloid-β aggregates > Discussion
hedgedcorrelational- Asserted: passes — The authors put it forward as true.
- Checkable: passes — It can be checked against evidence.
- Load-bearing: passes — The paper’s conclusions depend on it.
- Based: passes — The paper gives a reason why it holds.
It may state two separate claims as one.
A result the paper reports from its own data — it cites no other source for it, so there is none to check. The quote shows it is in the paper.
In the paper
“Often, the microglial cells were found within a ring-shaped area, completely surrounded by an astrocytic membrane.”
- Also stated in: § Discussion · boosted
“Moreover, microglia were often situated in ring-shaped areas, “in the middle” of astrocytes, clearly anchored to the astrocyte membrane via extending protrusions.”
§ Crosstalk between astrocytes and microglia results in increased degradation of α-synuclein and amyloid-β aggregates > Results > Extensive contact between astrocytes and microglia enable cell-to-cell transfer of aggregated αSYN
boostedcorrelational- Asserted: passes — The authors put it forward as true.
- Checkable: passes — It can be checked against evidence.
- Load-bearing: unclear — It is unclear whether the paper’s conclusions depend on it.
- Based: passes — The paper gives a reason why it holds.
It may state two separate claims as one.
- Also stated in: § Discussion · boosted
A result the paper reports from its own data — it cites no other source for it, so there is none to check. The quote shows it is in the paper.
In the paper
“In the co-culture experiments in this study, we found that astrocytes also establish direct contact with microglia and that the two glial cell types remained in a continual alliance for a long time, as shown by immunocytochemistry and time-lapse microscopy.”
§ Crosstalk between astrocytes and microglia results in increased degradation of α-synuclein and amyloid-β aggregates > Discussion
plaincorrelational- Asserted: passes — The authors put it forward as true.
- Checkable: passes — It can be checked against evidence.
- Load-bearing: passes — The paper’s conclusions depend on it.
- Based: passes — The paper gives a reason why it holds.
It may state two separate claims as one.
A result the paper reports from its own data — it cites no other source for it, so there is none to check. The quote shows it is in the paper.
In the paper
“No change in the intensity of the CD68 staining was detected following αSYN or Aβ exposure (Supplementary Fig 8).”
§ Crosstalk between astrocytes and microglia results in increased degradation of α-synuclein and amyloid-β aggregates > Results > Ingested αSYN enters the endo-lysosomal pathway and remains there
plain- Asserted: passes — The authors put it forward as true.
- Checkable: passes — It can be checked against evidence.
- Load-bearing: fails — The paper’s conclusions may not depend on it.
- Based: passes — The paper gives a reason why it holds.
Probably not a substantial claim. The paper’s conclusions may not depend on it.
A result the paper reports from its own data — it cites no other source for it, so there is none to check. The quote shows it is in the paper.
In the paper
“We also noted that the αSYN load in the astrocyte was dramatically reduced during the microglia interaction”
- Also stated in: § Discussion · hedged
“As shown with our time-lapse recordings, the αSYN-deposits appeared to be immediately degraded, after being transferred from astrocytes to microglia.”
§ Crosstalk between astrocytes and microglia results in increased degradation of α-synuclein and amyloid-β aggregates > Results > Extensive contact between astrocytes and microglia enable cell-to-cell transfer of aggregated αSYN
plaindirect- Asserted: passes — The authors put it forward as true.
- Checkable: passes — It can be checked against evidence.
- Load-bearing: passes — The paper’s conclusions depend on it.
- Based: passes — The paper gives a reason why it holds.
It may state two separate claims as one.
- Also stated in: § Discussion · hedged
A claim is checked only against the cited paper’s full text, never its abstract, and none is available for its sources.
In the paper
“In PD, intracellular inclusions of alpha-synuclein (αSYN) are found in neurons and glia, while both extracellular and intracellular deposits of amyloid-beta (Aβ) are present in the AD brain [2, 3].”
§ Crosstalk between astrocytes and microglia results in increased degradation of α-synuclein and amyloid-β aggregates > Background
What the sources say
- Not checked — no full text of the sourcecites [2] Goedert M. Parkinson’s disease and other alpha-synucleinopathies. Clin Chem Lab Med. 2001;39(4):308–12. https://doi.org/10.1515/CCLM.2001.047. source
- Not checked — no full text of the sourcecites [3] LaFerla FM, Green KN, Oddo S. Intracellular amyloid-beta in Alzheimer’s disease. Nat Rev Neurosci. 2007;8(7):499–509. https://doi.org/10.1038/nrn2168. source
plain- Asserted: passes — The authors put it forward as true.
- Checkable: passes — It can be checked against evidence.
- Load-bearing: fails — The paper’s conclusions may not depend on it.
- Based: passes — The paper gives a reason why it holds.
Probably not a substantial claim. The paper’s conclusions may not depend on it. It may state two separate claims as one.
A conclusion the paper draws from its own results — it cites no other source for it, so there is none to check. The quote shows it is in the paper.
In the paper
“Taken together, our data demonstrate the importance of astrocyte and microglia interactions in Aβ/αSYN clearance, highlighting the relevance of glial cellular crosstalk in the progression of AD- and PD-related brain pathology.”
§ Crosstalk between astrocytes and microglia results in increased degradation of α-synuclein and amyloid-β aggregates > Abstract > Conclusions
boostedcorrelational- Asserted: passes — The authors put it forward as true.
- Checkable: passes — It can be checked against evidence.
- Load-bearing: passes — The paper’s conclusions depend on it.
- Based: passes — The paper gives a reason why it holds.
It may state two separate claims as one.
- Rests on an assumption: The hiPSC-derived astrocytes and microglia used in this study are representative of human brain astrocytes and microglia in AD and PD.
- Rests on an assumption: A decrease in intracellular αSYN/Aβ signal over time reflects degradation of the ingested aggregates rather than secretion or other loss.
A conclusion the paper draws from its own results — it cites no other source for it, so there is none to check. The quote shows it is in the paper.
In the paper
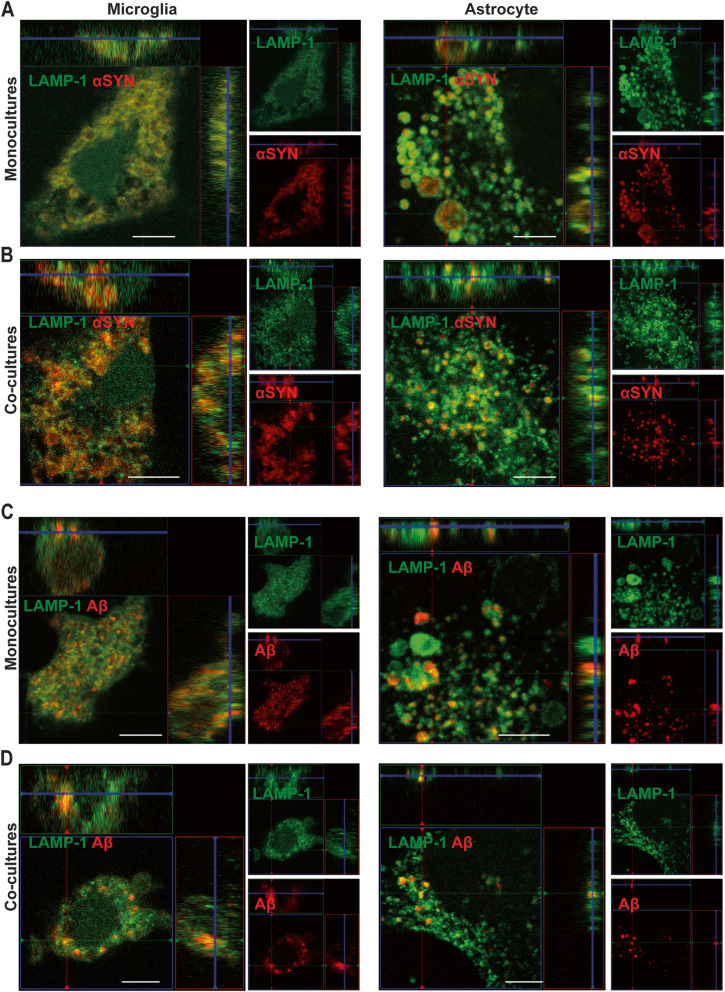
“Notably, intracellular αSYN was still observed in both monocultures at 24h+6d, indicating that some deposits are more difficult for the cells to clear (Fig. 1e and i).”
§ Crosstalk between astrocytes and microglia results in increased degradation of α-synuclein and amyloid-β aggregates > Results > Astrocytes, but not microglia, accumulate αSYN-F over time
hedged- Asserted: passes — The authors put it forward as true.
- Checkable: passes — It can be checked against evidence.
- Load-bearing: unclear — It is unclear whether the paper’s conclusions depend on it.
- Based: passes — The paper gives a reason why it holds.
It may state two separate claims as one.
- Rests on an assumption: A decrease in intracellular αSYN/Aβ signal over time reflects degradation of the ingested aggregates rather than secretion or other loss.
What the paper did — it cites no source for this, so there is none to check. The quote shows it is in the paper.
In the paper
“Since the astrocytes and microglia proliferated during the time course of the experiment (Supplementary Figure 1 and 2), we normalized the IntDen αSYN/Aβ signal to the area and not to the cell number. In proliferating cultures, normalization to the cell number is misleading as the deposits per cell will then be reduced without any degradation taking place.”
§ Crosstalk between astrocytes and microglia results in increased degradation of α-synuclein and amyloid-β aggregates > Methods > Image analysis
plaindirect- Asserted: passes — The authors put it forward as true.
- Checkable: passes — It can be checked against evidence.
- Load-bearing: passes — The paper’s conclusions depend on it.
- Based: passes — The paper gives a reason why it holds.
Probably not a substantial claim. It may state two separate claims as one.
A conclusion the paper draws from its own results — it cites no other source for it, so there is none to check. The quote shows it is in the paper.
In the paper
“indicating that the presence of microglia either increases the degradation capacity of the astrocytes or causes astrocytes to dispose of their inclusions via secretion or cell-to-cell transfer.”
§ Crosstalk between astrocytes and microglia results in increased degradation of α-synuclein and amyloid-β aggregates > Results > Astrocytes contain less Aβ deposits when co-cultured with microglia
hedgeddirect- Asserted: passes — The authors put it forward as true.
- Checkable: passes — It can be checked against evidence.
- Load-bearing: passes — The paper’s conclusions depend on it.
- Based: passes — The paper gives a reason why it holds.
It may state two separate claims as one.
What the paper did — it cites no source for this, so there is none to check. The quote shows it is in the paper.
In the paper
“To enable co-cultures of human iPSC-derived astrocytes and microglia without strain-induced immunological reactions, microglia were generated from the same human iPSC line that was used for deriving the NES cells.”
§ Crosstalk between astrocytes and microglia results in increased degradation of α-synuclein and amyloid-β aggregates > Methods > Culturing of human iPSC-derived microglia
plaindirectSingle case- Asserted: passes — The authors put it forward as true.
- Checkable: passes — It can be checked against evidence.
- Load-bearing: passes — The paper’s conclusions depend on it.
- Based: passes — The paper gives a reason why it holds.
Probably not a substantial claim.
A conclusion the paper draws from its own results — it cites no other source for it, so there is none to check. The quote shows it is in the paper.
In the paper
“Although the intracellular Aβ aggregates were significantly lowered at 24h+3d and 24h+6d, there were still some remaining Aβ deposits at these time points, indicating that the microglia were not capable of complete degradation during the 6d time span (Fig. 3i).”
§ Crosstalk between astrocytes and microglia results in increased degradation of α-synuclein and amyloid-β aggregates > Results > Intracellular Aβ levels remain stable in astrocytes, but decrease over time in microglia
hedged- Asserted: passes — The authors put it forward as true.
- Checkable: passes — It can be checked against evidence.
- Load-bearing: passes — The paper’s conclusions depend on it.
- Based: passes — The paper gives a reason why it holds.
It may state two separate claims as one.
- Rests on an assumption: A decrease in intracellular αSYN/Aβ signal over time reflects degradation of the ingested aggregates rather than secretion or other loss.
A conclusion the paper draws from its own results — it cites no other source for it, so there is none to check. The quote shows it is in the paper.
In the paper
“These data suggest that microglia and astrocytes could share the burden by dividing toxic materials in a size-dependent manner, where microglia would phagocytose bigger aggregates and astrocytes smaller aggregates.”
§ Crosstalk between astrocytes and microglia results in increased degradation of α-synuclein and amyloid-β aggregates > Discussion
hedgedconditional- Asserted: passes — The authors put it forward as true.
- Checkable: passes — It can be checked against evidence.
- Load-bearing: unclear — It is unclear whether the paper’s conclusions depend on it.
- Based: passes — The paper gives a reason why it holds.
It may state two separate claims as one.
A conclusion the paper draws from its own results — it cites no other source for it, so there is none to check. The quote shows it is in the paper.
In the paper
“indicating that microglia attract and clear intracellular protein deposits directly from the astrocytes (Fig. 9c).”
§ Crosstalk between astrocytes and microglia results in increased degradation of α-synuclein and amyloid-β aggregates > Results > Extensive contact between astrocytes and microglia enable cell-to-cell transfer of aggregated αSYN
hedgeddirect- Asserted: passes — The authors put it forward as true.
- Checkable: passes — It can be checked against evidence.
- Load-bearing: passes — The paper’s conclusions depend on it.
- Based: passes — The paper gives a reason why it holds.
It may state two separate claims as one.
A conclusion the paper draws from its own results — it cites no other source for it, so there is none to check. The quote shows it is in the paper.
In the paper
“Hence, it is possible that astrocytes engulf less protein aggregates in the presence of microglia and thereby allow better degradation of the ingested material.”
§ Crosstalk between astrocytes and microglia results in increased degradation of α-synuclein and amyloid-β aggregates > Discussion
hedgedconditional- Asserted: passes — The authors put it forward as true.
- Checkable: passes — It can be checked against evidence.
- Load-bearing: passes — The paper’s conclusions depend on it.
- Based: passes — The paper gives a reason why it holds.
It may state two separate claims as one.
A conclusion the paper draws from its own results — it cites no other source for it, so there is none to check. The quote shows it is in the paper.
In the paper
“suggesting that the αSYN-F/Aβ-F is cleared predominantly by lysosomal degradation and do not end up in other cellular compartments.”
§ Crosstalk between astrocytes and microglia results in increased degradation of α-synuclein and amyloid-β aggregates > Results > Ingested αSYN enters the endo-lysosomal pathway and remains there
hedgeddirect- Asserted: passes — The authors put it forward as true.
- Checkable: passes — It can be checked against evidence.
- Load-bearing: passes — The paper’s conclusions depend on it.
- Based: passes — The paper gives a reason why it holds.
It may state two separate claims as one.
The paper relies on this without support.
The hiPSC-derived astrocytes and microglia used in this study are representative of human brain astrocytes and microglia in AD and PD.
“Human astrocytes were generated from neuroepithelial-like stem (NES) cells, produced from human-induced pluripotent stem cells (iPSCs, Cntrl9 cell line) [25, 26].”
The paper relies on this without support.
Cy3 labeling of αSYN and Aβ fibrils does not alter their uptake, accumulation, or degradation properties.
“The αSYN-F were Cy3-labelled using Cy3AM antibody labelling kit (GE Healthcare, PA33000) as described previously [24].”
The paper relies on this without support.
A decrease in intracellular αSYN/Aβ signal over time reflects degradation of the ingested aggregates rather than secretion or other loss.
“However, upon removal of extracellular αSYN-F, the intracellular αSYN signal decreased, indicating that the astrocytes were capable of degrading at least a proportion of the ingested αSYN-F (Fig. 1e).”
The paper relies on this without support.
The cell markers used (Iba1, vimentin, S100B, etc.) specifically identify microglia and astrocytes in co-culture.
“In both the separate cultures and in the co-cultures, microglia and astrocytes were outlined using the cellular markers Iba1 and vimentin, limiting the analysis to internalized αSYN/Aβ only.”
Claims other papers make about this one
Each is checked against this paper’s own text: does it say what the citing paper says it does?
The source backs part of the claim, not all of it — or backs it for a different population, condition or comparison.
In the citing paper
“In addition, microglia can also attach to the cell membrane of astrocytes, attracting and clearing intracellular protein deposits, such as α-synuclein and Aβ, from the astrocytes.73”
From Role of neuroinflammation in neurodegeneration development (2023) · cites this paper as [73]
Experimental — accuracy not yet measured
Self-check
Percentages, sums and reported differences re-computed from the paper’s own numbers.
Each contradiction between two passages listed here was confirmed by an independent check.
Rated major: it would touch a result — a value a result rests on, reported and recomputed p-values on opposite sides of the significance level, two passages that conflict with no sign which is right, or a cited work retracted before this paper was published.
In the paper
§ Crosstalk between astrocytes and microglia results in increased degradation of α-synuclein and amyloid-β aggregates > Methods > Image analysis
“In both the separate cultures and in the co-cultures, microglia and astrocytes were outlined using the cellular markers Iba1 and vimentin, limiting the analysis to internalized αSYN/Aβ only. The IntDen αSYN/Aβ signal was measured within the outlined cells. Since the astrocytes and microglia proliferated during the time course of the experiment (Supplementary Figure 1 and 2), we normalized the IntDen αSYN/Aβ signal to the area and not to the cell number.”
§ Crosstalk between astrocytes and microglia results in increased degradation of α-synuclein and amyloid-β aggregates > Results > Co-culturing of microglia and astrocytes results in reduced αSYN accumulation
“By normalizing αSYN IntDen to the total number of respective cell type, we revealed that microglia cells contained significantly more αSYN per cell at 24h and 4d, compared to the astrocytes (Fig. 2d and e and Supplementary Figure 4).”
Rated minor: it would not touch a result — a value no result rests on, a p-value that stays on the same side of the significance level, or a conflict that is clerical, resolved elsewhere in the paper, or outside its own findings.
In the paper
§ Crosstalk between astrocytes and microglia results in increased degradation of α-synuclein and amyloid-β aggregates > Results > Intracellular Aβ levels remain stable in astrocytes, but decrease over time in microglia
“Figure: Fig. 3 Intracellular Aβ levels are reduced in microglia over time but remain stable in astrocytes.”
§ Crosstalk between astrocytes and microglia results in increased degradation of α-synuclein and amyloid-β aggregates > Results > Intracellular Aβ levels remain stable in astrocytes, but decrease over time in microglia
“The intracellular Aβ accumulation was significantly increased after 4d compared to 24h (d).”
Citations
Cites
Neurotoxic reactive astrocytes are induced by activated microglia
Liddelow, S. A., Guttenplan, K. A., Clarke, L. E., Bennett, F. C., Bohlen, C. J., Schirmer, L., Bennett, M. L., Münch, A. E., Chung, W.-S., Peterson, T. C., et al. (2017) · Nature · doi:10.1038/nature21029 · Cited by 7,971
ATP mediates rapid microglial response to local brain injury in vivo
Davalos, D., Grutzendler, J., Yang, G., Kim, J. V., Zuo, Y., Jung, S., Littman, D. R., Dustin, M. L., & Gan, W.-B. (2005) · Nature Neuroscience · doi:10.1038/nn1472 · Cited by 3,913 · cited 1×
“Microglia, on the other hand, are motile and constantly sensing the environment around them [6, 7].”
BackgroundIntracellular amyloid-β in Alzheimer's disease
LaFerla, F. M., Green, K. N., & Oddo, S. (2007) · Nature Reviews Neuroscience · doi:10.1038/nrn2168 · Cited by 1,942
Cell Biology of Astrocyte-Synapse Interactions
Allen, N. J., & Eroglu, C. (2017) · Neuron · doi:10.1016/j.neuron.2017.09.056 · Cited by 1,098 · cited 1×
“In the healthy adult brain, astrocytes are rather stationary cells, forming a well-coordinated network in the parenchyma [5].”
BackgroundMicroglial control of astrocytes in response to microbial metabolites
Rothhammer, V., Borucki, D. M., Tjon, E. C., Takenaka, M. C., Chao, C.-C., Ardura-Fabregat, A., de Lima, K. A., Gutiérrez-Vázquez, C., Hewson, P., Staszewski, O., et al. (2018) · Nature · doi:10.1038/s41586-018-0119-x · Cited by 1,051
Self-citationThe lysosome: from waste bag to potential therapeutic target
Appelqvist, H., Wäster, P., Kågedal, K., & Öllinger, K. (2013) · Journal of Molecular Cell Biology · doi:10.1093/jmcb/mjt022 · Cited by 772
Microglia Promote the Death of Developing Purkinje Cells
Marı́n-Teva, J. L., Dusart, I., Colin, C., Gervais, A., van Rooijen, N., & Mallat, M. (2004) · Neuron · doi:10.1016/s0896-6273(04)00069-8 · Cited by 757
Autophagy, amyloidogenesis and Alzheimer disease
Nixon, R. A. (2007) · Journal of Cell Science · doi:10.1242/jcs.019265 · Cited by 749
A 3D human triculture system modeling neurodegeneration and neuroinflammation in Alzheimer’s disease
Park, J., Wetzel, I., Marriott, I., Dréau, D., D’Avanzo, C., Kim, D. Y., Tanzi, R. E., & Cho, H. (2018) · Nature Neuroscience · doi:10.1038/s41593-018-0175-4 · Cited by 644
Peri, F., & Nüsslein-Volhard, C. (2008) · Cell · doi:10.1016/j.cell.2008.04.037 · Cited by 617
Lian, H., Litvinchuk, A., Chiang, A. C.-A., Aithmitti, N., Jankowsky, J. L., & Zheng, H. (2016) · The Journal of Neuroscience · doi:10.1523/jneurosci.2117-15.2016 · Cited by 597
Complement C3 deficiency protects against neurodegeneration in aged plaque-rich APP/PS1 mice
Shi, Q., Chowdhury, S., Ma, R., Le, K. X., Hong, S., Caldarone, B. J., Stevens, B., & Lemere, C. A. (2017) · Science Translational Medicine · doi:10.1126/scitranslmed.aaf6295 · Cited by 593
Wu, T., Dejanovic, B., Gandham, V. D., Gogineni, A., Edmonds, R., Schauer, S., Srinivasan, K., Huntley, M. A., Wang, Y., Wang, T.-M., et al. (2019) · Cell Reports · doi:10.1016/j.celrep.2019.07.060 · Cited by 466
McQuade, A., Coburn, M., Tu, C. H., Hasselmann, J., Davtyan, H., & Blurton-Jones, M. (2018) · Molecular Neurodegeneration · doi:10.1186/s13024-018-0297-x · Cited by 449 · cited 2×
“Generation of hematopoietic progenitor cells (HPCs) and further differentiation to microglia were performed according to the previously published protocol [27], with a few modifications.”
MethodCrosstalk Between Astrocytes and Microglia: An Overview
Matejuk, A., & Ransohoff, R. M. (2020) · Frontiers in Immunology · doi:10.3389/fimmu.2020.01416 · Cited by 445 · cited 1×
“The conversation between microglia and astrocytes starts already during early development and remains throughout life [1].”
BackgroundAstrocytes as secretory cells of the central nervous system: idiosyncrasies of vesicular secretion
Verkhratsky, A., Matteoli, M., Parpura, V., Mothet, J., & Zorec, R. (2016) · The EMBO Journal · doi:10.15252/embj.201592705 · Cited by 397 · cited 1×
“of neurotransmitters, growth factors, inflammatory mediators, and toxic proteins [33].”
BackgroundNeurodegenerative lysosomal disorders: A continuum from development to late age
Nixon, R. A., Yang, D.-S., & Lee, J.-H. (2008) · Autophagy · doi:10.4161/auto.6259 · Cited by 362
Gadani, S. P., Walsh, J. T., Smirnov, I., Zheng, J., & Kipnis, J. (2015) · Neuron · doi:10.1016/j.neuron.2015.01.013 · Cited by 359
Human Astrocytes Transfer Aggregated Alpha-Synuclein via Tunneling Nanotubes
Rostami, J., Holmqvist, S., Lindström, V., Sigvardson, J., Westermark, G. T., Ingelsson, M., Bergström, J., Roybon, L., & Erlandsson, A. (2017) · The Journal of Neuroscience · doi:10.1523/jneurosci.0983-17.2017 · Cited by 339 · cited 7×
“Our previous results indicate that astrocytes are capable of transferring αSYN as well as MHCII to other astrocytes via direct membrane contact and through TNTs, implicating astrocytes as one of the important players in propagation of αSYN pathology [11, 24].”
BackgroundMethodResultInfluentialSelf-citationMultiple Roles for Astrocytes as Effectors of Cytokines and Inflammatory Mediators
Sofroniew, M. V. (2014) · The Neuroscientist · doi:10.1177/1073858413504466 · Cited by 333
Falk, A., Koch, P., Kesavan, J., Takashima, Y., Ladewig, J., Alexander, M., Wiskow, O., Tailor, J. K., Trotter, M. W. B., Pollard, S. M., et al. (2012) · PLoS ONE · doi:10.1371/journal.pone.0029597 · Cited by 332 · cited 1×
“pluripotent stem cells (iPSCs, Cntrl9 cell line) [25, 26].”
BackgroundSelf-citationDamisah, E. C., Hill, R. A., Rai, A., Chen, F., Rothlin, C. V., Ghosh, S., & Grutzendler, J. (2020) · Science Advances · doi:10.1126/sciadv.aba3239 · Cited by 301 · cited 2×
“A recent study showed that astrocytes and microglia degrade dead cells in a very organized and specialized manner; microglia degrade neuronal dendrites, cell bodies, and nuclei while astrocytes phagocytose apoptotic bodies that are released from the dying neurons [10].”
BackgroundSöllvander, S., Nikitidou, E., Brolin, R., Söderberg, L., Sehlin, D., Lannfelt, L., & Erlandsson, A. (2016) · Molecular Neurodegeneration · doi:10.1186/s13024-016-0098-z · Cited by 267
Self-citationLindström, V., Gustafsson, G., Sanders, L. H., Howlett, E. H., Sigvardson, J., Kasrayan, A., Ingelsson, M., Bergström, J., & Erlandsson, A. (2017) · Molecular and Cellular Neuroscience · doi:10.1016/j.mcn.2017.04.009 · Cited by 233 · cited 3×
“We have previously shown that astrocytes accumulate large amounts of αSYN and Aβ aggregates, resulting in severe cellular stress [11, 12, 23, 24].”
BackgroundMethodSelf-citationMicroglia and Astrocytes in Disease: Dynamic Duo or Partners in Crime?
Liddelow, S. A., Marsh, S. E., & Stevens, B. (2020) · Trends in Immunology · doi:10.1016/j.it.2020.07.006 · Cited by 226
Astrocytes have the capacity to act as antigen-presenting cells in the Parkinson’s disease brain
Rostami, J., Fotaki, G., Sirois, J., Mzezewa, R., Bergström, J., Essand, M., Healy, L., & Erlandsson, A. (2020) · Journal of Neuroinflammation · doi:10.1186/s12974-020-01776-7 · Cited by 212 · cited 8×
“Accordingly, astrocytes could be found in very close proximity to infiltrating T cells in the PD brain [24].”
BackgroundMethodResultInfluentialSelf-citationAging and Neurodegenerative Disease: Is the Adaptive Immune System a Friend or Foe?
Mayne, K., White, J. A., McMurran, C. E., Rivera, F. J., & de la Fuente, A. G. (2020) · Frontiers in Aging Neuroscience · doi:10.3389/fnagi.2020.572090 · Cited by 167 · cited 1×
“Other common features of AD and PD are neuronal cell death and chronic neuroinflammation, involving both innate and adaptive immune responses [4].”
BackgroundLundin, A., Delsing, L., Clausen, M., Ricchiuto, P., Sánchez, J., Sabirsh, A., Ding, M., Synnergren, J., Zetterberg, H., Brolén, G., et al. (2018) · Stem Cell Reports · doi:10.1016/j.stemcr.2018.01.021 · Cited by 128 · cited 1×
“pluripotent stem cells (iPSCs, Cntrl9 cell line) [25, 26].”
BackgroundSelf-citationParkinsons Disease and other α-Synucleinopathies
Goedert, M. (2001) · Clinical Chemistry and Laboratory Medicine · doi:10.1515/cclm.2001.047 · Cited by 96
Frankel, D. H., Hanusa, B. H., & Zitelli, J. A. (1992) · Journal of the American Academy of Dermatology · doi:10.1016/0190-9622(92)70100-t · Cited by 78 · cited 1×
“Microglia, on the other hand, are motile and constantly sensing the environment around them [6, 7].”
BackgroundAli Khan, M. A., Yousef, S. A., & Mullins, C. E. (1986) · American Heart Journal · doi:10.1016/0002-8703(86)90695-2 · Cited by 73
Beretta, C., Nikitidou, E., Streubel-Gallasch, L., Ingelsson, M., Sehlin, D., & Erlandsson, A. (2020) · Scientific Reports · doi:10.1038/s41598-020-72355-2 · Cited by 71 · cited 1×
“The concentrations were selected based on our previous studies [11, 12, 23, 28, 29].”
MethodSelf-citationNikitidou, E., Khoonsari, P. E., Shevchenko, G., Ingelsson, M., Kultima, K., & Erlandsson, A. (2017) · Journal of Alzheimer's Disease · doi:10.3233/jad-170278 · Cited by 68 · cited 1×
“The concentrations were selected based on our previous studies [11, 12, 23, 28, 29].”
MethodSelf-citationAstroglia-Microglia Cross Talk during Neurodegeneration in the Rat Hippocampus
Batlle, M., Ferri, L., Andrade, C., Ortega, F.-J., Vidal-Taboada, J. M., Pugliese, M., Mahy, N., & Rodríguez, M. J. (2015) · BioMed Research International · doi:10.1155/2015/102419 · Cited by 34 · cited 1×
“Several studies have demonstrated that astrocytes are capable of stimulating microglia phagocytosis by secretion of cytokines such as IL33 and the complement protein C3 [19, 34].”
Background
Cited by
Sorted by citations
Role of neuroinflammation in neurodegeneration development
Zhang, W., Xiao, D., Mao, Q., & Xia, H. (2023) · Signal Transduction and Targeted Therapy · doi:10.1038/s41392-023-01486-5 · Cited by 1,668
Roles of neuropathology-associated reactive astrocytes: a systematic review
Lawrence, J. M., Schardien, K., Wigdahl, B., & Nonnemacher, M. R. (2023) · Acta Neuropathologica Communications · doi:10.1186/s40478-023-01526-9 · Cited by 433
“Astrocytes and microglia can function cooperatively to process toxic protein deposits [105].”
BackgroundInfluentialScheiblich, H., Dansokho, C., Mercan, D., Schmidt, S. V., Bousset, L., Wischhof, L., Eikens, F., Odainic, A., Spitzer, J., Griep, A., et al. (2021) · Cell · doi:10.1016/j.cell.2021.09.007 · Cited by 360
Oxidative Stress and Beta Amyloid in Alzheimer’s Disease. Which Comes First: The Chicken or the Egg?
Tamagno, E., Guglielmotto, M., Vasciaveo, V., & Tabaton, M. (2021) · Antioxidants · doi:10.3390/antiox10091479 · Cited by 282
Microglia and Astrocyte Function and Communication: What Do We Know in Humans?
Garland, E. F., Hartnell, I. J., & Boche, D. (2022) · Frontiers in Neuroscience · doi:10.3389/fnins.2022.824888 · Cited by 165
“Interestingly, when this phenomenon occurred, the microglia were the cells that would attract and clear the intracellular protein from the astrocytes, not the other way around (Rostami et al., 2021), implying that while astrocytes were capable of clearing pathological proteins, microglia were the primary cells to indu…”
Background
Metadata
- Authors
- Rostami, J., Mothes, T., Kolahdouzan, M., Eriksson, O., Moslem, M., Bergström, J., Ingelsson, M., O’Callaghan, P., Healy, L. M., Falk, A., & Erlandsson, A.
- Affiliations
- Uppsala University (SE)
- Montreal Neurological Institute and Hospital (CA)
- Karolinska Institutet (SE)
- Corresponding author
- Erlandsson, Anna
- ORCID
- Venue
- Journal of Neuroinflammation
- Published
- 2021-06-03
- Volume
- 18
- Issue
- 1
- Pages
- 124-124
- ISSN
- 1742-2094 (ISSN-L)
- PMC
- PMC8173980
- OpenAlex
- W3116421092
- Semantic Scholar
- f1cda7d893cb3cc82c8b14196072573039c27a7d
- Cited by
- 224
- References
- 34
- Citations by year
- 2026: 50 · 2025: 40 · 2024: 55 · 2023: 50 · 2022: 26 · 2021: 3
- FWCI
- 11.03
- Type
- journal article
- Language
- en
- Open access
- gold
- doi.org
- Locations
- Journal of Neuroinflammation (publishedVersion, cc-by)
- PubMed (publishedVersion)
- TSpace (University of Toronto) (submittedVersion, cc-by)
- PubMed Central (submittedVersion, cc-by)
- KTH Publication Database DiVA (KTH Royal Institute of Technology) (submittedVersion, other-oa)
- DOAJ (DOAJ: Directory of Open Access Journals) (submittedVersion, cc-by-sa)
- Funders
- Vetenskapsrådet (2018-02659)
- Parkinsonfonden (1229/19)
- Alzheimerfonden (AF-930515)
- Hjärnfonden (FO2018-0153)
- Åhlén-stiftelsen (193013)
- Demensförbundet
- Torsten Söderbergs Stiftelse (M60/18)
- O. E. och Edla Johanssons Vetenskapliga Stiftelse
- Stiftelsen Olle Engkvist Byggmästare (191-0410)
- Stiftelsen Apotekare Hedbergs Fond för Medicinsk Forskning (991)
- Gun och Bertil Stohnes Stiftelse
- Topics
- Life Sciences › Neuroscience › Neurology › Neuroinflammation and Neurodegeneration Mechanisms
- Life Sciences › Neuroscience › Cellular and Molecular Neuroscience › Alzheimer's disease research and treatments
- Health Sciences › Medicine › Clinical Neurology › Parkinson's Disease Mechanisms and Treatments
- Keywords
- astrocyte-microglia crosstalk, alpha-synuclein, amyloid-beta, protein aggregate clearance, Alzheimer's disease, Parkinson's disease, glial interactions, tunneling nanotubes, co-culture, neuroinflammation
- MeSH terms
- Alzheimer Disease, Astrocytes, Brain, Cells, Cultured, Humans, Parkinson Disease, Amyloid beta-Peptides, Microglia, Microscopy, Confocal, Coculture Techniques, Cell Membrane Structures, Nanotubes, alpha-Synuclein, Induced Pluripotent Stem Cells, Proteolysis, Protein Aggregation, Pathological, Protein Aggregates
About these checks
Registry, retraction, Cites and statistics results are computed, not judged, with one exception: a printed reference that no index lists is read once by a model before it counts as a citation error. Claims are extracted by a model and kept only when their quote appears verbatim in the text; each cited source is then checked, with a model’s help, for whether it says what the claim relies on. Those verdicts can be wrong — read the claim’s quote and the cited source before relying on one.
A language model drew the claims from the paper on 2026-10-18, under version 3 of the claim definition (model deepseek-v4.1-flash, prompt extract-v3).
A second model labelled each claim on 2026-10-18 (model jev-1.13-20260917, definition revision gold-guideline-v0.2).
Cited sources are checked with a language model’s help (gpt-6-sol).
Statistics and arithmetic are recomputed, not judged.
Confidence bands are shown only for fields calibrated on our annotated test set. None is calibrated yet, so no band is shown.
What counts as a claim ›How we measure confidence ›How we check this ›
Are you an author, or do you see a problem with this page? Request a review
