

The DOI matches its Crossref record; 30 of the 31 references it cites were found in a registry or an index.
A coherent approach for analysis of the Illumina HumanMethylation450 BeadChip improves data quality and performance in epigenome-wide association studies
Open accessAbstract
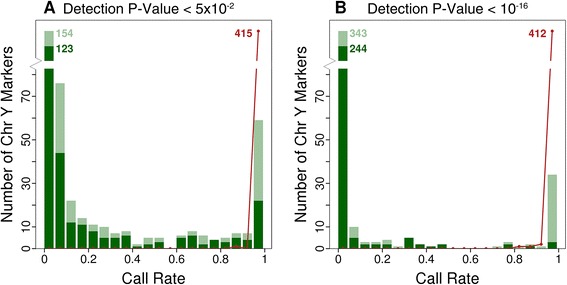
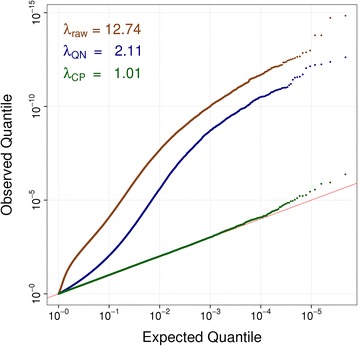
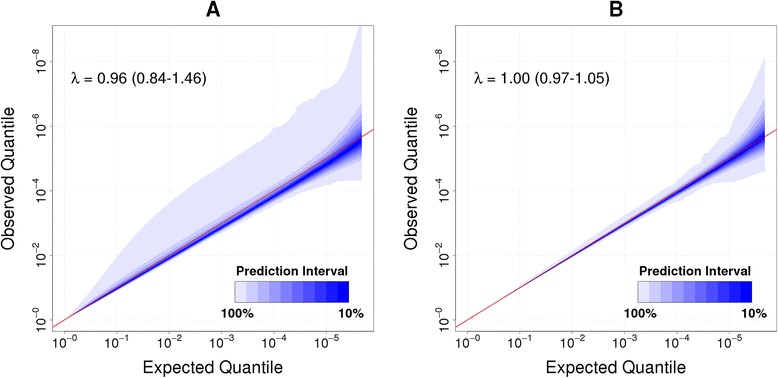
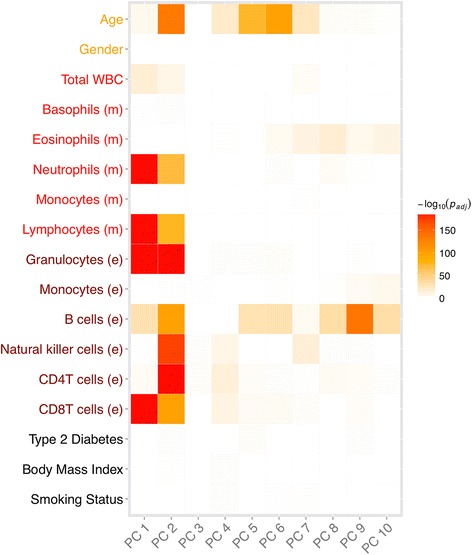
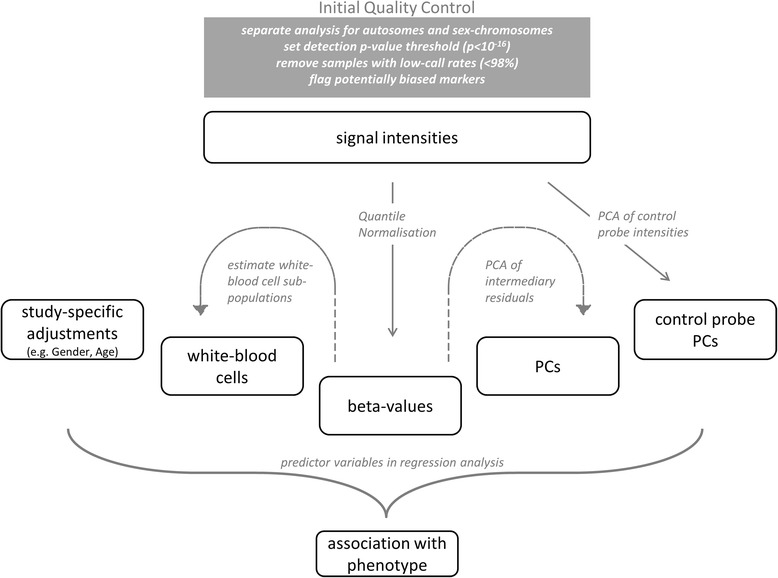
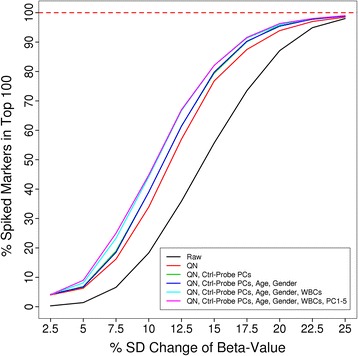
DNA methylation plays a fundamental role in the regulation of the genome, but the optimal strategy for analysis of genome-wide DNA methylation data remains to be determined. We developed a comprehensive analysis pipeline for epigenome-wide association studies (EWAS) using the Illumina Infinium HumanMethylation450 BeadChip, based on 2,687 individuals, with 36 samples measured in duplicate. We propose new approaches to quality control, data normalisation and batch correction through control-probe adjustment and establish a null hypothesis for EWAS using permutation testing. Our analysis pipeline outperforms existing approaches, enabling accurate identification of methylation quantitative trait loci for hypothesis driven follow-up experiments.
Overview
The claims and statistics of this paper haven’t been checked yet.
Run the check — free, no account needed. It reads the open-access text and checks the sources it cites.
Integrity signals
Registry
Cites
Statistics
Figures
Verification
Claims the paper makes
The claims and statistics of this paper haven’t been checked yet.
Run the check — free, no account needed. It reads the open-access text and checks the sources it cites.
Claims other papers make about this one
Each is checked against this paper’s own text: does it say what the citing paper says it does?
In the citing paper
“One of the suggestive CpGs (cg04099436) was flagged for cross-reactivity (cf. Lehne et al., 2015; Pidsley et al., 2016) and thus omitted from the results.”
From Epigenome-wide DNA methylation in unipolar depression: predictive biomarker of antidepressant treatment response? (2024) · cites this paper as Lehne et al., 2015
Self-check
Percentages, sums and reported differences re-computed from the paper’s own numbers.
The self-check needs the paper’s full text.
Citations
Cites
Adjusting batch effects in microarray expression data using empirical Bayes methods
Johnson, W. E., Li, C., & Rabinovic, A. (2007) · Biostatistics · doi:10.1093/biostatistics/kxj037 · Cited by 8,658
limma: Linear Models for Microarray Data
Smyth, G. K. (2005) · Statistics for Biology and Health · doi:10.1007/0-387-29362-0_23 · Cited by 5,796
DNA methylation arrays as surrogate measures of cell mixture distribution
Houseman, E. A., Accomando, W. P., Koestler, D. C., Christensen, B. C., Marsit, C. J., Nelson, H. H., Wiencke, J. K., & Kelsey, K. T. (2012) · BMC Bioinformatics · doi:10.1186/1471-2105-13-86 · Cited by 3,175
lumi : a pipeline for processing Illumina microarray
Du, P., Kibbe, W. A., & Lin, S. M. (2008) · Bioinformatics · doi:10.1093/bioinformatics/btn224 · Cited by 2,028
High density DNA methylation array with single CpG site resolution
Bibikova, M., Barnes, B., Tsan, C., Ho, V., Klotzle, B., Le, J. M., Delano, D., Zhang, L., Schroth, G. P., Gunderson, K. L., et al. (2011) · Genomics · doi:10.1016/j.ygeno.2011.07.007 · Cited by 1,727 · cited 6×
“We developed a comprehensive analysis pipeline for epigenome-wide association studies (EWAS) using the Illumina Infinium HumanMethylation450 BeadChip, based on 2,687 individuals, with 36 samples measured in duplicate.”
BackgroundInfluentialTeschendorff, A. E., Marabita, F., Lechner, M., Bartlett, T. E., Tegner, J. N., Gómez-Cabrero, D., & Beck, S. (2012) · Bioinformatics · doi:10.1093/bioinformatics/bts680 · Cited by 1,686
Kulis, M., & Esteller, M. (2010) · Advances in genetics · doi:10.1016/b978-0-12-380866-0.60002-2 · Cited by 1,617
Chen, Y. A., Lemire, M., Choufani, S., Butcher, D. T., Grafodatskaya, D., Zanke, B. W., Gallinger, S., Hudson, T. J., & Weksberg, R. (2013) · Epigenetics · doi:10.4161/epi.23470 · Cited by 1,547
DNA methylation profiling of human chromosomes 6, 20 and 22
Eckhardt, F., Lewin, J., Cortese, R., Rakyan, V. K., Attwood, J., Burger, M., Burton, J. H., Cox, T. V., Davies, R., Down, T. A., et al. (2006) · Nature Genetics · doi:10.1038/ng1909 · Cited by 1,378
A data-driven approach to preprocessing Illumina 450K methylation array data
Pidsley, R., Y Wong, C. C., Volta, M., Lunnon, K., Mill, J., & Schalkwyk, L. C. (2013) · BMC Genomics · doi:10.1186/1471-2164-14-293 · Cited by 1,143 · cited 1×
“On the basis of these results, which are in agreement with previous findings [23,24], we performed quantile normalisation of intensity values for all samples in this study.”
Result
Cited by
Sorted by citations
DunedinPACE, a DNA methylation biomarker of the pace of aging
Belsky, D. W., Caspi, A., Corcoran, D. L., Sugden, K., Poulton, R., Arseneault, L., Baccarelli, A., Chamarti, K., Gao, X., Hannon, E., et al. (2022) · eLife · doi:10.7554/elife.73420 · Cited by 1,083
Epigenome-wide association study of body mass index, and the adverse outcomes of adiposity
Wahl, S., Drong, A., Lehne, B., Loh, M., Scott, W. R., Kunze, S., Tsai, P.-C., Ried, J. S., Zhang, W., Yang, Y., et al. (2017) · Nature · doi:10.1038/nature20784 · Cited by 945
Self-citationSeSAMe: reducing artifactual detection of DNA methylation by Infinium BeadChips in genomic deletions
Zhou, W., Triche, T. J., Laird, P. W., & Shen, H. (2018) · Nucleic Acids Research · doi:10.1093/nar/gky691 · Cited by 536
Chambers, J. C., Loh, M. C. S., Lehne, B. C., Drong, A., Kriebel, J., Motta, V., Wahl, S., Elliott, H. R., Rota, F., Scott, W. R., et al. (2015) · The Lancet Diabetes & Endocrinology · doi:10.1016/s2213-8587(15)00127-8 · Cited by 526
Self-citationHiggins-Chen, A. T., Thrush, K. L., Wang, Y., Minteer, C. J., Kuo, P.-L., Wang, M., Niimi, P., Sturm, G., Lin, J., Moore, A. Z., et al. (2022) · Nature Aging · doi:10.1038/s43587-022-00248-2 · Cited by 502
the BIOS Consortium, van Iterson, M., van Zwet, E. W., & Heijmans, B. T. (2017) · Genome biology · doi:10.1186/s13059-016-1131-9 · Cited by 421
DNA methylation signatures in peripheral blood strongly predict all-cause mortality
Zhang, Y., Wilson, R., Heiss, J., Breitling, L. P., Saum, K.-U., Schöttker, B., Holleczek, B., Waldenberger, M., Peters, A., & Brenner, H. (2017) · Nature Communications · doi:10.1038/ncomms14617 · Cited by 382
Kato, N., GRAMplusCD, C., Study, L. C., Loh, M. C. S., Takeuchi, F., Verweij, N., Wang, X., Zhang, W., Kelly, T. N., Saleheen, D., et al. (2015) · Nature Genetics · doi:10.1038/ng.3405 · Cited by 367
Self-citationGuidance for DNA methylation studies: statistical insights from the Illumina EPIC array
Mansell, G., Gorrie-Stone, T. J., Bao, Y., Kumari, M., Schalkwyk, L. S., Mill, J., & Hannon, E. (2019) · BMC Genomics · doi:10.1186/s12864-019-5761-7 · Cited by 340
Meffil: efficient normalization and analysis of very large DNA methylation datasets
Min, J. L., Hemani, G., Smith, G. D., Relton, C. L., & Suderman, M. J. (2018) · Bioinformatics · doi:10.1093/bioinformatics/bty476 · Cited by 322
Lehne, B. C., Drong, A., Loh, M. C. S., Zhang, W., Scott, W. R., Tan, S.-T., Afzal, U., Schulz, R., Scott, J., Järvelin, M., et al. (2016) · Genome biology · doi:10.1186/s13059-016-0934-z · Cited by 284
Self-citationGasparoni, G., Bultmann, S., Lutsik, P., Kraus, T. F. J., Sordon, S., Vlcek, J., Dietinger, V., Steinmaurer, M., Haider, M., Mulholland, C. B., et al. (2018) · Epigenetics & Chromatin · doi:10.1186/s13072-018-0211-3 · Cited by 229
Wright, D. J., Day, F. R., Kerrison, N. D., Zink, F., Cardona, A., Sulem, P., Thompson, D. J., Sigurjónsdóttir, S., Gudbjartsson, D. F., Helgason, A., et al. (2017) · Nature Genetics · doi:10.1038/ng.3821 · Cited by 227
Blood Epigenetic Age may Predict Cancer Incidence and Mortality
Zheng, Y., Joyce, B. T., Colicino, E., Liu, L., Zhang, W., Dai, Q., Shrubsole, M. J., Kibbe, W. A., Gao, T., Zhang, Z., et al. (2016) · EBioMedicine · doi:10.1016/j.ebiom.2016.02.008 · Cited by 218
Self-citationWaziry, R., Ryan, C. P., Corcoran, D. L., Huffman, K. M., Kobor, M. S., Kothari, M., Graf, G. H., Kraus, V. B., Kraus, W. E., Lin, D. T. S., et al. (2023) · Nature Aging · doi:10.1038/s43587-022-00357-y · Cited by 217
Causality-enriched epigenetic age uncouples damage and adaptation
Ying, K., Liu, H., Tarkhov, A. E., Sadler, M. C., Lu, A. T.-H., Moqri, M., Horvath, S., Kutalik, Z., Shen, X., & Gladyshev, V. N. (2024) · Nature Aging · doi:10.1038/s43587-023-00557-0 · Cited by 235
Faul, J. D., Kim, J. K., Levine, M. E., Thyagarajan, B., Weir, D. R., & Crimmins, E. M. (2023) · Proceedings of the National Academy of Sciences · doi:10.1073/pnas.2215840120 · Cited by 211
Epismoker: A Robust Classifier to Determine Smoking Status from DNA Methylation Data
Bollepalli, S., Korhonen, T., Kaprio, J. A., Ollikainen, M., & Anders, S. (2019) · Epigenomics · doi:10.2217/epi-2019-0206 · Cited by 164
Cell-type-specific resolution epigenetics without the need for cell sorting or single-cell biology
Rahmani, E., Schweiger, R., Rhead, B., Criswell, L. A., Barcellos, L. F., Eskin, E., Rosset, S., Sankararaman, S., & Halperin, E. (2019) · Nature Communications · doi:10.1038/s41467-019-11052-9 · Cited by 163
Mulder, R. H., Neumann, A., Cecil, C. A. M., Walton, E., Houtepen, L. C., Simpkin, A. J., Rijlaarsdam, J., Heijmans, B. T., Gaunt, T. R., Felix, J. F., et al. (2021) · Human Molecular Genetics · doi:10.1093/hmg/ddaa280 · Cited by 165
Cohort Profile: Pregnancy And Childhood Epigenetics (PACE) Consortium
Felix, J. F., Joubert, B. R., Baccarelli, A., Sharp, G. C., Almqvist, C., Annesi‐Maesano, I., Arshad, S. H., Baïz, N., Bakermans‐Kranenburg, M. J., Bakulski, K. M., et al. (2017) · International Journal of Epidemiology · doi:10.1093/ije/dyx190 · Cited by 154
Heiss, J. A., & Just, A. C. (2018) · Clinical Epigenetics · doi:10.1186/s13148-018-0504-1 · Cited by 152
Patterns of Reliability: Assessing the Reproducibility and Integrity of DNA Methylation Measurement
Sugden, K., Hannon, E. J., Arseneault, L., Belsky, D. W., Corcoran, D. L., Fisher, H. L., Houts, R. M., Kandaswamy, R., Moffitt, T. E., Poulton, R., et al. (2020) · Patterns · doi:10.1016/j.patter.2020.100014 · Cited by 151
Age-related DNA methylation changes are sex-specific: a comprehensive assessment
Yusipov, I., Bacalini, M. G., Kalyakulina, A., Krivonosov, M., Pirazzini, C., Gensous, N., Ravaioli, F., Milazzo, M., Giuliani, C., Vedunova, M., et al. (2020) · Aging · doi:10.18632/aging.202251 · Cited by 148
Cardona, A., Day, F. R., Perry, J. R. B., Loh, M. C. S., Chu, A. Y., Lehne, B. C., Paul, D. S., Lotta, L. A., Stewart, I. D., Kerrison, N. D., et al. (2019) · Diabetes · doi:10.2337/db18-0290 · Cited by 129
Self-citationRefining epigenetic prediction of chronological and biological age
Bernabeu, E., McCartney, D. L., Gadd, D. A., Hillary, R. F., Lu, A. T.-H., Murphy, L., Wrobel, N., Campbell, A., Harris, S. E., Liewald, D. C. M., et al. (2023) · Genome Medicine · doi:10.1186/s13073-023-01161-y · Cited by 130
DNA methylation links prenatal smoking exposure to later life health outcomes in offspring
Wiklund, P., Karhunen, V., Richmond, R. C., Parmar, P., Rodriguez, A., De Silva, M., Wielscher, M., Rezwan, F. I., Richardson, T. G., Veijola, J., et al. (2019) · Clinical Epigenetics · doi:10.1186/s13148-019-0683-4 · Cited by 120
Lichtenfels, A. J. D. F. C., van der Plaat, D. A., de Jong, K., van Diemen, C. C., Postma, D. S., Nedeljkovic, I., van Duijn, C. M., Amin, N., Gemert, S. L. B., de Vries, M., et al. (2018) · Environmental Health Perspectives · doi:10.1289/ehp2045 · Cited by 121
Translational Perspective on Epigenetics in Cardiovascular Disease
van der Harst, P., Windt, L. J. D., & Chambers, J. C. (2017) · Journal of the American College of Cardiology · doi:10.1016/j.jacc.2017.05.067 · Cited by 118
Self-citationAdjusting for Batch Effects in DNA Methylation Microarray Data, a Lesson Learned
Price, E. M., & Robinson, W. P. (2018) · Frontiers in Genetics · doi:10.3389/fgene.2018.00083 · Cited by 117
The early-life exposome and epigenetic age acceleration in children
de Prado-Bert, P., Ruiz-Arenas, C., Vives-Usano, M., Andrušaitytė, S., Cadiou, S., Carracedo, Á., Casas, M., Chatzi, L., Dadvand, P., González, J. R., et al. (2021) · Environment International · doi:10.1016/j.envint.2021.106683 · Cited by 120
Zhao, W., Ammous, F., Ratliff, S., Liu, J., Yu, M., Mosley, T. H., Kardia, S. L. R., & Smith, J. A. (2019) · International Journal of Environmental Research and Public Health · doi:10.3390/ijerph16173141 · Cited by 113
Nakatochi, M., Ichihara, S., Yamamoto, K., Naruse, K., Yokota, S., Asano, H., Matsubara, T., & Yokota, M. (2017) · Clinical Epigenetics · doi:10.1186/s13148-017-0353-3 · Cited by 109
EWAS Data Hub: a resource of DNA methylation array data and metadata
Xiong, Z., Li, M., Yang, F., Ma, Y., Sang, J., Li, R., Li, Z., Zhang, Z., & Bào, Y. (2019) · Nucleic Acids Research · doi:10.1093/nar/gkz840 · Cited by 106
Ammous, F., Zhao, W., Ratliff, S. M., Mosley, T. H., Bielak, L. F., Zhou, X., Peyser, P. A., Kardia, S. L. R., & Smith, J. A. (2021) · Clinical Epigenetics · doi:10.1186/s13148-021-01035-3 · Cited by 106
Identification of rare de novo epigenetic variations in congenital disorders
Barbosa, M., Joshi, R. S., Garg, P., Martin-Trujillo, A., Patel, N., Jadhav, B., Watson, C. T., Gibson, W. T., Chetnik, K., Tessereau, C., et al. (2018) · Nature Communications · doi:10.1038/s41467-018-04540-x · Cited by 101
Zhou, L., Ng, H. K., Drautz‐Moses, D. I., Schuster, S. C., Beck, S., Kim, C., Chambers, J. C., & Loh, M. C. S. (2019) · Scientific Reports · doi:10.1038/s41598-019-46875-5 · Cited by 104
Self-citationEpigenome-wide differential DNA methylation between HIV-infected and uninfected individuals
Zhang, X., Justice, A. C., Hu, Y., Wang, Z., Zhao, H., Wang, G., Johnson, E. O., Emu, B., Sutton, R. E., Krystal, J. H., et al. (2016) · Epigenetics · doi:10.1080/15592294.2016.1221569 · Cited by 98
Hop, P. J., Zwamborn, R. A. J., Hannon, E. J., Shireby, G. L., Nabais, M. F., Walker, E., van Rheenen, W., van Vugt, J. J. F. A., Dekker, A. M., Westeneng, H., et al. (2022) · Science Translational Medicine · doi:10.1126/scitranslmed.abj0264 · Cited by 103
Wilson, R., Wahl, S., Pfeiffer, L., Ward-Caviness, C. K., Kunze, S., Kretschmer, A., Reischl, E., Peters, A., Gieger, C., & Waldenberger, M. (2017) · BMC Genomics · doi:10.1186/s12864-017-4198-0 · Cited by 98
New targeted approaches for epigenetic age predictions
Han, Y., Franzen, J., Stiehl, T., Gobs, M., Kuo, C., Nikolić, M., Hapala, J., Koop, B. E., Strathmann, K., Ritz‐Timme, S., et al. (2020) · BMC Biology · doi:10.1186/s12915-020-00807-2 · Cited by 96
Eze, I. C., Jeong, A., Schaffner, E., Rezwan, F. I., Ghantous, A., Foraster, M., Vienneau, D., Kronenberg, F., Herceg, Z., Vineis, P., et al. (2020) · Environmental Health Perspectives · doi:10.1289/ehp6174 · Cited by 89
Dugué, P., Wilson, R., Lehne, B. C., Jayasekara, H., Wang, X., Jung, C., Joo, J. E., Makalic, E., Schmidt, D. F., Baglietto, L., et al. (2019) · Addiction Biology · doi:10.1111/adb.12855 · Cited by 92
Self-citationRzehak, P., Saffery, R., Reischl, E., Covic, M., Wahl, S., Grote, V., Xhonneux, A., Langhendries, J., Ferré, N., Closa‐Monasterolo, R., et al. (2016) · PLoS ONE · doi:10.1371/journal.pone.0155554 · Cited by 93
An Epigenome-Wide Association Study of Obesity-Related Traits
Dhana, K., Braun, K. V. E., Nano, J., Voortman, T., Demerath, E. W., Guan, W., Fornage, M., van Meurs, J. B. J., Uitterlinden, A. G., Albert Hofman, D., et al. (2018) · American Journal of Epidemiology · doi:10.1093/aje/kwy025 · Cited by 92
Occupational exposure to pesticides is associated with differential DNA methylation
van der Plaat, D. A., de Jong, K., de Vries, M., van Diemen, C. C., Nedeljković, I., Amin, N., Kromhout, H., Vermeulen, R. C. H., Postma, D. S., van Duijn, C. M., et al. (2018) · Occupational and Environmental Medicine · doi:10.1136/oemed-2017-104787 · Cited by 87
Schulz, H., Ruppert, A., Herms, S., Wolf, C., Mirza‐Schreiber, N., Stegle, O., Czamara, D., Forstner, A. J., Sivalingam, S., Schoch, S., et al. (2017) · Nature Communications · doi:10.1038/s41467-017-01818-4 · Cited by 81
Novel DNA methylation signatures of tobacco smoking with trans-ethnic effects
Christiansen, C., Fernandez, J. C., Domingo‐Relloso, A., Zhao, W., Moustafa, J. S. E.-S., Tsai, P.-C., Maddock, J., Haack, K., Cole, S. A., Kardia, S. L. R., et al. (2021) · Clinical Epigenetics · doi:10.1186/s13148-021-01018-4 · Cited by 83
The early care environment and DNA methylome variation in childhood
Garg, E., Chen, L., Nguyen, T. T. T., Pokhvisneva, I., Chen, L. M., Unternaehrer, E., MacIsaac, J. L., McEwen, L. M., Mah, S. M., Gaudreau, H., et al. (2018) · Development and Psychopathology · doi:10.1017/s0954579418000627 · Cited by 82
Rzehak, P., Covic, M., Saffery, R., Reischl, E., Wahl, S., Grote, V., Weber, M., Xhonneux, A., Langhendries, J., Ferré, N., et al. (2017) · Scientific Reports · doi:10.1038/s41598-017-13099-4 · Cited by 82
Huang, Y., Ollikainen, M., Muniandy, M., Zhang, T., van Dongen, J., Hao, G., van der Most, P. J., Pan, Y., Pervjakova, N., Sun, Y. V., et al. (2020) · Hypertension · doi:10.1161/hypertensionaha.120.14973 · Cited by 73
Heiss, J. A., & Just, A. C. (2019) · Clinical Epigenetics · doi:10.1186/s13148-019-0615-3 · Cited by 77
Westerman, K. E., Sebastiani, P., Jacques, P. F., Liu, S., DeMeo, D. L., & Ordovás, J. M. (2019) · Clinical Epigenetics · doi:10.1186/s13148-019-0705-2 · Cited by 81
Meta-analyses identify DNA methylation associated with kidney function and damage
Schlosser, P., Tin, A., Matías‐García, P. R., Thio, C. H. L., Joehanes, R., Liu, H., Weihs, A., Yu, Z., Hoppmann, A., Grundner-Culemann, F., et al. (2021) · Nature Communications · doi:10.1038/s41467-021-27234-3 · Cited by 77
Self-citationCárdenas, A., Faleschini, S., Hidalgo, A. P. C., Rifas‐Shiman, S. L., Baccarelli, A., DeMeo, D. L., Litonjua, A. A., Neumann, A., Felix, J. F., Jaddoe, V. W. V., et al. (2019) · Clinical Epigenetics · doi:10.1186/s13148-019-0653-x · Cited by 74
Mandaviya, P. R., Joehanes, R., Brody, J. A., Fernandez, J. C., Dekkers, K. F., Do, A. N., Graff, M., Hänninen, I. K., Tanaka, T., de Jonge, E. A., et al. (2019) · American Journal of Clinical Nutrition · doi:10.1093/ajcn/nqz031 · Cited by 76
Uncovering genetic mechanisms of hypertension through multi-omic analysis of the kidney
Eales, J., Jiang, X., Xu, X., Saluja, S., Akbarov, A., Cano-Gamez, E., McNulty, M. T., Finan, C., Guo, H., Wystrychowski, W., et al. (2021) · Nature Genetics · doi:10.1038/s41588-021-00835-w · Cited by 73
den Dekker, H. T., Burrows, K., Felix, J. F., Salas, L. A., Nedeljkovic, I., Yao, J., Rifas‐Shiman, S. L., Ruiz-Arenas, C., Amin, N., Bustamante, M., et al. (2019) · European Respiratory Journal · doi:10.1183/13993003.01795-2018 · Cited by 74
Ruiz-Arenas, C., Hernandéz-Ferrer, C., Vives-Usano, M., Marí, S., Quintela, I., Mason, D., Cadiou, S., Casas, M., Andrušaitytė, S., Gützkow, K. B., et al. (2022) · eLife · doi:10.7554/elife.65310 · Cited by 70
Garg, P., Joshi, R. S., Watson, C. T., & Sharp, A. J. (2018) · PLoS Genetics · doi:10.1371/journal.pgen.1007707 · Cited by 73
O’Donnell, K. J., Chen, L., MacIsaac, J. L., McEwen, L. M., Nguyen, T. T. T., Beckmann, K., Zhu, Y., Chen, L. R., Jeanne Brooks-gunn, B., Goldman, D. A., et al. (2018) · Translational Psychiatry · doi:10.1038/s41398-017-0063-9 · Cited by 67
CoMeBack: DNA methylation array data analysis for co-methylated regions
Gatev, E., Gladish, N., Mostafavi, S., & Kobor, M. S. (2020) · Bioinformatics · doi:10.1093/bioinformatics/btaa049 · Cited by 66
Identical twins carry a persistent epigenetic signature of early genome programming
van Dongen, J., Gordon, S. D., McRae, A. F., Odintsova, V. V., Mbarek, H., Breeze, C. E., Sugden, K., Lundgren, S., Fernandez, J. C., Hannon, E. J., et al. (2021) · Nature Communications · doi:10.1038/s41467-021-25583-7 · Cited by 64
Luo, Q., Dwaraka, V. B., Chen, Q., Tong, H., Zhu, T., Seale, K., Raffaele, J. M., Zheng, S., Mendez, T. L., Chen, Y., et al. (2023) · Genome Medicine · doi:10.1186/s13073-023-01211-5 · Cited by 62
Changes in DNA methylation from pre- to post-adolescence are associated with pubertal exposures
Han, L., Zhang, H., Kaushal, A., Rezwan, F. I., Kadalayil, L., Karmaus, W., Henderson, A. J., Relton, C. L., Ring, S. M., Arshad, S. H., et al. (2019) · Clinical Epigenetics · doi:10.1186/s13148-019-0780-4 · Cited by 65
Zhang, X., Hu, Y., Aouizerat, B. E., Peng, G., Marconi, V. C., Corley, M. J., Hulgan, T., BRYANT, K. J., Zhao, H., Krystal, J. H., et al. (2018) · Clinical Epigenetics · doi:10.1186/s13148-018-0591-z · Cited by 60
Agreement in DNA methylation levels from the Illumina 450K array across batches, tissues, and time
Forest, M., O’Donnell, K. J., Voisin, G., Gaudreau, H., MacIsaac, J. L., McEwen, L. M., Silveira, P. P., Steiner, M. S., Kobor, M. S., Meaney, M. J., et al. (2018) · Epigenetics · doi:10.1080/15592294.2017.1411443 · Cited by 57
Rahmani, E., Schweiger, R., Shenhav, L., Wingert, T., Hofer, I. S., Gabel, E., Eskin, E., & Halperin, E. (2018) · Genome biology · doi:10.1186/s13059-018-1513-2 · Cited by 57
Xu, K., Zhang, X., Wang, Z., Hu, Y., & Sinha, R. (2016) · Biological Psychology · doi:10.1016/j.biopsycho.2016.11.001 · Cited by 61
Gupta, R., van Dongen, J., Fu, Y., Abdellaoui, A., Tyndale, R. F., Velagapudi, V., Boomsma, D. I., Korhonen, T., Kaprio, J. A., Loukola, A., et al. (2019) · Clinical Epigenetics · doi:10.1186/s13148-018-0606-9 · Cited by 59
Chan, R. F., Turecki, G., Shabalin, A. A., Guintivano, J., Zhao, M., Xie, L. Y., van Grootheest, G., Kaminsky, Z. A., Dean, B., Penninx, B. W. J. H., et al. (2019) · Biological Psychiatry · doi:10.1016/j.biopsych.2019.10.014 · Cited by 61
Peng, C., van Meel, E. R., Cárdenas, A., Rifas‐Shiman, S. L., Sonawane, A. R., Glass, K., Gold, D. R., Platts‐Mills, T. A. E., Lin, X., Oken, E., et al. (2019) · Epigenetics · doi:10.1080/15592294.2019.1590085 · Cited by 56
Sherwood, W. B., Bion, V., Lockett, G. A., Ziyab, A. H., Soto-Ramírez, N., Mukherjee, N., Kurukulaaratchy, R. J., Ewart, S., Zhang, H., Arshad, S. H., et al. (2019) · Clinical Epigenetics · doi:10.1186/s13148-019-0727-9 · Cited by 58
Wang, X., Pan, Y., Zhu, H., Hao, G., Huang, Y., Barnes, V. A., Shi, H., Snieder, H., Pankow, J. S., North, K. E., et al. (2018) · Clinical Epigenetics · doi:10.1186/s13148-017-0435-2 · Cited by 53
DNA Methylation Trajectories During Pregnancy
Gruzieva, O., Merid, S. K., Chen, S., Mukherjee, N., Hedman, A. M., Almqvist, C., Andolf, E. G., Jiang, Y., Kere, J., Scheynius, A., et al. (2019) · Epigenetics Insights · doi:10.1177/2516865719867090 · Cited by 51
An epigenome-wide association study of metabolic syndrome and its components
Nuotio, M.-L., Pervjakova, N., Joensuu, A., Karhunen, V., Hiekkalinna, T., Milani, L. A., Kettunen, J., Järvelin, M., Jousilahti, P., Metspalu, A., et al. (2020) · Scientific Reports · doi:10.1038/s41598-020-77506-z · Cited by 52
DunedinPACE: A DNA methylation biomarker of the Pace of AgingPreprint
Belsky, D. W., Caspi, A., Corcoran, D. L., Sugden, K., Poulton, R., Arseneault, L., Baccarelli, A., Chamarti, K., Gao, X., Hannon, E. J., et al. (2021) · medRxiv · doi:10.1101/2021.08.30.21262858 · Cited by 52
Variability of multi-omics profiles in a population-based child cohort
Gallego-Paüls, M., Hernandéz-Ferrer, C., Bustamante, M., Basagaña, X., Barrera‐Gómez, J., Lau, C. E., Siskos, A., Vives-Usano, M., Ruiz-Arenas, C., Wright, J., et al. (2021) · BMC Medicine · doi:10.1186/s12916-021-02027-z · Cited by 50
Hillary, R. F., Ng, H. K., McCartney, D. L., Elliott, H. R., Walker, R. M., Campbell, A., Huang, F., Direk, K., Welsh, P. I., Sattar, N. A., et al. (2024) · Cell Genomics · doi:10.1016/j.xgen.2024.100544 · Cited by 50
Self-citationHeinrich, H., Grunitz, J., Stonawski, V., Frey, S., Wahl, S., Albrecht, B., Goecke, T. W., Beckmann, M. W., Kornhuber, J., Fasching, P. A., et al. (2017) · Scientific Reports · doi:10.1038/s41598-017-03326-3 · Cited by 51
Comparative epigenome analysis using Infinium DNA methylation BeadChips
Ding, W., Kaur, D., Horvath, S., & Zhou, W. (2022) · Briefings in Bioinformatics · doi:10.1093/bib/bbac617 · Cited by 48
Margolin, G., Petrykowska, H. M., Jameel, N., Bell, D. W., Young, A., & Elnitski, L. L. (2016) · Journal of Molecular Diagnostics · doi:10.1016/j.jmoldx.2015.11.004 · Cited by 45
DNA methylation signatures of illicit drug injection and hepatitis C are associated with HIV frailty
Zhang, X., Hu, Y., Justice, A. C., Li, B., Wang, Z., Zhao, H., Krystal, J. H., & Xu, K. (2017) · Nature Communications · doi:10.1038/s41467-017-02326-1 · Cited by 44
Association between depression and epigenetic age acceleration: A co‐twin control study
Liu, C., Wang, Z., Hui, Q., Goldberg, J. H., Smith, N. L., Shah, A. J., Murrah, N. V., Shallenberger, L. H., Diggers, E., Bremner, J. D., et al. (2022) · Depression and Anxiety · doi:10.1002/da.23279 · Cited by 42
Integrative genomic analyses in adipocytes implicate DNA methylation in human obesity and diabetes
McAllan, L., Baranas̆ić, D., Villicaña, S., Brown, S., Zhang, W., Lehne, B. C., Adamo, M., Jenkinson, A. D., Elkalaawy, M., Mohammadi, B., et al. (2023) · Nature Communications · doi:10.1038/s41467-023-38439-z · Cited by 48
Self-citationVarshavsky, M., Harari, G., Gläser, B., Dor, Y., Shemer, R., & Kaplan, T. (2023) · Cell Reports Methods · doi:10.1016/j.crmeth.2023.100567 · Cited by 46
Whyte, J., Ellis, J. J., Brown, M. A., & Kenna, T. (2019) · Arthritis Research & Therapy · doi:10.1186/s13075-019-1922-y · Cited by 43
Differential DNA methylation in bronchial biopsies between persistent asthma and asthma in remission
Vermeulen, C. J., Xu, C., Vonk, J. M., ten Hacken, N. H. T., Timens, W., Heijink, I. H., Nawijn, M. C., Boekhoudt, J., van Oosterhout, A. J. M., Affleck, K., et al. (2019) · European Respiratory Journal · doi:10.1183/13993003.01280-2019 · Cited by 43
Cross‐tissue comparison of epigenetic aging clocks in humans
Apsley, A. T., Ye, Q., Caspi, A., Chiaro, C. R., Etzel, L. C., Hastings, W. J., Heim, C. C., Kozlosky, J. T., Noll, J. G., Schreier, H. M. C., et al. (2025) · Aging Cell · doi:10.1111/acel.14451 · Cited by 44
von Both, U., Berk, M., Agapow, P., Wright, J. D., Git, A., Hamilton, M. S., Goldgof, G. M., Siddiqui, N., Bellos, E., Wright, V., et al. (2018) · Scientific Reports · doi:10.1038/s41598-017-18528-y · Cited by 43
IgG glycosylation and DNA methylation are interconnected with smoking
Wahl, A., Kasela, S., Carnero‐Montoro, E., van Iterson, M., Štambuk, J., Sharma, S., van den Akker, E. B., Klarić, L., Benedetti, E., Razdorov, G., et al. (2017) · Biochimica et Biophysica Acta (BBA) - General Subjects · doi:10.1016/j.bbagen.2017.10.012 · Cited by 39
Makrinou, E., Drong, A., Christopoulos, G., Lerner, A., Chapa-Chorda, I., Karaderi, T., Lavery, S. A., Hardy, K., Lindgren, C. M., & Franks, S. (2019) · Molecular and Cellular Endocrinology · doi:10.1016/j.mce.2019.110611 · Cited by 45
Self-citationSmith, J. A., Raisky, J., Ratliff, S. M., Liu, J., Kardia, S. L. R., Turner, S. T., Mosley, T. H., & Zhao, W. (2019) · BMC Medical Genomics · doi:10.1186/s12920-019-0585-5 · Cited by 43
In utero and childhood exposure to tobacco smoke and multi-layer molecular signatures in children
Vives-Usano, M., Hernandéz-Ferrer, C., Maître, L., Ruiz-Arenas, C., Andrušaitytė, S., Borràs, E., Carracedo, Á., Casas, M., Chatzi, L., Coen, M., et al. (2020) · BMC Medicine · doi:10.1186/s12916-020-01686-8 · Cited by 41
Miller, B., Petrykowska, H. M., & Elnitski, L. L. (2021) · Scientific Reports · doi:10.1038/s41598-020-80345-7 · Cited by 42
Multi-omics signatures of alcohol use disorder in the dorsal and ventral striatum
Zillich, L., Poisel, E., Frank, J., Foo, J. C., Friske, M. M., Streit, F., Sirignano, L., Heilmann‐Heimbach, S., Heimbach, A., Hoffmann, P., et al. (2022) · Translational Psychiatry · doi:10.1038/s41398-022-01959-1 · Cited by 39
DNA methylation and allergic sensitizations: A genome‐scale longitudinal study during adolescence
Zhang, H., Kaushal, A., Merid, S. K., Melén, E., Pershagen, G., Rezwan, F. I., Han, L., Ewart, S., Arshad, S. H., Karmaus, W., et al. (2019) · Allergy · doi:10.1111/all.13746 · Cited by 39
Gatev, E., Inkster, A. M., Negri, G. L., Konwar, C., Lussier, A. A., Skakkebaek, A. H., Sokolowski, M. B., Gravholt, C. H., Dunn, E. C., Kobor, M. S., et al. (2021) · Nucleic Acids Research · doi:10.1093/nar/gkab682 · Cited by 41
Oriol-Tordera, B., Berdasco, M., Llano, A., Mothe, B., Gálvez, C., Martínez‐Picado, J., Carrillo, J., Blanco, J., Duran-Castells, C., Ganoza, C., et al. (2020) · PLoS Pathogens · doi:10.1371/journal.ppat.1008678 · Cited by 39
Epigenome-wide association study of alcohol use disorder in five brain regions
Zillich, L., Frank, J., Streit, F., Friske, M. M., Foo, J. C., Sirignano, L., Heilmann-Heimbach, S., Dukal, H., Degenhardt, F., Hoffmann, P., et al. (2022) · Neuropsychopharmacology · doi:10.1038/s41386-021-01228-7 · Cited by 36
Metadata
- Authors
- Lehne, B., Drong, A. W., Loh, M., Zhang, W., Scott, W. R., Tan, S.-T., Afzal, U., Scott, J., Jarvelin, M.-R., Elliott, P., McCarthy, M. I., Kooner, J. S., & Chambers, J. C.
- Affiliations
- Imperial College London (GB)
- Centre for Human Genetics (GB)
- Ealing Hospital NHS Trust (GB)
- MRC Centre for Environment and Health (GB)
- Imperial College Healthcare NHS Trust (GB)
- Corresponding author
- Lehne, Benjamin
- Chambers, John C
- ORCID
- Venue
- Genome biology
- Published
- 2015-02-15
- Volume
- 16
- Issue
- 1
- Pages
- 37-37
- ISSN
- 1465-6906 (ISSN-L)
- 1474-760X
- PMC
- PMC4365767
- OpenAlex
- W4297674379
- Cited by
- 380
- References
- 31
- Citations by year
- 2026: 22 · 2025: 40 · 2024: 42 · 2023: 43 · 2022: 43 · 2021: 54 · 2020: 43 · 2019: 36 · 2018: 26 · 2017: 16 · 2016: 12 · 2015: 2
- FWCI
- 8.11
- Type
- journal article
- Language
- en
- Update notices
- correction (2016-04-21)
- Open access
- gold
- doi.org
- Locations
- Genome biology (publishedVersion, cc-by)
- PubMed Central (publishedVersion, cc-by)
- PubMed (publishedVersion)
- Research Portal (King's College London) (submittedVersion, cc-by)
- Spiral (Imperial College London) (submittedVersion, other-oa)
- Spiral (Imperial College London) (submittedVersion, cc-by-nc-nd)
- STM:n Hallinnonalan avoin julkaisuarkisto (Julkari) (submittedVersion)
- Funders
- Wellcome Trust (10371, 084723/Z/08/Z, 090532, 090532/Z/09/Z, 090532/Z/09/)
- National Institute for Health Research Health Protection Research Unit
- National Institute for Health and Care Research (NF-SI-0611-10136, RP-PG-0407-10371)
- British Heart Foundation (090532/Z/09/Z, SP/04/002)
- Imperial College London
- Imperial College Healthcare NHS Trust
- European Commission (279143)
- MRC-PHE Centre for Environment and Health
- Medical Research Council (G0900747 91070, Hub grant G0900747 91070, MR/L01341X/1, MR/K002414/1, G0601966, G0700931)
- Topics
- Life Sciences › Biochemistry, Genetics and Molecular Biology › Molecular Biology › Epigenetics and DNA Methylation
- Life Sciences › Biochemistry, Genetics and Molecular Biology › Genetics › Genetic Associations and Epidemiology
- Life Sciences › Biochemistry, Genetics and Molecular Biology › Molecular Biology › Gene expression and cancer classification
- Keywords
- DNA methylation, epigenome-wide association study, data quality control, data normalization, batch effect correction, permutation tests, null hypothesis, methylation quantitative trait loci, data analysis pipeline
- MeSH terms
- Humans, Software, Genome, Human, CpG Islands, DNA Methylation, Oligonucleotide Array Sequence Analysis, Quantitative Trait Loci, Epigenesis, Genetic, Genome-Wide Association Study, Epigenomics
About these checks
Registry, retraction, Cites and statistics results are computed, not judged, with one exception: a printed reference that no index lists is read once by a model before it counts as a citation error. Claims are extracted by a model and kept only when their quote appears verbatim in the text; each cited source is then checked, with a model’s help, for whether it says what the claim relies on. Those verdicts can be wrong — read the claim’s quote and the cited source before relying on one.
Statistics and arithmetic are recomputed, not judged.
Confidence bands are shown only for fields calibrated on our annotated test set. None is calibrated yet, so no band is shown.
What counts as a claim ›How we measure confidence ›How we check this ›
Are you an author, or do you see a problem with this page? Request a review
