

The DOI matches its Crossref record; 223 of the 224 references it cites were found in a registry or an index.
DNA methylation aging clocks: challenges and recommendations
Open accessAbstract
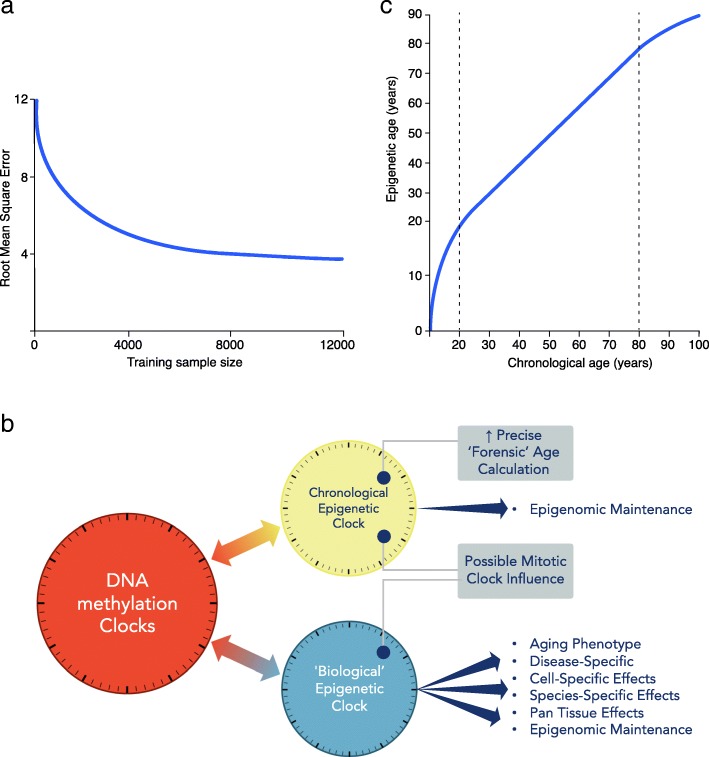
Epigenetic clocks comprise a set of CpG sites whose DNA methylation levels measure subject age. These clocks are acknowledged as a highly accurate molecular correlate of chronological age in humans and other vertebrates. Also, extensive research is aimed at their potential to quantify biological aging rates and test longevity or rejuvenating interventions. Here, we discuss key challenges to understand clock mechanisms and biomarker utility. This requires dissecting the drivers and regulators of age-related changes in single-cell, tissue- and disease-specific models, as well as exploring other epigenomic marks, longitudinal and diverse population studies, and non-human models. We also highlight important ethical issues in forensic age determination and predicting the trajectory of biological aging in an individual.
Overview
The claims and statistics of this paper haven’t been checked yet.
Run the check — free, no account needed. It reads the open-access text and checks the sources it cites.
Integrity signals
Registry
Cites
Statistics
Figures
Verification
Claims the paper makes
The claims and statistics of this paper haven’t been checked yet.
Run the check — free, no account needed. It reads the open-access text and checks the sources it cites.
Claims other papers make about this one
Each is checked against this paper’s own text: does it say what the citing paper says it does?
The cited source says what the claim attributes to it.
In the citing paper
“Nevertheless, these measures are acknowledged to be incomplete summaries of biological changes that occur with aging and to have technical limitations39,40.”
From Effect of long-term caloric restriction on DNA methylation measures of biological aging in healthy adults from the CALERIE trial (2023) · cites this paper as [39]
In the citing paper
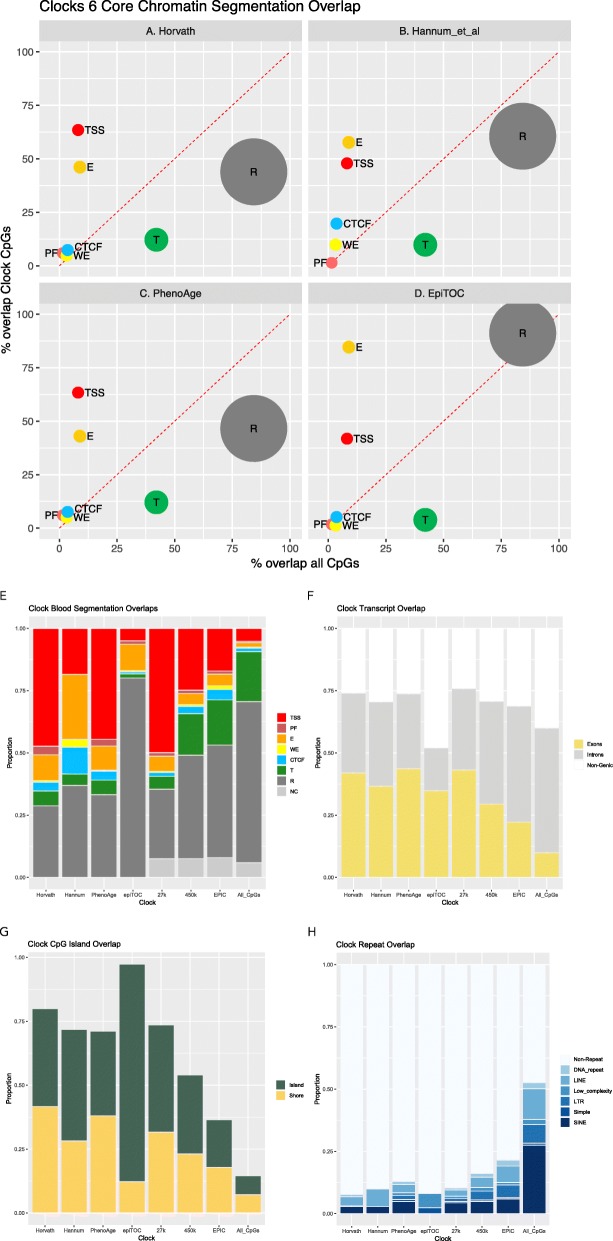
“Methylation levels in blood cells have been observed to correlate strongly with cell composition, which may be a result of changes in chromatin state with age148.”
From Measuring biological age using omics data (2022) · cites this paper as [148]
Self-check
Percentages, sums and reported differences re-computed from the paper’s own numbers.
The self-check needs the paper’s full text.
Citations
Cites
BEDTools: a flexible suite of utilities for comparing genomic features
Quinlan, A. R., & Hall, I. M. (2010) · Bioinformatics · doi:10.1093/bioinformatics/btq033 · Cited by 27,437
López-Otín, C., Blasco, M. A., Partridge, L., Serrano, M., & Kroemer, G. (2013) · Cell · doi:10.1016/j.cell.2013.05.039 · Cited by 14,982
DNA methylation age of human tissues and cell types
Horvath, S. (2013) · Genome Biology · doi:10.1186/gb-2013-14-10-r115 · Cited by 7,075
Self-citationAge-related clonal hematopoiesis associated with adverse outcomes
Jaiswal, S., Fontanillas, P., Flannick, J., Manning, A., Grauman, P. V., Mar, B. G., Lindsley, R. C., Mermel, C. H., Burtt, N., Chavez, A., et al. (2014) · New England Journal of Medicine · doi:10.1056/nejmoa1408617 · Cited by 4,841
GENCODE: The reference human genome annotation for The ENCODE Project
Harrow, J., Frankish, A., Gonzalez, J. M., Tapanari, E., Diekhans, M., Kokocinski, F., Aken, B. L., Barrell, D., Zadissa, A., Searle, S., et al. (2012) · Genome Research · doi:10.1101/gr.135350.111 · Cited by 4,585
Genome-wide methylation profiles reveal quantitative views of human aging rates
Hannum, G., Guinney, J., Zhao, L., Zhang, L., Hughes, G., Sadda, S., Klotzle, B., Bibikova, M., Fan, J.-B., Gao, Y., et al. (2013) · Molecular Cell · doi:10.1016/j.molcel.2012.10.016 · Cited by 4,270
Self-citationAn epigenetic biomarker of aging for lifespan and healthspan
Levine, M. E., Lu, A. T., Quach, A., Chen, B. H., Assimes, T. L., Bandinelli, S., Hou, L., Baccarelli, A. A., Stewart, J. D., Li, Y., et al. (2018) · Aging · doi:10.18632/aging.101414 · Cited by 3,675
Self-citationClonal hematopoiesis and blood-cancer risk inferred from blood DNA sequence
Genovese, G., Kähler, A. K., Handsaker, R. E., Lindberg, J., Rose, S. A., Bakhoum, S. F., Chambert, K., Mick, E., Neale, B. M., Fromer, M., et al. (2014) · New England Journal of Medicine · doi:10.1056/nejmoa1409405 · Cited by 3,531
DNA methylation-based biomarkers and the epigenetic clock theory of ageing
Horvath, S., & Raj, K. (2018) · Nature Reviews Genetics · doi:10.1038/s41576-018-0004-3 · Cited by 3,095
Self-citationBird, A. (2007) · Nature · doi:10.1038/nature05913 · Cited by 3,011
Research works printed but not linked: 2
- He W, Goodkind D, Kowal P. An aging world: 2015; 2016.
- Horvath S. Epigenetic clocks: from molecular pathways to anti-aging interventions. In: Epigenomics of Common Disease 2017. Hinxton, Cambridge; 2017. p. S73.
Cited by
Sorted by citations
Items 801–900 of 1,001
Ho, A. D., Holstein, T. W., & Häfner, H. (2022) · Schriften der Mathematisch-naturwissenschaftlichen Klasse · doi:10.1007/978-3-658-34859-5
A timely, user-friendly analysis of the mouse DNA methylome
Esteller, M. (2022) · Cell Genomics · doi:10.1016/j.xgen.2022.100153
Epigenomics of Type 2 Diabetes
Parveen, A. N., & Dhawan, B. S. (2022) · Royal Society of Chemistry eBooks · doi:10.1039/9781839165498-00053
ImAge: an imaging approach to quantitate aging and rejuvenationPreprint
Alvarez-Kuglen, M., Rodriguez, D., Qin, H., Ninomiya, K., Fiengo, L., Farhy, C., Hsu, W.-M., Havas, A. P., Feng, G., Roberts, A. J., et al. (2022) · bioRxiv (Cold Spring Harbor Laboratory) · doi:10.1101/2022.10.16.512441
Self-citationOmics approaches in aging research
Patnaik, P. K., Barlit, H., Shoushtari, S. I., & Labunskyy, V. M. (2023) · Elsevier eBooks · doi:10.1016/b978-0-12-823679-6.00016-3
Zhang, S., Duoji, Z., Yang, L., Qiangba, D., De, Y., Hu, X., Jiang, Z., Hou, D., Hu, Z., & Basang, Z. (2023) · Research Square · doi:10.21203/rs.3.rs-2469498/v1
Meena Kumari, B., Booker, C. L., & Chandola, T. (2023) · Springer eBooks · doi:10.1007/978-1-4614-6625-3_23-1
The Interface Between Healthy Aging, Longevity, and Disease
Katsagoni, C. N., Kokkinos, P. F., & Sidossis, L. S. (2023) · Wiley eBooks · doi:10.1002/9781119833475.ch8
Genetic, molecular, and cellular determinations of sex-specific cardiovascular traits
Vaura, F. C. (2023) · Elsevier eBooks · doi:10.1016/b978-0-12-823937-7.00020-1
AI for Longevity: Getting Past the Mechanical Turk Model Will Take Good Data
Peshkin, L., & Kriukov, D. (2023) · Healthy ageing and longevity · doi:10.1007/978-3-031-35176-1_13
Artificial intelligence and deep learning in molecular testing
Levy, J., & Vaickus, L. J. (2023) · Elsevier eBooks · doi:10.1016/b978-0-12-822824-1.00002-x
Editorial for “Prostate Age Gap: An MRI Surrogate Marker of Aging for Prostate Cancer Detection”
Zhang, X., & Zhang, Y. (2023) · Journal of Magnetic Resonance Imaging · doi:10.1002/jmri.29097
Sex differences in brain aging
Goyal, M. S., Gordon, B. A., & Resnick, S. M. (2024) · Elsevier eBooks · doi:10.1016/b978-0-12-820480-1.00090-5
Nwanaji‐Enwerem, J. C. (2024) · Oral Diseases · doi:10.1111/odi.14940
McCartney, D. L., Min, J. L., Richmond, R. C., Lu, A. T.-H., Sobczyk, M., Davies, G., Broer, L., Guo, X., Jeong, A., Jung, J., et al. (2021) · Figshare · doi:10.6084/m9.figshare.14880975
Self-citationHigham, J., Kerr, L., Zhang, Q., Walker, R. M., Harris, S. E., Howard, D. M., Hawkins, E. L., Sandu, A., Steele, J. D., Waiter, G. D., et al. (2022) · Figshare · doi:10.6084/m9.figshare.21351313
Additional file 2 of Characteristics of epigenetic aging across gestational and perinatal tissues
Dieckmann, L., Lahti‐Pulkkinen, M., Kvist, T., Lahti, J. M. T., DeWitt, P. E., Cruceanu, C., Laivuori, H. M., Sammallahti, S., Villa, P., Suomalainen‐König, S., et al. (2021) · Figshare · doi:10.6084/m9.figshare.14516125
Additional file 1 of Characteristics of epigenetic aging across gestational and perinatal tissues
Dieckmann, L., Lahti‐Pulkkinen, M., Kvist, T., Lahti, J. M. T., DeWitt, P. E., Cruceanu, C., Laivuori, H. M., Sammallahti, S., Villa, P., Suomalainen‐König, S., et al. (2021) · Figshare · doi:10.6084/m9.figshare.14516122
Additional file 9 of Characteristics of epigenetic aging across gestational and perinatal tissues
Dieckmann, L., Lahti‐Pulkkinen, M., Kvist, T., Lahti, J. M. T., DeWitt, P. E., Cruceanu, C., Laivuori, H. M., Sammallahti, S., Villa, P., Suomalainen‐König, S., et al. (2021) · Figshare · doi:10.6084/m9.figshare.14516146
Additional file 1 of Age-related promoter-switch regulates Runx1 expression in adult rat hearts
Song, J., Zhang, X., Lv, S., Liu, M., Hua, X., Yue, L., Wang, S., & He, W. (2023) · Figshare · doi:10.6084/m9.figshare.24522669
Partial Cell Reprogramming as a Method of Revitalizing Living Systems
Shorokhova, M. (2023) · Tsitologiya · doi:10.31857/s0041377123060093
Ghaderzadeh, S., & Caldwell, J. (2024) · Advances In Clinical And Medical Research · doi:10.52793/acmr.2024.5(2)-77
Cervera‐Juanes, R. P., Zimmerman, K. D., Wilhelm, L., Lowe, C. C., Gonzales, S., Carlson, T., Ferguson, B. M., & Grant, K. A. (2024) · Research Square · doi:10.21203/rs.3.rs-4254286/v1
Clark, A. L., Hamlin, A. M., Ortega, N., & Breton, J. (2024) · Elsevier eBooks · doi:10.1016/b978-0-12-820480-1.00181-9
Forensic epigenetics in the massively parallel sequencing era
Moraes, V. M. S., Carratto, T. M. T., da Silva, H. A. F., & Mendes‐Junior, C. T. (2024) · Elsevier eBooks · doi:10.1016/b978-0-443-23802-4.00010-7
Lux, V. (2024) · SpringerBriefs in psychology · doi:10.1007/978-3-031-55229-8_5
ПОНИМАНИЕ КОНЦЕПЦИИ ПЕРЕПРОГРАММИРОВАНИЯ ВОЗРАСТА
Жакупова, А. С., Turmukhambetova, A., Saliev, T. M., & Сингх, П. Б. (2023) · Фтизиопульмонология · doi:10.26212/2227-1937.2023.55.94.017
Guldner, I. H., & Wyss‐Coray, T. (2024) · Elsevier eBooks · doi:10.1016/b978-0-443-19041-4.00059-5
Abdelmageed, M., Palanisamy, P., Vernail, V. L., Silberman, Y., Paul, S., & Paul, A. (2024) · eLife · doi:10.7554/elife.101533.1
Epigenetic Aging and Risk of Obstructive Sleep Apnea: a bidirectional Mendelian randomization studyPreprint
Xu, C., Yang, G., & Liu, Y. (2024) · Research Square · doi:10.21203/rs.3.rs-5305378/v1
Cervera‐Juanes, R. P., Zimmerman, K. D., Wilhelm, L., Lowe, C. C., Gonzales, S. W., Carlson, T., HITZEMANN, R. J., Ferguson, B. M., & Grant, K. A. (2024) · Research Square · doi:10.21203/rs.3.rs-5406434/v1
Gonggrijp, B. M. A. (2025) · doi:10.5463/thesis.1050
Aging in Two Waves: New Insights into Health Risks at 44 and 60
Svanishvili, G. (2025) · Premier Journal of Genetics · doi:10.70389/pjg.100003
Spatial Insights in Cardiovascular Aging
Dai, Z., Ding, H., Zhang, Q., Fu, L., & Tai, S. (2025) · Aging and Disease · doi:10.14336/ad.2025.0272
Fisher Information and the Dynamics of Multicellular Ageing
Hale, Z. F., Cánez, G. A., & Michaels, T. C. T. (2025) · Entropy · doi:10.3390/e27060638
Husain, L. (2025) · Clinical and Translational Discovery · doi:10.1002/ctd2.70065
Controlling treatment toxicity in ovarian cancer to prime the patient for tumor extinction therapyPreprint
Gallagher, K., Sousa, R. S., Gatenbee, C., Schenck, R. O., Chen, P., Citak, T., Leither, S., Mazzacurati, L., Xella, A., Zhou, Z., et al. (2025) · bioRxiv (Cold Spring Harbor Laboratory) · doi:10.1101/2025.07.10.664235
Interplay between circadian rhythms and epigenetics in neural stem cells and Alzheimer’s disease
Alves, T. C., Musílek, K., & Monti, B. (2025) · Progress in Neurobiology · doi:10.1016/j.pneurobio.2025.102808
When Good Technology Goes Unnoticed: How Professional Incentive Systems Create Innovation ResistancePreprint
Dror, D. M. (2025) · SSRN Electronic Journal · doi:10.2139/ssrn.5399976
New DNA test that reveals a child’s true age has promise, but ethical pitfalls
Dupras, C., Kobor, M. S., & Lappé, M. D. (2020) · The Conversation · doi:10.64628/aam.n3drjj7dy
Gavaldà, M., Peña, R. R., Fanjul, F. J., Valera, J. L., Cosío, B. G., Sala, E., González‐Freire, M., & Riera, M. (2025) · Open Respiratory Archives · doi:10.1016/j.opresp.2025.100489
Caregiving stress and biological aging measured by epigenetic clocks: protocol for a scoping review
Lee, L. J., Son, E., Butera, G., Park, J., Hussain, T., & Wallen, G. R. (2025) · BMJ Open · doi:10.1136/bmjopen-2024-095895
Zhang, J., Cheng, X., Huang, C., Xu, Y., He, J., Xu, H., Tai, S., & Wei, Y. (2025) · BMC Cancer · doi:10.1186/s12885-025-14795-5
Patel, T., Schwarz, R. J., Riege, K., Varshavsky, M., Kestler, H. A., Kaplan, T., Hoffmann, S., & van Bömmel, A. (2025) · bioRxiv (Cold Spring Harbor Laboratory) · doi:10.1101/2025.10.07.680024
Epigenetic Age Prediction Remains Stable Across Common Variants and Diverse AncestriesPreprint
Sobahy, T. M., Huergo, E., Tegner, J. N., Lagani, V., & Gómez-Cabrero, D. (2025) · medRxiv · doi:10.1101/2025.10.26.25338818
Hermesdorf, M., Homann, J., Ernsting, J., Herrera-Rivero, M., Hahn, T., Lill, C. M., & Berger, K. (2025) · medRxiv · doi:10.1101/2025.11.09.25339844
The Association of Lipoic Acid Synthase ( LIAS ) Gene Methylation With Diabetic Kidney Disease
Feng, Z., Liu, T., Gao, P., Jiang, Y., Zhao, M., Liu, Y., Zhu, H., Li, M., Li, N., Kong, X., et al. (2025) · Journal of Diabetes Research · doi:10.1155/jdr/4342250
Aggressive Neuroblastomas Start Growing after InfancyPreprint
Monyak, D. L., Holloway, S. T., Gumbert, G. J., Kim, K. A., Fong, A., Grimm, L. J., Marks, J. R., Shibata, D. K., & Ryser, M. D. (2025) · bioRxiv (Cold Spring Harbor Laboratory) · doi:10.64898/2025.11.28.691194
Task-Aligned Foundation Models for Linking Imaging Features with DNA Methylation in Aging ResearchPreprint
Wang, J., Parayil, A. S., & Hariharan, R. (2025) · doi:10.36227/techrxiv.176539553.36816358/v1
Petersen, C. L., Christensen, B. C., & Batsis, J. A. (2021) · Figshare · doi:10.6084/m9.figshare.14150882
Self-citationAdditional file 5 of Characteristics of epigenetic aging across gestational and perinatal tissues
Dieckmann, L., Lahti‐Pulkkinen, M., Kvist, T., Lahti, J., DeWitt, P. E., Cruceanu, C., Laivuori, H., Sammallahti, S., Villa, P., Suomalainen‐König, S., et al. (2021) · Figshare · doi:10.6084/m9.figshare.14516134
Yang, Q., Gao, S., Lin, J., Lyu, K., Wu, Z., Chen, Y., Qiu, Y., Zhao, Y., Wang, W., Lin, T., et al. (2022) · Figshare · doi:10.6084/m9.figshare.21269332
Additional file 3 of Interrelationships and determinants of aging biomarkers in cord blood
Reimann, B., Martens, D. S., Wang, C., Ghantous, A., Herceg, Z., Plusquin, M., & Nawrot, T. S. (2022) · Figshare · doi:10.6084/m9.figshare.20462317
Levy, J. J., Titus, A. J., Petersen, C. L., Chen, Y., Salas, L. A., & Christensen, B. C. (2020) · Figshare · doi:10.6084/m9.figshare.11999295
Self-citationMcCartney, D. L., Min, J. L., Richmond, R. C., Lu, A. T., Sobczyk, M. K., Davies, G., Broer, L., Guo, X., Jeong, A., Jung, J., et al. (2021) · Figshare · doi:10.6084/m9.figshare.14880993
Self-citationAdditional file 10 of Distinguishable DNA methylation defines a cardiac-specific epigenetic clock
Mongelli, A., Panunzi, S., Nesta, M., Zamperla, M. G., Atlante, S., Barbi, V., Mongiardini, V., Ferraro, F., De Martino, S., Cis, L., et al. (2024) · Figshare · doi:10.6084/m9.figshare.26578769
Pischedda, S., O’Connor, D., Fairfax, B. P., Salas, A., Martinon-Torres, F., Pollard, A. J., & Trück, J. (2021) · Figshare · doi:10.6084/m9.figshare.13719547
Additional file 1 of Association of cardiovascular health and epigenetic age acceleration
Pottinger, T. D., Khan, S. S., Zheng, Y., Zhang, W., Tindle, H. A., Allison, M., Wells, G., Shadyab, A. H., Nassir, R., Martin, L. W., et al. (2021) · Figshare · doi:10.6084/m9.figshare.14121428
Self-citationPischedda, S., O’Connor, D., Fairfax, B. P., Salas, A., Martinon-Torres, F., Pollard, A. J., & Trück, J. (2021) · Figshare · doi:10.6084/m9.figshare.13719535
Additional file 4 of Distinguishable DNA methylation defines a cardiac-specific epigenetic clock
Mongelli, A., Panunzi, S., Nesta, M., Zamperla, M. G., Atlante, S., Barbi, V., Mongiardini, V., Ferraro, F., De Martino, S., Cis, L., et al. (2024) · Figshare · doi:10.6084/m9.figshare.26578751
Lujan, C., Tyler, E. J., Ecker, S., Webster, A. P., Stead, E. R., Martinez-Miguel, V. E., Milligan, D., Garbe, J. C., Stampfer, M. R., Beck, S., et al. (2024) · Figshare · doi:10.6084/m9.figshare.26741984
Self-citationHigham, J., Kerr, L., Zhang, Q., Walker, R. M., Harris, S. E., Howard, D. M., Hawkins, E. L., Sandu, A.-L., Steele, J. D., Waiter, G. D., et al. (2022) · Figshare · doi:10.6084/m9.figshare.21351316
Additional file 1 of Distinguishable DNA methylation defines a cardiac-specific epigenetic clock
Mongelli, A., Panunzi, S., Nesta, M., Zamperla, M. G., Atlante, S., Barbi, V., Mongiardini, V., Ferraro, F., De Martino, S., Cis, L., et al. (2024) · Figshare · doi:10.6084/m9.figshare.26578742
Additional file 1 of Exploring the ageing methylome in the model insect, Nasonia vitripennis
Brink, K., Thomas, C. L., Jones, A., Chan, T. W. (., & Mallon, E. B. (2024) · Figshare · doi:10.6084/m9.figshare.26696580
Pischedda, S., O’Connor, D., Fairfax, B. P., Salas, A., Martinon-Torres, F., Pollard, A. J., & Trück, J. (2021) · Figshare · doi:10.6084/m9.figshare.13719550
Pischedda, S., O’Connor, D., Fairfax, B. P., Salas, A., Martinon-Torres, F., Pollard, A. J., & Trück, J. (2021) · Figshare · doi:10.6084/m9.figshare.13719544
Additional file 2 of Distinguishable DNA methylation defines a cardiac-specific epigenetic clock
Mongelli, A., Panunzi, S., Nesta, M., Zamperla, M. G., Atlante, S., Barbi, V., Mongiardini, V., Ferraro, F., De Martino, S., Cis, L., et al. (2024) · Figshare · doi:10.6084/m9.figshare.26578745
Additional file 1 of Causal effects of cardiovascular health on five epigenetic clocks
Sung, H.-L., & Lin, W.-Y. (2024) · Figshare · doi:10.6084/m9.figshare.27124166
Dwaraka, V. B., Aronica, L., Carreras-Gallo, N., Robinson, J. L., Hennings, T., Carter, M. M., Corley, M. J., Lin, A., Turner, L., Smith, R., et al. (2024) · Figshare · doi:10.6084/m9.figshare.26751362
Ori, A. P. S., Loohuis, L. M. O., Guintivano, J., Hannon, E. J., Dempster, E., St. Clair, D., Bass, N., McQuillin, A., Mill, J., Sullivan, P. F., et al. (2024) · Figshare · doi:10.6084/m9.figshare.26703769
Self-citationLujan, C., Tyler, E. J., Ecker, S., Webster, A. P., Stead, E. R., Martinez-Miguel, V. E., Milligan, D., Garbe, J. C., Stampfer, M. R., Beck, S., et al. (2024) · Figshare · doi:10.6084/m9.figshare.26157578
Self-citationLee, Y., Haftorn, K. L., Denault, W. R. P., Nustad, H. E., Page, C. M., Lyle, R., Lee-Ødegård, S., Moen, G.-H., Prasad, R. B., Groop, L. C., et al. (2020) · Figshare · doi:10.6084/m9.figshare.13151967
McCartney, D. L., Min, J. L., Richmond, R. C., Lu, A. T., Sobczyk, M. K., Davies, G., Broer, L., Guo, X., Jeong, A., Jung, J., et al. (2021) · Figshare · doi:10.6084/m9.figshare.14880981
Self-citationAdditional file 2 of NIPSNAP1 directs dual mechanisms to restrain senescence in cancer cells
Gao, E., Sun, X., Thorne, R. F., Zhang, X. D., Li, J., Shao, F., Ma, J., & Wu, M. (2024) · Figshare · doi:10.6084/m9.figshare.26598311
Additional file 16 of Distinguishable DNA methylation defines a cardiac-specific epigenetic clock
Mongelli, A., Panunzi, S., Nesta, M., Zamperla, M. G., Atlante, S., Barbi, V., Mongiardini, V., Ferraro, F., De Martino, S., Cis, L., et al. (2024) · Figshare · doi:10.6084/m9.figshare.26578787
Additional file 15 of Distinguishable DNA methylation defines a cardiac-specific epigenetic clock
Mongelli, A., Panunzi, S., Nesta, M., Zamperla, M. G., Atlante, S., Barbi, V., Mongiardini, V., Ferraro, F., De Martino, S., Cis, L., et al. (2024) · Figshare · doi:10.6084/m9.figshare.26578784
Pischedda, S., O’Connor, D., Fairfax, B. P., Salas, A., Martinon-Torres, F., Pollard, A. J., & Trück, J. (2021) · Figshare · doi:10.6084/m9.figshare.13719541
Additional file 7 of Distinguishable DNA methylation defines a cardiac-specific epigenetic clock
Mongelli, A., Panunzi, S., Nesta, M., Zamperla, M. G., Atlante, S., Barbi, V., Mongiardini, V., Ferraro, F., De Martino, S., Cis, L., et al. (2024) · Figshare · doi:10.6084/m9.figshare.26578760
Additional file 4 of Interrelationships and determinants of aging biomarkers in cord blood
Reimann, B., Martens, D. S., Wang, C., Ghantous, A., Herceg, Z., Plusquin, M., & Nawrot, T. S. (2022) · Figshare · doi:10.6084/m9.figshare.20462320
Additional file 2 of Interrelationships and determinants of aging biomarkers in cord blood
Reimann, B., Martens, D. S., Wang, C., Ghantous, A., Herceg, Z., Plusquin, M., & Nawrot, T. S. (2022) · Figshare · doi:10.6084/m9.figshare.20462314
Additional file 8 of Characteristics of epigenetic aging across gestational and perinatal tissues
Dieckmann, L., Lahti‐Pulkkinen, M., Kvist, T., Lahti, J., DeWitt, P. E., Cruceanu, C., Laivuori, H., Sammallahti, S., Villa, P., Suomalainen‐König, S., et al. (2021) · Figshare · doi:10.6084/m9.figshare.14516143
Ori, A. P. S., Loohuis, L. M. O., Guintivano, J., Hannon, E. J., Dempster, E., St. Clair, D., Bass, N., McQuillin, A., Mill, J., Sullivan, P. F., et al. (2024) · Figshare · doi:10.6084/m9.figshare.26703760
Self-citationAdditional file 8 of NIPSNAP1 directs dual mechanisms to restrain senescence in cancer cells
Gao, E., Sun, X., Thorne, R. F., Zhang, X. D., Li, J., Shao, F., Ma, J., & Wu, M. (2024) · Figshare · doi:10.6084/m9.figshare.26598329
Ori, A. P. S., Loohuis, L. M. O., Guintivano, J., Hannon, E. J., Dempster, E., St. Clair, D., Bass, N., McQuillin, A., Mill, J., Sullivan, P. F., et al. (2024) · Figshare · doi:10.6084/m9.figshare.26703763
Self-citationAdditional file 6 of Characteristics of epigenetic aging across gestational and perinatal tissues
Dieckmann, L., Lahti‐Pulkkinen, M., Kvist, T., Lahti, J., DeWitt, P. E., Cruceanu, C., Laivuori, H., Sammallahti, S., Villa, P., Suomalainen‐König, S., et al. (2021) · Figshare · doi:10.6084/m9.figshare.14516137
Additional file 1 of Refining epigenetic prediction of chronological and biological age
Bernabeu, E., McCartney, D. L., Gadd, D. A., Hillary, R. F., Lu, A. T., Murphy, L., Wrobel, N., Campbell, A., Harris, S. E., Liewald, D. C. M., et al. (2024) · Figshare · doi:10.6084/m9.figshare.26571940
Self-citationAdditional file 17 of Distinguishable DNA methylation defines a cardiac-specific epigenetic clock
Mongelli, A., Panunzi, S., Nesta, M., Zamperla, M. G., Atlante, S., Barbi, V., Mongiardini, V., Ferraro, F., De Martino, S., Cis, L., et al. (2024) · Figshare · doi:10.6084/m9.figshare.26578790
Additional file 1 of Investigating the DNA methylation profile of e-cigarette use
Richmond, R. C., Rejon, C. S., Khouja, J. N., Prince, C., Board, A., Sharp, G., Suderman, M. J., Relton, C. L., Munafo, M. R., & Gage, S. H. (2021) · Figshare · doi:10.6084/m9.figshare.16696495
Self-citationAdditional file 1 of Interrelationships and determinants of aging biomarkers in cord blood
Reimann, B., Martens, D. S., Wang, C., Ghantous, A., Herceg, Z., Plusquin, M., & Nawrot, T. S. (2022) · Figshare · doi:10.6084/m9.figshare.20462311
Additional file 2 of DNA methylation entropy as a measure of stem cell replication and aging
Vaidya, H., Jeong, H. S., Keith, K., Maegawa, S., Calendo, G., Madžo, J., Jelı́nek, J., & Issa, J.-P. J. (2023) · Figshare · doi:10.6084/m9.figshare.22608889
Self-citationAdditional file 2 of Refining epigenetic prediction of chronological and biological age
Bernabeu, E., McCartney, D. L., Gadd, D. A., Hillary, R. F., Lu, A. T., Murphy, L., Wrobel, N., Campbell, A., Harris, S. E., Liewald, D. C. M., et al. (2024) · Figshare · doi:10.6084/m9.figshare.26571943
Self-citationAdditional file 6 of Distinguishable DNA methylation defines a cardiac-specific epigenetic clock
Mongelli, A., Panunzi, S., Nesta, M., Zamperla, M. G., Atlante, S., Barbi, V., Mongiardini, V., Ferraro, F., De Martino, S., Cis, L., et al. (2024) · Figshare · doi:10.6084/m9.figshare.26578757
Lujan, C., Tyler, E. J., Ecker, S., Webster, A. P., Stead, E. R., Martinez-Miguel, V. E., Milligan, D., Garbe, J. C., Stampfer, M. R., Beck, S., et al. (2024) · Figshare · doi:10.6084/m9.figshare.26741990
Self-citationAdditional file 3 of Refining epigenetic prediction of chronological and biological age
Bernabeu, E., McCartney, D. L., Gadd, D. A., Hillary, R. F., Lu, A. T., Murphy, L., Wrobel, N., Campbell, A., Harris, S. E., Liewald, D. C. M., et al. (2024) · Figshare · doi:10.6084/m9.figshare.26571946
Self-citationAdditional file 9 of NIPSNAP1 directs dual mechanisms to restrain senescence in cancer cells
Gao, E., Sun, X., Thorne, R. F., Zhang, X. D., Li, J., Shao, F., Ma, J., & Wu, M. (2024) · Figshare · doi:10.6084/m9.figshare.26598332
Metadata
- Authors
- Bell, C. G., Lowe, R., Adams, P. D., Baccarelli, A. A., Beck, S., Bell, J. T., Christensen, B. C., Gladyshev, V. N., Heijmans, B. T., Horvath, S., Ideker, T., Issa, J.-P. J., Kelsey, K. T., Marioni, R. E., Reik, W., Relton, C. L., Schalkwyk, L. C., Teschendorff, A. E., Wagner, W., Zhang, K., & Rakyan, V. K.
- Affiliations
- Queen Mary University of London (GB)
- Sanford Burnham Prebys Medical Discovery Institute (US)
- Columbia University (US)
- University College London (GB)
- King's College London (GB)
- Dartmouth College (US)
- Brigham and Women's Hospital (US)
- Leiden University Medical Center (NL)
- University of California, Los Angeles (US)
- University of California San Diego (US)
- Temple University (US)
- Brown University (US)
- Institute of Genetics and Cancer (GB)
- Babraham Institute (GB)
- University of Bristol (GB)
- University of Essex (GB)
- Shanghai Institute of Nutrition and Health (CN)
- RWTH Aachen University (DE)
- Macau University of Science and Technology (MO)
- Corresponding author
- Bell, Christopher G.
- Lowe, Robert
- Adams, Peter D.
- Baccarelli, Andrea A.
- Beck, Stephan
- Bell, Jordana T.
- Christensen, Brock C.
- Gladyshev, Vadim N.
- Heijmans, Bastiaan T.
- Horvath, Steve
- Ideker, Trey
- Issa, Jean-Pierre J.
- Kelsey, Karl T.
- Marioni, Riccardo E.
- Reik, Wolf
- Relton, Caroline L.
- Schalkwyk, Leonard C.
- Teschendorff, Andrew E.
- Wagner, Wolfgang
- Zhang, Kang
- Rakyan, Vardhman K.
- ORCID
- Bell, Christopher G.
- Lowe, Robert
- Adams, Peter D.
- Baccarelli, Andrea A.
- Beck, Stephan
- Bell, Jordana T.
- Christensen, Brock C.
- Gladyshev, Vadim N.
- Heijmans, Bastiaan T.
- Horvath, Steve
- Ideker, Trey
- Issa, Jean-Pierre J.
- Kelsey, Karl T.
- Marioni, Riccardo E.
- Reik, Wolf
- Relton, Caroline L.
- Schalkwyk, Leonard C.
- Teschendorff, Andrew E.
- Wagner, Wolfgang
- Zhang, Kang
- Rakyan, Vardhman K.
- Venue
- Genome Biology
- Published
- 2019-11-25
- Volume
- 20
- Issue
- 1
- Pages
- 249-249
- ISSN
- 1465-6906 (ISSN-L)
- 1474-760X
- PMC
- PMC6876109
- OpenAlex
- W2990428470
- Cited by
- 1,025
- References
- 224
- Citations by year
- 2026: 123 · 2025: 155 · 2024: 200 · 2023: 164 · 2022: 142 · 2021: 153 · 2020: 80 · 2019: 6
- FWCI
- 8.52
- Type
- journal article
- Language
- en
- Open access
- gold
- doi.org
- Locations
- Genome biology (publishedVersion, cc-by)
- PubMed Central (publishedVersion, cc-by)
- PubMed (publishedVersion)
- Research Portal (King's College London) (publishedVersion, other-oa)
- Edinburgh Research Explorer (University of Edinburgh) (acceptedVersion, cc-by)
- Open Access at Essex (University of Essex) (acceptedVersion)
- eScholarship (California Digital Library) (submittedVersion, cc-by)
- Data Archiving and Networked Services (DANS) (submittedVersion)
- Leiden Repository (Leiden University) (submittedVersion)
- DOAJ (DOAJ: Directory of Open Access Journals) (submittedVersion, cc-by-sa)
- UCL Discovery (University College London) (submittedVersion)
- eScholarship (California Digital Library) (submittedVersion)
- RWTH Publications (RWTH Aachen) (submittedVersion, other-oa)
- Queen Mary Research Online (Queen Mary University of London) (submittedVersion, cc-by)
- Bristol Research (University of Bristol) (submittedVersion)
- Columbia Academic Commons (Columbia University)
- Funders
- National Institute on Aging (AG031862-12, U34AG051425-01)
- National Cancer Institute
- Glenn/AFAR
- National Institutes of Health (R01 ES025225, P30 ES009089, R01 ES027747, CA216265, AG021518, AG047745, AG047200, CA080946, CA214005, CA100632, CA221705, CA207360, CA207110, RO1AI121226, RO1MH113930, RO1MDO1430401)
- National Institute for Health Research
- UCLH Biomedical Research Centre (BRC369/CN/SB/101310)
- Economic and Social Research Council (ES/N000404/1, ESN000498/1)
- Biotechnology and Biological Sciences Research Council (BB/S020845/1, BB/K010867/1, BB/PO28187, BB/R00675X/1)
- Nederlandse Hartstichting (2017T075)
- Joint Programming Initiative A healthy diet for a healthy life (ZonMw 529051021)
- BBMRI-NL (NWO 184.021.007, NWO 184.033.111)
- National Institute of Environmental Health Sciences (R01ES014811)
- AACR (PR0125)
- Alzheimer’s Research UK (PG2017B-10)
- Medical Research Council (MC_UU_12013/5, MR/K013807/1, MR/R005176/1)
- Cancer Research UK (C18281/A19169)
- National Science Foundation of China (31571359, 31771464)
- Royal Society Newton Advanced Fellowship (164914)
- Deutsche Forschungsgemeinschaft (WA 1706/8-1)
- Bundesministerium für Bildung und Forschung (VIP + Epi-Blood-Count)
- Interdisciplinary Center for Clinical Research, RWTH Aachen University (O3-3)
- Deutsche Krebshilfe (TRACK-AML)
- Topics
- Life Sciences › Biochemistry, Genetics and Molecular Biology › Molecular Biology › Epigenetics and DNA Methylation
- Life Sciences › Biochemistry, Genetics and Molecular Biology › Aging › Genetics, Aging, and Longevity in Model Organisms
- Life Sciences › Biochemistry, Genetics and Molecular Biology › Cell Biology › Telomeres, Telomerase, and Senescence
- Keywords
- DNA methylation, epigenetic clocks, biological aging, chronological age estimation, CpG sites, longevity interventions, rejuvenation, biomarkers, forensic age estimation, biological age prediction, single-cell epigenomics
- MeSH terms
- Aging, Animals, Biological Clocks, Humans, Genome, Human, DNA Methylation, Epigenesis, Genetic, Genome-Wide Association Study
About these checks
Registry, retraction, Cites and statistics results are computed, not judged, with one exception: a printed reference that no index lists is read once by a model before it counts as a citation error. Claims are extracted by a model and kept only when their quote appears verbatim in the text; each cited source is then checked, with a model’s help, for whether it says what the claim relies on. Those verdicts can be wrong — read the claim’s quote and the cited source before relying on one.
Statistics and arithmetic are recomputed, not judged.
Confidence bands are shown only for fields calibrated on our annotated test set. None is calibrated yet, so no band is shown.
What counts as a claim ›How we measure confidence ›How we check this ›
Are you an author, or do you see a problem with this page? Request a review
