

The DOI matches its Crossref record; 83 of the 88 references it cites were found in a registry or an index; 2 of the 74 sources its claims cite were checked for support.
Reporting and Methods in Clinical Prediction Research: A Systematic Review
Open accessAbstract
BACKGROUND: We investigated the reporting and methods of prediction studies, focusing on aims, designs, participant selection, outcomes, predictors, statistical power, statistical methods, and predictive performance measures. METHODS AND FINDINGS: We used a full hand search to identify all prediction studies published in 2008 in six high impact general medical journals. We developed a comprehensive item list to systematically score conduct and reporting of the studies, based on recent recommendations for prediction research. Two reviewers independently scored the studies. We retrieved 71 papers for full text review: 51 were predictor finding studies, 14 were prediction model development studies, three addressed an external validation of a previously developed model, and three reported on a model's impact on participant outcome. Study design was unclear in 15% of studies, and a prospective cohort was used in most studies (60%). Descriptions of the participants and definitions of predictor and outcome were generally good. Despite many recommendations against doing so, continuous predictors were often dichotomized (32% of studies). The number of events per predictor as a measure of statistical power could not be determined in 67% of the studies; of the remainder, 53% had fewer than the commonly recommended value of ten events per predictor. Methods for a priori selection of candidate predictors were described in most studies (68%). A substantial number of studies relied on a p-value cut-off of p<0.05 to select predictors in the multivariable analyses (29%). Predictive model performance measures, i.e., calibration and discrimination, were reported in 12% and 27% of studies, respectively. CONCLUSIONS: The majority of prediction studies in high impact journals do not follow current methodological recommendations, limiting their reliability and applicability.
Overview
AI snapshot
Written from the paper’s full text.
TL;DR
This systematic review of 71 multivariable clinical prediction studies published in six high-impact general medical journals in 2008 found that most were predictor-finding studies and that key methodological and reporting recommendations were frequently not followed. Reporting was generally adequate for aims, participant selection, and predictor/outcome definitions, but poor for blinding, continuous predictors, power, missing data, multivariable result presentation, and model performance/validation.
Key findings
- Of 1,204 hand-searched articles, 71 met inclusion criteria: 51 were predictor-finding studies, 14 were model development studies (11 without and 3 with external validation), 3 were external validation studies, and 3 were impact studies; these 71 papers studied 135 models or sets of predictors.
- Statistical power was often inadequately reported: based on predictors in the final model, >10 events per variable occurred in 84 of 124 models, but candidate predictors were not described in the vast majority of studies; among studies clearly describing candidate predictors, effective sample size was <10 events per variable in 50% (n = 21) of presented models.
- Missing data occurrence or handling was not described or unclear in 38% of all studies; complete case analysis was used in 65% (45/71), while multiple imputation was used in 7% (5/71) per Table 7 (the text states 8% of all studies).
- Model performance and validation were limited: C-statistic/AUC-ROC was reported in 12% of predictor-finding and 80% of development/external-validation studies combined; calibration plots in 6% (4/66) and Hosmer-Lemeshow statistic in 9% (6/66); internal validation was performed in 33% (5/14) of model development studies, and external validation in only four studies.
Methods
- Systematic review by hand search of the six highest-impact general medicine journals for 2008: *The New England Journal of Medicine*, *The Lancet*, *JAMA*, *Annals of Internal Medicine*, *BMJ*, and *PLoS Medicine*; original research with an abstract was eligible, and two reviewers independently assessed eligibility and extracted data, with median inter-reviewer agreement of 92% (IQR 75%–100%).
- Included multivariable diagnostic and prognostic prediction studies predicting an outcome by two or more independent variables; excluded single predictor/test/marker studies, causality-only studies, and studies not contributing to patient care. An item list was developed from existing reporting statements/checklists (CONSORT, REMARK, STARD, STROBE, QUADAS) and prediction methodology recommendations.
- Studies were classified into five types: predictor finding, model development without external validation, model development with external validation, external validation without or with model updating, and model impact; results were grouped by study type, medical specialty, and whether prediction was a primary or secondary aim.
Limitations
- Stated: the review examined six high-impact journals, likely representing higher-quality studies; reporting may have improved since 2008, though the authors considered this unlikely because no major reporting guidelines for this research type had been produced recently; the work assessed reporting and statistical methods, not necessarily the appropriateness of design and conduct; conduct may be better than reported because journals limit paper length; poor reporting prevents readers from gauging relevance and reliability.
- Stated: statistical power or effective sample size could not be assessed for many studies because of inadequate reporting of the number of candidate predictors; selective reporting of outcomes and predictors could not generally be assessed because study registration is not mandated for prediction research.
- Evident from the text: the review is restricted to 2008 publications in six general medical journals, so findings may not generalize to other years, journals, or specialty journals; classification relied on full-text interpretation because authors generally did not explicitly state their aim, especially to distinguish predictor-finding from model-development studies.
Model-written summary. Check it against the paper before relying on it.
Integrity signals
Registry
Cites
Statistics
Figures
Verification
Claims the paper makes
71 Own result · 26 Not checked yet · 12 No basis given · 5 Own interpretation · 4 Own method · 1 Partly supported · accuracy not yet measured
The cited sources support only part of this claim — read each source’s verdict below.
In the paper
“Commonly missing values are related to observed participant or disease characteristics.”
§ Reporting and Methods in Clinical Prediction Research: A Systematic Review > Results > Missing Values
What the sources say
- Not checked yetcites [10] EW Steyerberg, 2009, Clinical prediction models: a practical approach to development, validation, and updating source
- Not checked yetcites [12] FE Harrell, 2001, Regression modeling strategies with applications to linear models, logistic regression and survival analysis
- Not checked yetcites [13] FE Harrell Jr, 1996, Multivariable prognostic models: issues in developing models, evaluating assumptions and adequacy, and measuring and reducing errors., Stat Med source
- Supportedcites [23] AR Donders, 2006, Review: a gentle introduction to imputation of missing values., J Clin Epidemiol source
Section 2, “Types of missing data,” says the probability of missingness commonly depends on observed patient characteristics. It gives disease status as an example of such an observed characteristic, directly supporting the claim. (LLM, conf=0.94)
- Not checked yetcites [24] S Greenland, 1995, A critical look at methods for handling missing covariates in epidemiologic regression analyses., Am J Epidemiol source
- Partly supportedcites [57] A Burton, 2004, Missing covariate data within cancer prognostic studies: a review of current reporting and proposed guidelines., Br J Cancer sourceExperimental — accuracy not yet measured
The Results section ('Exploration of the missing data mechanism'; page not provided) reports differences between patients with complete and missing data in seven articles, including comparisons of patient or clinical characteristics. But only 10 of the 100 reviewed articles examined such differences, so the paper does not establish that missingness is commonly related to observed participant or disease characteristics across studies. (LLM, conf=0.85)
- Not checked yetcites [58] MH Gorelick, 2006, Bias arising from missing data in predictive models., J Clin Epidemiol source
plaincorrelational- Asserted: passes — The authors put it forward as true.
- Checkable: passes — It can be checked against evidence.
- Load-bearing: passes — The paper’s conclusions depend on it.
- Based: passes — The paper gives a reason why it holds.
A result the paper reports from its own data — it cites no other source for it, so there is none to check. The quote shows it is in the paper.
In the paper
“Study recruitment dates were reported in 88% of the studies.”
§ Reporting and Methods in Clinical Prediction Research: A Systematic Review > Results > Participant Recruitment, Follow-Up, and Setting
plain- Asserted: passes — The authors put it forward as true.
- Checkable: passes — It can be checked against evidence.
- Load-bearing: unclear — It is unclear whether the paper’s conclusions depend on it.
- Based: passes — The paper gives a reason why it holds.
The paper states this without a source or data behind it here, so there is nothing to check it against. The quote shows it is in the paper.
In the paper
“11/68 studies had all cause mortality as the outcome, where such bias would not be a factor.”
§ Reporting and Methods in Clinical Prediction Research: A Systematic Review > Results > Outcome
plain- Asserted: passes — The authors put it forward as true.
- Checkable: passes — It can be checked against evidence.
- Load-bearing: unclear — It is unclear whether the paper’s conclusions depend on it.
- Based: passes — The paper gives a reason why it holds.
None of the sources cited for this claim have been checked yet.
In the paper
“Given this, effective sample size was sufficient in the majority of the external validation studies (9/13 models).”
§ Reporting and Methods in Clinical Prediction Research: A Systematic Review > Results > Statistical Power
plain- Asserted: passes — The authors put it forward as true.
- Checkable: passes — It can be checked against evidence.
- Load-bearing: unclear — It is unclear whether the paper’s conclusions depend on it.
- Based: passes — The paper gives a reason why it holds.
A result the paper reports from its own data — it cites no other source for it, so there is none to check. The quote shows it is in the paper.
In the paper
“Outcomes were well defined in 62/68 studies (Table 3).”
§ Reporting and Methods in Clinical Prediction Research: A Systematic Review > Results > Outcome
plain- Asserted: passes — The authors put it forward as true.
- Checkable: passes — It can be checked against evidence.
- Load-bearing: unclear — It is unclear whether the paper’s conclusions depend on it.
- Based: passes — The paper gives a reason why it holds.
A result the paper reports from its own data — it cites no other source for it, so there is none to check. The quote shows it is in the paper.
In the paper
“A number of studies predicted a combined endpoint (14/71).”
§ Reporting and Methods in Clinical Prediction Research: A Systematic Review > Results > Outcome
plain- Asserted: passes — The authors put it forward as true.
- Checkable: passes — It can be checked against evidence.
- Load-bearing: unclear — It is unclear whether the paper’s conclusions depend on it.
- Based: passes — The paper gives a reason why it holds.
A result the paper reports from its own data — it cites no other source for it, so there is none to check. The quote shows it is in the paper.
In the paper
“In the studies that clearly described the number of candidate predictors, the effective sample size was <10 events per variable in 50% (n = 21) of the presented models.”
§ Reporting and Methods in Clinical Prediction Research: A Systematic Review > Results > Statistical Power
plainn = 21- Asserted: passes — The authors put it forward as true.
- Checkable: passes — It can be checked against evidence.
- Load-bearing: passes — The paper’s conclusions depend on it.
- Based: passes — The paper gives a reason why it holds.
The paper states this without a source or data behind it here, so there is nothing to check it against. The quote shows it is in the paper.
In the paper
“Prediction of more than one outcome was very common in predictor finding studies, apparently because of their exploratory aim (Table S1).”
§ Reporting and Methods in Clinical Prediction Research: A Systematic Review > Results > Outcome
plain- Asserted: passes — The authors put it forward as true.
- Checkable: passes — It can be checked against evidence.
- Load-bearing: unclear — It is unclear whether the paper’s conclusions depend on it.
- Based: passes — The paper gives a reason why it holds.
A result the paper reports from its own data — it cites no other source for it, so there is none to check. The quote shows it is in the paper.
In the paper
“There were few multivariable diagnostic studies (n = 5).”
§ Reporting and Methods in Clinical Prediction Research: A Systematic Review > Results > Study Aims
plainn = 5- Asserted: passes — The authors put it forward as true.
- Checkable: passes — It can be checked against evidence.
- Load-bearing: unclear — It is unclear whether the paper’s conclusions depend on it.
- Based: passes — The paper gives a reason why it holds.
A result the paper reports from its own data — it cites no other source for it, so there is none to check. The quote shows it is in the paper.
In the paper
“Description of the cohort characteristics was clear in 68/69 of the relevant prediction studies (not applicable for two non-nested case-control studies).”
§ Reporting and Methods in Clinical Prediction Research: A Systematic Review > Results > Participant Recruitment, Follow-Up, and Setting
plain- Asserted: passes — The authors put it forward as true.
- Checkable: passes — It can be checked against evidence.
- Load-bearing: unclear — It is unclear whether the paper’s conclusions depend on it.
- Based: passes — The paper gives a reason why it holds.
- It may state two separate claims as one. 37
- Probably not a substantial claim. 13
A result the paper reports from its own data — it cites no other source for it, so there is none to check. The quote shows it is in the paper.
In the paper
“A randomized trial was used by two of the three impact studies; the third used an observational before-after (prospective) cohort design, comparing participant outcomes before and after the introduction of a prediction model.”
§ Reporting and Methods in Clinical Prediction Research: A Systematic Review > Results > Design of Participant Sampling
plain- Asserted: passes — The authors put it forward as true.
- Checkable: passes — It can be checked against evidence.
- Load-bearing: unclear — It is unclear whether the paper’s conclusions depend on it.
- Based: passes — The paper gives a reason why it holds.
It may state two separate claims as one.
A result the paper reports from its own data — it cites no other source for it, so there is none to check. The quote shows it is in the paper.
In the paper
“Of the prediction modelling studies (n = 20), the vast majority were model development studies, without (n = 11) or with (n = 3) external validation.”
§ Reporting and Methods in Clinical Prediction Research: A Systematic Review > Results > Study Aims
plainn = 20- Asserted: passes — The authors put it forward as true.
- Checkable: passes — It can be checked against evidence.
- Load-bearing: unclear — It is unclear whether the paper’s conclusions depend on it.
- Based: passes — The paper gives a reason why it holds.
It may state two separate claims as one.
A result the paper reports from its own data — it cites no other source for it, so there is none to check. The quote shows it is in the paper.
In the paper
“Predictor interaction (non-additivity) was tested in 25 of the 51 predictor finding studies and in 11 of the 14 model development studies (total n = 36).”
§ Reporting and Methods in Clinical Prediction Research: A Systematic Review > Results > Candidate Predictors
plainn = 36- Asserted: passes — The authors put it forward as true.
- Checkable: passes — It can be checked against evidence.
- Load-bearing: unclear — It is unclear whether the paper’s conclusions depend on it.
- Based: passes — The paper gives a reason why it holds.
It may state two separate claims as one.
A result the paper reports from its own data — it cites no other source for it, so there is none to check. The quote shows it is in the paper.
In the paper
“Pure external validation (n = 3) and impact studies (n = 3) were rare.”
§ Reporting and Methods in Clinical Prediction Research: A Systematic Review > Results > Study Aims
plainn = 3- Asserted: passes — The authors put it forward as true.
- Checkable: passes — It can be checked against evidence.
- Load-bearing: unclear — It is unclear whether the paper’s conclusions depend on it.
- Based: passes — The paper gives a reason why it holds.
It may state two separate claims as one.
A result the paper reports from its own data — it cites no other source for it, so there is none to check. The quote shows it is in the paper.
In the paper
“Whether (all) consecutive participants were included or how many participants refused to participate was rarely reported and so could not be evaluated.”
§ Reporting and Methods in Clinical Prediction Research: A Systematic Review > Results > Participant Recruitment, Follow-Up, and Setting
plain- Asserted: passes — The authors put it forward as true.
- Checkable: passes — It can be checked against evidence.
- Load-bearing: unclear — It is unclear whether the paper’s conclusions depend on it.
- Based: passes — The paper gives a reason why it holds.
It may state two separate claims as one.
A result the paper reports from its own data — it cites no other source for it, so there is none to check. The quote shows it is in the paper.
In the paper
“In outcome reporting, we expected differences between studies with prediction as a primary versus a secondary aim, but this was not observed.”
§ Reporting and Methods in Clinical Prediction Research: A Systematic Review > Results > Outcome
plain- Asserted: passes — The authors put it forward as true.
- Checkable: passes — It can be checked against evidence.
- Load-bearing: unclear — It is unclear whether the paper’s conclusions depend on it.
- Based: passes — The paper gives a reason why it holds.
It may state two separate claims as one.
A result the paper reports from its own data — it cites no other source for it, so there is none to check. The quote shows it is in the paper.
In the paper
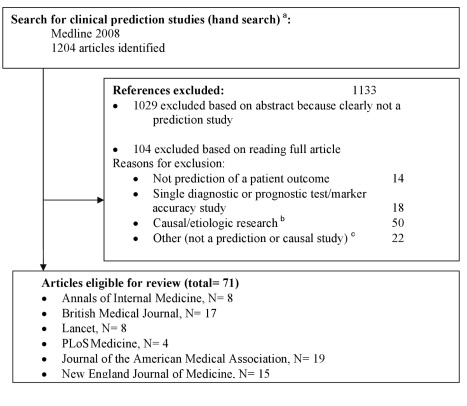
“We identified 1,204 articles by hand searching, of which 71 met the inclusion criteria (Figure 1 and Text S2).”
§ Reporting and Methods in Clinical Prediction Research: A Systematic Review > Results
plain- Asserted: passes — The authors put it forward as true.
- Checkable: passes — It can be checked against evidence.
- Load-bearing: passes — The paper’s conclusions depend on it.
- Based: passes — The paper gives a reason why it holds.
It may state two separate claims as one.
A result the paper reports from its own data — it cites no other source for it, so there is none to check. The quote shows it is in the paper.
In the paper
“Authors in general did not explicitly state their aim, so we used full text interpretations to classify studies as predictor finding or model development studies.”
§ Reporting and Methods in Clinical Prediction Research: A Systematic Review > Results > Data Extraction and Reviewer Agreement
plaindirect- Asserted: passes — The authors put it forward as true.
- Checkable: passes — It can be checked against evidence.
- Load-bearing: fails — The paper’s conclusions may not depend on it.
- Based: passes — The paper gives a reason why it holds.
Probably not a substantial claim. The paper’s conclusions may not depend on it. It may state two separate claims as one.
A result the paper reports from its own data — it cites no other source for it, so there is none to check. The quote shows it is in the paper.
In the paper
“Discrimination was assessed with the C-statistic or area under the receiver operating characteristic (ROC) curve in 12% of the predictor finding and, as expected, 80% of the model development and external validation studies.”
§ Reporting and Methods in Clinical Prediction Research: A Systematic Review > Results > Model Performance and Internal and External Validity
plain- Asserted: passes — The authors put it forward as true.
- Checkable: passes — It can be checked against evidence.
- Load-bearing: unclear — It is unclear whether the paper’s conclusions depend on it.
- Based: passes — The paper gives a reason why it holds.
It may state two separate claims as one.
A result the paper reports from its own data — it cites no other source for it, so there is none to check. The quote shows it is in the paper.
In the paper
“The majority, 65% of the predictor finding and 79% of the model development studies, reported the predictor coefficients or effect estimates of the model after predictor selection (the final model).”
§ Reporting and Methods in Clinical Prediction Research: A Systematic Review > Results > Presentation of Results
plain- Asserted: passes — The authors put it forward as true.
- Checkable: passes — It can be checked against evidence.
- Load-bearing: passes — The paper’s conclusions depend on it.
- Based: passes — The paper gives a reason why it holds.
It may state two separate claims as one.
A result the paper reports from its own data — it cites no other source for it, so there is none to check. The quote shows it is in the paper.
In the paper
“By comparison, multiple imputation, the most rigorous strategy for dealing with missing values, was used in only 8% of all studies.”
- Also stated in: § Discussion · hedged
“Recommended methods, such as multiple imputation, were applied and reported in very few studies, although this may be due to the fact that consensus in recommending these methods was arrived at only recently.”
§ Reporting and Methods in Clinical Prediction Research: A Systematic Review > Results > Missing Values
plain- Asserted: passes — The authors put it forward as true.
- Checkable: passes — It can be checked against evidence.
- Load-bearing: passes — The paper’s conclusions depend on it.
- Based: passes — The paper gives a reason why it holds.
It may state two separate claims as one.
- Also stated in: § Discussion · hedged
The paper states this without a source or data behind it here, so there is nothing to check it against. The quote shows it is in the paper.
In the paper
“In descriptions of participant selection, it often remained unclear whether participants were included in an unbiased way, notably with respect to refusals and whether all consecutive eligible participants were included.”
§ Reporting and Methods in Clinical Prediction Research: A Systematic Review > Discussion
plain- Asserted: passes — The authors put it forward as true.
- Checkable: passes — It can be checked against evidence.
- Load-bearing: passes — The paper’s conclusions depend on it.
- Based: passes — The paper gives a reason why it holds.
It may state two separate claims as one.
A result the paper reports from its own data — it cites no other source for it, so there is none to check. The quote shows it is in the paper.
In the paper
“and external validation in only four studies.”
- Also stated in: § Discussion · plain
“Similarly, only a very few model development studies reported an external validation of the model in the same paper.”
§ Reporting and Methods in Clinical Prediction Research: A Systematic Review > Results > Model Performance and Internal and External Validity
plain- Asserted: passes — The authors put it forward as true.
- Checkable: passes — It can be checked against evidence.
- Load-bearing: passes — The paper’s conclusions depend on it.
- Based: passes — The paper gives a reason why it holds.
It may state two separate claims as one.
- Also stated in: § Discussion · plain
A result the paper reports from its own data — it cites no other source for it, so there is none to check. The quote shows it is in the paper.
In the paper
“External validation and model impact studies were rare (n = 6).”
- Also stated in: § Discussion · plain
“Only a very small minority of the papers involved the most useful approaches in predicting participant clinical outcomes, namely, external validations or impact assessments of a previously developed prediction model.”
§ Reporting and Methods in Clinical Prediction Research: A Systematic Review > Discussion
plainn = 6- Asserted: passes — The authors put it forward as true.
- Checkable: passes — It can be checked against evidence.
- Load-bearing: passes — The paper’s conclusions depend on it.
- Based: passes — The paper gives a reason why it holds.
It may state two separate claims as one.
- Also stated in: § Discussion · plain
A result the paper reports from its own data — it cites no other source for it, so there is none to check. The quote shows it is in the paper.
In the paper
“Study design, participant selection, definitions of outcomes and predictors, and predictor selection were generally well reported.”
§ Reporting and Methods in Clinical Prediction Research: A Systematic Review > Discussion
plain- Asserted: passes — The authors put it forward as true.
- Checkable: passes — It can be checked against evidence.
- Load-bearing: unclear — It is unclear whether the paper’s conclusions depend on it.
- Based: passes — The paper gives a reason why it holds.
It may state two separate claims as one.
A result the paper reports from its own data — it cites no other source for it, so there is none to check. The quote shows it is in the paper.
In the paper
“18% of all studies investigated the added value of specific predictors, and 42% included predictors regardless of statistical significance.”
§ Reporting and Methods in Clinical Prediction Research: A Systematic Review > Results > Selection of Candidate and Final Predictors
plain- Asserted: passes — The authors put it forward as true.
- Checkable: passes — It can be checked against evidence.
- Load-bearing: unclear — It is unclear whether the paper’s conclusions depend on it.
- Based: passes — The paper gives a reason why it holds.
It may state two separate claims as one.
A result the paper reports from its own data — it cites no other source for it, so there is none to check. The quote shows it is in the paper.
In the paper
“Analysis of participants with complete data (i.e., complete case analysis) was performed in the vast majority of studies.”
- Also stated in: § Discussion · plain
“Complete case analysis was by far the most commonly used approach to handle missing values, despite many methodological recommendations to do otherwise [10],[12],[13],[23],[24],[57],[58].”
§ Reporting and Methods in Clinical Prediction Research: A Systematic Review > Results > Missing Values
plain- Asserted: passes — The authors put it forward as true.
- Checkable: passes — It can be checked against evidence.
- Load-bearing: passes — The paper’s conclusions depend on it.
- Based: passes — The paper gives a reason why it holds.
It may state two separate claims as one.
- Also stated in: § Discussion · plain
A result the paper reports from its own data — it cites no other source for it, so there is none to check. The quote shows it is in the paper.
In the paper
“The most commonly reported criterion for predictor selection in multivariable models was a p-value of <0.05, used in 18% of all studies (and in 26% of the studies that indeed applied predictor selection in multivariable analyses).”
§ Reporting and Methods in Clinical Prediction Research: A Systematic Review > Results > Selection of Candidate and Final Predictors
plain- Asserted: passes — The authors put it forward as true.
- Checkable: passes — It can be checked against evidence.
- Load-bearing: unclear — It is unclear whether the paper’s conclusions depend on it.
- Based: passes — The paper gives a reason why it holds.
It may state two separate claims as one.
A result the paper reports from its own data — it cites no other source for it, so there is none to check. The quote shows it is in the paper.
In the paper
“Our investigation found that among the 71 prediction studies identified, the vast majority were predictor finding studies (n = 51), followed by model development studies (n = 14).”
§ Reporting and Methods in Clinical Prediction Research: A Systematic Review > Discussion
plainn = 51- Asserted: passes — The authors put it forward as true.
- Checkable: passes — It can be checked against evidence.
- Load-bearing: unclear — It is unclear whether the paper’s conclusions depend on it.
- Based: passes — The paper gives a reason why it holds.
It may state two separate claims as one.
A result the paper reports from its own data — it cites no other source for it, so there is none to check. The quote shows it is in the paper.
In the paper
“We found that 14 studies developed new prediction models (of which three included an external validation).”
§ Reporting and Methods in Clinical Prediction Research: A Systematic Review > Discussion
plainn = 14- Asserted: passes — The authors put it forward as true.
- Checkable: passes — It can be checked against evidence.
- Load-bearing: passes — The paper’s conclusions depend on it.
- Based: passes — The paper gives a reason why it holds.
It may state two separate claims as one.
A result the paper reports from its own data — it cites no other source for it, so there is none to check. The quote shows it is in the paper.
In the paper
“Three studies externally validated models, and three investigated the impact of an existing prediction model.”
§ Reporting and Methods in Clinical Prediction Research: A Systematic Review > Discussion
plain- Asserted: passes — The authors put it forward as true.
- Checkable: passes — It can be checked against evidence.
- Load-bearing: unclear — It is unclear whether the paper’s conclusions depend on it.
- Based: passes — The paper gives a reason why it holds.
It may state two separate claims as one.
A result the paper reports from its own data — it cites no other source for it, so there is none to check. The quote shows it is in the paper.
In the paper
“Studies reported using backward selection in 17% of the primary-aim and 18% of the secondary-aim studies, whereas forward selection was reported in 6% and 0%, respectively.”
§ Reporting and Methods in Clinical Prediction Research: A Systematic Review > Results > Selection of Candidate and Final Predictors
plain- Asserted: passes — The authors put it forward as true.
- Checkable: passes — It can be checked against evidence.
- Load-bearing: unclear — It is unclear whether the paper’s conclusions depend on it.
- Based: passes — The paper gives a reason why it holds.
It may state two separate claims as one.
A result the paper reports from its own data — it cites no other source for it, so there is none to check. The quote shows it is in the paper.
In the paper
“In studies with prediction as the primary aim, the majority (71%) selected their candidate predictors based on existing literature, whereas this was less often the case (29%) in studies with prediction as a secondary aim.”
§ Reporting and Methods in Clinical Prediction Research: A Systematic Review > Results > Selection of Candidate and Final Predictors
plaincorrelational- Asserted: passes — The authors put it forward as true.
- Checkable: passes — It can be checked against evidence.
- Load-bearing: unclear — It is unclear whether the paper’s conclusions depend on it.
- Based: passes — The paper gives a reason why it holds.
It may state two separate claims as one.
A result the paper reports from its own data — it cites no other source for it, so there is none to check. The quote shows it is in the paper.
In the paper
“Internal validation was performed in 33% (n = 5) of the 14 model development studies”
- Also stated in: § Discussion · plain
“but use of these techniques was rare.”
§ Reporting and Methods in Clinical Prediction Research: A Systematic Review > Results > Model Performance and Internal and External Validity
plainn = 5- Asserted: passes — The authors put it forward as true.
- Checkable: passes — It can be checked against evidence.
- Load-bearing: passes — The paper’s conclusions depend on it.
- Based: passes — The paper gives a reason why it holds.
It may state two separate claims as one.
- Also stated in: § Discussion · plain
A result the paper reports from its own data — it cites no other source for it, so there is none to check. The quote shows it is in the paper.
In the paper
“Pre-selection of candidate predictors for inclusion in the multivariable analyses based on univariable predictor–outcome associations was used in 13% of the primary-aim and in 24% of the secondary-aim prediction studies.”
§ Reporting and Methods in Clinical Prediction Research: A Systematic Review > Results > Selection of Candidate and Final Predictors
plain- Asserted: passes — The authors put it forward as true.
- Checkable: passes — It can be checked against evidence.
- Load-bearing: unclear — It is unclear whether the paper’s conclusions depend on it.
- Based: passes — The paper gives a reason why it holds.
It may state two separate claims as one.
A result the paper reports from its own data — it cites no other source for it, so there is none to check. The quote shows it is in the paper.
In the paper
“We found that selection of candidate predictors was described for 36 (75%) of the studies where prediction was the primary aim and for eight (47%) of the studies where prediction was a secondary aim (Table 6).”
§ Reporting and Methods in Clinical Prediction Research: A Systematic Review > Results > Selection of Candidate and Final Predictors
plain- Asserted: passes — The authors put it forward as true.
- Checkable: passes — It can be checked against evidence.
- Load-bearing: passes — The paper’s conclusions depend on it.
- Based: passes — The paper gives a reason why it holds.
It may state two separate claims as one.
A result the paper reports from its own data — it cites no other source for it, so there is none to check. The quote shows it is in the paper.
In the paper
“However, sample size considerations, applied statistical methods, and procedures for dealing with missing data were poorly reported despite being highlighted in several reporting guidelines.”
§ Reporting and Methods in Clinical Prediction Research: A Systematic Review > Discussion
plain- Asserted: passes — The authors put it forward as true.
- Checkable: passes — It can be checked against evidence.
- Load-bearing: passes — The paper’s conclusions depend on it.
- Based: passes — The paper gives a reason why it holds.
It may state two separate claims as one.
- Rests on an assumption: The statistical methods reported in the published prediction studies reflect the methods actually used in those studies.
The paper states this without a source or data behind it here, so there is nothing to check it against. The quote shows it is in the paper.
In the paper
“Most studies reported the occurrence of missing data but did not report sufficient detail.”
§ Reporting and Methods in Clinical Prediction Research: A Systematic Review > Discussion
plain- Asserted: passes — The authors put it forward as true.
- Checkable: passes — It can be checked against evidence.
- Load-bearing: passes — The paper’s conclusions depend on it.
- Based: passes — The paper gives a reason why it holds.
It may state two separate claims as one.
A result the paper reports from its own data — it cites no other source for it, so there is none to check. The quote shows it is in the paper.
In the paper
“C-statistics or area under the ROC curves were the most frequently reported discrimination statistics, whereas measures of calibration (such as calibration slope) and overall measures of fit were rarely reported.”
§ Reporting and Methods in Clinical Prediction Research: A Systematic Review > Discussion
plain- Asserted: passes — The authors put it forward as true.
- Checkable: passes — It can be checked against evidence.
- Load-bearing: passes — The paper’s conclusions depend on it.
- Based: passes — The paper gives a reason why it holds.
It may state two separate claims as one.
A result the paper reports from its own data — it cites no other source for it, so there is none to check. The quote shows it is in the paper.
In the paper
“However, encouraging findings included the frequent use of prospective studies, and adequate description of participant selection, predictor and outcome definitions, and the process for (pre)selection of candidate predictors.”
§ Reporting and Methods in Clinical Prediction Research: A Systematic Review > Discussion
plain- Asserted: passes — The authors put it forward as true.
- Checkable: passes — It can be checked against evidence.
- Load-bearing: passes — The paper’s conclusions depend on it.
- Based: passes — The paper gives a reason why it holds.
It may state two separate claims as one.
What the paper did — it cites no source for this, so there is none to check. The quote shows it is in the paper.
In the paper
“Two authors (W. B., N. P. A. Z.) independently extracted the data. In case of doubt, items were discussed with a third and fourth reviewer (K. G. M. M., Y. V.).”
§ Reporting and Methods in Clinical Prediction Research: A Systematic Review > Methods > Data Extraction
plain- Asserted: passes — The authors put it forward as true.
- Checkable: passes — It can be checked against evidence.
- Load-bearing: fails — The paper’s conclusions may not depend on it.
- Based: passes — The paper gives a reason why it holds.
Probably not a substantial claim. The paper’s conclusions may not depend on it. It may state two separate claims as one.
None of the sources cited for this claim have been checked yet.
In the paper
“However, many methodological reports have shown that selection based on (significant) univariable predictor–outcome associations is not recommended, as this method increases the chance of biased results in terms of spurious predictors and overfitted and unstable models [12],[13],[43],[56].”
§ Reporting and Methods in Clinical Prediction Research: A Systematic Review > Results > Selection of Candidate and Final Predictors
What the sources say
- Not checked yetcites [12] FE Harrell, 2001, Regression modeling strategies with applications to linear models, logistic regression and survival analysis
- Not checked yetcites [13] FE Harrell Jr, 1996, Multivariable prognostic models: issues in developing models, evaluating assumptions and adequacy, and measuring and reducing errors., Stat Med source
- Not checked yetcites [43] EW Steyerberg, 2001, Internal validation of predictive models: efficiency of some procedures for logistic regression analysis., J Clin Epidemiol source
boosteddirect- Asserted: passes — The authors put it forward as true.
- Checkable: passes — It can be checked against evidence.
- Load-bearing: passes — The paper’s conclusions depend on it.
- Based: passes — The paper gives a reason why it holds.
It may state two separate claims as one.
In the paper
“To externally validate a prediction model, a minimum effective sample size of 100 participants with and 100 without the event has been recommended [55].”
§ Reporting and Methods in Clinical Prediction Research: A Systematic Review > Results > Statistical Power
What the sources say
- Not checked yetcites [55] Y Vergouwe, 2005, Substantial effective sample sizes were required for external validation studies of predictive logistic regression models., J Clin Epidemiol source
plainn = 100- Asserted: passes — The authors put it forward as true.
- Checkable: passes — It can be checked against evidence.
- Load-bearing: passes — The paper’s conclusions depend on it.
- Based: passes — The paper gives a reason why it holds.
Probably not a substantial claim.
None of the sources cited for this claim have been checked yet.
In the paper
“A frequently mentioned rule of thumb is “10 events needed per candidate predictor” [12],[25],[26],[30],[54].”
§ Reporting and Methods in Clinical Prediction Research: A Systematic Review > Results > Statistical Power
What the sources say
- Not checked yetcites [12] FE Harrell, 2001, Regression modeling strategies with applications to linear models, logistic regression and survival analysis
- Not checked yetcites [25] P Peduzzi, 1996, A simulation study of the number of events per variable in logistic regression analysis., J Clin Epidemiol source
- Not checked yetcites [26] P Peduzzi, 1995, Importance of events per independent variable in proportional hazards regression analysis. II. Accuracy and precision of regression estimates., J Clin Epidemiol source
plain- Asserted: passes — The authors put it forward as true.
- Checkable: passes — It can be checked against evidence.
- Load-bearing: fails — The paper’s conclusions may not depend on it.
- Based: passes — The paper gives a reason why it holds.
Probably not a substantial claim. The paper’s conclusions may not depend on it.
In the paper
“a practice that is not recommended because less accurate predictions are likely to result, as with dichotomizing predictor variables [50].”
§ Reporting and Methods in Clinical Prediction Research: A Systematic Review > Results > Outcome
What the sources say
- Not checked yetcites [50] P Royston, 2006, Dichotomizing continuous predictors in multiple regression: a bad idea., Stat Med source
hedgeddirect- Asserted: passes — The authors put it forward as true.
- Checkable: passes — It can be checked against evidence.
- Load-bearing: passes — The paper’s conclusions depend on it.
- Based: passes — The paper gives a reason why it holds.
Probably not a substantial claim.
None of the sources cited for this claim have been checked yet.
In the paper
“Adequate reporting of predictor selection methods used is important, because the number of candidate predictors and how they were selected at various stages of the study can both influence the specific predictors included in the final multivariable model, and thus affect the interpretation of the results 12,13,43,56.”
§ Reporting and Methods in Clinical Prediction Research: A Systematic Review > Results > Selection of Candidate and Final Predictors
What the sources say
- Not checked yetcites [12] FE Harrell, 2001, Regression modeling strategies with applications to linear models, logistic regression and survival analysis
- Not checked yetcites [13] FE Harrell Jr, 1996, Multivariable prognostic models: issues in developing models, evaluating assumptions and adequacy, and measuring and reducing errors., Stat Med source
- Not checked yetcites [43] EW Steyerberg, 2001, Internal validation of predictive models: efficiency of some procedures for logistic regression analysis., J Clin Epidemiol source
plaindirect- Asserted: passes — The authors put it forward as true.
- Checkable: passes — It can be checked against evidence.
- Load-bearing: passes — The paper’s conclusions depend on it.
- Based: passes — The paper gives a reason why it holds.
It may state two separate claims as one.
What the paper did — it cites no source for this, so there is none to check. The quote shows it is in the paper.
In the paper
“The two reviewers agreed on a median of 92% (interquartile range 75%–100%) of the items extracted.”
§ Reporting and Methods in Clinical Prediction Research: A Systematic Review > Results > Data Extraction and Reviewer Agreement
plain- Asserted: passes — The authors put it forward as true.
- Checkable: passes — It can be checked against evidence.
- Load-bearing: fails — The paper’s conclusions may not depend on it.
- Based: passes — The paper gives a reason why it holds.
Probably not a substantial claim. The paper’s conclusions may not depend on it.
What the paper did — it cites no source for this, so there is none to check. The quote shows it is in the paper.
In the paper
“The full text of all thus selected studies was obtained, and two authors (W. B. and N. P. A. Z.) independently assessed eligibility; in case of doubt a third independent reader was involved (K. G. M. M. or Y. V.).”
§ Reporting and Methods in Clinical Prediction Research: A Systematic Review > Methods > Literature Search
plain- Asserted: passes — The authors put it forward as true.
- Checkable: passes — It can be checked against evidence.
- Load-bearing: fails — The paper’s conclusions may not depend on it.
- Based: passes — The paper gives a reason why it holds.
Probably not a substantial claim. The paper’s conclusions may not depend on it. It may state two separate claims as one.
What the paper did — it cites no source for this, so there is none to check. The quote shows it is in the paper.
In the paper
“The inter-reviewer agreement on the data extraction was assessed by calculating the percentage of overall agreement between the two reviewers.”
§ Reporting and Methods in Clinical Prediction Research: A Systematic Review > Methods > Data Extraction
plain- Asserted: passes — The authors put it forward as true.
- Checkable: passes — It can be checked against evidence.
- Load-bearing: fails — The paper’s conclusions may not depend on it.
- Based: passes — The paper gives a reason why it holds.
Probably not a substantial claim. The paper’s conclusions may not depend on it.
The paper states this without a source or data behind it here, so there is nothing to check it against. The quote shows it is in the paper.
In the paper
“Imputation, notably multiple imputation, of missing values is often advocated to preserve power and obtain less biased results, on the assumption that the reason for the missing data is not entirely due to non-observed information (i.e., data are not “missing not at random”).”
§ Reporting and Methods in Clinical Prediction Research: A Systematic Review > Results > Missing Values
plainconditional- Asserted: passes — The authors put it forward as true.
- Checkable: passes — It can be checked against evidence.
- Load-bearing: fails — The paper’s conclusions may not depend on it.
- Based: passes — The paper gives a reason why it holds.
Probably not a substantial claim. The paper’s conclusions may not depend on it.
- The authors state this as an assumption: The reason for missing data is not entirely due to non-observed information (data are not missing not at random) when multiple imputation is used.
None of the sources cited for this claim have been checked yet.
In the paper
“Various reports have indicated that in prediction modelling research there is an unfortunate practice of developing new models instead of externally validating or updating existing models [8]–[10],[15],[29],[36],[48].”
§ Reporting and Methods in Clinical Prediction Research: A Systematic Review > Discussion
What the sources say
- Not checked yetcites [8]–[10]
- Not checked yetcites [15] A Laupacis, 1997, Clinical prediction rules. a review and suggested modifications of methodological standards., JAMA source
- Not checked yetcites [29] JH Wasson, 1985, Clinical prediction rules. Applications and methodological standards., N Engl J Med source
hedged- Asserted: passes — The authors put it forward as true.
- Checkable: passes — It can be checked against evidence.
- Load-bearing: fails — The paper’s conclusions may not depend on it.
- Based: passes — The paper gives a reason why it holds.
Probably not a substantial claim. The paper’s conclusions may not depend on it.
None of the sources cited for this claim have been checked yet.
In the paper
“Exclusion of participants with missing values will therefore not only lead to loss of statistical power, but often also to biased results 10,12,13,23,24,57,58.”
§ Reporting and Methods in Clinical Prediction Research: A Systematic Review > Results > Missing Values
What the sources say
- Not checked yetcites [10] EW Steyerberg, 2009, Clinical prediction models: a practical approach to development, validation, and updating source
- Not checked yetcites [12] FE Harrell, 2001, Regression modeling strategies with applications to linear models, logistic regression and survival analysis
- Not checked yetcites [13] FE Harrell Jr, 1996, Multivariable prognostic models: issues in developing models, evaluating assumptions and adequacy, and measuring and reducing errors., Stat Med source
- Not checked yetcites [23] AR Donders, 2006, Review: a gentle introduction to imputation of missing values., J Clin Epidemiol source
- Not checked yetcites [24] S Greenland, 1995, A critical look at methods for handling missing covariates in epidemiologic regression analyses., Am J Epidemiol source
- Not checked yetcites [57] A Burton, 2004, Missing covariate data within cancer prognostic studies: a review of current reporting and proposed guidelines., Br J Cancer source
- Not checked yetcites [58] MH Gorelick, 2006, Bias arising from missing data in predictive models., J Clin Epidemiol source
plaindirect- Asserted: passes — The authors put it forward as true.
- Checkable: passes — It can be checked against evidence.
- Load-bearing: passes — The paper’s conclusions depend on it.
- Based: passes — The paper gives a reason why it holds.
It may state two separate claims as one.
None of the sources cited for this claim have been checked yet.
In the paper
“These items have been identified as important in several well-known guidelines for reporting of clinical research [4],[38]–[41].”
§ Reporting and Methods in Clinical Prediction Research: A Systematic Review > Discussion
What the sources say
- Not checked yetcites [4] LM McShane, 2005, Reporting recommendations for tumor marker prognostic studies (REMARK)., J Natl Cancer Inst source
- Not checked yetcites [38]–[41]
boosted- Asserted: passes — The authors put it forward as true.
- Checkable: passes — It can be checked against evidence.
- Load-bearing: fails — The paper’s conclusions may not depend on it.
- Based: passes — The paper gives a reason why it holds.
Probably not a substantial claim. The paper’s conclusions may not depend on it.
None of the sources cited for this claim have been checked yet.
In the paper
“Poor reporting of sample size rationale has also been observed by others [3],[21],[68].”
§ Reporting and Methods in Clinical Prediction Research: A Systematic Review > Discussion
What the sources say
- Not checked yetcites [3] DG Altman, 1998, Methodological challenges in the evaluation of prognostic factors in breast cancer., Breast Cancer Res Treat source
- Not checked yetcites [21] S Mallett, 2010, Reporting methods in studies developing prognostic models in cancer: a review., BMC Med source
- Not checked yetcites [68] LM Bachmann, 2006, Sample sizes of studies on diagnostic accuracy: literature survey., BMJ source
plain- Asserted: passes — The authors put it forward as true.
- Checkable: passes — It can be checked against evidence.
- Load-bearing: fails — The paper’s conclusions may not depend on it.
- Based: passes — The paper gives a reason why it holds.
Probably not a substantial claim. The paper’s conclusions may not depend on it.
A conclusion the paper draws from its own results — it cites no other source for it, so there is none to check. The quote shows it is in the paper.
In the paper
“To conclude, we identified poor reporting and poor methods in many published prediction studies, which limits the reliability and applicability of the published findings.”
§ Reporting and Methods in Clinical Prediction Research: A Systematic Review > Discussion
plaindirect- Asserted: passes — The authors put it forward as true.
- Checkable: passes — It can be checked against evidence.
- Load-bearing: passes — The paper’s conclusions depend on it.
- Based: passes — The paper gives a reason why it holds.
It may state two separate claims as one.
- Rests on an assumption: The 71 prediction studies published in six high-impact general medical journals in 2008 are representative of current clinical prediction research.
- Rests on an assumption: The statistical methods reported in the published prediction studies reflect the methods actually used in those studies.
None of the sources cited for this claim have been checked yet.
In the paper
“This apparent model performance, however, is generally too optimistic, as the model has been tailored to the dataset at hand.”
§ Reporting and Methods in Clinical Prediction Research: A Systematic Review > Discussion
What the sources say
- Not checked yetcites [10] EW Steyerberg, 2009, Clinical prediction models: a practical approach to development, validation, and updating source
- Not checked yetcites [12] FE Harrell, 2001, Regression modeling strategies with applications to linear models, logistic regression and survival analysis
- Not checked yetcites [70] JC Van Houwelingen, 1990, Predictive value of statistical models., Stat Med source
plaindirect- Asserted: passes — The authors put it forward as true.
- Checkable: passes — It can be checked against evidence.
- Load-bearing: passes — The paper’s conclusions depend on it.
- Based: passes — The paper gives a reason why it holds.
It may state two separate claims as one.
In the paper
“The REMARK guidelines for prognostic tumour marker studies recommend using a REMARK profile table instead of a flow diagram [69].”
§ Reporting and Methods in Clinical Prediction Research: A Systematic Review > Discussion
What the sources say
- Not checked yetcites [69] S Mallett, 2010, Reporting of prognostic studies of tumour markers: a review of published articles in relation to REMARK guidelines., Br J Cancer source
plain- Asserted: passes — The authors put it forward as true.
- Checkable: passes — It can be checked against evidence.
- Load-bearing: fails — The paper’s conclusions may not depend on it.
- Based: passes — The paper gives a reason why it holds.
Probably not a substantial claim. The paper’s conclusions may not depend on it.
The paper relies on this without support.
Study registration is not mandated for prediction research.
“study registration is not mandated for prediction research”
The authors state this as an assumption.
The reason for missing data is not entirely due to non-observed information (data are not missing not at random) when multiple imputation is used.
“on the assumption that the reason for the missing data is not entirely due to non-observed information (i.e., data are not “missing not at random”).”
The paper relies on this without support.
The 71 prediction studies published in six high-impact general medical journals in 2008 are representative of current clinical prediction research.
“We assessed the reporting and methods in all clinical prediction studies published in six high-impact general medical journals in 2008.”
“We have described the state of current prediction research, and highlighted aspects that clearly need improvement.”
The paper relies on this without support.
The statistical methods reported in the published prediction studies reflect the methods actually used in those studies.
“We note that our work assessed researchers' reporting and statistical methods in modelling, and not necessarily the appropriateness of the design and conduct of the studies.”
Claims other papers make about this one
Each is checked against this paper’s own text: does it say what the citing paper says it does?
The cited source says what the claim attributes to it.
In the citing paper
“However, the overwhelming evidence shows that the quality of reporting of prediction model studies is poor.”
From Transparent Reporting of a Multivariable Prediction Model for Individual Prognosis or Diagnosis (TRIPOD): The TRIPOD Statement (2015) · cites this paper as [23]
In the citing paper
“Bouwmeester and colleagues [23] evaluated 71 reports, published in 2008 in 6 high-impact general medical journals, and likewise observed an overwhelmingly poor level of reporting.”
From Transparent reporting of a multivariable prediction model for individual prognosis or diagnosis (TRIPOD): the TRIPOD Statement (2015) · cites this paper as [23]
In the citing paper
“Many reviews have showed that the quality of reporting in published articles describing the development or validation of multivariable prediction models in medicine is poor [23–27,29].”
From Transparent reporting of a multivariable prediction model for individual prognosis or diagnosis (TRIPOD): the TRIPOD Statement (2015) · cites this paper as [23]
In the citing paper
“Unfortunately, extraction of calibration measures is often hampered by poor assessment and reporting.11,16”
From A framework for meta-analysis of prediction model studies with binary and time-to-event outcomes (2019) · cites this paper as [16]
In the citing paper
“In a meta-analysis without access to individual participant data (IPD), we are reliant on extracting these performance measures from study publications. However, they are often poorly reported.”
From A framework for meta-analysis of prediction model studies with binary and time-to-event outcomes (2019) · cites this paper as [16]
In the citing paper
“For instance, validation studies rarely present information on the calibration intercept and slope, or different studies report estimates for different risk strata or time horizons.”
From A framework for meta-analysis of prediction model studies with binary and time-to-event outcomes (2019) · cites this paper as [16]
In the citing paper
“Bouwmeester and colleagues23 evaluated 71 reports, published in 2008 in 6 high-impact general medical journals, and likewise observed an overwhelmingly poor level of reporting.”
From Transparent Reporting of a Multivariable Prediction Model for Individual Prognosis or Diagnosis (TRIPOD): The TRIPOD Statement (2015) · cites this paper as [23]
In the citing paper
“Many reviews have showed that the quality of reporting in published articles describing the development or validation of multivariable prediction models in medicine is poor.23–27,29”
From Transparent Reporting of a Multivariable Prediction Model for Individual Prognosis or Diagnosis (TRIPOD): The TRIPOD Statement (2015) · cites this paper as [23]
Self-check
Percentages, sums and reported differences re-computed from the paper’s own numbers.
Each contradiction between two passages listed here was confirmed by an independent check.
Rated minor: it would not touch a result — a value no result rests on, a p-value that stays on the same side of the significance level, or a conflict that is clerical, resolved elsewhere in the paper, or outside its own findings.
In the paper
“| Similar predictors combinedd | 17 (8) | 6 (1) | 11 (7) |”
§ Reporting and Methods in Clinical Prediction Research: A Systematic Review > Results > Selection of Candidate and Final Predictors
Reported 7 · recomputed 9
Rated minor: it would not touch a result — a value no result rests on, a p-value that stays on the same side of the significance level, or a conflict that is clerical, resolved elsewhere in the paper, or outside its own findings.
In the paper
“| Not reported or unclear | 35 (18) | 53 (9) | 0 (0) | 0 (0) | 38 (27) |”
§ Reporting and Methods in Clinical Prediction Research: A Systematic Review > Results > Missing Values
Reported 35 · recomputed 37.5
Rated minor: it would not touch a result — a value no result rests on, a p-value that stays on the same side of the significance level, or a conflict that is clerical, resolved elsewhere in the paper, or outside its own findings.
In the paper
“| Time to event | 48 (30) |”
§ Reporting and Methods in Clinical Prediction Research: A Systematic Review > Results > Outcome
Reported 48 · recomputed 44.117647
Rated minor: it would not touch a result — a value no result rests on, a p-value that stays on the same side of the significance level, or a conflict that is clerical, resolved elsewhere in the paper, or outside its own findings.
In the paper
§ Reporting and Methods in Clinical Prediction Research: A Systematic Review > Results > Selection of Candidate and Final Predictors
“48 predictor finding studies, 17 model development studies, or 65 total”
§ Reporting and Methods in Clinical Prediction Research: A Systematic Review > Results > Presentation of Results
“| Type of Result Presented | Predictor Finding Studies (n = 51) | Development Studies (n = 14) | Total (n = 65)a |”
Rated minor: it would not touch a result — a value no result rests on, a p-value that stays on the same side of the significance level, or a conflict that is clerical, resolved elsewhere in the paper, or outside its own findings.
In the paper
“| Change in C-statistic | 10; 14 (5) | 0; 0 (0) | 9; 13 (6) |”
§ Reporting and Methods in Clinical Prediction Research: A Systematic Review > Results > Selection of Candidate and Final Predictors
Reported 6 · recomputed 5
Citations
Cites
von Elm, E., Altman, D. G., Egger, M., Pocock, S. J., Gøtzsche, P. C., Vandenbroucke, J. P., & Initiative, F. T. S. (2007) · PLoS Medicine · doi:10.1371/journal.pmed.0040296 · Cited by 23,020
Self-citationvon Elm, E., Altman, D. G., Egger, M., Pocock, S. J., Gøtzsche, P. C., & Vandenbroucke, J. P. (2007) · The Lancet · doi:10.1016/s0140-6736(07)61602-x · Cited by 21,320
Self-citationA simulation study of the number of events per variable in logistic regression analysis
Peduzzi, P., Concato, J., Kemper, E., Holford, T. R., & Feinstein, A. R. (1996) · Journal of Clinical Epidemiology · doi:10.1016/s0895-4356(96)00236-3 · Cited by 9,655
Regression Modeling Strategies
Harrell, F. E. (2001) · Springer series in statistics · doi:10.1007/978-1-4757-3462-1 · Cited by 9,270
Moher, D., Hopewell, S., Schulz, K. F., Montori, V., Gotzsche, P. C., Devereaux, P. J., Elbourne, D., Egger, M., & Altman, D. G. (2010) · BMJ · doi:10.1136/bmj.c869 · Cited by 8,883
Self-citationVandenbroucke, J. P., von Elm, E., Altman, D. G., Gøtzsche, P. C., Mulrow, C. D., Pocock, S. J., Poole, C., Schlesselman, J. J., Egger, M., & Initiative, F. T. S. (2007) · PLoS Medicine · doi:10.1371/journal.pmed.0040297 · Cited by 8,613 · cited 1×
“, from a multivariable analysis) [4,38,63].”
Self-citationRelaxing the Rule of Ten Events per Variable in Logistic and Cox Regression
Vittinghoff, E., & McCulloch, C. E. (2007) · American Journal of Epidemiology · doi:10.1093/aje/kwk052 · Cited by 4,359
Whiting, P., Rutjes, A. W., Reitsma, J. B., Bossuyt, P. M., & Kleijnen, J. (2003) · BMC Medical Research Methodology · doi:10.1186/1471-2288-3-25 · Cited by 3,592
Vandenbroucke, J. P., Elm, E. V., Altman, D. G., Gøtzsche, P. C., Mulrow, C. D., Pocock, S. J., Poole, C., Schlesselman, J. J., Egger, M., & initiative, F. T. S. (2007) · Annals of Internal Medicine · doi:10.7326/0003-4819-147-8-200710160-00010-w1 · Cited by 3,543
Self-citationClinical Prediction Models: A Practical Approach to Development, Validation, and Updating
Steyerberg, E. W. (2019) · Statistics for Biology and Health · doi:10.1007/978-3-030-16399-0 · Cited by 3,281
Self-citation
Cited by
Sorted by citations
Items 101–200 of 579
van de Glind, E. M. M., Munster, B. C. V., van de Wetering, F. T., van Delden, J. J. M., Scholten, R. J. P. M., & Hooft, L. (2013) · BMC Geriatrics · doi:10.1186/1471-2318-13-68 · Cited by 94
“Nor did we perform a metaanalysis of the prognostic accuracy of the various individual prognostic factors, since we expected substantial heterogeneity between the primary studies, for example in the number and type of covariates that were studied and, more importantly, in the predictors that were included in a multiva…”
MethodAssociation is not prediction: A landscape of confused reporting in diabetes – A systematic review
Varga, T. V., Niss, K., Estampador, A. C., Collin, C. B., & Moseley, P. L. (2020) · Diabetes Research and Clinical Practice · doi:10.1016/j.diabres.2020.108497 · Cited by 94
Grosen, K., Vase, L., Pilegaard, H. K., Pfeiffer‐Jensen, M., & Drewes, A. M. (2014) · PLoS ONE · doi:10.1371/journal.pone.0090185 · Cited by 95
“Another explanation for this observation may be based on evidence that a combined endpoint may cause problems if the predictor effect is in opposite directions for different outcomes included in the composite endpoint [82].”
BackgroundKey steps and common pitfalls in developing and validating risk models
Wynants, L., Collins, P. G. S., & CALSTER, B. V. (2016) · BJOG An International Journal of Obstetrics & Gynaecology · doi:10.1111/1471-0528.14170 · Cited by 99
Studerus, E., Ramyead, A., & Riecher‐Rössler, A. (2017) · Psychological Medicine · doi:10.1017/s0033291716003494 · Cited by 95
“reviews evaluating prediction research in other medical fields (Mushkudiani et al. 2008; Mallett et al. 2010; Collins et al. 2011, 2013; Bouwmeester et al. 2012; van Oort et al. 2012), existing reporting statements and checklists [i.”
BackgroundResultInfluentialSystematic review of prediction models for gestational hypertension and preeclampsia
Antwi, E., Amoakoh‐Coleman, M., Vieira, D. L., Madhavaram, S., Koram, K. A., Grobbee, D. E., Agyepong, I. A., & Klipstein‐Grobusch, K. (2020) · PLoS ONE · doi:10.1371/journal.pone.0230955 · Cited by 101
Tjeertes, E. K. M., van Fessem, J. M. K., Mattace-Raso, F. U. S., Hoofwijk, A. G. M., Stolker, R. J., & Hoeks, S. E. (2020) · Aging and Disease · doi:10.14336/ad.2019.1024 · Cited by 97
“Recently, relevant developments have been made towards methodological frameworks, in order to improve the reliability and applicability of prediction studies [31].”
BackgroundTRIPOD statement: a preliminary pre-post analysis of reporting and methods of prediction models
Najafabadi, A. H. Z., Ramspek, C. L., Dekker, F. W., Heus, P., Hooft, L., Moons, K. G. M., Peul, W. C., Collins, P. G. S., Steyerberg, E. W., & van Diepen, M. (2020) · BMJ Open · doi:10.1136/bmjopen-2020-041537 · Cited by 93
Self-citationRutten, M. J., van de Vrie, R., Bruining, A., Spijkerboer, A. M., Mol, B. W., Kenter, G. G., & Buist, M. R. (2015) · International Journal of Gynecological Cancer · doi:10.1097/igc.0000000000000368 · Cited by 92
Prediction models for clustered data: comparison of a random intercept and standard regression model
Bouwmeester, W., Twisk, J. W. R., Kappen, T. H., van Klei, W. A., Moons, K. G. M., & Vergouwe, Y. (2013) · BMC Medical Research Methodology · doi:10.1186/1471-2288-13-19 · Cited by 87
Self-citationPerveen, S., Shahbaz, M., Keshavjee, K., & Guergachi, A. (2018) · IEEE Access · doi:10.1109/access.2018.2884249 · Cited by 87
“However, numerous research articles have reported that in practice better classification performance could be gained by having balanced class distribution dataset [28].”
BackgroundVernooij, L. M., van Klei, W. A., Moons, K. G. M., Takada, T., van Waes, J. A. R., & Damen, J. A. (2021) · Cochrane Database of Systematic Reviews · doi:10.1002/14651858.cd013139.pub2 · Cited by 92
Self-citationDebray, T. P. A., Collins, P. G. S., Riley, R. D., Snell, K. I. E., CALSTER, B. V., Reitsma, J. B., & Moons, K. G. M. (2023) · BMJ · doi:10.1136/bmj-2022-071018 · Cited by 101
Self-citationLee, A. S. Y., Mu, J., Joynt, G. M., Chiu, C. H., Lai, V. K. W., Gin, T., & Underwood, M. J. (2017) · British Journal of Anaesthesia · doi:10.1093/bja/aew476 · Cited by 88
Navarro, C. L. A., Damen, J. A., Takada, T., Nijman, S. W. J., Dhiman, P., Ma, J., Collins, P. G. S., Bajpai, R. C., Riley, R. D., Moons, K. G. M., et al. (2020) · BMJ Open · doi:10.1136/bmjopen-2020-038832 · Cited by 82
Self-citationWardlaw, J. M., Brazzelli, M. G., Miranda, H., Chappell, F. M., McNamee, P., Scotland, G., Quayyum, Z., Martin, D., Shuler, K., Sandercock, P. A., et al. (2014) · Health Technology Assessment · doi:10.3310/hta18270 · Cited by 85
Mulder, F. I., van Es, N., Kraaijpoel, N., et al. (2019) · Thrombosis Research · doi:10.1016/j.thromres.2019.11.007 · Cited by 81
Warfarin dosing algorithms: A systematic review
Asiimwe, I. G., Zhang, E. J., Osanlou, R., Jorgensen, A., & Pirmohamed, M. (2020) · British Journal of Clinical Pharmacology · doi:10.1111/bcp.14608 · Cited by 86
“In the context of not adhering to current methodological recommendations, warfarin dosing algorithms may not be unique.(50,51) The consequences of most of the design flaws have been previously described in detail.”
BackgroundCan quantitative sensory testing predict responses to analgesic treatment?
Grosen, K., Fischer, I. W. D., Olesen, A. E., & Drewes, A. M. (2013) · European Journal of Pain · doi:10.1002/j.1532-2149.2013.00330.x · Cited by 81
“The assessment of model performance is important for understanding how predictions from the model correspond to the observed outcomes (Bouwmeester et al., 2012).”
BackgroundInfluentialCnossen, M. C., Scholten, A. C., Lingsma, H. F., Synnot, A., Haagsma, J., Steyerberg, P. E. W., & Polinder, S. (2017) · The Journal of Neuropsychiatry and Clinical Neurosciences · doi:10.1176/appi.neuropsych.16090165 · Cited by 79
Gerry, S., Birks, J., Bonnici, T., Watkinson, P., Kirtley, S., & Collins, P. G. S. (2017) · BMJ Open · doi:10.1136/bmjopen-2017-019268 · Cited by 82
Personalising lung cancer screening: An overview of risk‐stratification opportunities and challenges
ten Haaf, K., van der Aalst, C. M., de Koning, H. J., Kaaks, R., & Tammemägi, M. C. (2021) · International Journal of Cancer · doi:10.1002/ijc.33578 · Cited by 80
Risk of bias of prognostic models developed using machine learning: a systematic review in oncology
Dhiman, P., Ma, J., Andaur Navarro, C. L., Speich, B., Bullock, G., Damen, J. A. A., Hooft, L., Kirtley, S., Riley, R. D., Van Calster, B., et al. (2022) · Diagnostic and Prognostic Research · doi:10.1186/s41512-022-00126-w · Cited by 79
“However, compared to the number of prediction models that are developed in oncology, very few are used in daily practice and many models contribute to research waste [14–17].”
BackgroundSelf-citationOgink, P. T., Groot, O. Q., Karhade, A. V., Bongers, M. E. R., Öner, F. C., Verlaan, J., & Schwab, J. H. (2021) · Acta Orthopaedica · doi:10.1080/17453674.2021.1932928 · Cited by 77
“Despite the importance of performance metrics, a mere one-third of prediction models included information on calibration, similar to prior studies assessing prediction models in multiple medical domains (Bouwmeester et al. 2012, Heus et al. 2018).”
MethodYang, C. B., Kors, J. A., Ioannou, S., John, L. H., Markus, A. F., Rekkas, A., de Ridder, M. A. J., Seinen, T. M., Williams, R. D., & Rijnbeek, P. R. (2022) · Journal of the American Medical Informatics Association · doi:10.1093/jamia/ocac002 · Cited by 81
“Previous systematic reviews on the development and validation of clinical prediction models covered different periods prior to 2015.(1,5,6) They all highlighted a number of improvements to allow for better interpretation of the presented results by other investigators: how missing data were handled should always expli…”
BackgroundPredicting 5-Year Risk of RRT in Stage 3 or 4 CKD: Development and External Validation
Schroeder, E. B., Yang, X., Thorp, M. L., Arnold, B. M., Tabano, D. C., Petrik, A. F., Smith, D. H., Platt, R. W., & Johnson, E. S. (2016) · Clinical Journal of the American Society of Nephrology · doi:10.2215/cjn.01290216 · Cited by 75
Tackling COVID-19 Through Responsible AI Innovation: Five Steps in the Right Direction
Leslie, D. (2020) · Harvard Data Science Review · doi:10.1162/99608f92.4bb9d7a7 · Cited by 103
Groot, O. Q., Bindels, B. J. J., Ogink, P. T., Kapoor, N. D., Twining, P. K., Collins, A. K., Bongers, M. E. R., Lans, A., Oosterhoff, J. H. F., Karhade, A. V., et al. (2021) · Acta Orthopaedica · doi:10.1080/17453674.2021.1910448 · Cited by 77
“Other key characteristics recommended evaluating a model’s performance such as calibration, and whether decision-curve analysis was inadequately or not reported, as observed here and in similar reviews (Collins et al. 2011, 2014, Bouwmeester et al. 2012, Tangri et al. 2013).”
ResultMa, J., Dhiman, P., Qi, C., Bullock, G. S., van Smeden, M., Riley, R. D., & Collins, P. G. S. (2023) · Journal of Clinical Epidemiology · doi:10.1016/j.jclinepi.2023.07.017 · Cited by 84
“Existing reviews of evaluating the methodological conduct of prediction model studies have observed that continuous predictors are frequently handled poorly (e.g., categorized [20 e 22]) but do not go into more detail.”
InfluentialMeta‐analysis and aggregation of multiple published prediction models
Debray, T. P. A., Koffijberg, H., Nieboer, D., Vergouwe, Y., Steyerberg, E. W., & Moons, K. G. M. (2014) · Statistics in Medicine · doi:10.1002/sim.6080 · Cited by 73
“Critically appraising prior evidence during the systematic review process can help to expose this and guide the selection of appropriate updating and/or aggregation approaches [44].”
BackgroundMethodSelf-citationWasson, J. H., Ho, L., Soloway, L. E., & Moore, L. G. (2018) · PLoS ONE · doi:10.1371/journal.pone.0192475 · Cited by 72
Steyerberg, E. W., Nieboer, D., Debray, T. P. A., & van Houwelingen, H. C. (2019) · Statistics in Medicine · doi:10.1002/sim.8296 · Cited by 77
Self-citationBull, L. M., Lunt, M., Martin, G. P., Hyrich, K. L., & Sergeant, J. C. (2020) · Diagnostic and Prognostic Research · doi:10.1186/s41512-020-00078-z · Cited by 69
“Binary and time-to-event outcomes are of primary interest here as they are the most commonly reported amongst the prediction-modelling literature [6, 7].”
Zemek, R. L., Osmond, M. H., & Barrowman, N. (2013) · BMJ Open · doi:10.1136/bmjopen-2013-003550 · Cited by 74
“62 Further, a recent systematic review examining the methodology of clinical prediction rule studies endorses this recommendation.(63) On the basis of preliminary work, we identified 46 potential pre-”
BackgroundAbbasi, A., Sahlqvist, A., Lotta, L. A., Brosnan, J. M., Vollenweider, P., Giabbanelli, P. J., Nunez, D. J., Waterworth, D. M., Scott, R. A., Langenberg, C., et al. (2016) · PLoS ONE · doi:10.1371/journal.pone.0163721 · Cited by 65
“We have made a very deliberate distinction in this review between the interpretation of biomarkers as indicators of underlying patho-physiological pathways to diabetes, as opposed to the assessment of their utility in clinical prediction [21][42].”
BackgroundInfluentialHow to Write Statistical Analysis Section in Medical Research
Dwivedi, A. K. (2022) · Journal of Investigative Medicine · doi:10.1136/jim-2022-002479 · Cited by 74
“18 Examples Some review studies highlighted that 73.8%–92% of the articles published in MEDLINE had not assessed the model diagnostics of the multivariable regression models.”
InfluentialVenema, E., Wessler, B. S., Paulus, J. K., Salah, R., Raman, G., Leung, L. Y., Koethe, B. C., Nelson, J., Park, J. G., Klaveren, D. V., et al. (2021) · Journal of Clinical Epidemiology · doi:10.1016/j.jclinepi.2021.06.017 · Cited by 65
Self-citationKareemi, H., Vaillancourt, C., Rosenberg, H., Fournier, K., & Yadav, K. (2020) · Academic Emergency Medicine · doi:10.1111/acem.14190 · Cited by 65
“21,40 Unlike discrimination, calibration was reported in only one included study; thus it could not be adequately assessed.”
BackgroundMethodInfluentialvan Royen, F. S.-A., Moons, K. G. M., Geersing, G., & van Smeden, M. (2022) · European Respiratory Journal · doi:10.1183/13993003.00250-2022 · Cited by 62
Self-citationMatharu, G. S., Berryman, F., Judge, A., et al. (2017) · Journal of Bone and Joint Surgery · doi:10.2106/jbjs.16.01568 · Cited by 62
Claude, L.-A., Houenou, J., Duchesnay, É., & Favre, P. (2020) · Bipolar Disorders · doi:10.1111/bdi.12895 · Cited by 65
Prediction models for depression risk among older adults: systematic review and critical appraisal
Tan, J., Ma, C., Zhu, C., Wang, Y., Zou, X., Li, H., Li, J., He, Y., & Wu, C. (2022) · Ageing Research Reviews · doi:10.1016/j.arr.2022.101803 · Cited by 64
Validation of a prognostic index for Huntington's disease
Long, J. D., Langbehn, D. R., Tabrizi, S. J., Landwehrmeyer, G. B., Paulsen, J. S., Warner, J., & Sampaio, C. (2016) · Movement Disorders · doi:10.1002/mds.26838 · Cited by 62
Loymans, R. J. B., Debray, T. P. A., Honkoop, P., Termeer, E. H., Snoeck-Stroband, J. B., Schermer, T. R., Assendelft, W. J., Timp, M. L., Chung, K. F., Sousa, A. R., et al. (2018) · The Journal of Allergy and Clinical Immunology In Practice · doi:10.1016/j.jaip.2018.02.004 · Cited by 61
Bayesian networks in healthcare: What is preventing their adoption?
Kyrimi, E., Dube, K., Fenton, N., Fahmi, A., Neves, M. R., Marsh, W., & McLachlan, S. (2021) · Artificial Intelligence in Medicine · doi:10.1016/j.artmed.2021.102079 · Cited by 62
A Prediction Rule to Stratify Mortality Risk of Patients with Pulmonary Tuberculosis
Bastos, H. N., Osório, N. S., Castro, A. G., Ramos, A., Carvalho, T., Meira, L., Araújo, D., Almeida, L. M., Boaventura, R. D. P., Fragata, P., et al. (2016) · PLoS ONE · doi:10.1371/journal.pone.0162797 · Cited by 60
“Using backward selection [23], a final parsimonious model with 5 predictors (Table 2, S1 Fig) was generated.”
MethodZheng, X., He, B., Hu, Y., Ren, M., Chen, Z., Zhang, Z., Ma, J., Ouyang, L., Chu, H., Gao, H., et al. (2022) · Frontiers in Public Health · doi:10.3389/fpubh.2022.938113 · Cited by 59
“For example, if the answer to all the landmark questions in a range is “yes,” then it can be rated as low risk of bias; if all the informational questions are answered “no,” then the risk of bias is rated as “high” (9).”
BackgroundQuality of first trimester risk prediction models for pre‐eclampsia: a systematic review
Brunelli, V., & Prefumo, F. (2015) · BJOG An International Journal of Obstetrics & Gynaecology · doi:10.1111/1471-0528.13334 · Cited by 59
Wang, R. C., Bent, S., Weber, E. J., Neilson, J., Smith‐Bindman, R., & Fahimi, J. (2015) · Annals of Emergency Medicine · doi:10.1016/j.annemergmed.2015.11.005 · Cited by 58
Grangeiro, A., Couto, M. T., Peres, M. F. T., Luiz, O. D. C., Zucchi, E. M., de Castilho, E. A., Estevam, D. L., Alencar, R., Wolffenbüttel, K., Escuder, M. M. L., et al. (2015) · BMJ Open · doi:10.1136/bmjopen-2015-009021 · Cited by 57
Collins, P. G. S., Reitsma, J. B., Altman, D. G., & Moons, K. G. M. (2015) · European Journal of Clinical Investigation · doi:10.1111/eci.12376 · Cited by 62
Self-citationCohen, J. F., Cohen, R., Lévy, C., Thollot, F., Benani, M., Bidet, P., & Chalumeau, M. (2014) · Canadian Medical Association Journal · doi:10.1503/cmaj.140772 · Cited by 57
Ramspek, C. L., Voskamp, P. W. M., van Ittersum, F. J., Krediet, R. T., Dekker, F. W., & van Diepen, M. (2017) · Clinical Epidemiology · doi:10.2147/clep.s139748 · Cited by 56
“Similar problems gave rise to the development of the TRIPOD guidelines and were also described in a review by Bouwmeester et al, in which it was concluded that the majority of prediction studies do not follow current methodological recommendations.(20,46) The current study externally validated seven models (presented…”
Gulati, G., Upshaw, J., Wessler, B. S., Brazil, R. J., Nelson, J., Klaveren, D. V., Lundquist, C. M., Park, J. G., McGinnes, H., Steyerberg, E. W., et al. (2022) · Circulation Cardiovascular Quality and Outcomes · doi:10.1161/circoutcomes.121.008487 · Cited by 62
Self-citationPrediction models for the incidence and progression of periodontitis: A systematic review
Du, M., Bo, T., Kapellas, K., & Peres, M. A. (2018) · Journal Of Clinical Periodontology · doi:10.1111/jcpe.13037 · Cited by 54
Khalifa, M., Magrabi, F., & Gallego, B. (2019) · BMC Medical Informatics and Decision Making · doi:10.1186/s12911-019-0940-7 · Cited by 58
Systematic review on the predictive ability of frailty assessment measures in cardiac surgery
Abdullahi, Y. S., Athanasopoulos, L. V., Casula, R., Moscarelli, M., Bagnall, N. M., Ashrafian, H., & Athanasiou, T. (2016) · Interactive Cardiovascular and Thoracic Surgery · doi:10.1093/icvts/ivw374 · Cited by 54
Dekker, A. L. A. J., Vinod, S. K., Holloway, L. C., Oberije, C., George, A., Goozée, G., Delaney, G. P., Lambin, P., & Thwaites, D. (2014) · Radiotherapy and Oncology · doi:10.1016/j.radonc.2014.08.013 · Cited by 51
“The predictive performance of the DSS was assessed in terms of discrimination and calibration [13].”
MethodValenzuela‐Silva, C., Tuero-Iglesias, Á. D., García‐Iglesias, E., et al. (2012) · Diabetes Care · doi:10.2337/dc12-1323 · Cited by 51
“On the other hand, as a measure of statistical power, $10 events per predictor is considered suitable, taking all the candidates and the other covariates (25,26).”
BackgroundShafieiBavani, E., Goudey, B., Kiral-Kornek, I., Zhong, P., Yepes, A. J., Swan, A. J., Gambhir, M., Buechner, A., Kludt, E., Eikelboom, R. H., et al. (2021) · Trends in Hearing · doi:10.1177/23312165211066174 · Cited by 55
“The use of machine learning models playing the role of support for decision makers, rather than directly determining a decision, is similar to a long history of statistical screening tests (Moons et al.,2009; Collins et al.,2015; Bouwmeester et al.,2012).”
Kreuzberger, N., Damen, J. A., Trivella, M., Estcourt, L. J., Aldin, A., Umlauff, L., Vazquez-Montes, M., Wolff, R. F., Moons, K. G. M., Monsef, I., et al. (2020) · Cochrane Database of Systematic Reviews · doi:10.1002/14651858.cd012022.pub2 · Cited by 49
Self-citationDeveloping and Evaluating Prediction Models in Rehabilitation Populations
Seel, R. T., Steyerberg, E. W., Malec, J. F., Sherer, M., & Macciocchi, S. N. (2012) · Archives of Physical Medicine and Rehabilitation · doi:10.1016/j.apmr.2012.04.021 · Cited by 49
“lation, insufficient power, too many predictors studied, high sample attrition, overfitting, and lack of model validation.(8,24,25) This article presents a 3-part framework for developing and evaluating prediction models in rehabilitation populations.”
Self-citationTakeshima, T., Yamamoto, Y., Noguchi, Y., Maki, N., Gibo, K., Tsugihashi, Y., Doi, A., Fukuma, S., Yamazaki, S., Kajii, E., et al. (2016) · PLoS ONE · doi:10.1371/journal.pone.0148078 · Cited by 49
“[39] The data that were most commonly missing were respiratory rate (24.”
BackgroundCritical Assessment of Clinical Prognostic Tools in Melanoma
Mahar, A. L., Compton, C. C., Halabi, S., Hess, K. R., Gershenwald, J. E., Scolyer, R. A., & Groome, P. A. (2016) · Annals of Surgical Oncology · doi:10.1245/s10434-016-5212-5 · Cited by 49
Clinical prediction rules for prognosis and treatment prescription in neck pain: A systematic review
Kelly, J., Ritchie, C., & Sterling, M. M. (2016) · Musculoskeletal Science and Practice · doi:10.1016/j.math.2016.10.066 · Cited by 48
Challenges and Opportunities in the Statistical Analysis of Multiplex Immunofluorescence Data
Wilson, C. M., Ospina, O. E., Townsend, M. K., Nguyen, J. V., Segura, C. M., Schildkraut, J. M., Tworoger, S. S., Peres, L. C., & Fridley, B. L. (2021) · Cancers · doi:10.3390/cancers13123031 · Cited by 53
“An alternative approach for setting the pre-defined threshold is to determine the “optimal cut-point”, which is selected to maximize the test statistic of interest [83,84].”
BackgroundAldin, A., Umlauff, L., Estcourt, L. J., Collins, P. G. S., Moons, K. G. M., Engert, A., Kobe, C., von Tresckow, B., Haque, M., Foroutan, F., et al. (2020) · Cochrane Database of Systematic Reviews · doi:10.1002/14651858.cd012643.pub3 · Cited by 52
Self-citationDamen, J. A., Debray, T. P. A., Pajouheshnia, R., Reitsma, J. B., Scholten, R. J. P. M., Moons, K. G. M., & Hooft, L. (2019) · BMJ Open · doi:10.1136/bmjopen-2018-026160 · Cited by 46
Self-citationWynants, L., Kent, D. M., Timmerman, D., Lundquist, C. M., & CALSTER, B. V. (2019) · Diagnostic and Prognostic Research · doi:10.1186/s41512-019-0046-9 · Cited by 47
“Some have criticized vagueness of reported selection criteria, such that it remained unclear whether participants were selected in an unbiased way [85], and specialist fields contributing the majority of models, which are unlikely to be generalizable to general hospital populations [80].”
BackgroundMedina‐Lara, A., Grigore, B., Lewis, R. A., Peters, J., Price, S., Landa, P., Robinson, S., Neal, R. D., Hamilton, W. T., & Spencer, A. E. (2020) · Health Technology Assessment · doi:10.3310/hta24660 · Cited by 49
Gravesteijn, B. Y., Sewalt, C. A., Venema, E., Nieboer, D., Steyerberg, E. W., Åkerlund, C. A. I., Amrein, K., Anđelić, N., Andreassen, L., Anke, A., et al. (2021) · Journal of Neurotrauma · doi:10.1089/neu.2020.7218 · Cited by 45
“46 In this context, we recommend multiple imputation, because it is a readily implementable procedure and generally superior to simple approaches, such as a complete case analysis.”
Self-citationBeneciuk, J. M., Lentz, T. A., He, Y., Wu, S. S., & George, S. Z. (2018) · Physical Therapy · doi:10.1093/ptj/pzy021 · Cited by 45
de Jong, Y., Ramspek, C. L., van der Endt, V. H. W., Rookmaaker, M. B., Blankestijn, P. J., Vernooij, R. W. M., Verhaar, M. C., Bos, W. J. W., Dekker, F. W., Ocak, G., et al. (2020) · Journal of Clinical Epidemiology · doi:10.1016/j.jclinepi.2020.03.015 · Cited by 45
Method for Data Quality Assessment of Synthetic Industrial Data
Iantovics, L. B., & Enăchescu, C. (2022) · Sensors · doi:10.3390/s22041608 · Cited by 44
“The applications in healthcare basically can be classified into two classes [23–25], namely prognostic prediction and diagnostic prediction.”
BackgroundBarreñada, L., Ledger, A., Dhiman, P., Collins, G., Wynants, L., Verbakel, J. Y., Timmerman, D., Valentin, L., & Van Calster, B. (2024) · BMJ Medicine · doi:10.1136/bmjmed-2023-000817 · Cited by 42
Machine Learning in the Prediction of Trauma Outcomes: A Systematic Review
Zhang, T., Nikouline, A., Lightfoot, D., & Nolan, B. (2022) · Annals of Emergency Medicine · doi:10.1016/j.annemergmed.2022.05.011 · Cited by 44
Haskins, R., Osmotherly, P. G., & Rivett, D. A. (2015) · Journal of Clinical Epidemiology · doi:10.1016/j.jclinepi.2015.02.003 · Cited by 41
“The study sample size should also be justified and sufficiently large to ensure at least 10 outcome events per candidate predictor variable [29,43].”
BackgroundThe Role of Risk Prediction Models in Prevention and Management of AKI
Hodgson, L. E., Selby, N. M., Huang, T., & Forni, L. G. (2019) · Seminars in Nephrology · doi:10.1016/j.semnephrol.2019.06.002 · Cited by 42
Alblas, M., Velt, K., Pashayan, N., Widschwendter, M., Steyerberg, E. W., & Vergouwe, Y. (2018) · Critical Reviews in Oncology/Hematology · doi:10.1016/j.critrevonc.2018.03.023 · Cited by 42
“Shortcomings in methodology were found in almost all studies, which is consistent with the findings from other systematic reviews on prediction models in different research areas (Damen et al., 2016; Mushkudiani et al., 2008; Collins et al., 2013; Bouwmeester et al., 2012).”
ResultSelf-citationRefining Prognosis in Lung Cancer
Mahar, A. L., Compton, C. C., McShane, L. M., Halabi, S., Asamura, H., Rami–Porta, R., & Groome, P. A. (2015) · Journal of Thoracic Oncology · doi:10.1097/jto.0000000000000652 · Cited by 40
“TABLE 3 A Description of Quality Criteria of Prognostic Tools Targeting Prognosis for Patients with Lung Cancer (n = 32) Quality Criteria N (%) Prognostic factor selection method Literature-based/clinical reasoning 8 (25) Screened using univariate analysis 4 (13) Available in existing data set 2 (6) Not reported 18 (5…”
MethodWalker, A. J., West, J., Card, T. R., Humes, D. J., & Grainge, M. J. (2014) · Journal of Thrombosis and Haemostasis · doi:10.1111/jth.12533 · Cited by 39
Evaniew, N., Cadotte, D. W., Dea, N., Bailey, C. S., Christie, S., Fisher, C. G., Paquet, J., Soroceanu, A., Thomas, K. C., Rampersaud, Y. R., et al. (2020) · Journal of Neurosurgery Spine · doi:10.3171/2020.2.spine191495 · Cited by 39
Bridge, J., Blakey, J., & Bonnett, L. J. (2020) · BMC Medical Research Methodology · doi:10.1186/s12874-020-0913-7 · Cited by 38
Semi-supervised learning to improve generalizability of risk prediction models
Chi, S., Li, X., Tian, Y., Li, J., Kong, X., Ding, K., Weng, C., & Li, J. (2019) · Journal of Biomedical Informatics · doi:10.1016/j.jbi.2019.103117 · Cited by 40
Buettner, S., Galjart, B., Beumer, B. R., van Vugt, J. L. A., van Eijck, C. H. J., Polak, W. G., de Jonge, J., Homs, M. Y. V., van Driel, L. M. J. W., Pawlik, T. M., et al. (2020) · HPB · doi:10.1016/j.hpb.2020.07.007 · Cited by 39
Self-citationRisk factors of recurrent anal sphincter ruptures: a population‐based cohort study
Jangö, H., Langhoff‐Roos, J., Rosthøj, S., et al. (2012) · BJOG An International Journal of Obstetrics & Gynaecology · doi:10.1111/j.1471-0528.2012.03486.x · Cited by 38
Prognostic Research in Traumatic Brain Injury: Markers, Modeling, and Methodological Principles
Helmrich, I. R., Lingsma, H. F., Turgeon, A. F., Yamal, J., & Steyerberg, E. W. (2020) · Journal of Neurotrauma · doi:10.1089/neu.2019.6708 · Cited by 36
“5,11,15 In prognostic factor studies, we may start with assessing whether the factor”
Self-citationUse of generalised additive models to categorise continuous variables in clinical prediction
Barrio, I., Aróstegui, I., Quintana, J. M., et al. (2013) · BMC Medical Research Methodology · doi:10.1186/1471-2288-13-83 · Cited by 36
“From a practical standpoint, however, continuous predictors are not often considered in the development of CPRs [2,5,6].”
BackgroundRaising the bar in sports performance research
Abt, G., Jobson, S., Morin, J.-B., Passfield, L., Sampaio, J. E., Sunderland, C. D., & Twist, C. (2022) · Journal of Sports Sciences · doi:10.1080/02640414.2021.2024334 · Cited by 45
“Unfortunately, the evidence would suggest that most prediction studies focus on model development rather than external validation (Bouwmeester et al., 2012; Riley et al., 2016).”
BackgroundEpidemiology and risk factors for venous thromboembolism in lung cancer
Ay, C., & Ünal, U. K. (2016) · Current Opinion in Oncology · doi:10.1097/cco.0000000000000262 · Cited by 35
Senior, M., Fanshawe, T. R., Fazel, M. S., & Fazel, S. (2021) · JCPP Advances · doi:10.1002/jcv2.12034 · Cited by 37
Rahimi, A. K., Canfell, O. J., Chan, W., Sly, B. P., Pole, J. D., Sullivan, C. M., & Shrapnel, S. (2022) · International Journal of Medical Informatics · doi:10.1016/j.ijmedinf.2022.104758 · Cited by 35
Reeve, K. A., Ön, B. I., Havla, J. B., Burns, J., Gosteli, M., Alabsawi, A., Alayash, Z., Götschi, A., Seibold, H., Mansmann, U., et al. (2023) · Cochrane Database of Systematic Reviews · doi:10.1002/14651858.cd013606.pub2 · Cited by 37
Thompson, D. D., Murray, G. D., Dennis, M. S., Sudlow, C. L. M., & Whiteley, W. N. (2014) · BMC Medicine · doi:10.1186/1741-7015-12-58 · Cited by 37
“A number of methodological decisions in model development may lead to clinical prediction models that make less accurate predictions [58] and we believe that an agreed set of guidelines in model development and reporting in healthcare would be helpful to developers and users of clinical prediction models alike [59].”
BackgroundChen, Y., Huang, J., He, X., Gao, Y., Mahara, G., Lin, Z., & Zhang, J. (2019) · BMC Medical Research Methodology · doi:10.1186/s12874-019-0738-4 · Cited by 35
Composite Outcomes in Clinical Prediction Modeling: Are We Trying to Predict Apples and Oranges?
Dash, K., Goodacre, S. W., & Sutton, L. (2022) · Annals of Emergency Medicine · doi:10.1016/j.annemergmed.2022.01.046 · Cited by 37
Smith, A. D. A. C., Tilling, K. M., Lawlor, D. A., & Nelson, S. M. (2015) · PLoS ONE · doi:10.1371/journal.pone.0121357 · Cited by 35
Santaguida, P. L., Don-Wauchope, A., Ali, U., Oremus, M., Brown, J. A., Bustamam, A., Hill, S., Booth, R. A., Sohel, N., McKelvie, R. S., et al. (2014) · Heart Failure Reviews · doi:10.1007/s10741-014-9444-9 · Cited by 35
“Incremental predictive value can be evaluated in a number of ways including the use of discrimination, calibration, or reclassification statistics [13, 14].”
MethodTaljaard, M., Tuna, M., Bennett, C. L., Perez, R., Rosella, L. C., Tu, J. V., Sanmartin, C., Hennessy, D. A., Tanuseputro, P., Lebenbaum, M., et al. (2014) · BMJ Open · doi:10.1136/bmjopen-2014-006701 · Cited by 34
“A recent review of 71 published clinical prediction models in high-impact journals found that only one study included external validation during development, and two recalibrated algorithms after publication.(13) Furthermore, none of the 71 algorithms examined calibration for target populations beyond arbitrary risk c…”
BackgroundTackling COVID-19 through Responsible AI Innovation: Five Steps in the Right DirectionPreprint
Leslie, D. (2020) · Harvard data science review · doi:10.2139/ssrn.3652970 · Cited by 78
Metadata
- Authors
- Bouwmeester, W., Zuithoff, N. P. A., Mallett, S., Geerlings, M. I., Vergouwe, Y., Steyerberg, E. W., Altman, D. G., & Moons, K. G. M.
- Affiliations
- University Medical Center Utrecht (NL)
- University of Oxford (GB)
- Erasmus MC (NL)
- Corresponding author
- Moons, Karel G. M.
- ORCID
- Venue
- PLoS Medicine
- Publisher
- Public Library of Science (PLoS)
- Published
- 2012-05-22
- Volume
- 9
- Issue
- 5
- Pages
- e1001221
- ISSN
- 1549-1277 (ISSN-L)
- 1549-1676
- PMC
- PMC3358324
- OpenAlex
- W1998392635
- Semantic Scholar
- 2d86e73e56aa4394fe4ac9a6ed742d850abc73ce
- Cited by
- 600
- References
- 88
- Citations by year
- 2026: 24 · 2025: 39 · 2024: 36 · 2023: 47 · 2022: 65 · 2021: 50 · 2020: 65 · 2019: 36 · 2018: 40 · 2017: 43 · 2016: 40 · 2015: 46 · 2014: 38 · 2013: 24 · 2012: 7
- FWCI
- 5.61
- Type
- journal article
- Language
- en
- Open access
- gold
- doi.org
- Locations
- PLoS Medicine (publishedVersion, cc-by)
- Europe PMC (PubMed Central) (publishedVersion, cc-by)
- PubMed Central (publishedVersion, cc-by)
- PubMed (publishedVersion)
- EUR Research Repository (Erasmus University Rotterdam) (publishedVersion, other-oa)
- EUR Research Repository (Erasmus University Rotterdam) (submittedVersion, other-oa)
- RePub (Erasmus University Rotterdam) (submittedVersion, other-oa)
- RePEc: Research Papers in Economics (submittedVersion)
- DOAJ (DOAJ: Directory of Open Access Journals) (submittedVersion, cc-by-sa)
- Figshare (submittedVersion, cc-by)
- University of Birmingham Research Portal (University of Birmingham) (submittedVersion, other-oa)
- Topics
- Physical Sciences › Mathematics › Statistics and Probability › Statistical Methods in Epidemiology
- Social Sciences › Decision Sciences › Statistics, Probability and Uncertainty › Meta-analysis and systematic reviews
- Health Sciences › Nursing › Research and Theory › Methodologies in Health Research and Practice
- Keywords
- prediction model development, reporting quality, methodological quality, predictor selection, calibration, discrimination (statistics), external validation, prospective cohort, general medical journals
- MeSH terms
- Forecasting, Humans, Periodicals as Topic, Prospective Studies, Research Design, Biomedical Research, Research Report
About these checks
Registry, retraction, Cites and statistics results are computed, not judged, with one exception: a printed reference that no index lists is read once by a model before it counts as a citation error. Claims are extracted by a model and kept only when their quote appears verbatim in the text; each cited source is then checked, with a model’s help, for whether it says what the claim relies on. Those verdicts can be wrong — read the claim’s quote and the cited source before relying on one.
A language model drew the claims from the paper on 2026-10-09, under version 3 of the claim definition (model deepseek-v4.1-flash, prompt extract-v3).
A second model labelled each claim on 2026-10-09 (model jev-1.13-20260917, definition revision gold-guideline-v0.2).
Cited sources are checked with a language model’s help (gpt-6-sol).
Statistics and arithmetic are recomputed, not judged.
Confidence bands are shown only for fields calibrated on our annotated test set. None is calibrated yet, so no band is shown.
What counts as a claim ›How we measure confidence ›How we check this ›
Are you an author, or do you see a problem with this page? Request a review
