

The DOI matches its Crossref record; 43 of the 43 references it cites were found in a registry or an index.
Evidence for the Mitochondrial Lactate Oxidation Complex in Rat Neurons: Demonstration of an Essential Component of Brain Lactate Shuttles
Open accessAbstract
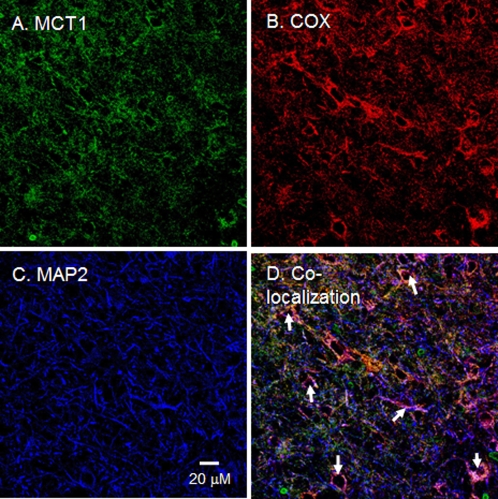
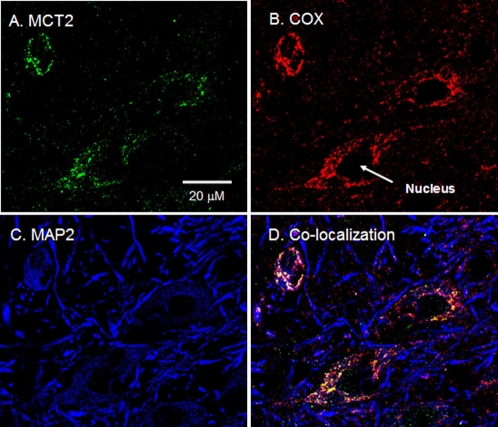
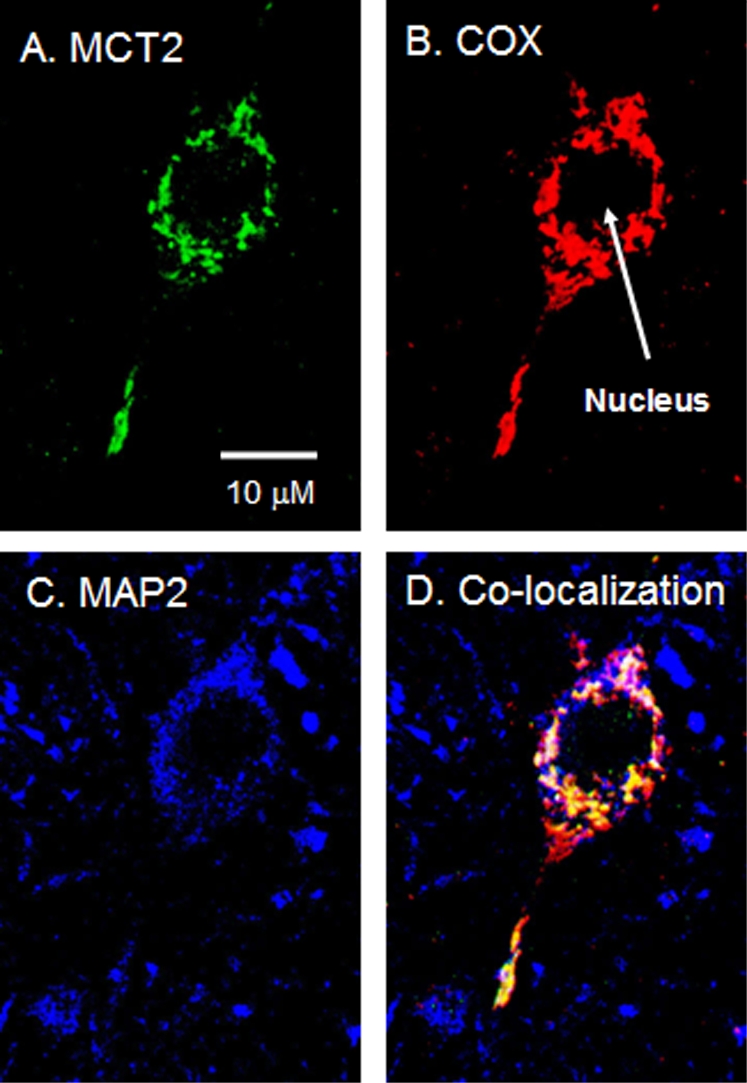
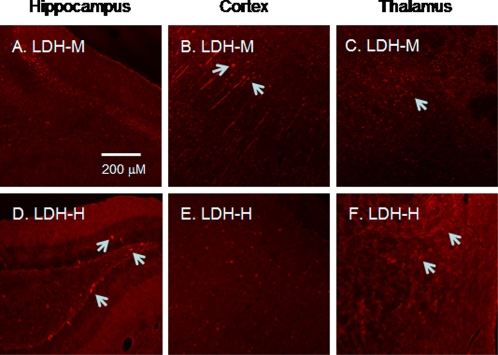
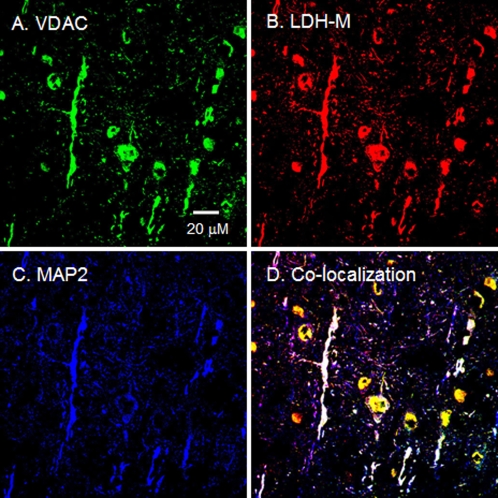
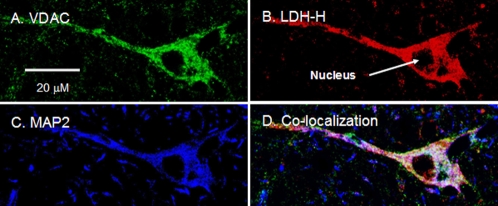
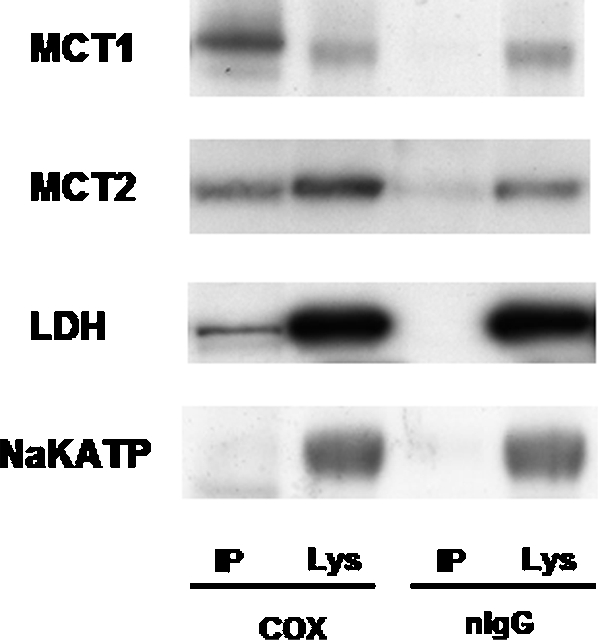
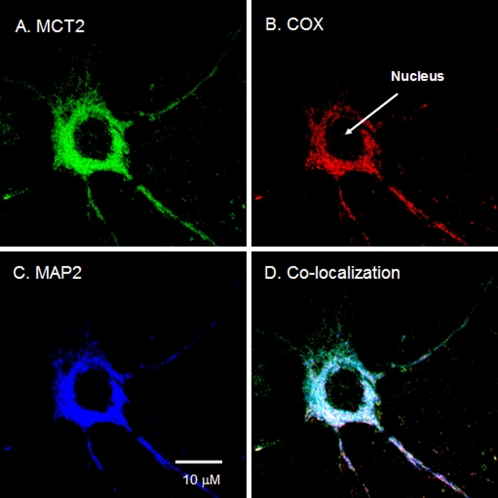
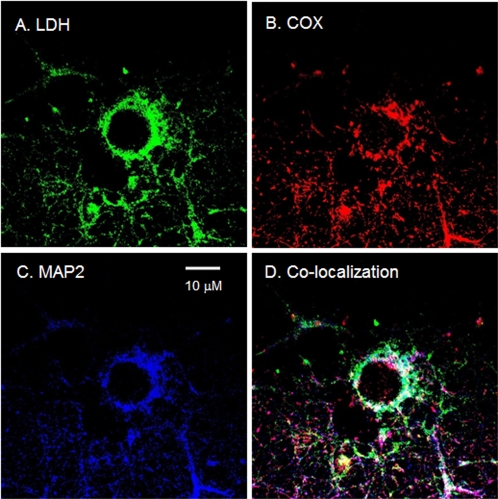
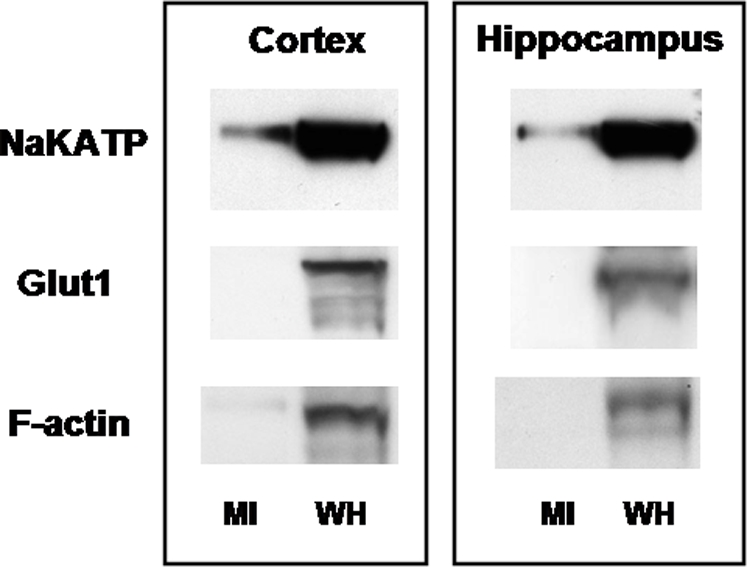
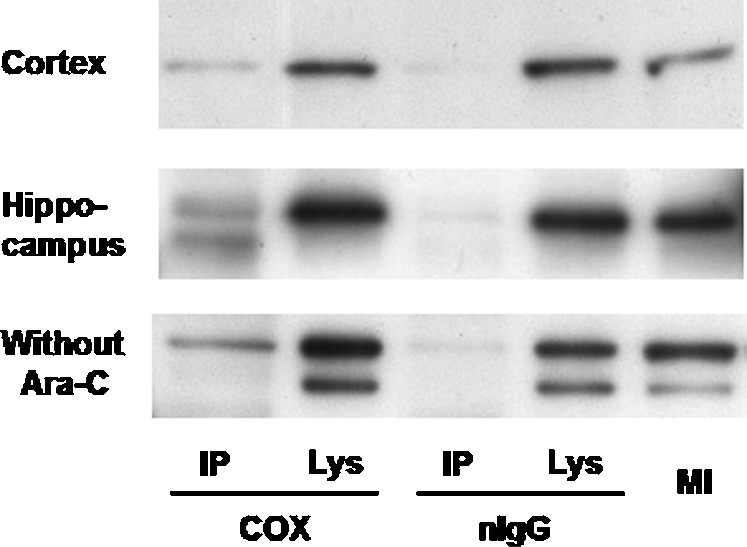
To evaluate the presence of components of a putative Intracellular Lactate Shuttle (ILS) in neurons, we attempted to determine if monocarboxylate (e.g. lactate) transporter isoforms (MCT1 and -2) and lactate dehydrogenase (LDH) are coexpressed in neuronal mitochondria of rat brains. Immunohistochemical analyses of rat brain cross-sections showed MCT1, MCT2, and LDH to colocalize with the mitochondrial inner membrane marker cytochrome oxidase (COX) in cortical, hippocampal, and thalamic neurons. Immunoblotting after immunoprecipitation (IP) of mitochondria from brain homogenates supported the histochemical observations by demonstrating that COX coprecipitated MCT1, MCT2, and LDH. Additionally, using primary cultures from rat cortex and hippocampus as well as immunohistochemistry and immunocoprecipitation techniques, we demonstrated that MCT2 and LDH are coexpressed in mitochondria of cultured neurons. These findings can be interpreted to mean that, as in skeletal muscle, neurons contain a mitochondrial lactate oxidation complex (mLOC) that has the potential to facilitate both intracellular and cell-cell lactate shuttles in brain.
Overview
The claims and statistics of this paper haven’t been checked yet.
Run the check — free, no account needed. It reads the open-access text and checks the sources it cites.
Integrity signals
Registry
Cites
Statistics
Figures
Verification
Claims the paper makes
The claims and statistics of this paper haven’t been checked yet.
Run the check — free, no account needed. It reads the open-access text and checks the sources it cites.
Claims other papers make about this one
Each is checked against this paper’s own text: does it say what the citing paper says it does?
The cited source says what the claim attributes to it.
In the citing paper
“Lactate dehydrogenase-B (LDH) is also present in mitochondria [67] and is oxidatively modified by HNE in MCI hippocampus [56].”
From Mitochondrial Oxidative and Nitrosative Stress and Alzheimer Disease (2020) · cites this paper as [67]
Self-check
Percentages, sums and reported differences re-computed from the paper’s own numbers.
The self-check needs the paper’s full text.
Citations
Cites
Pellerin, L., & Magistretti, P. J. (1994) · Proceedings of the National Academy of Sciences · doi:10.1073/pnas.91.22.10625 · Cited by 2,927 · cited 2×
“Potential importance of lactate for brain metabolism [7] and glutamatergic signaling has been proposed [10].”
BackgroundResultLactate metabolism: a new paradigm for the third millennium
Gladden, L. B. (2004) · The Journal of Physiology · doi:10.1113/jphysiol.2003.058701 · Cited by 1,332
Magistretti, P. J., Pellerin, L., Rothman, D. L., & Shulman, R. G. (1999) · Science · doi:10.1126/science.283.5401.496 · Cited by 1,170
Monocarboxylate transporters in the central nervous system: distribution, regulation and function
Pierre, K., & Pellerin, L. (2005) · Journal of Neurochemistry · doi:10.1111/j.1471-4159.2005.03168.x · Cited by 744
Brooks, G. A., Dubouchaud, H., Brown, M. A., Sicurello, J. P., & Butz, C. E. (1999) · Proceedings of the National Academy of Sciences · doi:10.1073/pnas.96.3.1129 · Cited by 470
Self-citationThe lactate shuttle during exercise and recovery.
Brooks, G. A. (1986) · Medicine & Science in Sports & Exercise · doi:10.1249/00005768-198606000-00019 · Cited by 464
Self-citationBrooks, G. A. (2002) · Biochemical Society Transactions · doi:10.1042/bst0300258 · Cited by 429
Self-citationEndurance training, expression, and physiology of LDH, MCT1, and MCT4 in human skeletal muscle
Dubouchaud, H., Butterfield, G. E., Wolfel, E. E., Bergman, B. C., & Brooks, G. A. (2000) · American Journal of Physiology-Endocrinology and Metabolism · doi:10.1152/ajpendo.2000.278.4.e571 · Cited by 388
Self-citationGlucose and lactate metabolism during brain activation
Dienel, G. A., & Hertz, L. (2001) · Journal of Neuroscience Research · doi:10.1002/jnr.10079 · Cited by 329
Lactate: The Ultimate Cerebral Oxidative Energy Substrate?
Schurr, A. (2005) · Journal of Cerebral Blood Flow & Metabolism · doi:10.1038/sj.jcbfm.9600174 · Cited by 316
Cited by
Sorted by citations
Brain energy metabolism: focus on Astrocyte-neuron metabolic cooperation
Bélanger, M., Allaman, I., & Magistretti, P. J. (2011) · Cell Metabolism · doi:10.1016/j.cmet.2011.08.016 · Cited by 2,313
Verkhratsky, A., & Nedergaard, M. (2018) · Physiological Reviews · doi:10.1152/physrev.00042.2016 · Cited by 1,678
The Science and Translation of Lactate Shuttle Theory
Brooks, G. A. (2018) · Cell Metabolism · doi:10.1016/j.cmet.2018.03.008 · Cited by 1,486
Self-citationLactate metabolism in human health and disease
Li, X., Yang, Y., Zhang, B., Lin, X., Fu, X., An, Y., Zou, Y., Wang, J.-X., Wang, Z., & Yu, T. (2022) · Signal Transduction and Targeted Therapy · doi:10.1038/s41392-022-01151-3 · Cited by 1,454
Lactate in the Regulation of Tumor Microenvironment and Therapeutic Approaches
de la Cruz-López, K. G., Castro-Muñoz, L. J., Reyes-Hernández, D. O., García-Carrancá, A., & Manzo-Merino, J. (2019) · Frontiers in Oncology · doi:10.3389/fonc.2019.01143 · Cited by 940
Cell–cell and intracellular lactate shuttles
Brooks, G. A. (2009) · The Journal of Physiology · doi:10.1113/jphysiol.2009.178350 · Cited by 833
Self-citationLactate as a fulcrum of metabolism
Brooks, G. A. (2020) · Redox Biology · doi:10.1016/j.redox.2020.101454 · Cited by 724
Self-citationMonocarboxylate transporters in cancer
Payen, V. L., Mina, E., Hée, V. F. V., Porporato, P. E., & Sonveaux, P. (2019) · Molecular Metabolism · doi:10.1016/j.molmet.2019.07.006 · Cited by 688
San-Millán, I., & Brooks, G. A. (2016) · Carcinogenesis · doi:10.1093/carcin/bgw127 · Cited by 640
Self-citationLactate metabolism: historical context, prior misinterpretations, and current understanding
Ferguson, B. S., Rogatzki, M. J., Goodwin, M. L., Kane, D. A., Rightmire, Z. B., & Gladden, L. B. (2018) · European Journal of Applied Physiology · doi:10.1007/s00421-017-3795-6 · Cited by 485
Schönfeld, P., & Reiser, G. (2013) · Journal of Cerebral Blood Flow & Metabolism · doi:10.1038/jcbfm.2013.128 · Cited by 457
Monocarboxylate transporters in the brain and in cancer
Pérez‐Escuredo, J., Hée, V. F. V., Sboarina, M., Falces, J., Payen, V. L., Pellerin, L., & Sonveaux, P. (2016) · Biochimica et Biophysica Acta (BBA) - Molecular Cell Research · doi:10.1016/j.bbamcr.2016.03.013 · Cited by 415
Regulation of Oligodendrocyte Development and Myelination by Glucose and Lactate
Rinholm, J. E., Hamilton, N. B., Kessaris, N., Richardson, W. D., Bergersen, L. H., & Attwell, D. (2011) · The Journal of Neuroscience · doi:10.1523/jneurosci.3516-10.2011 · Cited by 383
San Martín, A., Ceballo, S., Ruminot, I., Lerchundi, R., Frommer, W. B., & Barros, L. F. (2013) · PLoS ONE · doi:10.1371/journal.pone.0057712 · Cited by 361
Lactate kinetics in human tissues at rest and during exercise
van Hall, G. (2010) · Acta Physiologica · doi:10.1111/j.1748-1716.2010.02122.x · Cited by 346
Lactate and pyruvate promote oxidative stress resistance through hormetic ROS signaling
Tauffenberger, A., Fiumelli, H., Almustafa, S., & Magistretti, P. J. (2019) · Cell Death and Disease · doi:10.1038/s41419-019-1877-6 · Cited by 352
Halestrap, A. P. (2013) · Comprehensive physiology · doi:10.1002/cphy.c130008 · Cited by 389
Lactate metabolism is associated with mammalian mitochondria
Chen, Y.-J., Mahieu, N. G., Huang, X., Singh, M., Crawford, P. A., Johnson, S. L., Gross, R. W., Schaefer, J., & Patti, G. J. (2016) · Nature Chemical Biology · doi:10.1038/nchembio.2172 · Cited by 326
Ross, J. M., Öberg, J., Brené, S., Coppotelli, G., Terzioglu, M., Pernold, K., Goiny, M., Sitnikov, R., Kehr, J., Trifunovic, A., et al. (2010) · Proceedings of the National Academy of Sciences · doi:10.1073/pnas.1008189107 · Cited by 299
The anaerobic threshold: 50+ years of controversy
Poole, D. C., Rossiter, H. B., Brooks, G. A., & Gladden, L. B. (2021) · The Journal of Physiology · doi:10.1113/jp279963 · Cited by 312
Self-citationTumor metabolism of lactate: the influence and therapeutic potential for MCT and CD147 regulation
Kennedy, K. M., & Dewhirst, M. (2010) · Future Oncology · doi:10.2217/fon.09.145 · Cited by 317
Lactate in contemporary biology: a phoenix risen
Brooks, G. A., Arevalo, J. A., Osmond, A. D., Leija, R. G., Curl, C. C., & Tovar, A. P. (2022) · The Journal of Physiology · doi:10.1113/jp280955 · Cited by 269
Self-citationMR Spectroscopic Studies of the Brain in Psychiatric Disorders
Maddock, R. J., & Buonocore, M. H. (2011) · Current topics in behavioral neurosciences · doi:10.1007/7854_2011_197 · Cited by 277
Lenaz, G., & Genova, M. L. (2009) · Antioxidants and Redox Signaling · doi:10.1089/ars.2009.2704 · Cited by 284
Autism-specific maternal autoantibodies recognize critical proteins in developing brain
Braunschweig, D., Krakowiak, P., Duncanson, P., Boyce, R., Hansen, R. L., Ashwood, P., Hertz-Picciotto, I., Pessah, I. N., & Van de Water, J. (2013) · Translational Psychiatry · doi:10.1038/tp.2013.50 · Cited by 257
Retinal metabolism: A comparative look at energetics in the retina
Country, M. W. (2017) · Brain Research · doi:10.1016/j.brainres.2017.07.025 · Cited by 266
Lactate Shuttles in Neuroenergetics—Homeostasis, Allostasis and Beyond
Mason, S. (2017) · Frontiers in Neuroscience · doi:10.3389/fnins.2017.00043 · Cited by 240
The Key Role of Mitochondrial Function in Health and Disease
San-Millán, I. (2023) · Antioxidants · doi:10.3390/antiox12040782 · Cited by 254
Glucose, glycolysis, and neurodegenerative diseases
Tang, B. L. (2020) · Journal of Cellular Physiology · doi:10.1002/jcp.29682 · Cited by 197
Glenn, T. C., Martin, N. A., Horning, M. A., McArthur, D. L., Hovda, D. A., Vespa, P. M., & Brooks, G. A. (2015) · Journal of Neurotrauma · doi:10.1089/neu.2014.3483 · Cited by 184
Self-citationHussien, R., & Brooks, G. A. (2010) · Physiological Genomics · doi:10.1152/physiolgenomics.00177.2010 · Cited by 175
Self-citationMetabolic symbiosis in cancer: Refocusing the Warburg lens
Nakajima, E. C., & Houten, B. V. (2012) · Molecular Carcinogenesis · doi:10.1002/mc.21863 · Cited by 194
Mitochondria and l ‐lactate metabolism
Passarella, S., Lidia de, B. A. R. I., Valenti, D., Pizzuto, R., Paventi, G., & Atlante, A. (2008) · FEBS Letters · doi:10.1016/j.febslet.2008.09.042 · Cited by 169
Mangia, S., Giove, F., Tkáč, I., Logothetis, N. K., Henry, P.-G., Olman, C. A., Maraviglia, B., Di Salle, F., & Uğurbil, K. (2009) · Journal of Cerebral Blood Flow & Metabolism · doi:10.1038/jcbfm.2008.134 · Cited by 161
Martinez-Outschoorn, U. E., Pestell, R. G., Howell, A., Tykocinski, M. L., Nagajyothi, F., Machado, F. S., Tanowitz, H. B., Sotgia, F., & Lisanti, M. P. (2011) · Cell Cycle · doi:10.4161/cc.10.24.18487 · Cited by 157
Maintained exercise‐enhanced brain executive function related to cerebral lactate metabolism in men
Hashimoto, T., Tsukamoto, H., Takenaka, S., Olesen, N. D., Petersen, L. G., Sørensen, H., Nielsen, H. B., Secher, N. H., & Ogoh, S. (2018) · The FASEB Journal · doi:10.1096/fj.201700381rr · Cited by 156
Self-citationFructose contributes to the Warburg effect for cancer growth
Nakagawa, T., Lanaspa, M. A., Millán, Í. S., Fini, M. A., Rivard, C. J., Sánchez‐Lozada, L. G., Andrés-Hernando, A., Tolan, D. R., & Johnson, R. J. (2020) · Cancer & Metabolism · doi:10.1186/s40170-020-00222-9 · Cited by 151
Autoimmunity, Autoantibodies, and Autism Spectrum Disorder
Edmiston, E., Ashwood, P., & de Water, J. V. (2016) · Biological Psychiatry · doi:10.1016/j.biopsych.2016.08.031 · Cited by 142
AMPK-Regulated Astrocytic Lactate Shuttle Plays a Non-Cell-Autonomous Role in Neuronal Survival
Muraleedharan, R., Gawali, M. V., Tiwari, D., Sukumaran, A., Oatman, N., Anderson, J., Nardini, D., Bhuiyan, M. A. N., Tkáč, I., Ward, A. L., et al. (2020) · Cell Reports · doi:10.1016/j.celrep.2020.108092 · Cited by 134
Non-Canonical Control of Neuronal Energy Status by the Na+ Pump
Baeza-Lehnert, F., Saab, A. S., Gutiérrez, R., Larenas, V., Díaz, E., Horn, M., Vargas, M., Hösli, L., Stobart, J., Hirrlinger, J., et al. (2019) · Cell Metabolism · doi:10.1016/j.cmet.2018.11.005 · Cited by 126
Brown adipocyte glucose metabolism: a heated subject
Hankir, M. K., & Klingenspor, M. (2018) · EMBO Reports · doi:10.15252/embr.201846404 · Cited by 130
Perez, J. N., Hill, B. G., Benavides, G. A., Dranka, B. P., & Darley-Usmar, V. M. (2010) · Biochemical Journal · doi:10.1042/bj20100090 · Cited by 125
Takimoto, M., & Hamada, T. (2014) · Journal of Applied Physiology · doi:10.1152/japplphysiol.01288.2013 · Cited by 115
Lenaz, G., & Genova, M. L. (2012) · Advances in experimental medicine and biology · doi:10.1007/978-1-4614-3573-0_5 · Cited by 114
Lactate metabolism in neurodegenerative diseases
Yang, C., Pan, R., Guan, F., & Yuan, Z. (2023) · Neural Regeneration Research · doi:10.4103/1673-5374.374142 · Cited by 115
Brooks, G. A., & Martin, N. A. (2015) · Frontiers in Neuroscience · doi:10.3389/fnins.2014.00408 · Cited by 107
Self-citationTracing the lactate shuttle to the mitochondrial reticulum
Brooks, G. A., Curl, C. C., Leija, R. G., Osmond, A. D., Duong, J. J., & Arevalo, J. A. (2022) · Experimental & Molecular Medicine · doi:10.1038/s12276-022-00802-3 · Cited by 119
Self-citationNewington, J. T., Harris, R. A., & Cumming, R. C. (2013) · Journal of Neurodegenerative Diseases · doi:10.1155/2013/234572 · Cited by 109
The tortuous path of lactate shuttle discovery: From cinders and boards to the lab and ICU
Brooks, G. A. (2020) · Journal of sport and health science/Journal of Sport and Health Science · doi:10.1016/j.jshs.2020.02.006 · Cited by 106
Self-citationTsukamoto, H., Suga, T., Takenaka, S., Tanaka, D., Takeuchi, T., Hamaoka, T., Isaka, T., Ogoh, S., & Hashimoto, T. (2016) · Physiology & Behavior · doi:10.1016/j.physbeh.2016.03.029 · Cited by 88
“It has been reported that long-term HIIE was more effective at increasing exercise capacity and metabolic and cardiovascular health compared to long-term moderate-intensity continuous exercise in healthy individuals [3,4,28].”
Self-citationMitochondrial Oxidative and Nitrosative Stress and Alzheimer Disease
Butterfield, D. A., & Boyd-Kimball, D. (2020) · Antioxidants · doi:10.3390/antiox9090818 · Cited by 85
“Lactate dehydrogenase-B (LDH) is also present in mitochondria [67] and is oxidatively modified by HNE in MCI hippocampus [56].”
BackgroundGenç, S., Kurnaz, I. A., & Özilgen, M. (2011) · BMC Systems Biology · doi:10.1186/1752-0509-5-162 · Cited by 92
Cai, M., Wang, H., Song, H., Yang, R., Wang, L., Xue, X., Sun, W., & Hu, J. (2022) · Frontiers in Nutrition · doi:10.3389/fnut.2022.800901 · Cited by 87
A disease with a sweet tooth: exploring the Warburg effect in Alzheimer’s disease
Atlante, A., Lidia de, B. A. R. I., Bobba, A., & Amadoro, G. (2017) · Biogerontology · doi:10.1007/s10522-017-9692-x · Cited by 77
Lactate and Myocardiac Energy Metabolism
Dong, S., Qian, L., Cheng, Z., Chen, C., Wang, K., Hu, S., Zhang, X., & Wu, T. (2021) · Frontiers in Physiology · doi:10.3389/fphys.2021.715081 · Cited by 76
Sullivan, C. R., Koene, R., Hasselfeld, K., O'Donovan, S. M., Ramsey, A. J., & McCullumsmith, R. E. (2018) · Molecular Psychiatry · doi:10.1038/s41380-018-0035-3 · Cited by 73
L- and D-Lactate: unveiling their hidden functions in disease and health
Li, J., Ma, P., Liu, Z., & Xie, J. (2025) · Cell Communication and Signaling · doi:10.1186/s12964-025-02132-z · Cited by 72
The mitochondrial L-lactate dehydrogenase affair
Passarella, S., Paventi, G., & Pizzuto, R. (2014) · Frontiers in Neuroscience · doi:10.3389/fnins.2014.00407 · Cited by 69
Maternal autoantibody related autism: mechanisms and pathways
Jones, K. L., & de Water, J. V. (2018) · Molecular Psychiatry · doi:10.1038/s41380-018-0099-0 · Cited by 73
San-Millán, I., Sparagna, G. C., Chapman, H. L., Warkins, V. L., Chatfield, K. C., Shuff, S. R., Martinez, J. L., & Brooks, G. A. (2022) · Frontiers in Nutrition · doi:10.3389/fnut.2022.809485 · Cited by 64
Self-citationMartínez-Cerdeño, V., Camacho, J., Fox, E., Miller, E., Ariza, J., Kienzle, D., Plank, K., Noctor, S. C., & Van de Water, J. (2016) · Cerebral Cortex · doi:10.1093/cercor/bhu291 · Cited by 63
Direct and indirect lactate oxidation in trained and untrained men
Emhoff, C.-A. W., Messonnier, L. A., Horning, M. A., Fattor, J. A., Carlson, T. J., & Brooks, G. A. (2013) · Journal of Applied Physiology · doi:10.1152/japplphysiol.00538.2013 · Cited by 62
Self-citationHalestrap, A. P. (2013) · Comprehensive physiology · doi:10.1002/j.2040-4603.2013.tb00533.x · Cited by 61
‘SNO’-Storms Compromise Protein Activity and Mitochondrial Metabolism in Neurodegenerative Disorders
Nakamura, T., & Lipton, S. A. (2017) · Trends in Endocrinology and Metabolism · doi:10.1016/j.tem.2017.10.004 · Cited by 60
Altered substrate metabolism in neurodegenerative disease: new insights from metabolic imaging
Cleland, N. R. W., Al‐Juboori, S. I., Dobrinskikh, E., & Bruce, K. D. (2021) · Journal of Neuroinflammation · doi:10.1186/s12974-021-02305-w · Cited by 62
Control of seizures by ketogenic diet-induced modulation of metabolic pathways
Clanton, R., Wu, G., Akabani, G., & Aramayo, R. (2016) · Amino Acids · doi:10.1007/s00726-016-2336-7 · Cited by 61
Mason, S., van Furth, A. M., Mienie, L. J., Engelke, U. F. H., Wevers, R. A., Solomons, R., & Reinecke, C. J. (2014) · Metabolomics · doi:10.1007/s11306-014-0741-z · Cited by 56
Glenn, T. C., Martin, N. A., McArthur, D. L., Hovda, D. A., Vespa, P. M., Johnson, M. L., Horning, M. A., & Brooks, G. A. (2014) · Journal of Neurotrauma · doi:10.1089/neu.2014.3482 · Cited by 56
Self-citationl-Lactate Transport and Metabolism in Mitochondria of Hep G2 Cells—The Cori Cycle Revisited
Passarella, S., & Schurr, A. (2018) · Frontiers in Oncology · doi:10.3389/fonc.2018.00120 · Cited by 55
Role of the Heart in Lactate Shuttling
Brooks, G. A. (2021) · Frontiers in Nutrition · doi:10.3389/fnut.2021.663560 · Cited by 56
Self-citationBecker, H. M., Klier, M., & Deitmer, J. W. (2010) · The Journal of Membrane Biology · doi:10.1007/s00232-010-9240-y · Cited by 50
The energy–redox axis in aging and age-related neurodegeneration☆
Yap, L.-P., Garcia, J., Han, D., & Cadenas, E. (2009) · Advanced Drug Delivery Reviews · doi:10.1016/j.addr.2009.07.015 · Cited by 56
Lactate Transport and Receptor Actions in Retina: Potential Roles in Retinal Function and Disease
Kolko, M., Vosborg, F., Henriksen, U. L., Hasan‐Olive, M. M., Diget, E. H., Vohra, R., Gurubaran, I. S., GJEDDE, A. H., Mariga, S. T., Skytt, D. M., et al. (2015) · Neurochemical Research · doi:10.1007/s11064-015-1792-x · Cited by 49
Intracellular Shuttle: The Lactate Aerobic Metabolism
Cruz, R. S. D. O., de Aguiar, R. A., Turnes, T., dos Santos, R. P., de Oliveira, M. F. M., & Caputo, F. (2012) · The Scientific World JOURNAL · doi:10.1100/2012/420984 · Cited by 48
Pizzuto, R., Paventi, G., Porcile, C., Sarnataro, D., Daniele, A., & Passarella, S. (2012) · Biochimica et Biophysica Acta (BBA) - Bioenergetics · doi:10.1016/j.bbabio.2012.05.010 · Cited by 48
Martínez‐Monge, I., Albiol, J., Lecina, M., Liste‐Calleja, L., Miret, J., Solà, C., & Cairó, J. J. (2018) · Biotechnology and Bioengineering · doi:10.1002/bit.26858 · Cited by 51
Environmental factors affecting pregnancy: Endocrine disrupters, nutrients and metabolic pathways
Bazer, F. W., Wu, G., Johnson, G. A., & Wang, X. (2014) · Molecular and Cellular Endocrinology · doi:10.1016/j.mce.2014.09.007 · Cited by 47
Effects of Gas Exchange on Acid‐Base Balance
Lindinger, M. I., & Heigenhauser, G. J. F. (2012) · Comprehensive physiology · doi:10.1002/cphy.c100055 · Cited by 46
Exercise tames the wild side of the Myc network: a hypothesis
Gohil, K., & Brooks, G. A. (2012) · American Journal of Physiology-Endocrinology and Metabolism · doi:10.1152/ajpendo.00027.2012 · Cited by 42
Self-citationColucci, A. C. M., Tassinari, I. D., Loss, E. D. S., & de Fraga, L. S. (2023) · Neuroscience · doi:10.1016/j.neuroscience.2023.06.022 · Cited by 46
Abnormal Activity-Dependent Brain Lactate and Glutamate+Glutamine Responses in Panic Disorder
Maddock, R. J., Buonocore, M. H., Miller, A. R., Yoon, J. H., Soosman, S. K., & Unruh, A. M. (2013) · Biological Psychiatry · doi:10.1016/j.biopsych.2012.12.015 · Cited by 41
Balmaceda-Aguilera, C., Cortés‐Campos, C., Cifuentes, M., Peruzzo, B., Mack, L., Tapia, J. C., Oyarce, K., García, M. D. L. Á., & Nualart, F. (2012) · PLoS ONE · doi:10.1371/journal.pone.0032409 · Cited by 41
Hertz, L., Xu, J., Song, D., Du, T., Yan, E., & Peng, L. (2013) · Frontiers in Integrative Neuroscience · doi:10.3389/fnint.2013.00020 · Cited by 37
Datta, S., & Chakrabarti, N. (2018) · Neurochemistry International · doi:10.1016/j.neuint.2018.04.007 · Cited by 37
Monocarboxylate Transporter 2 and Stroke Severity in a Rodent Model of Sleep Apnea
Wang, Y., Guo, S. Z., Bonen, A., Li, R. C., Gozal, D., Zhang, S. X. L., Brittian, K. R., & Gozal, D. (2011) · Journal of Neuroscience · doi:10.1523/jneurosci.1462-11.2011 · Cited by 36
Shi, C., Xu, J., Ding, Y., Chen, X., Yuan, F., Zhu, F., Duan, C., Hu, J., Lü, H., Wu, T., et al. (2024) · Theranostics · doi:10.7150/thno.96374 · Cited by 36
Cellular Mechanisms of Brain Energy Metabolism
GJEDDE, A. H., & Magistretti, P. J. (2011) · Elsevier eBooks · doi:10.1016/b978-1-4160-5316-3.00008-3 · Cited by 37
García‐Giménez, J. L., Cánovas‐Cervera, I., Nácher-Sendra, E., Dolz-Andrés, E., Sánchez-Bernabéu, Á., Agúndez, A. B., Hernández‐Gil, J., Mena, S., & Pallardó, F. V. (2025) · Free Radical Biology and Medicine · doi:10.1016/j.freeradbiomed.2025.04.004 · Cited by 36
Jacob, N., So, I., Sharma, B., Marzolini, S., Tartaglia, M. C., OH, P. I., & Green, R. (2023) · Sports Medicine · doi:10.1007/s40279-023-01815-2 · Cited by 38
Schurr, A. (2018) · Frontiers in Neuroscience · doi:10.3389/fnins.2018.00700 · Cited by 37
Tsai, S., Chen, P., Calkins, M. J., Wu, S.-Y., & Kuo, Y. (2016) · Frontiers in Aging Neuroscience · doi:10.3389/fnagi.2016.00057 · Cited by 36
Astrocyte-Neuron Interactions during Learning May Occur by Lactate Signaling Rather than Metabolism
DiNuzzo, M. (2016) · Frontiers in Integrative Neuroscience · doi:10.3389/fnint.2016.00002 · Cited by 31
Blood Biomarkers in Sports Medicine and Performance and the Future of Metabolomics
San-Millán, I. (2019) · Methods in molecular biology · doi:10.1007/978-1-4939-9236-2_26 · Cited by 31
Energy Flux, Lactate Shuttling, Mitochondrial Dynamics, and Hypoxia
Brooks, G. A. (2016) · Advances in experimental medicine and biology · doi:10.1007/978-1-4899-7678-9_29 · Cited by 30
Self-citationNikooie, R., Rajabi, H., Reza, G., Atabi, F., Omidfar, K., Aveseh, M., & Larijani, B. A. (2013) · Journal of Physiology and Biochemistry · doi:10.1007/s13105-013-0263-6 · Cited by 31
Kumar, A. K., Anishkin, A., Adams, S. H., & Chintapalli, S. V. (2024) · Physiological Reviews · doi:10.1152/physrev.00031.2023 · Cited by 33
L-lactate exerts a pro-proliferative effect on adult hippocampal precursor cells in vitro
Pötzsch, A., Zocher, S., Bernas, S. N., Leiter, O., Rünker, A. E., & Kempermann, G. (2021) · iScience · doi:10.1016/j.isci.2021.102126 · Cited by 36
Aerobic Glycolysis: A DeOxymoron of (Neuro)Biology
Schurr, A., & Passarella, S. (2022) · Metabolites · doi:10.3390/metabo12010072 · Cited by 31
Modulation of sulfide oxidation and toxicity in rat mitochondria by dehydroascorbic acid
Hildebrandt, T. M. (2011) · Biochimica et Biophysica Acta (BBA) - Bioenergetics · doi:10.1016/j.bbabio.2011.06.003 · Cited by 29
Mitochondrial lactate metabolism is involved in antioxidative defense in human astrocytoma cells
Lemire, J. A., Auger, C., Mailloux, R. J., & Appanna, V. D. (2014) · Journal of Neuroscience Research · doi:10.1002/jnr.23338 · Cited by 28
Metadata
- Authors
- Hashimoto, T., Hussien, R., Cho, H.-S., Kaufer, D., & Brooks, G. A.
- Affiliations
- University of California, Berkeley (US)
- Corresponding author
- Brooks, George A.
- Venue
- PLoS ONE
- Publisher
- Public Library of Science (PLoS)
- Published
- 2008-08-13
- Volume
- 3
- Issue
- 8
- Pages
- e2915
- ISSN
- 1932-6203 (ISSN-L)
- PMC
- PMC2488371
- OpenAlex
- W1988714133
- Cited by
- 196
- References
- 43
- Citations by year
- 2026: 10 · 2025: 9 · 2024: 8 · 2023: 14 · 2022: 9 · 2021: 10 · 2020: 14 · 2019: 7 · 2018: 14 · 2017: 15 · 2016: 13 · 2015: 5 · 2014: 11 · 2013: 17 · 2012: 13
- FWCI
- 3.56
- Type
- journal article
- Language
- en
- Open access
- gold
- doi.org
- Locations
- PLoS ONE (publishedVersion, cc-by)
- PubMed Central (publishedVersion, cc-by)
- PubMed (publishedVersion)
- DOAJ (DOAJ: Directory of Open Access Journals) (submittedVersion, cc-by-sa)
- eScholarship (California Digital Library) (submittedVersion)
- eScholarship (California Digital Library) (submittedVersion, cc-by)
- Funders
- National Institute of Arthritis and Musculoskeletal and Skin Diseases (R01AR050459)
- Topics
- Life Sciences › Biochemistry, Genetics and Molecular Biology › Molecular Biology › Mitochondrial Function and Pathology
- Life Sciences › Biochemistry, Genetics and Molecular Biology › Cancer Research › Cancer, Hypoxia, and Metabolism
- Life Sciences › Neuroscience › Cellular and Molecular Neuroscience › Neuroscience and Neuropharmacology Research
- Keywords
- lactate dehydrogenase, monocarboxylate transporters, MCT1, MCT2, neuronal mitochondria, cytochrome c oxidase, cortical neurons, hippocampal neurons, thalamic neurons
- MeSH terms
- Animals, Brain, Female, L-Lactate Dehydrogenase, Lactates, Mesencephalon, Mitochondria, Neuroglia, Neurons, Oxidation-Reduction, Rats, Wistar, Monocarboxylic Acid Transporters, Rats
About these checks
Registry, retraction, Cites and statistics results are computed, not judged, with one exception: a printed reference that no index lists is read once by a model before it counts as a citation error. Claims are extracted by a model and kept only when their quote appears verbatim in the text; each cited source is then checked, with a model’s help, for whether it says what the claim relies on. Those verdicts can be wrong — read the claim’s quote and the cited source before relying on one.
Statistics and arithmetic are recomputed, not judged.
Confidence bands are shown only for fields calibrated on our annotated test set. None is calibrated yet, so no band is shown.
What counts as a claim ›How we measure confidence ›How we check this ›
Are you an author, or do you see a problem with this page? Request a review
