

The DOI matches its Crossref record; 53 of the 53 references it cites were found in a registry or an index.
Hyperleptinemia Is Required for the Development of Leptin Resistance
Open accessAbstract
Leptin regulates body weight by signaling to the brain the availability of energy stored as fat. This negative feedback loop becomes disrupted in most obese individuals, resulting in a state known as leptin resistance. The physiological causes of leptin resistance remain poorly understood. Here we test the hypothesis that hyperleptinemia is required for the development of leptin resistance in diet-induced obese mice. We show that mice whose plasma leptin has been clamped to lean levels develop obesity in response to a high-fat diet, and the magnitude of this obesity is indistinguishable from wild-type controls. Yet these obese animals with constant low levels of plasma leptin remain highly sensitive to exogenous leptin even after long-term exposure to a high fat diet. This shows that dietary fats alone are insufficient to block the response to leptin. The data also suggest that hyperleptinemia itself can contribute to leptin resistance by downregulating cellular response to leptin as has been shown for other hormones.
Overview
The claims and statistics of this paper haven’t been checked yet.
Run the check — free, no account needed. It reads the open-access text and checks the sources it cites.
Integrity signals
Registry
Cites
Statistics
Figures
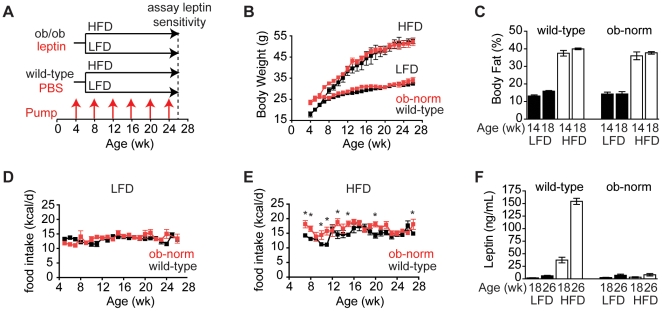
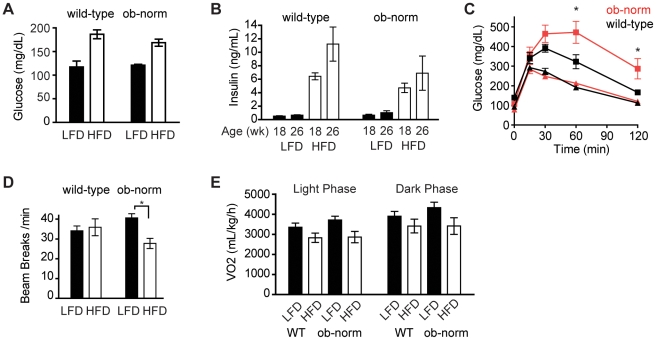
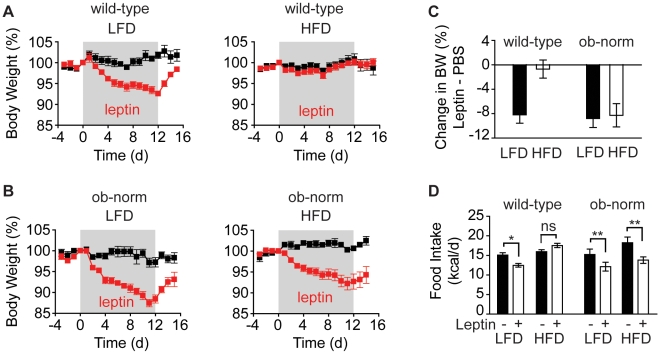
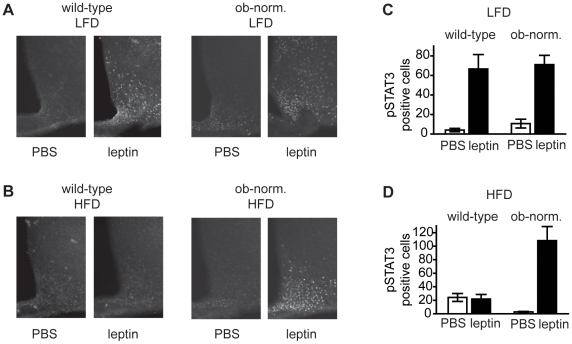
Verification
Claims the paper makes
The claims and statistics of this paper haven’t been checked yet.
Run the check — free, no account needed. It reads the open-access text and checks the sources it cites.
Claims other papers make about this one
Each is checked against this paper’s own text: does it say what the citing paper says it does?
In the citing paper
“Following the switch to a HFD, wild-type and leptin-infused ob/ob mice displayed similar weight gain despite markedly higher plasma leptin levels in the former group (94).”
From Leptin and the Central Nervous System Control of Glucose Metabolism (2011) · cites this paper as [94]
In the citing paper
“wild-type mice exposed to a HFD were resistant to the ability of leptin to reduce food intake and body weight and to induce hypothalamic pSTAT3 relative to leptin-infused ob/ob mice fed a HFD.”
From Leptin and the Central Nervous System Control of Glucose Metabolism (2011) · cites this paper as [94]
Self-check
Percentages, sums and reported differences re-computed from the paper’s own numbers.
The self-check needs the paper’s full text.
Citations
Cites
Positional cloning of the mouse obese gene and its human homologue
Zhang, Y., Proenca, R., Maffei, M., Barone, M., Leopold, L., & Friedman, J. M. (1994) · Nature · doi:10.1038/372425a0 · Cited by 13,419
Self-citationWeight-Reducing Effects of the Plasma Protein Encoded by the obese Gene
Halaas, J. L., Gajiwala, K. S., Maffei, M., Cohen, S. L., Chait, B. T., Rabinowitz, D., Lallone, R. L., Burley, S. K., & Friedman, J. M. (1995) · Science · doi:10.1126/science.7624777 · Cited by 4,451
Self-citationEffects of the obese Gene Product on Body Weight Regulation in ob / ob Mice
Pelleymounter, M. A., Cullen, M. J., Baker, M. B., Hecht, R., Winters, D., Boone, T., & Collins, F. (1995) · Science · doi:10.1126/science.7624776 · Cited by 4,017
Maffei, M., Halaas, J., Ravussin, E., Pratley, R. E., Lee, G. H., Zhang, Y., Fei, H., Kim, S., Lallone, R., Ranganathan, S., et al. (1995) · Nature Medicine · doi:10.1038/nm1195-1155 · Cited by 3,725
Self-citationCongenital leptin deficiency is associated with severe early-onset obesity in humans
Montague, C. T., Farooqi, I. S., Whitehead, J. P., Soos, M. A., Rau, H., Wareham, N. J., Sewter, C. P., Digby, J. E., Mohammed, S. N., Hurst, J. A., et al. (1997) · Nature · doi:10.1038/43185 · Cited by 2,936
Effects of Recombinant Leptin Therapy in a Child with Congenital Leptin Deficiency
Farooqi, I. S., Jebb, S. A., Langmack, G., Lawrence, E., Cheetham, C. H., Prentice, A. M., Hughes, I. A., McCamish, M. A., & O'Rahilly, S. (1999) · New England Journal of Medicine · doi:10.1056/nejm199909163411204 · Cited by 1,998
Frederich, R. C., Hamann, A., Anderson, S., Löllmann, B., Lowell, B. B., & Flier, J. S. (1995) · Nature Medicine · doi:10.1038/nm1295-1311 · Cited by 1,660
The role of neuropeptide Y in the antiobesity action of the obese gene product
Stephens, T. W., Basinski, M., Bristow, P. K., Bue-Valleskey, J. M., Burgett, S. G., Craft, L., Hale, J., Hoffmann, J., Hsiung, H. M., Kriauciunas, A., et al. (1995) · Nature · doi:10.1038/377530a0 · Cited by 1,498
Hypothalamic IKKβ/NF-κB and ER Stress Link Overnutrition to Energy Imbalance and Obesity
Zhang, X., Zhang, G., Zhang, H., Karin, M., Bai, H., & Cai, D. (2008) · Cell · doi:10.1016/j.cell.2008.07.043 · Cited by 1,350
Trophic Action of Leptin on Hypothalamic Neurons That Regulate Feeding
Bouret, S. G., Draper, S. J., & Simerly, R. B. (2004) · Science · doi:10.1126/science.1095004 · Cited by 1,247
Research works printed but not linked: 1
- MF White, 2006, Regulating insulin signaling and beta-cell function through IRS proteins., Can J Physiol Pharmacol, 84, 725
Cited by
Sorted by citations
Adapting to obesity with adipose tissue inflammation
Reilly, S. M., & Saltiel, A. R. (2017) · Nature Reviews Endocrinology · doi:10.1038/nrendo.2017.90 · Cited by 1,204
Obesity and leptin resistance: distinguishing cause from effect
Myers, M. G., Leibel, R. L., Seeley, R. J., & Schwartz, M. W. (2010) · Trends in Endocrinology and Metabolism · doi:10.1016/j.tem.2010.08.002 · Cited by 943
Leptin and the endocrine control of energy balance
Friedman, J. M. (2019) · Nature Metabolism · doi:10.1038/s42255-019-0095-y · Cited by 661
Self-citationStructure, production and signaling of leptin
Münzberg, H., & Morrison, C. D. (2014) · Metabolism · doi:10.1016/j.metabol.2014.09.010 · Cited by 486
Leptin resistance and diet-induced obesity: central and peripheral actions of leptin
Sáinź, N., Barrenetxe, J., Moreno-Aliaga, M. J., & Martínez, J. A. (2014) · Metabolism · doi:10.1016/j.metabol.2014.10.015 · Cited by 445
Leptin signaling and leptin resistance
Zhou, Y., & Rui, L. (2013) · Frontiers of Medicine · doi:10.1007/s11684-013-0263-5 · Cited by 358
Amylin: Pharmacology, Physiology, and Clinical Potential
Hay, D. L., Chen, S., Lutz, T. A., Parkes, D. G., & Roth, J. D. (2015) · Pharmacological Reviews · doi:10.1124/pr.115.010629 · Cited by 400
Adiponectin, Leptin and Cardiovascular Disorders
Zhao, S., Kusminski, C. M., & Scherer, P. E. (2021) · Circulation Research · doi:10.1161/circresaha.120.314458 · Cited by 415
Peripheral Cannabinoid-1 Receptor Inverse Agonism Reduces Obesity by Reversing Leptin Resistance
Tam, J., Çınar, R., Liu, J., Godlewski, G., Wesley, D., Jourdan, T., Szanda, G., Mukhopadhyay, B., Chedester, L., Liow, J., et al. (2012) · Cell Metabolism · doi:10.1016/j.cmet.2012.07.002 · Cited by 356
Leptin Mediates the Increase in Blood Pressure Associated with Obesity
Simonds, S. E., Pryor, J. T., Ravussin, É., Greenway, F. L., Dileone, R., Allen, A. M., Bassi, J. K., Elmquist, J. K., Keogh, J. M., Henning, E., et al. (2014) · Cell · doi:10.1016/j.cell.2014.10.058 · Cited by 352
Leptin and the maintenance of elevated body weight
Pan, W. W., & Myers, M. G. (2018) · Nature reviews. Neuroscience · doi:10.1038/nrn.2017.168 · Cited by 344
Leptin and the Central Nervous System Control of Glucose Metabolism
Morton, G. J., & Schwartz, M. W. (2011) · Physiological Reviews · doi:10.1152/physrev.00007.2010 · Cited by 338
“Following the switch to a HF diet, wild-type and leptin-infused ob/ob mice displayed similar weight gain despite markedly higher plasma leptin levels in the former group (94).”
BackgroundInfluentialStojsavljević, S. (2014) · World Journal of Gastroenterology · doi:10.3748/wjg.v20.i48.18070 · Cited by 336
Karczewski, J., Śledzińska, E., Baturo, A., Jończyk, I., Maleszko, A., Maleszko, A., Samborski, P., Krasińska, B., & Dobrowolska, A. (2018) · European Cytokine Network · doi:10.1684/ecn.2018.0415 · Cited by 321
Partial Leptin Reduction as an Insulin Sensitization and Weight Loss Strategy
Zhao, S., Zhu, Y., Schultz, R. D., Li, N., He, Z., Zhang, Z., Caron, A., Zhu, Q., Sun, K., Xiong, W., et al. (2019) · Cell Metabolism · doi:10.1016/j.cmet.2019.08.005 · Cited by 299
Leptin revisited: its mechanism of action and potential for treating diabetes
Coppari, R., & Bjørbæk, C. (2012) · Nature Reviews Drug Discovery · doi:10.1038/nrd3757 · Cited by 308
Friedman, J. M. (2016) · Journal of Clinical Investigation · doi:10.1172/jci91578 · Cited by 288
Self-citationLeal, V. D. O., & Mafra, D. (2013) · Clinica Chimica Acta · doi:10.1016/j.cca.2013.02.003 · Cited by 287
20 YEARS OF LEPTIN: Leptin at 20: an overview
Friedman, J. M. (2014) · Journal of Endocrinology · doi:10.1530/joe-14-0405 · Cited by 257
Self-citationChallenges and Opportunities of Defining Clinical Leptin Resistance
Myers, M. G., Heymsfield, S. B., Haft, C. R., Kahn, B. B., Laughlin, M. R., Leibel, R. L., Tschöp, M. H., & Yanovski, J. A. (2012) · Cell Metabolism · doi:10.1016/j.cmet.2012.01.002 · Cited by 251
Appetite regulation and weight control: the role of gut hormones
Perry, B., & Wang, Y. (2012) · Nutrition and Diabetes · doi:10.1038/nutd.2011.21 · Cited by 229
Adipose tissue: an endocrine organ playing a role in metabolic regulation
Booth, A. D., Magnuson, A. M., Fouts, J. K., & Foster, M. T. (2016) · Hormone Molecular Biology and Clinical Investigation · doi:10.1515/hmbci-2015-0073 · Cited by 220
Role of Leptin in Obesity, Cardiovascular Disease, and Type 2 Diabetes
Vilariño‐García, T., Polonio-González, M., Pérez‐Pérez, A., Ribalta, J., Arrieta, F., Aguilar‐Diosdado, M., Obaya, J. C., Gimeno-Orna, J. A., Iglesias, P., Navarro, J., et al. (2024) · International Journal of Molecular Sciences · doi:10.3390/ijms25042338 · Cited by 201
Voss, M. W., Carr, L. J., Clark, R., & Weng, T. (2014) · Mental health and physical activity · doi:10.1016/j.mhpa.2014.01.001 · Cited by 164
Duntas, L. H., & Biondi, B. (2012) · Thyroid · doi:10.1089/thy.2011.0499 · Cited by 162
The therapeutic potential of second and third generation CB1R antagonists
Çınar, R., Iyer, M. R., & Kunos, G. (2020) · Pharmacology & Therapeutics · doi:10.1016/j.pharmthera.2020.107477 · Cited by 161
Crujeiras, A. B., Zulet, M. Á., Lopez‐Legarrea, P., de la Iglesia, R., Pardo, M., Carreira, M. C., Martínez, J. A., & Casanueva, F. F. (2013) · Metabolism · doi:10.1016/j.metabol.2013.12.007 · Cited by 149
Diet-Induced Obese Mice Retain Endogenous Leptin Action
Ottaway, N., Mahbod, P., Rivero‐Gutiérrez, B., Norman, L. W., Gertler, A., D’Alessio, D. A., & Pérez–Tilve, D. (2015) · Cell Metabolism · doi:10.1016/j.cmet.2015.04.015 · Cited by 143
Control of energy homeostasis by amylin
Lutz, T. A. (2011) · Cellular and Molecular Life Sciences · doi:10.1007/s00018-011-0905-1 · Cited by 139
There and Back Again: Leptin Actions in White Adipose Tissue
Martínez‐Sánchez, N. (2020) · International Journal of Molecular Sciences · doi:10.3390/ijms21176039 · Cited by 142
The pleiotropic roles of leptin in metabolism, immunity, and cancer
de Candia, P., Prattichizzo, F., Garavelli, S., Alviggi, C., Cava, A. L., & Matarese, G. (2021) · The Journal of Experimental Medicine · doi:10.1084/jem.20191593 · Cited by 141
Szewczyk‐Golec, K., Woźniak, A., & Reiter, R. J. (2015) · Journal of Pineal Research · doi:10.1111/jpi.12257 · Cited by 153
Leptin and the regulation of endothelial function in physiological and pathological conditions
Bełtowski, J. (2011) · Clinical and Experimental Pharmacology and Physiology · doi:10.1111/j.1440-1681.2011.05623.x · Cited by 129
Appetite Regulation: Hormones, Peptides, and Neurotransmitters and Their Role in Obesity
Miller, G. D. (2017) · American Journal of Lifestyle Medicine · doi:10.1177/1559827617716376 · Cited by 132
Zhao, S., Kusminski, C. M., Elmquist, J. K., & Scherer, P. E. (2020) · Diabetes · doi:10.2337/dbi19-0018 · Cited by 130
Martínez‐Sánchez, N., Sweeney, O., Sidarta-Oliveira, D., Caron, A., Stanley, S. A., & Domingos, A. I. (2022) · Neuron · doi:10.1016/j.neuron.2022.10.017 · Cited by 127
The Leptin System and Diet: A Mini Review of the Current Evidence
Mendoza-Herrera, K., Florio, A. A., Moore, M., Marrero, A., Taméz, M., Bhupathiraju, S. N., & Mattei, J. (2021) · Frontiers in Endocrinology · doi:10.3389/fendo.2021.749050 · Cited by 139
Adipose Tissue: Physiology to Metabolic Dysfunction
Richard, A. J., White, U. A., Elks, C. M., & Stephens, J. M. (2020) · Europe PMC (PubMed Central) · Cited by 118
Obesity causes selective and long-lasting desensitization of AgRP neurons to dietary fat
Beutler, L. R., Corpuz, T. V., Ahn, J. S., Kosar, S., Song, W., Chen, Y., & Knight, Z. A. (2020) · eLife · doi:10.7554/elife.55909 · Cited by 113
Self-citationSTAT3 phosphorylation in central leptin resistance
Liu, H., Du, T., Li, C., & Yang, G. (2021) · Nutrition & Metabolism · doi:10.1186/s12986-021-00569-w · Cited by 130
Hayes, M. R., Kanoski, S. E., Alhadeff, A. L., & Grill, H. J. (2011) · Obesity · doi:10.1038/oby.2011.50 · Cited by 110
High‐Fat Diet Induces Leptin Resistance in Leptin‐Deficient Mice
Koch, C. E., Lowe, C., Pretz, D., Steger, J., Williams, L. M., & Tups, A. (2014) · Journal of Neuroendocrinology · doi:10.1111/jne.12131 · Cited by 111
The Role of Ceramides in Diabetes and Cardiovascular Disease Regulation of Ceramides by Adipokines
Field, B. C., Gordillo, R., & Scherer, P. E. (2020) · Frontiers in Endocrinology · doi:10.3389/fendo.2020.569250 · Cited by 110
Role of oxytocin signaling in the regulation of body weight
Blevins, J. E., & Ho, J. M. (2013) · Reviews in Endocrine and Metabolic Disorders · doi:10.1007/s11154-013-9260-x · Cited by 108
Cognitive and autonomic determinants of energy homeostasis in obesity
Richard, D. (2015) · Nature Reviews Endocrinology · doi:10.1038/nrendo.2015.103 · Cited by 113
Dysregulation of a long noncoding RNA reduces leptin leading to a leptin-responsive form of obesity
Dallner, O. S., Marinis, J. M., Lu, Y.-H., Birsoy, K., Werner, E., Fayzikhodjaeva, G., Dill, B. D., Molina, H., Moscati, A., Kutalik, Z., et al. (2019) · Nature Medicine · doi:10.1038/s41591-019-0370-1 · Cited by 106
Self-citationNew therapeutic approaches for the treatment of obesity
Saltiel, A. R. (2016) · Science Translational Medicine · doi:10.1126/scitranslmed.aad1811 · Cited by 102
New insights in leptin resistance mechanisms in mice
Balland, É., & Cowley, M. A. (2015) · Frontiers in Neuroendocrinology · doi:10.1016/j.yfrne.2015.09.004 · Cited by 105
Fairbrother, U. L., Kidd, E., Malagamuwa, T., & Walley, A. J. (2018) · Current Diabetes Reports · doi:10.1007/s11892-018-1053-x · Cited by 104
Leptin resensitisation: a reversion of leptin-resistant states
Andreoli, M. F., Donato, J., Çakır, I., & Perelló, M. (2019) · Journal of Endocrinology · doi:10.1530/joe-18-0606 · Cited by 101
Obesity-related kidney disease: Beyond hypertension and insulin-resistance
Arabi, T. Z., Shafqat, A., Sabbah, B. N., Ashraf, N., Shah, H., Abdulkader, H. S., Razak, A., Sabbah, A. N., & Arabi, Z. (2023) · Frontiers in Endocrinology · doi:10.3389/fendo.2022.1095211 · Cited by 102
Gamber, K. M., Huo, L., Ha, S., Hairston, J. E., Greeley, S., & Bjørbæk, C. (2012) · PLoS ONE · doi:10.1371/journal.pone.0030485 · Cited by 96
Boonloh, K., Kukongviriyapan, V., Kongyingyoes, B., Kukongviriyapan, U., Thawornchinsombut, S., & Pannangpetch, P. (2015) · Nutrients · doi:10.3390/nu7085292 · Cited by 89
Diet-Induced Obesity and the Mechanism of Leptin Resistance
Engin, A. (2017) · Advances in experimental medicine and biology · doi:10.1007/978-3-319-48382-5_16 · Cited by 89
Maziarz, M. P., Preisendanz, S., Juma, S., Imrhan, V., Prasad, C., & Vijayagopal, P. (2017) · Nutrition Journal · doi:10.1186/s12937-017-0235-8 · Cited by 88
Contrasting Effects of Leptin on Food Anticipatory and Total Locomotor Activity
Ribeiro, A. C. D. M., Ceccarini, G., Dupré, C., Friedman, J. M., Pfaff, D. W., & Mark, A. L. (2011) · PLoS ONE · doi:10.1371/journal.pone.0023364 · Cited by 81
Self-citationPartial leptin deficiency confers resistance to diet-induced obesity in mice
Zhao, S., Li, N., Zhu, Y., Straub, L. G., Zhang, Z., Wang, M.-Y., Zhu, Q., Kusminski, C. M., Elmquist, J. K., & Scherer, P. E. (2020) · Molecular Metabolism · doi:10.1016/j.molmet.2020.100995 · Cited by 83
Lee, C., Hsiao, W., & Lee, O. K. (2016) · Translational research · doi:10.1016/j.trsl.2016.11.003 · Cited by 85
Villanueva-Carmona, T., Cedó, L., Madeira, A., Ceperuelo‐Mallafré, V., Rodríguez‐Peña, M., Núñez‐Roa, C., Maymó‐Masip, E., Repollés-de-Dalmau, M., Badia, J., Keiran, N., et al. (2023) · Cell Metabolism · doi:10.1016/j.cmet.2023.03.004 · Cited by 84
Morton, G. J., Kaiyala, K. J., Fisher, J. D., Ogimoto, K., Schwartz, M. W., & Wisse, B. E. (2010) · American Journal of Physiology-Endocrinology and Metabolism · doi:10.1152/ajpendo.00546.2010 · Cited by 81
Mészáros, M., & Bikov, A. (2022) · Biomedicines · doi:10.3390/biomedicines10112754 · Cited by 83
Peripheral cannabinoid-1 receptor blockade restores hypothalamic leptin signaling
Tam, J., Szanda, G., Drori, A., Liu, Z., Çınar, R., Kashiwaya, Y., Reitman, M. L., & Kunos, G. (2017) · Molecular Metabolism · doi:10.1016/j.molmet.2017.06.010 · Cited by 78
Structural insights into the mechanism of leptin receptor activation
Saxton, R. A., Caveney, N. A., Moya-Garzón, M. D., Householder, K. D., Rodriguez, G. E., Burdsall, K. A., Long, J. Z., & García, K. C. (2023) · Nature Communications · doi:10.1038/s41467-023-37169-6 · Cited by 84
Sahu, A. (2011) · Neuroendocrinology · doi:10.1159/000326785 · Cited by 74
Impaired Leptin Signalling in Obesity: Is Leptin a New Thermolipokine?
Genchi, V. A., D’Oria, R., Palma, G., Caccioppoli, C., Cignarelli, A., Natalicchio, A., Laviola, L., Giorgino, F., & Perrini, S. (2021) · International Journal of Molecular Sciences · doi:10.3390/ijms22126445 · Cited by 83
Histone deacetylase 6 inhibition restores leptin sensitivity and reduces obesity
Çakır, I., Hadley, C. K., Pan, P. L., Bagchi, R. A., Ghamari‐Langroudi, M., Porter, D. T., Wang, Q., Litt, M. J., Jana, S., Hagen, S. E., et al. (2022) · Nature Metabolism · doi:10.1038/s42255-021-00515-3 · Cited by 80
Bandyopadhyay, G. K., Vu, C. U., Gentile, S., Lee, H., Biswas, N., Chi, N., O’Connor, D. T., & Mahata, S. K. (2012) · Journal of Biological Chemistry · doi:10.1074/jbc.m111.335877 · Cited by 75
The emerging role of the endocannabinoid system in the pathogenesis and treatment of kidney diseases
Tam, J. (2015) · Journal of Basic and Clinical Physiology and Pharmacology · doi:10.1515/jbcpp-2015-0055 · Cited by 73
New Pharmacological Perspectives for the Leptin Receptor in the Treatment of Obesity
Roujeau, C., Jockers, R., & Dam, J. (2014) · Frontiers in Endocrinology · doi:10.3389/fendo.2014.00167 · Cited by 71
A gut–brain neural circuit controlled by intestinal gluconeogenesis is crucial in metabolic health
Soty, M., Penhoat, A., Amigó-Correig, M., Vinera, J., Sardella, A., Vulin-Bouilloux, F., Zitoun, C., Houberdon, I., & Mithieux, G. (2014) · Molecular Metabolism · doi:10.1016/j.molmet.2014.12.009 · Cited by 76
Tsunekawa, T., Banno, R., Mizoguchi, A., Sugiyama, M., Tominaga, T., Onoue, T., Hagiwara, D., Ito, Y., Iwama, S., Goto, M., et al. (2017) · EBioMedicine · doi:10.1016/j.ebiom.2017.01.007 · Cited by 63
Rahman, H. A., Sahib, N. G., Saari, N., Abas, F., Ismail, A., Mumtaz, M. W., & Hamid, A. A. (2017) · BMC Complementary and Alternative Medicine · doi:10.1186/s12906-017-1640-4 · Cited by 63
Effects of gut microbiota on leptin expression and body weight are lessened by high-fat diet in mice
Yao, H., Fan, C., Fan, X., Lu, Y., Wang, Y., Wang, R., Tang, T., & Qi, K. (2020) · British Journal Of Nutrition · doi:10.1017/s0007114520001117 · Cited by 63
Naito, M., Fujikura, J., Ebihara, K., Miyanaga, F., Yokoi, H., Kusakabe, T., Yamamoto, Y., Son, C., Mukoyama, M., Hosoda, K., et al. (2011) · Diabetes · doi:10.2337/db10-1795 · Cited by 60
Teasaponin Reduces Inflammation and Central Leptin Resistance in Diet-Induced Obese Male Mice
Yu, Y., Wu, Y., Szabo, A., Wu, Z., Wang, H., Li, D., & Huang, X. (2013) · Endocrinology · doi:10.1210/en.2013-1218 · Cited by 60
Newton, A. J., Heß, S., Paeger, L., Vogt, M. C., Lascano, J. F., Nillni, E. A., Brüning, J. C., Kloppenburg, P., & Xu, A. W. (2012) · Endocrinology · doi:10.1210/en.2012-1643 · Cited by 61
Serum leptin and loss of control eating in children and adolescents
Miller, R., Tanofsky‐Kraff, M., Shomaker, L. B., Field, S. E., Hannallah, L. M., Reina, S. A., Mooreville, M., Sedaka, N. M., Brady, S. M., Condarco, T. A., et al. (2013) · International Journal of Obesity · doi:10.1038/ijo.2013.126 · Cited by 57
Central and peripheral leptin resistance in obesity and improvements of exercise
Peng, J., Yin, L., & Wang, X. (2021) · Hormones and Behavior · doi:10.1016/j.yhbeh.2021.105006 · Cited by 63
Low Glycemic Load Experimental Diet More Satiating Than High Glycemic Load Diet
Chang, K. T., Lampe, J. W., Schwarz, Y., Breymeyer, K. L., Noar, K. A., Song, X., & Neuhouser, M. L. (2012) · Nutrition and Cancer · doi:10.1080/01635581.2012.676143 · Cited by 59
Rajamani, U., Gross, A. R., Hjelm, B. E., Sequeira, A., Vawter, M. P., Tang, J., Gangalapudi, V., Wang, Y., Andres, A. M., Gottlieb, R. A., et al. (2018) · Cell stem cell · doi:10.1016/j.stem.2018.03.009 · Cited by 60
Boyle, C., Rossier, M., & Lutz, T. (2011) · Physiology and Behavior · doi:10.1016/j.physbeh.2011.04.044 · Cited by 59
Metabolic Reserve as a Determinant of Cognitive Aging
Stranahan, A. M., & Mattson, M. P. (2012) · Journal of Alzheimer s Disease · doi:10.3233/jad-2011-110899 · Cited by 56
Rhythmic Leptin Is Required for Weight Gain from Circadian Desynchronized Feeding in the Mouse
Arble, D. M., Vitaterna, M. H., & Turek, F. W. (2011) · PLoS ONE · doi:10.1371/journal.pone.0025079 · Cited by 54
Misdistribution of iron and oxidative stress in chronic kidney disease
Nakanishi, T., Kuragano, T., Nanami, M., Nagasawa, Y., & Hasuike, Y. (2018) · Free Radical Biology and Medicine · doi:10.1016/j.freeradbiomed.2018.06.025 · Cited by 57
The role of dietary salt in metabolism and energy balance: Insights beyond cardiovascular disease
Wu, Q., Burley, G., Li, L., Lin, S., & Shi, Y. (2023) · Diabetes Obesity and Metabolism · doi:10.1111/dom.14980 · Cited by 59
Matias, A. M., Estevam, W. M., Coelho, P. M., Haese, D., Kobi, J. B. B. S., Lima‐Leopoldo, A. P., & Leopoldo, A. S. (2018) · Nutrients · doi:10.3390/nu10081071 · Cited by 53
Insulin and leptin as potential cognitive enhancers in metabolic disorders and Alzheimer's disease
Mejido, D. C. P., Peny, J. A., Vieira, M. N. N., Ferreira, S. T., & Felice, F. G. D. (2020) · Neuropharmacology · doi:10.1016/j.neuropharm.2020.108115 · Cited by 52
Berthoud, H., Morrison, C. D., & Münzberg, H. (2020) · Physiology & Behavior · doi:10.1016/j.physbeh.2020.112959 · Cited by 61
de Oliveira, R. D. V. C., Cerda, Á., Genvigir, F. D. V., Sampaio, M. F., Armaganijan, D., Bernik, M. M. S., Dórea, E. L., Hirata, M. H., Hinuy, H. M., & Hirata, R. D. C. (2013) · Arquivos Brasileiros de Endocrinologia & Metabologia · doi:10.1590/s0004-27302013000900002 · Cited by 52
Leptin Keeps Working, Even in Obesity
Myers, M. G. (2015) · Cell Metabolism · doi:10.1016/j.cmet.2015.05.017 · Cited by 51
Leptin in normal physiology and leptin resistance
Li, S., & Li, X. (2015) · 中国科学通报:英文版 · doi:10.1007/s11434-015-0951-4 · Cited by 52
Coudriet, G. M., Delmastro-Greenwood, M. M., Previte, D. M., Marré, M. L., O’Connor, E., Novak, E. M., Vincent, G., Mollen, K. P., Lee, S., Dong, H. H., et al. (2017) · Antioxidants · doi:10.3390/antiox6040085 · Cited by 50
The association of short-chain fatty acids and leptin metabolism: a systematic review
Gabriel, F. C., & Fantuzzi, G. (2019) · Nutrition Research · doi:10.1016/j.nutres.2019.08.006 · Cited by 57
Recent advances in understanding the role of leptin in energy homeostasis
Münzberg, H., Singh, P., Heymsfield, S. B., Yu, S., & Morrison, C. D. (2020) · F1000Research · doi:10.12688/f1000research.24260.1 · Cited by 49
Effects of Amylin on Eating and Adiposity
Lutz, T. A. (2011) · Handbook of experimental pharmacology · doi:10.1007/978-3-642-24716-3_10 · Cited by 48
Interactions Between Alcohol and the Endocannabinoid System
Kunos, G. (2020) · Alcoholism Clinical and Experimental Research · doi:10.1111/acer.14306 · Cited by 50
Non-Neuronal Cells in the Hypothalamic Adaptation to Metabolic Signals
Freire‐Regatillo, A., Argente-Arizón, P., Argente, J., García‐Segura, L. M., & Chowen, J. A. (2017) · Frontiers in Endocrinology · doi:10.3389/fendo.2017.00051 · Cited by 48
Evans, M. C., Lord, R. A., & Anderson, G. M. (2021) · International Journal of Molecular Sciences · doi:10.3390/ijms22179210 · Cited by 48
The secretory function of adipose tissues in metabolic regulation
Liu, Y., Qian, S., Tang, Y., & Tang, Q. (2024) · Life Metabolism · doi:10.1093/lifemeta/loae003 · Cited by 53
Chhabra, K. H., Adams, J. M., Jones, G. L., Yamashita, M., Schlapschy, M., Skerra, A., Rubinstein, M., & Low, M. J. (2016) · Molecular Metabolism · doi:10.1016/j.molmet.2016.07.012 · Cited by 42
Metadata
- Authors
- Knight, Z. A., Hannan, K. S., Greenberg, M. L., & Friedman, J. M.
- Affiliations
- Howard Hughes Medical Institute (US)
- Corresponding author
- Friedman, Jeffrey M.
- Venue
- PLoS ONE
- Publisher
- Public Library of Science (PLoS)
- Published
- 2010-06-29
- Volume
- 5
- Issue
- 6
- Pages
- e11376
- ISSN
- 1932-6203 (ISSN-L)
- PMC
- PMC2894068
- OpenAlex
- W1974838371
- Cited by
- 311
- References
- 53
- Citations by year
- 2026: 12 · 2025: 17 · 2024: 17 · 2023: 16 · 2022: 21 · 2021: 21 · 2020: 31 · 2019: 21 · 2018: 20 · 2017: 22 · 2016: 19 · 2015: 23 · 2014: 19 · 2013: 14 · 2012: 15
- FWCI
- 7.37
- Type
- journal article
- Language
- en
- Open access
- gold
- doi.org
- Locations
- PLoS ONE (publishedVersion, cc-by)
- PubMed Central (publishedVersion, cc-by)
- PubMed (publishedVersion)
- DOAJ (DOAJ: Directory of Open Access Journals) (submittedVersion, cc-by-sa)
- eScholarship (California Digital Library) (submittedVersion)
- eScholarship (California Digital Library) (submittedVersion, cc-by)
- Funders
- Howard Hughes Medical Institute
- National Institutes of Health (DK083531)
- National Institute of Diabetes and Digestive and Kidney Diseases (DK083531, R00DK083531, DK041096, K99DK083531, R01DK041096)
- Topics
- Life Sciences › Neuroscience › Endocrine and Autonomic Systems › Regulation of Appetite and Obesity
- Health Sciences › Medicine › Endocrinology, Diabetes and Metabolism › Adipokines, Inflammation, and Metabolic Diseases
- Health Sciences › Medicine › Reproductive Medicine › Hypothalamic control of reproductive hormones
- Keywords
- hyperleptinemia, leptin resistance, diet-induced obesity, leptin signaling, high-fat diet, leptin sensitivity, obesity, energy homeostasis
- MeSH terms
- Animals, Energy Intake, Feeding Behavior, Mice, Inbred C57BL, Obesity, Leptin, Mice
About these checks
Registry, retraction, Cites and statistics results are computed, not judged, with one exception: a printed reference that no index lists is read once by a model before it counts as a citation error. Claims are extracted by a model and kept only when their quote appears verbatim in the text; each cited source is then checked, with a model’s help, for whether it says what the claim relies on. Those verdicts can be wrong — read the claim’s quote and the cited source before relying on one.
Statistics and arithmetic are recomputed, not judged.
Confidence bands are shown only for fields calibrated on our annotated test set. None is calibrated yet, so no band is shown.
What counts as a claim ›How we measure confidence ›How we check this ›
Are you an author, or do you see a problem with this page? Request a review
