

The DOI matches its Crossref record; 48 of the 48 references it cites were found in a registry or an index.
Activation of P2X7 Receptor by ATP Plays an Important Role in Regulating Inflammatory Responses during Acute Viral Infection
Open accessAbstract
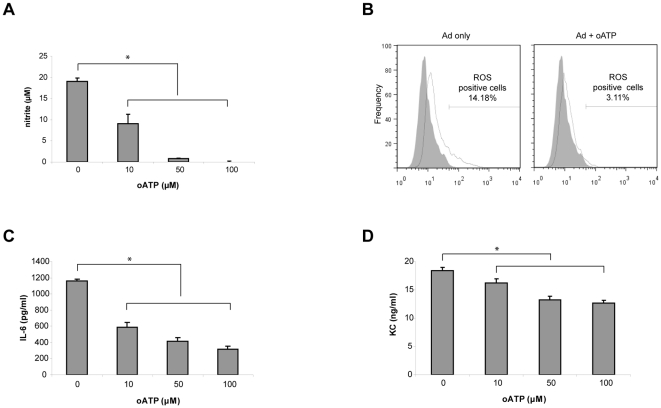
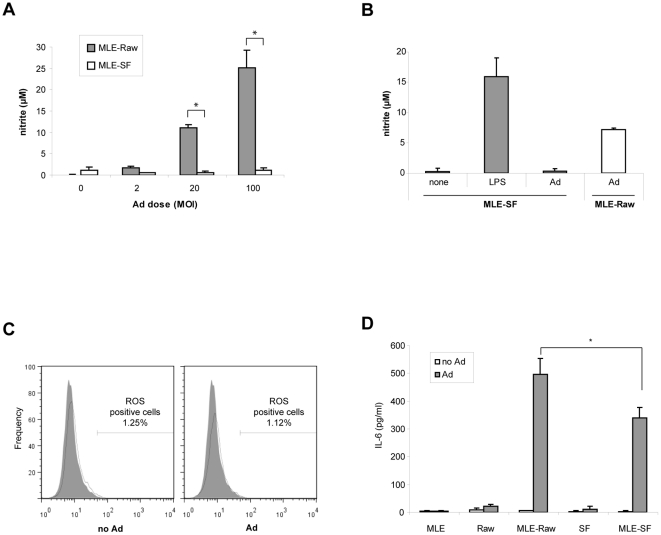
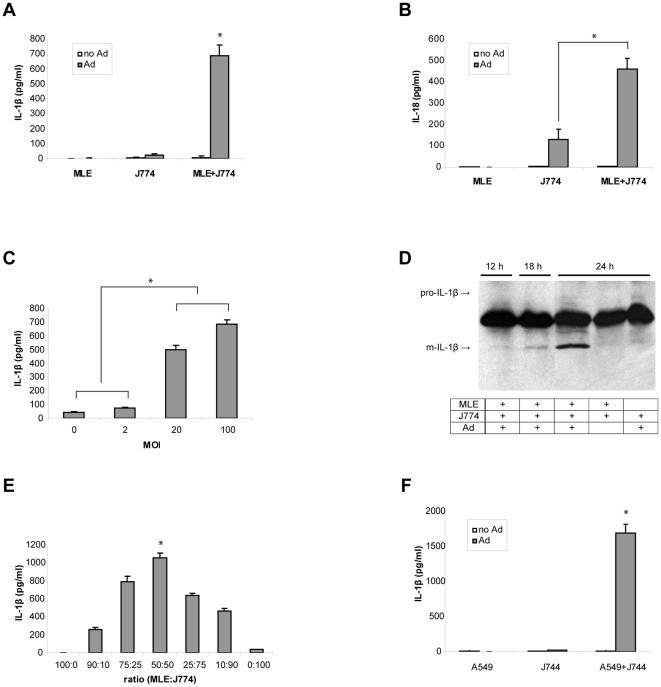
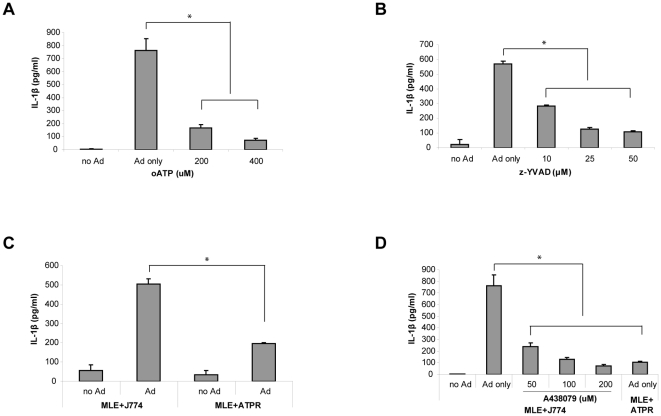
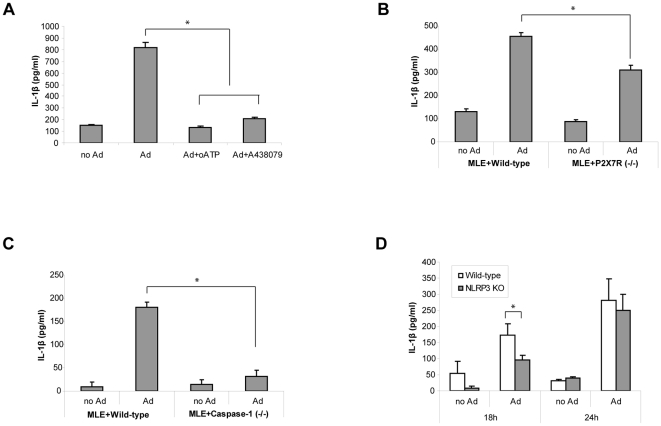
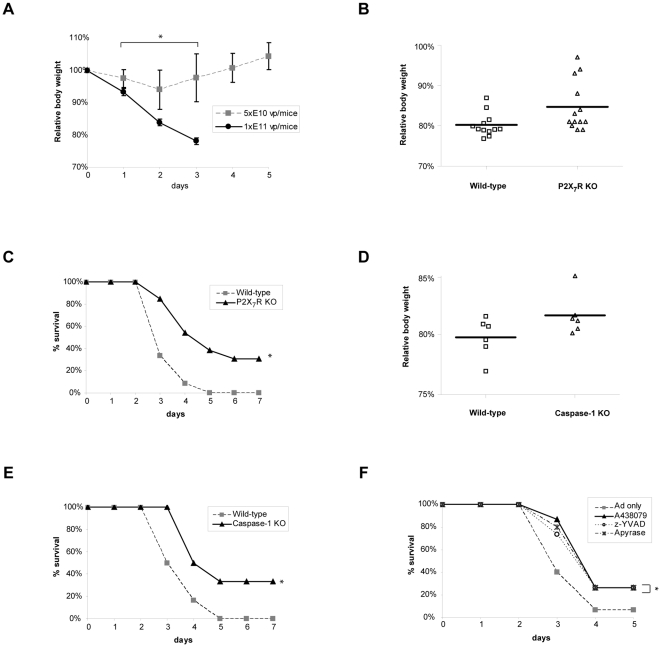
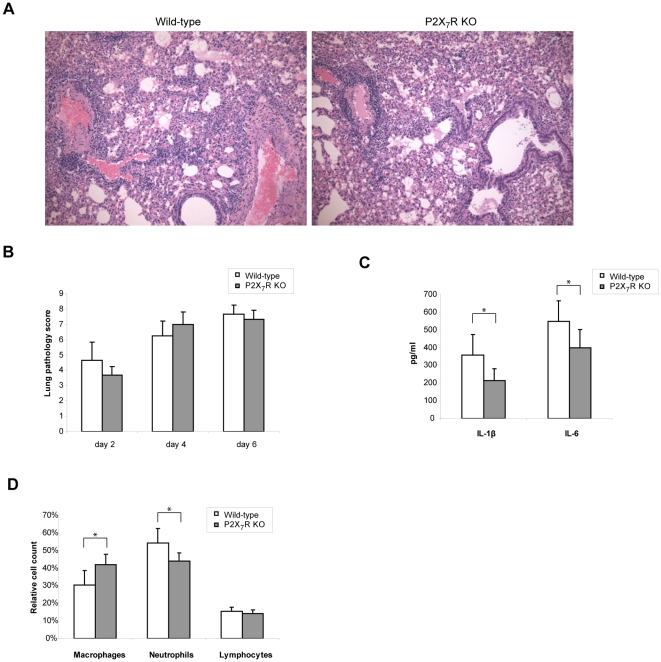
Acute viral infection causes damages to the host due to uncontrolled viral replication but even replication deficient viral vectors can induce systemic inflammatory responses. Indeed, overactive host innate immune responses to viral vectors have led to devastating consequences. Macrophages are important innate immune cells that recognize viruses and induce inflammatory responses at the early stage of infection. However, tissue resident macrophages are not easily activated by the mere presence of virus suggesting that their activation requires additional signals from other cells in the tissue in order to trigger inflammatory responses. Previously, we have shown that the cross-talk between epithelial cells and macrophages generates synergistic inflammatory responses during adenoviral vector infection. Here, we investigated whether ATP is involved in the activation of macrophages to induce inflammatory responses during an acute adenoviral infection. Using a macrophage-epithelial cell co-culture system we demonstrated that ATP signaling through P2X(7) receptor (P2X(7)R) is required for induction of inflammatory mediators. We also showed that ATP-P2X(7)R signaling regulates inflammasome activation as inhibition or deficiency of P2X(7)R as well as caspase-1 significantly reduced IL-1β secretion. Furthermore, we found that intranasal administration of replication deficient adenoviral vectors in mice caused a high mortality in wild-type mice with symptoms of acute respiratory distress syndrome but the mice deficient in P2X(7)R or caspase-1 showed increased survival. In addition, wild-type mice treated with apyrase or inhibitors of P2X(7)R or caspase-1 showed higher rates of survival. The improved survival in the P2X(7)R deficient mice correlated with diminished levels of IL-1β and IL-6 and reduced neutrophil infiltration in the early phase of infection. These results indicate that ATP, released during viral infection, is an important inflammatory regulator that activates the inflammasome pathway and regulates inflammatory responses.
Overview
The claims and statistics of this paper haven’t been checked yet.
Run the check — free, no account needed. It reads the open-access text and checks the sources it cites.
Integrity signals
Registry
Cites
Statistics
Figures
Verification
Claims the paper makes
The claims and statistics of this paper haven’t been checked yet.
Run the check — free, no account needed. It reads the open-access text and checks the sources it cites.
Claims other papers make about this one
Each is checked against this paper’s own text: does it say what the citing paper says it does?
In the citing paper
“Moreover, P2X7 receptor activation exacerbated inflammation, enhanced tissue damage, increased mortality, and worsened lung pathology involving P2X7 receptor expression or activation, such as observed in several other studies with e.g., influenza A virus [110] and adenovirus [111].”
From Hyperactivation of P2X7 receptors as a culprit of COVID-19 neuropathology (2021) · cites this paper as [111]
Self-check
Percentages, sums and reported differences re-computed from the paper’s own numbers.
The self-check needs the paper’s full text.
Citations
Cites
The Inflammasomes: Guardians of the Body
Martinon, F., Mayor, A., & Tschopp, J. (2009) · Annual Review of Immunology · doi:10.1146/annurev.immunol.021908.132715 · Cited by 2,436
Interleukin-1 in the pathogenesis and treatment of inflammatory diseases
Dinarello, C. A. (2011) · Blood · doi:10.1182/blood-2010-07-273417 · Cited by 2,248
Ghiringhelli, F., Apetoh, L., Tesniere, A., Aymeric, L., Ma, Y., Ortiz, C., Vermaelen, K., Panaretakis, T., Mignot, G., Ullrich, E., et al. (2009) · Nature Medicine · doi:10.1038/nm.2028 · Cited by 1,898
Differential activation of the inflammasome by caspase-1 adaptors ASC and Ipaf
Mariathasan, S., Newton, K., Monack, D. M., Vucic, D., French, D. M., Lee, W. P., Roose-Girma, M., Erickson, S. L., & Dixit, V. M. (2004) · Nature · doi:10.1038/nature02664 · Cited by 1,864
Raper, S. E., Chirmule, N. B., Lee, F. S., Wivel, N. A., Bagg, A., Gao, G., Wilson, J. M., & Batshaw, M. L. (2003) · Molecular Genetics and Metabolism · doi:10.1016/j.ymgme.2003.08.016 · Cited by 1,531
The AIM2 inflammasome is essential for host defense against cytosolic bacteria and DNA viruses
Rathinam, V. A. K., Jiang, Z., Waggoner, S. N., Sharma, S., Cole, L. E., Waggoner, L., Vanaja, S. K., Monks, B. G., Ganesan, S., Latz, E., et al. (2010) · Nature Immunology · doi:10.1038/ni.1864 · Cited by 1,331
Harmful molecular mechanisms in sepsis
Rittirsch, D., Flierl, M. A., & Ward, P. A. (2008) · Nature reviews. Immunology · doi:10.1038/nri2402 · Cited by 1,230
Allen, I. C., Scull, M. A., Moore, C. B., Holl, E. K., McElvania-TeKippe, E., Taxman, D. J., Guthrie, E. H., Pickles, R. J., & Ting, J. P.-Y. (2009) · Immunity · doi:10.1016/j.immuni.2009.02.005 · Cited by 1,113
Bours, M. J. L., Swennen, E. L. R., Di Virgilio, F., Cronstein, B. N., & Dagnelie, P. C. (2006) · Pharmacology & Therapeutics · doi:10.1016/j.pharmthera.2005.04.013 · Cited by 1,030
The P2X7 Receptor: A Key Player in IL-1 Processing and Release
Ferrari, D., Pizzirani, C., Adinolfi, E., Lemoli, R. M., Curti, A., Idzko, M., Panther, E., & Di Virgilio, F. (2006) · The Journal of Immunology · doi:10.4049/jimmunol.176.7.3877 · Cited by 1,025
The inflammasome recognizes cytosolic microbial and host DNA and triggers an innate immune response
Muruve, D. A., Pétrilli, V., Zaiss, A. K., White, L. R., Clark, S. A., Ross, P. J., Parks, R. J., & Tschopp, J. (2008) · Nature · doi:10.1038/nature06664 · Cited by 965
Thomas, P. G., Dash, P., Aldridge, J. R., Ellebedy, A. H., Reynolds, C., Funk, A. J., Martin, W. J., Lamkanfi, M., Webby, R. J., Boyd, K. L., et al. (2009) · Immunity · doi:10.1016/j.immuni.2009.02.006 · Cited by 769
Nucleotide receptors: an emerging family of regulatory molecules in blood cells
Virgilio, F. D., Chiozzi, P., Ferrari, D., Falzoni, S., Sanz, J. M., Morelli, A., Torboli, M., Bolognesi, G., & Baricordi, O. R. (2001) · Blood · doi:10.1182/blood.v97.3.587 · Cited by 702
Inflammasome recognition of influenza virus is essential for adaptive immune responses
Ichinohe, T., Lee, H. K., Ogura, Y., Flavell, R. A., & Iwasaki, A. (2009) · The Journal of Experimental Medicine · doi:10.1084/jem.20081667 · Cited by 701
Necrotic cells trigger a sterile inflammatory response through the Nlrp3 inflammasome
Iyer, S. S., Pulskens, W. P., Sadler, J. J., Butter, L. M., Teske, G. J., Ulland, T. K., Eisenbarth, S. C., Florquin, S., Flavell, R. A., Leemans, J. C., et al. (2009) · Proceedings of the National Academy of Sciences · doi:10.1073/pnas.0908698106 · Cited by 691
Immunity and immunopathology to viruses: what decides the outcome?
Rouse, B. T., & Sehrawat, S. (2010) · Nature reviews. Immunology · doi:10.1038/nri2802 · Cited by 636
Macrophage activation by endogenous danger signals
Zhang, X., & Mosser, D. (2007) · The Journal of Pathology · doi:10.1002/path.2284 · Cited by 629
Extracellular ATP triggers and maintains asthmatic airway inflammation by activating dendritic cells
Idzko, M., Hammad, H., van Nimwegen, M., Kool, M., Willart, M. A. M., Muskens, F., Hoogsteden, H. C., Luttmann, W., Ferrari, D., Virgilio, F. D., et al. (2007) · Nature Medicine · doi:10.1038/nm1617 · Cited by 620
Liaisons dangereuses: P2X7 and the inflammasome
Di Virgilio, F. (2007) · Trends in Pharmacological Sciences · doi:10.1016/j.tips.2007.07.002 · Cited by 493
A question of self‐preservation: immunopathology in influenza virus infection
Gruta, N. L. L., Kedzierska, K., Stambas, J., & Doherty, P. C. (2007) · Immunology and Cell Biology · doi:10.1038/sj.icb.7100026 · Cited by 463
Central roles of NLRs and inflammasomes in viral infection
Kanneganti, T. (2010) · Nature reviews. Immunology · doi:10.1038/nri2851 · Cited by 435
Graft-versus-host disease is enhanced by extracellular ATP activating P2X7R
Wilhelm, K., Ganesan, J., Müller, T., Dürr, C., Grimm, M., Beilhack, A., Krempl, C. D., Sorichter, S., Gerlach, U. V., Jüttner, E., et al. (2010) · Nature Medicine · doi:10.1038/nm.2242 · Cited by 435
P2X7 Receptor Differentially Couples to Distinct Release Pathways for IL-1β in Mouse Macrophage
Pelegrı́n, P., Barroso-Gutierrez, C., & Surprenant, A. (2008) · The Journal of Immunology · doi:10.4049/jimmunol.180.11.7147 · Cited by 413
Uric Acid Is a Danger Signal Activating NALP3 Inflammasome in Lung Injury Inflammation and Fibrosis
Gasse, P., Riteau, N., Charron, S., Girre, S., Fick, L., Pétrilli, V., Tschopp, J., Lagente, V., Quesniaux, V. F. J., Ryffel, B., et al. (2009) · American Journal of Respiratory and Critical Care Medicine · doi:10.1164/rccm.200808-1274oc · Cited by 410
The Innate Immune Response to Adenovirus Vectors
Muruve, D. A. (2004) · Human Gene Therapy · doi:10.1089/hum.2004.15.1157 · Cited by 408
Extracellular ATP Is a Danger Signal Activating P2X7 Receptor in Lung Inflammation and Fibrosis
Riteau, N., Gasse, P., Fauconnier, L., Gombault, A., Couegnat, M., Fick, L., Kanellopoulos, J., Quesniaux, V. F. J., Marchand-Adam, S., Crestani, B., et al. (2010) · American Journal of Respiratory and Critical Care Medicine · doi:10.1164/rccm.201003-0359oc · Cited by 397
Oxidized ATP. An irreversible inhibitor of the macrophage purinergic P2Z receptor.
Murgia, M., Hanau, S., Pizzo, P., Rippa, M., & Virgilio, F. D. (1993) · Journal of Biological Chemistry · doi:10.1016/s0021-9258(18)53082-9 · Cited by 367
Schmitz, N., Kurrer, M. O., Bachmann, M. F., & Köpf, M. (2005) · Journal of Virology · doi:10.1128/jvi.79.10.6441-6448.2005 · Cited by 364
The pathogenesis of influenza virus infections: the contributions of virus and host factors
Fukuyama, S., & Kawaoka, Y. (2011) · Current Opinion in Immunology · doi:10.1016/j.coi.2011.07.016 · Cited by 295
Chen, J., & Subbarao, K. (2007) · Annual Review of Immunology · doi:10.1146/annurev.immunol.25.022106.141706 · Cited by 256
P2X7-related modulation of pathological nociception in rats
McGaraughty, S., Chu, K. L., Namovic, M. T., Donnelly‐Roberts, D. L., Harris, R. R., Zhang, X.-F., Shieh, C. C., Wismer, C. T., Zhu, C. Z., Gauvin, D. M., et al. (2007) · Neuroscience · doi:10.1016/j.neuroscience.2007.03.035 · Cited by 224
Lack of the purinergic receptor P2X7 results in resistance to contact hypersensitivity
Weber, F. C., Esser, P. R., Müller, T., Ganesan, J., Pellegatti, P., Simon, M. M., Zeiser, R., Idzko, M., Jakob, T., & Martin, S. F. (2010) · The Journal of Experimental Medicine · doi:10.1084/jem.20092489 · Cited by 221
Dependence of Adenovirus Infectivity on Length of the Fiber Shaft Domain
Shayakhmetov, D. M., & Lieber, A. (2000) · Journal of Virology · doi:10.1128/jvi.74.22.10274-10286.2000 · Cited by 197
Evidence that the gap junction protein connexin-43 is the ATP-induced pore of mouse macrophages
Beyer, E. C., & Steinberg, T. H. (1991) · Journal of Biological Chemistry · doi:10.1016/s0021-9258(18)92924-8 · Cited by 196
Adriouch, S., Dox, C., Welge, V., Séman, M., Koch‐Nolte, F., & Haag, F. (2002) · The Journal of Immunology · doi:10.4049/jimmunol.169.8.4108 · Cited by 196
Inflammasomes as mediators of immunity against influenza virus
Pang, I. K., & Iwasaki, A. (2010) · Trends in Immunology · doi:10.1016/j.it.2010.11.004 · Cited by 176
Pathogenesis of emerging avian influenza viruses in mammals and the host innate immune response
Maines, T. R., Szretter, K. J., Perrone, L. A., Belser, J. A., Bright, R. A., Zeng, H., Tumpey, T. M., & Katz, J. M. (2008) · Immunological Reviews · doi:10.1111/j.1600-065x.2008.00690.x · Cited by 172
P2 receptors and extracellular ATP a novel homeostatic pathway in inflammation
Bours, M. J. L. (2011) · Frontiers in Bioscience-Scholar · doi:10.2741/235 · Cited by 162
Zsengellér, Z. K., Otake, K., Hossain, S.-A., Berclaz, P., & Trapnell, B. C. (2000) · Journal of Virology · doi:10.1128/jvi.74.20.9655-9667.2000 · Cited by 156
A Potential Role for P2X7R in Allergic Airway Inflammation in Mice and Humans
Müller, T., Vieira, R. P., Grimm, M., Dürk, T., Cicko, S., Zeiser, R., Jakob, T., Martin, S. F., Blumenthal, B., Sorichter, S., et al. (2010) · American Journal of Respiratory Cell and Molecular Biology · doi:10.1165/rcmb.2010-0129oc · Cited by 147
Purinergic Receptor Inhibition Prevents the Development of Smoke-Induced Lung Injury and Emphysema
Cicko, S., Lucattelli, M., Müller, T., Lommatzsch, M., Cunto, G. D., Cardini, S., Sundas, W., Grimm, M., Zeiser, R., Dürk, T., et al. (2010) · The Journal of Immunology · doi:10.4049/jimmunol.0904042 · Cited by 128
P2X7 Deficiency Attenuates Renal Injury in Experimental Glomerulonephritis
Taylor, S. R. J., Turner, C. M., Elliott, J. I., McDaid, J., Hewitt, R., Smith, J., Pickering, M. C., Whitehouse, D. L., Cook, H. T., Burnstock, G., et al. (2009) · Journal of the American Society of Nephrology · doi:10.1681/asn.2008060559 · Cited by 123
Oxidized ATP (oATP) attenuates proinflammatory signaling via P2 receptor‐independent mechanisms
Beigi, R. D., Kertesy, S. B., Aquilina, G. R., & Dubyak, G. (2003) · British Journal of Pharmacology · doi:10.1038/sj.bjp.0705470 · Cited by 120
Kuz'min, A. N., Finegold, M. J., & Eisensmith, R. (1997) · Gene Therapy · doi:10.1038/sj.gt.3300377 · Cited by 94
Nucleotide receptor signaling in murine macrophages is linked to reactive oxygen species generation
Pfeiffer, Z. A., Guerra, A. N., Hill, L. M., Gavala, M. L., Prabhu, U., Aga, M., Hall, D. J., & Bertics, P. J. (2007) · Free Radical Biology and Medicine · doi:10.1016/j.freeradbiomed.2007.02.010 · Cited by 87
Adenoviral Vectors for Gene Replacement Therapy
Cao, H., Koehler, D. R., & Hu, J. (2004) · Viral Immunology · doi:10.1089/vim.2004.17.327 · Cited by 82
Self-citationTeramoto, S., Johnson, L. G., Huang, W., Leigh, M. W., & Boucher, R. C. (1995) · Human Gene Therapy · doi:10.1089/hum.1995.6.8-1045 · Cited by 74
Lee, B. H., Kushwah, R., Wu, J., Ng, P., Palaniyar, N., Grinstein, S., Philpott, D. J., & Hu, J. (2010) · Immunology Letters · doi:10.1016/j.imlet.2010.09.003 · Cited by 17
Self-citation
Cited by
Sorted by citations
Going viral with cancer immunotherapy
Lichty, B. D., Breitbach, C. J., Stojdl, D. F., & Bell, J. C. (2014) · Nature reviews. Cancer · doi:10.1038/nrc3770 · Cited by 608
The P2X7 Receptor in Inflammatory Diseases: Angel or Demon?
Savio, L. E. B., de Andrade Mello, P., da Silva, C. G., & Coutinho-Silva, R. (2018) · Frontiers in Pharmacology · doi:10.3389/fphar.2018.00052 · Cited by 437
Purinergic Signalling: Therapeutic Developments
Burnstock, G. (2017) · Frontiers in Pharmacology · doi:10.3389/fphar.2017.00661 · Cited by 422
The P2X7 receptor: A main player in inflammation
Adinolfi, E., Giuliani, A. L., De Marchi, E., Pegoraro, A., Orioli, E., & Di Virgilio, F. (2018) · Biochemical Pharmacology · doi:10.1016/j.bcp.2017.12.021 · Cited by 385
Snyder, A. G., Hubbard, N., Messmer, M. N., Kofman, S. B., Hagan, C. E., Orozco, S. L., Chiang, K., Daniels, B. P., Baker, D. A., & Oberst, A. (2019) · Science Immunology · doi:10.1126/sciimmunol.aaw2004 · Cited by 382
Metadata
- Authors
- Lee, B. H., Hwang, D. M., Palaniyar, N., Grinstein, S., Philpott, D. J., & Hu, J.
- Affiliations
- University of Toronto (CA)
- University Health Network (CA)
- Corresponding author
- Hu, Jim
- Venue
- PLoS ONE
- Publisher
- Public Library of Science (PLoS)
- Published
- 2012-04-25
- Volume
- 7
- Issue
- 4
- Pages
- e35812
- ISSN
- 1932-6203 (ISSN-L)
- PMC
- PMC3338466
- OpenAlex
- W2072521717
- Cited by
- 102
- References
- 48
- Citations by year
- 2026: 4 · 2025: 2 · 2024: 6 · 2023: 6 · 2022: 7 · 2021: 11 · 2020: 7 · 2019: 7 · 2018: 8 · 2017: 15 · 2016: 9 · 2015: 5 · 2014: 7 · 2013: 6 · 2012: 2
- FWCI
- 4.49
- Type
- journal article
- Language
- en
- Open access
- gold
- doi.org
- Locations
- PLoS ONE (publishedVersion, cc-by)
- PubMed Central (publishedVersion, cc-by)
- PubMed (publishedVersion)
- DOAJ (DOAJ: Directory of Open Access Journals) (submittedVersion)
- Figshare (submittedVersion, cc-by)
- Funders
- Cystic Fibrosis Canada
- Canadian Institutes of Health Research
- Topics
- Life Sciences › Biochemistry, Genetics and Molecular Biology › Physiology › Adenosine and Purinergic Signaling
- Life Sciences › Biochemistry, Genetics and Molecular Biology › Molecular Biology › Inflammasome and immune disorders
- Life Sciences › Immunology and Microbiology › Immunology › Immune Response and Inflammation
- Keywords
- P2X7 receptor, ATP signaling, acute viral infection, adenoviral vector, macrophage activation, inflammasome, caspase-1, IL-1β, interleukin-6, neutrophil infiltration, acute respiratory distress syndrome, innate immunity
- MeSH terms
- Acute Disease, Adenosine Triphosphate, Adenoviridae, Adenoviridae Infections, Animals, Cell Communication, Enzyme Inhibitors, Epithelial Cells, Immunity, Innate, Inflammation, Macrophages, Signal Transduction, Interleukin-6, Mice, Knockout, Coculture Techniques, Caspase 1, Neutrophil Infiltration, Mice, Interleukin-1beta, Receptors, Purinergic P2X7, Inflammasomes, Caspase Inhibitors
About these checks
Registry, retraction, Cites and statistics results are computed, not judged, with one exception: a printed reference that no index lists is read once by a model before it counts as a citation error. Claims are extracted by a model and kept only when their quote appears verbatim in the text; each cited source is then checked, with a model’s help, for whether it says what the claim relies on. Those verdicts can be wrong — read the claim’s quote and the cited source before relying on one.
Statistics and arithmetic are recomputed, not judged.
Confidence bands are shown only for fields calibrated on our annotated test set. None is calibrated yet, so no band is shown.
What counts as a claim ›How we measure confidence ›How we check this ›
Are you an author, or do you see a problem with this page? Request a review
