

The DOI matches its Crossref record; 57 of the 58 references it cites were found in a registry or an index; 14 of the 44 sources its claims cite were checked for support.
MicroRNA-146a: A Key Regulator of Astrocyte-Mediated Inflammatory Response
Open accessAbstract
Increasing evidence supports the involvement of microRNAs (miRNA) in the regulation of inflammation in human neurological disorders. In the present study we investigated the role of miR-146a, a key regulator of the innate immune response, in the modulation of astrocyte-mediated inflammation. Using Taqman PCR and in situ hybridization, we studied the expression of miR-146a in epilepsy-associated glioneuronal lesions which are characterized by prominent activation of the innate immune response. In addition, cultured human astrocytes were used to study the regulation of miR-146a expression in response to proinflammatory cytokines. qPCR and western blot were used to evaluate the effects of overexpression or knockdown of miR-146a on IL-1β signaling. Downstream signaling in the IL-1β pathway, as well as the expression of IL-6 and COX-2 were evaluated by western blot and ELISA. Release several cytokines was evaluated using a human magnetic multiplex cytokine assay on a Luminex® 100™/200™ platform. Increased expression of miR-146a was observed in glioneuronal lesions by Taqman PCR. MiR-146a expression in human glial cell cultures was strongly induced by IL-1β and blocked by IL-1β receptor antagonist. Modulation of miR-146a expression by transfection of astrocytes with anti-miR146a or mimic, regulated the mRNA expression levels of downstream targets of miR-146a (IRAK-1, IRAK-2 and TRAF-6) and the expression of IRAK-1 protein. In addition, the expression of IL-6 and COX-2 upon IL-1β stimulation was suppressed by increased levels of miR-146a and increased by the reduction of miR-146a. Modulation of miR-146a expression affected also the release of several cytokines such as IL-6 and TNF-α. Our observations indicate that in response to inflammatory cues, miR-146a was induced as a negative-feedback regulator of the astrocyte-mediated inflammatory response. This supports an important role of miR-146a in human neurological disorders associated with chronic inflammation and suggests that this miR may represent a novel target for therapeutic strategies.
Overview
AI snapshot
Written from the paper’s full text.
TL;DR
This study shows that miR-146a is upregulated in epilepsy-associated glioneuronal lesions and is induced in cultured human glial cells by IL-1β, where it acts as a negative-feedback regulator of astrocyte-mediated inflammatory signaling. Modulating miR-146a alters downstream TIR-pathway targets and IL-1β-induced inflammatory mediators.
Key findings
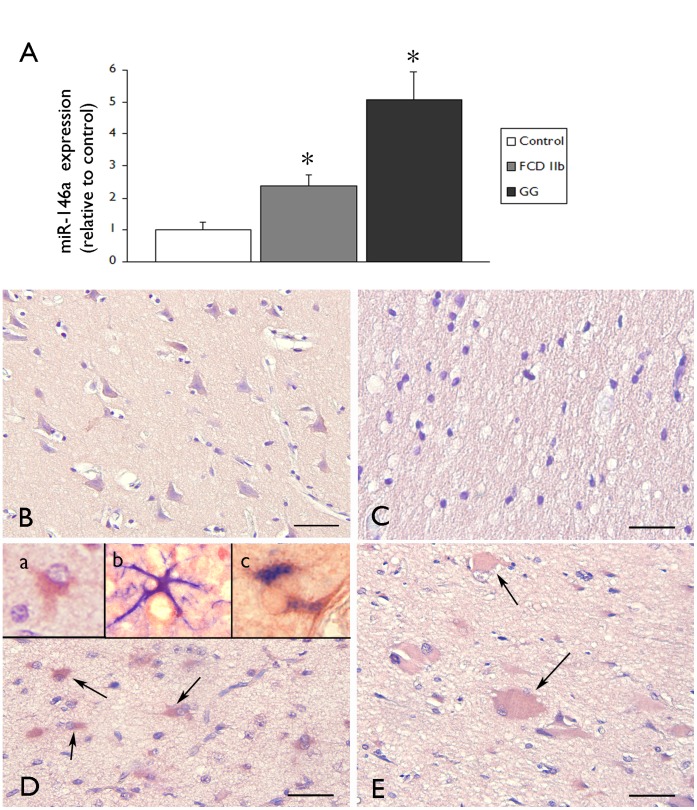
- miR-146a expression was significantly increased in ganglioglioma (GG) and focal cortical dysplasia type IIb (FCD IIb) compared with control cortex by qPCR (control cortex n=6 autopsy; FCD IIb n=6; GG n=5; *P<0.05). In situ hybridization showed miR-146a was undetectable in glial cells in control grey and white matter, but was expressed in GFAP-positive reactive astrocytes and balloon cells in FCD IIb; no detectable expression was seen in HLA-DR-positive microglial/macrophage cells.
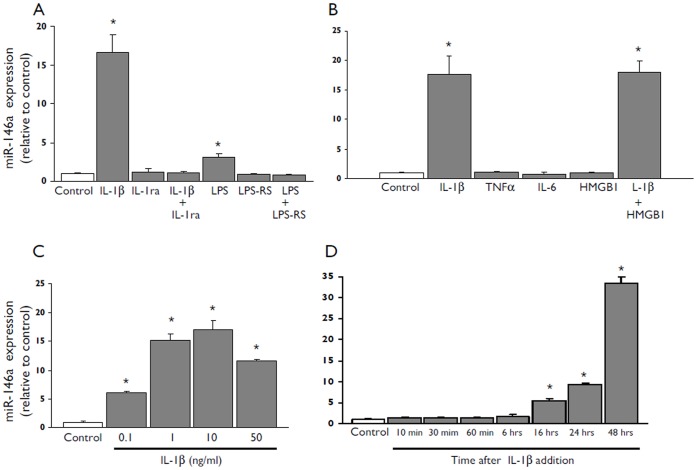
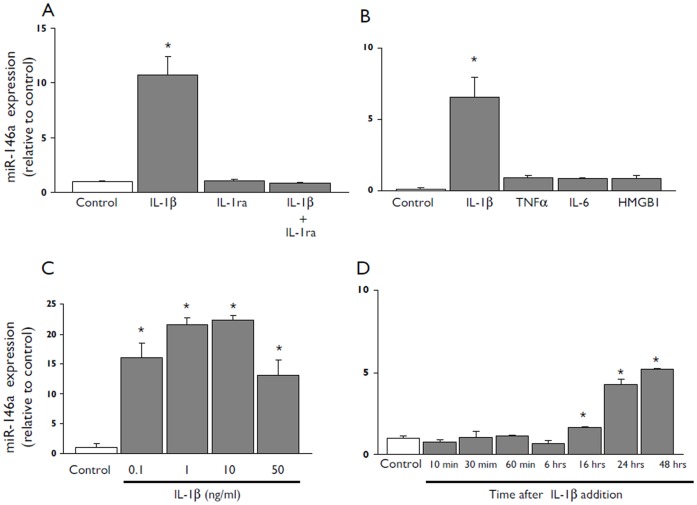
- In U373 glioblastoma cells and human fetal astrocytes, IL-1β strongly induced miR-146a; this was blocked by IL-1 receptor antagonist. LPS induced lower miR-146a and was blocked by LPS-RS, whereas IL-6 (10 ng/ml), TNFα (1 ng/ml), and HMGB1 (40 nM) did not significantly increase miR-146a. IL-1β effects began at 0.1 ng/ml, were maximal at 1–50 ng/ml, and increased miR-146a levels were detected 16 h after exposure.
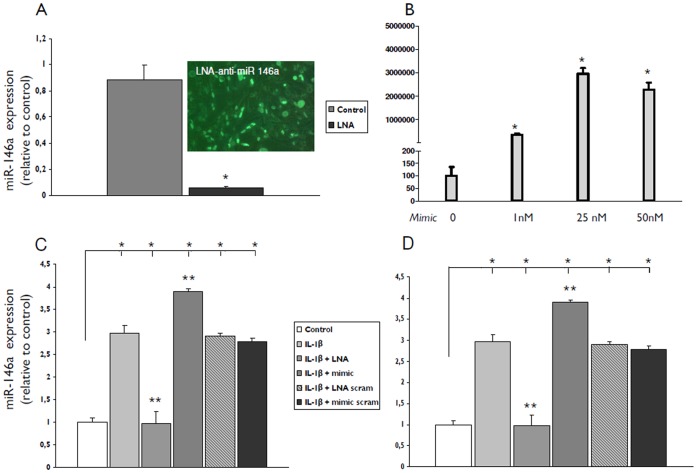
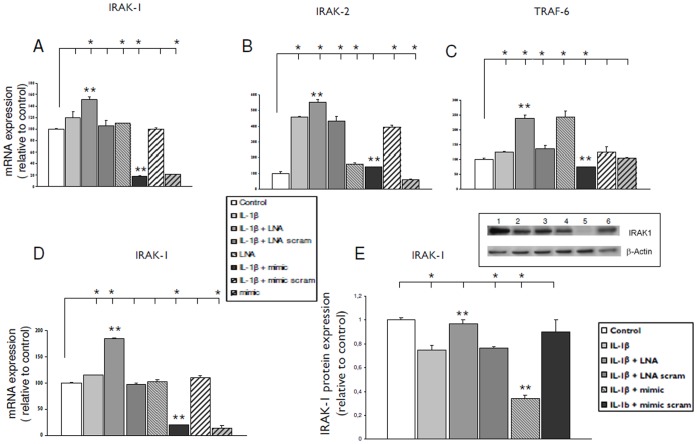
- Transfection with miR-146a mimic reduced IL-1β-stimulated IRAK-1, IRAK-2, and TRAF-6 mRNA and IRAK-1 protein; LNA-anti-miR-146a increased IRAK-1, IRAK-2, and TRAF-6 mRNA. No significant differences in IRAK-2 and TRAF-6 proteins were observed.
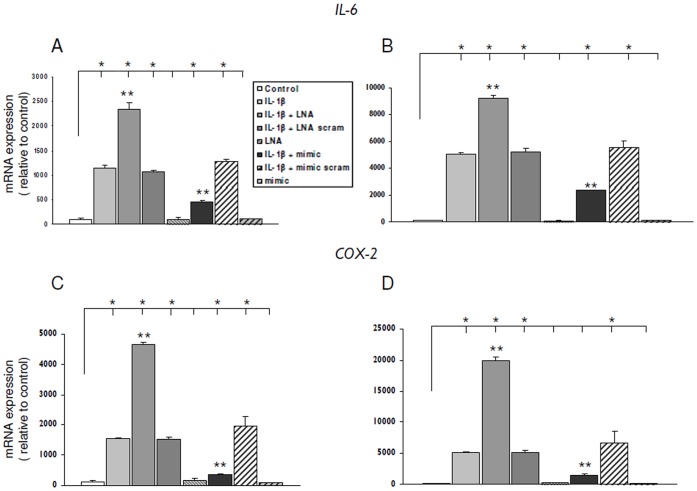
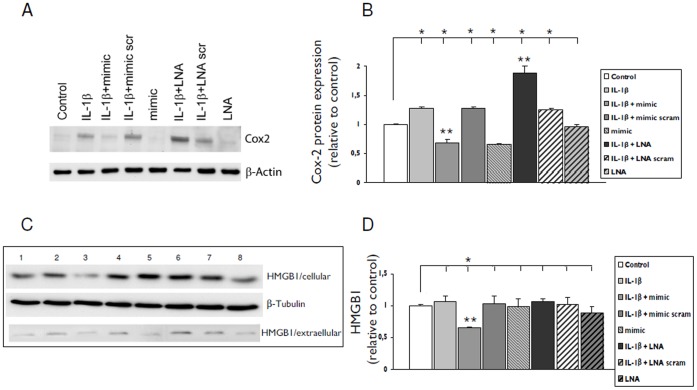
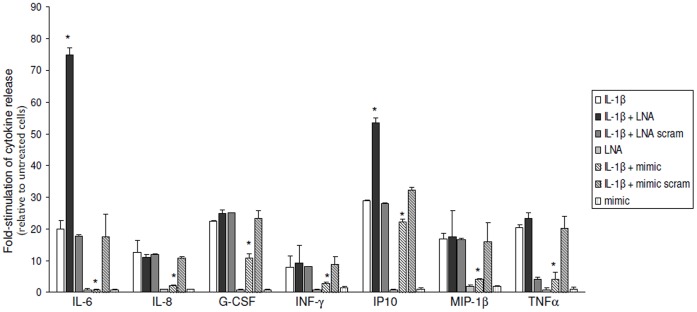
- miR-146a mimic reduced IL-1β-induced IL-6 and COX-2 mRNA and COX-2 protein, while LNA-anti-miR-146a increased them. IL-1β increased release of IL-6, IL-8, IFN-γ, IP-10, MIP-1β, G-CSF, Rantes, and TNF-α; anti-miR-146a significantly increased IL-6 and IP-10, whereas mimic significantly decreased IL-6, IL-8, G-CSF, IFN-γ, IP-10, MIP-1β, and TNF-α. MCP-1 release was reduced by miR-146a mimic (control: 1582±193 pg/ml; IL-1β: 27151±1368 pg/ml; IL-1β + miR-146a mimic: 11054±2027 pg/ml; p<0.05 vs IL-1β).
Methods
- Human surgical epilepsy specimens included GG and FCD IIb, with autopsy control cortex and histologically normal surgical temporal neocortex as controls. miR-146a expression was assessed by Taqman qPCR and in situ hybridization, including double labeling with GFAP or HLA-DR.
- Cultured human glial cells included the U373 glioblastoma cell line and human fetal astrocyte-enriched cultures. Cells were treated with IL-1β, LPS, IL-6, TNFα, HMGB1, IL-1Ra, or LPS-RS, and transfected with LNA-anti-miR-146a or miR-146a mimic.
- Downstream effects were measured by qPCR, western blot, ELISA for MCP-1, and a human magnetic multiplex cytokine assay on a Luminex 100/200 platform for 16 cytokines/chemokines. Statistics used two-tailed Student’s t-test or Kruskal–Wallis with Dunn’s post hoc test; P<0.05 was significant.
Limitations
- Stated: further investigation is needed to evaluate levels of different miR-146a targets in GG and FCD, and balloon cell function could be evaluated in a culture system. The paper also notes that miR-146a effects on multiple targets may vary by cell type and stimulus, that IL-1β-induced miR-146a levels were not sufficient to significantly reduce the studied targets, and that overexpression was required to exert an anti-inflammatory effect.
- Evident: human tissue sample sizes were small (control cortex n=6, FCD IIb n=6, GG n=5), and much of the mechanistic work used the U373 glioblastoma cell line and fetal astrocytes rather than adult human astrocytes in situ. Some fetal astrocyte results for IRAK-2 and TRAF-6 are described as “data not shown.”
Model-written summary. Check it against the paper before relying on it.
Integrity signals
Registry
Cites
Statistics
Figures
Verification
Claims the paper makes
53 Own result · 10 Own interpretation · 6 Supported so far · 6 No full text of the sources · 4 Own method · 3 Partly supported · 2 Not checked yet · 1 Supported · 1 No basis given · accuracy not yet measured
The sources with a verdict support this claim; the rest weren’t checked yet, have no full text we could read, or their verdicts aren’t rated yet.
In the paper
“During the last decade, both experimental and clinical studies have demonstrated the relevance of inflammation in the pathophysiology of epilepsy (for reviews see [1]–[3].”
§ MicroRNA-146a: A Key Regulator of Astrocyte-Mediated Inflammatory Response > Introduction
What the sources say
- Supportedcites [1] Vezzani A, Ravizza T, Balosso S, Aronica E (2008) Glia as a source of cytokines: implications for neuronal excitability and survival. Epilepsia 49: 24– 32. 18226169 source
The Concluding Remarks state that experimental and clinical evidence demonstrates chronic inflammation in the epileptic brain. They also describe ways inflammatory signaling may contribute to epileptogenesis and seizure generation, supporting the broad claim that inflammation is relevant to epilepsy’s pathophysiology. Page numbers are not supplied in our copy. (LLM, conf=0.93)
- Not checked — no full text of the sourcecites [2] Vezzani A, Aronica E, Mazarati A, Pittman QJ (2011) Epilepsy and brain inflammation. Exp Neurol. 21985866 source
- Supportedcites [3] Aronica E, Crino PB (2011) Inflammation in epilepsy: clinical observations. Epilepsia 52 Suppl 3 26– 32. 21542843 source
The Abstract states that inflammatory processes occur in focal epilepsies and that evidence suggests inflammation may contribute to seizures. This supports the broad claim that inflammation is relevant to epilepsy pathophysiology, without establishing that it causes epilepsy. (LLM, conf=0.92)
boostedcorrelational- Asserted: passes — The authors put it forward as true.
- Checkable: passes — It can be checked against evidence.
- Load-bearing: passes — The paper’s conclusions depend on it.
- Based: passes — The paper gives a reason why it holds.
- Supported
Every source the paper cites for this claim was checked and supports it.
In the paper
“Both the innate and the adaptive immune responses are activated in these lesions ([5]; reviewed in [3]).”
§ MicroRNA-146a: A Key Regulator of Astrocyte-Mediated Inflammatory Response > Introduction
What the sources say
- Supportedcites [5] Boer K, Crino PB, Gorter JA, Nellist M, Jansen FE, et al (2010) Gene Expression Analysis of Tuberous Sclerosis Complex Cortical Tubers Reveals Increased Expression of Adhesion and Inflammatory Factors. Brain Pathol 20: 704– 719. 19912235 PMC2888867 source
The Discussion’s “Perituberal tissue” section states that the data indicate activation of innate and adaptive immunity in both TSC cortical tubers and epilepsy-associated gangliogliomas. This directly supports the claim about these lesions. (LLM, conf=0.93)
- Supportedcites [3] Aronica E, Crino PB (2011) Inflammation in epilepsy: clinical observations. Epilepsia 52 Suppl 3 26– 32. 21542843 source
The section on tuberous sclerosis complex states that inflammatory changes in cortical tuber lesions include both innate and adaptive immune responses (page unavailable). The focal cortical dysplasia section also reports activated microglia and some activation of adaptive immunity. (LLM, conf=0.94)
plaincorrelational- Asserted: passes — The authors put it forward as true.
- Checkable: passes — It can be checked against evidence.
- Load-bearing: unclear — It is unclear whether the paper’s conclusions depend on it.
- Based: passes — The paper gives a reason why it holds.
- Supported
The cited sources support only part of this claim — read each source’s verdict below.
In the paper
“In particular, both in vitro and in vivo data, point to the role of astrocytes as a major source and/or targets of pro-epileptogenic inflammatory signaling, such as the interleukin(IL)-1, High Mobility Group Box 1 (HMGB1) and Toll-like receptor (TLR) signaling pathways [1], [3], [6]–[9].”
§ MicroRNA-146a: A Key Regulator of Astrocyte-Mediated Inflammatory Response > Introduction
What the sources say
- Partly supportedcites [1] Vezzani A, Ravizza T, Balosso S, Aronica E (2008) Glia as a source of cytokines: implications for neuronal excitability and survival. Epilepsia 49: 24– 32. 18226169 sourceExperimental — accuracy not yet measured
The ‘Cytokines in Human Epileptic Tissue’ section (page not supplied) reports that astrocytes express IL-1β and its receptor, supporting their role as sources and targets of IL-1 signaling. The ‘Concluding Remarks’ describe the IL-1β–IL-1R1 system as a potentially harmful pathway in epileptogenesis. The supplied passages and searches do not establish the claimed astrocyte roles in HMGB1 or TLR signaling. (LLM, conf=0.88)
- Supportedcites [3] Aronica E, Crino PB (2011) Inflammation in epilepsy: clinical observations. Epilepsia 52 Suppl 3 26– 32. 21542843 source
In the Hippocampal sclerosis (HS) section (page unavailable), the paper reports persistent IL-1β-system activation involving astrocytes and prominent HMGB1 and TLR4 expression in reactive astrocytes. It also describes HMGB1–TLR4 signaling as contributing to seizures in animal models. Together, these passages support the cited characterization of astrocytes’ involvement in pro-epileptogenic inflammatory signaling. (LLM, conf=0.87)
- Not checked — no full text of the sourcecites [6] Maroso M, Balosso S, Ravizza T, Liu J, Aronica E, et al (2010) Toll-like receptor 4 and high-mobility group box-1 are involved in ictogenesis and can be targeted to reduce seizures. Nat Med 16: 413– 419. 20348922 source
- Not checked — no full text of the sourcecites [7] Vezzani A, Maroso M, Balosso S, Sanchez MA, Bartfai T (2011) IL-1 receptor/Toll-like receptor signaling in infection, inflammation, stress and neurodegeneration couples hyperexcitability and seizures. Brain Behav Immun. 21473909 source
- Not checked — no full text of the sourcecites [8] Maroso M, Balosso S, Ravizza T, Liu J, Bianchi ME, et al (2011) Interleukin-1 type 1 receptor/Toll-like receptor signalling in epilepsy: the importance of IL-1beta and high-mobility group box 1. J Int Med 270: 319– 326. 21793950 source
- Not checked — no full text of the sourcecites [9] Zurolo E, Iyer A, Maroso M, Carbonell C, Anink JJ, et al (2011) Activation of Toll-like receptor, RAGE and HMGB1 signalling in malformations of cortical development. Brain 134: 1015– 1032. 21414994 source
boostedcorrelational- Asserted: passes — The authors put it forward as true.
- Checkable: passes — It can be checked against evidence.
- Load-bearing: passes — The paper’s conclusions depend on it.
- Based: passes — The paper gives a reason why it holds.
- Partly supported
The sources with a verdict support this claim; the rest weren’t checked yet, have no full text we could read, or their verdicts aren’t rated yet.
In the paper
“In particular, miRNA-146a has been associated with the regulation of Toll-like and interleukin-1 receptors (TIRs) signaling [15], [17]–[19].”
§ MicroRNA-146a: A Key Regulator of Astrocyte-Mediated Inflammatory Response > Introduction
What the sources say
- Not checked — no full text of the sourcecites [15] Quinn SR, O'Neill LA (2011) A trio of microRNAs that control Toll-like receptor signalling. Int Immunol 23: 421– 425. 21652514 source
- Supportedcites [17] Taganov KD, Boldin MP, Chang KJ, Baltimore D (2006) NF-kappaB-dependent induction of microRNA miR-146, an inhibitor targeted to signaling proteins of innate immune responses. Proc Nat Acad Sci USA 103: 12481– 12486. 16885212 PMC1567904 source
The Abstract proposes that miR-146 regulates Toll-like receptor and cytokine signaling through IRAK1 and TRAF6. The Results identify those proteins as key adapters in Toll-like and IL-1 receptor signaling, supporting the citing sentence’s hedged association. Page numbers were not provided in our copy. (LLM, conf=0.92)
- Not checked — no full text of the sourcecites [18] Sheedy FJ, O'Neill LA (2008) Adding fuel to fire: microRNAs as a new class of mediators of inflammation. Ann Rheum Dis 67 Suppl 3 iii50– 55. 19022814 source
- Supportedcites [19] Cui JG, Li YY, Zhao Y, Bhattacharjee S, Lukiw WJ (2010) Differential regulation of interleukin-1 receptor-associated kinase-1 (IRAK-1) and IRAK-2 by microRNA-146a and NF-kappaB in stressed human astroglial cells and in Alzheimer disease. J Biol Chem 285: 38951– 38960. 20937840 PMC2998119 source
The Abstract describes miRNA-146a’s involvement in TLR/IL-1R–IRAK–NF-κB inflammatory signaling. The “miRNA-146a and IRAK-2 Signaling in AD Brain” section places its regulatory role within the TLR/IL-1R signaling axis, supporting the claimed association. (LLM, conf=0.93)
plaincorrelational- Asserted: passes — The authors put it forward as true.
- Checkable: passes — It can be checked against evidence.
- Load-bearing: passes — The paper’s conclusions depend on it.
- Based: passes — The paper gives a reason why it holds.
The sources with a verdict support this claim; the rest weren’t checked yet, have no full text we could read, or their verdicts aren’t rated yet.
In the paper
“miRNA-146a is expressed in human brain in astrocytes which may be key targets in the regulation of this miRNA in response to inflammatory molecules [19], [20].”
§ MicroRNA-146a: A Key Regulator of Astrocyte-Mediated Inflammatory Response > Introduction
What the sources say
- Supportedcites [19] Cui JG, Li YY, Zhao Y, Bhattacharjee S, Lukiw WJ (2010) Differential regulation of interleukin-1 receptor-associated kinase-1 (IRAK-1) and IRAK-2 by microRNA-146a and NF-kappaB in stressed human astroglial cells and in Alzheimer disease. J Biol Chem 285: 38951– 38960. 20937840 PMC2998119 source
The 'miRNA-146a and IRAK-2 Signaling in AD Brain' section reports miRNA-146a in human brain tissue and its up-regulation in primary human astroglial cells, including after inflammatory stimulation. The paper does not localize the brain-tissue signal to individual astrocytes, but its astroglial-cell findings support the attributed expression claim. (LLM, conf=0.86)
- Check pendingcites [20] Aronica E, Fluiter K, Iyer A, Zurolo E, Vreijling J, et al (2010) Expression pattern of miR-146a, an inflammation-associated microRNA, in experimental and human temporal lobe epilepsy. Eur J Neurosci 31: 1100– 1107. 20214679 source
plain- Asserted: passes — The authors put it forward as true.
- Checkable: passes — It can be checked against evidence.
- Load-bearing: passes — The paper’s conclusions depend on it.
- Based: passes — The paper gives a reason why it holds.
- Supported
The sources with a verdict support this claim; the rest weren’t checked yet, have no full text we could read, or their verdicts aren’t rated yet.
In the paper
“In particular, upregulation of miR146a has been detected in active multiple sclerosis lesions [39] and in human Alzheimer disease (AD) brain [19], suggesting a key role of this miRNA in governing astrocyte activation and function in both pathologies.”
§ MicroRNA-146a: A Key Regulator of Astrocyte-Mediated Inflammatory Response > Discussion
What the sources say
- Not checked — no full text of the sourcecites [39] Junker A, Krumbholz M, Eisele S, Mohan H, Augstein F, et al (2009) MicroRNA profiling of multiple sclerosis lesions identifies modulators of the regulatory protein CD47. Brain 132: 3342– 3352. 19952055 source
- Supportedcites [19] Cui JG, Li YY, Zhao Y, Bhattacharjee S, Lukiw WJ (2010) Differential regulation of interleukin-1 receptor-associated kinase-1 (IRAK-1) and IRAK-2 by microRNA-146a and NF-kappaB in stressed human astroglial cells and in Alzheimer disease. J Biol Chem 285: 38951– 38960. 20937840 PMC2998119 source
The citation to this paper is attached to the Alzheimer disease (AD) brain finding; the multiple sclerosis finding has a separate citation. The section “miRNA-146a and IRAK-2 Signaling in AD Brain” reports miRNA-146a upregulation in AD brain, and the Abstract describes its regulation in stressed human astroglial cells. The paper therefore supports the cited AD finding and the suggested role in astroglial inflammatory signaling. (LLM, conf=0.93)
hedgeddirect- Asserted: passes — The authors put it forward as true.
- Checkable: passes — It can be checked against evidence.
- Load-bearing: passes — The paper’s conclusions depend on it.
- Based: passes — The paper gives a reason why it holds.
A result the paper reports from its own data — it cites no other source for it, so there is none to check. The quote shows it is in the paper.
In the paper
“and blocked by LPS-RS (Fig. 2 A).”
§ MicroRNA-146a: A Key Regulator of Astrocyte-Mediated Inflammatory Response > Results > Regulation of miR-146a Expression by IL-1β in Human Glial Cells in Culture
plaindirect- Asserted: passes — The authors put it forward as true.
- Checkable: passes — It can be checked against evidence.
- Load-bearing: passes — The paper’s conclusions depend on it.
- Based: passes — The paper gives a reason why it holds.
A result the paper reports from its own data — it cites no other source for it, so there is none to check. The quote shows it is in the paper.
In the paper
“Western blot analysis confirmed the different effects of LNA-anti-miR-146a and miR-146a mimic on COX-2 protein expression in IL-1ß stimulated cells; transfection with miR-146a mimic reduced whereas LNA-anti-miR-146a increased the COX-2 expression (Fig. 7 A–B).”
§ MicroRNA-146a: A Key Regulator of Astrocyte-Mediated Inflammatory Response > Results > Effects of miR-146a Inhibition or Overexpression on IL-1β Mediated Induction of IL-6 and COX-2
plaindirect- Asserted: passes — The authors put it forward as true.
- Checkable: passes — It can be checked against evidence.
- Load-bearing: passes — The paper’s conclusions depend on it.
- Based: passes — The paper gives a reason why it holds.
- Rests on an assumption: The U373 glioblastoma cell line and human fetal astrocytes in culture are adequate models of human glial cells in epileptogenic lesions for studying miR-146a-mediated inflammatory responses.
A result the paper reports from its own data — it cites no other source for it, so there is none to check. The quote shows it is in the paper.
In the paper
“In FCD specimens miR-146a expression was detected in glial cells with typical astroglia morphology, particularly in the areas of prominent gliosis (Fig. 1 D).”
§ MicroRNA-146a: A Key Regulator of Astrocyte-Mediated Inflammatory Response > Results > miR-146a Expression in GG and FCD Type IIb
plaincorrelational- Asserted: passes — The authors put it forward as true.
- Checkable: passes — It can be checked against evidence.
- Load-bearing: passes — The paper’s conclusions depend on it.
- Based: passes — The paper gives a reason why it holds.
In the paper
“MiR-146a expression in human glial cell cultures was strongly induced by IL-1β and blocked by IL-1β receptor antagonist.”
- Also stated in: § Regulation of miR-146a Expression by IL-1β in Human Glial Cells in Culture · plain
“The effect of IL-1ß was blocked by the IL-1ß ra, a naturally occurring antagonist of the IL-1 receptor ([36]; Fig. 2 A and Fig. 3 A).”
§ MicroRNA-146a: A Key Regulator of Astrocyte-Mediated Inflammatory Response > Abstract
What the sources say
- Not checked — no full text of the sourcecites [36] Dinarello CA (1996) Biologic basis for interleukin-1 in disease. Blood 87: 2095– 2147. 8630372 source
boosteddirect- Asserted: passes — The authors put it forward as true.
- Checkable: passes — It can be checked against evidence.
- Load-bearing: passes — The paper’s conclusions depend on it.
- Based: passes — The paper gives a reason why it holds.
- Also stated in: § Regulation of miR-146a Expression by IL-1β in Human Glial Cells in Culture · plain
- It may state two separate claims as one. 15
- Probably not a substantial claim. 8
The sources with a verdict support this claim; the rest weren’t checked yet, have no full text we could read, or their verdicts aren’t rated yet.
In the paper
“In particular, upregulation of miR146a has been detected in active multiple sclerosis lesions [39] and in human Alzheimer disease (AD) brain [19], suggesting a key role of this miRNA in governing astrocyte activation and function in both pathologies.”
§ MicroRNA-146a: A Key Regulator of Astrocyte-Mediated Inflammatory Response > Discussion
What the sources say
- Not checked — no full text of the sourcecites [39] Junker A, Krumbholz M, Eisele S, Mohan H, Augstein F, et al (2009) MicroRNA profiling of multiple sclerosis lesions identifies modulators of the regulatory protein CD47. Brain 132: 3342– 3352. 19952055 source
- Supportedcites [19] Cui JG, Li YY, Zhao Y, Bhattacharjee S, Lukiw WJ (2010) Differential regulation of interleukin-1 receptor-associated kinase-1 (IRAK-1) and IRAK-2 by microRNA-146a and NF-kappaB in stressed human astroglial cells and in Alzheimer disease. J Biol Chem 285: 38951– 38960. 20937840 PMC2998119 source
Citation [19] is attached to the claim about human Alzheimer disease brain, not the separate multiple sclerosis claim cited to [39]. The paper’s “miRNA-146a and IRAK-2 Signaling in AD Brain” section reports consistent miRNA-146a upregulation in AD-affected brain regions (Fig. 1); page numbers are not provided in our copy. (LLM, conf=0.94)
plaincorrelational- Asserted: passes — The authors put it forward as true.
- Checkable: passes — It can be checked against evidence.
- Load-bearing: passes — The paper’s conclusions depend on it.
- Based: passes — The paper gives a reason why it holds.
It may state two separate claims as one.
The sources with a verdict support this claim; the rest weren’t checked yet, have no full text we could read, or their verdicts aren’t rated yet.
In the paper
“Various miRNAs are also considered to represent a new class of mediators of inflammation [13]–[16].”
§ MicroRNA-146a: A Key Regulator of Astrocyte-Mediated Inflammatory Response > Introduction
What the sources say
- Not checked — no full text of the sourcecites [13] Sonkoly E, Stahle M, Pivarcsi A (2008) MicroRNAs and immunity: novel players in the regulation of normal immune function and inflammation. Seminars in Cancer Biology 18: 131– 140. 18291670 source
- Not checked — no full text of the sourcecites [14] Gantier MP (2010) New perspectives in MicroRNA regulation of innate immunity. J Interferon Cytokine Res 30: 283– 289. 20477549 source
- Not checked — no full text of the sourcecites [15] Quinn SR, O'Neill LA (2011) A trio of microRNAs that control Toll-like receptor signalling. Int Immunol 23: 421– 425. 21652514 source
- Supportedcites [16] Rusca N, Monticelli S (2011) MiR-146a in Immunity and Disease. Mol Biol Int 2011: 437301. 22091404 PMC3200075 source
Section 4 (page not provided) says several miRNAs are upregulated during the macrophage inflammatory response and describes miR-146a as a regulator that can prevent an overstimulated inflammatory state. This supports the broad characterization of various miRNAs as mediators of inflammation. (LLM, conf=0.90)
plaincorrelational- Asserted: passes — The authors put it forward as true.
- Checkable: passes — It can be checked against evidence.
- Load-bearing: fails — The paper’s conclusions may not depend on it.
- Based: passes — The paper gives a reason why it holds.
Probably not a substantial claim. The paper’s conclusions may not depend on it.
The cited sources support only part of this claim — read each source’s verdict below.
In the paper
“GG and FCD type IIb represent a major cause of drug-resistant epilepsy [23], [25] and are characterized by a prominent activation of various inflammatory pathways, including the TIR signaling pathway [9], [40]–[43].”
§ MicroRNA-146a: A Key Regulator of Astrocyte-Mediated Inflammatory Response > Discussion > MiR-146a Expression in GG and FCD IIB
What the sources say
- Not checked — no full text of the sourcecites [23] Blumcke I, Spreafico R (2011) An international consensus classification for focal cortical dysplasias. Lancet neurology 10: 26– 27. 21094091 source
- Partly supportedcites [25] Thom M, Blumcke I, Aronica E (2012) Long-term epilepsy associated tumours. Brain Pathology doi:10.1111/j.1750–3639.2012.00582.x. PMC8029234 22497610 sourceExperimental — accuracy not yet measured
The Introduction describes gangliogliomas as common in epilepsy surgical series and says long-term epilepsy-associated tumors are linked to pharmacologically intractable seizures. It does not establish FCD type IIb as a major cause of drug-resistant epilepsy; the tumor-adjacent dysplasia it discusses is classified as FCD type IIIb. Page numbers are unavailable in our copy. (LLM, conf=0.86)
plaindirect- Asserted: passes — The authors put it forward as true.
- Checkable: passes — It can be checked against evidence.
- Load-bearing: fails — The paper’s conclusions may not depend on it.
- Based: passes — The paper gives a reason why it holds.
Probably not a substantial claim. The paper’s conclusions may not depend on it.
The cited sources support only part of this claim — read each source’s verdict below.
In the paper
“In a rat model of TLE strong upregulation was detected in astrocytes 1 week after status epilepticus (during epileptogenesis) which corresponds to the latent period and the time of maximal astroglial activation and upregulation of various genes involved in the immune response [37], [38].”
§ MicroRNA-146a: A Key Regulator of Astrocyte-Mediated Inflammatory Response > Discussion
What the sources say
- Partly supportedcites [37] Gorter JA, Van Vliet E, Aronica E, Rauwerda H, Breit T, et al (2006) Potential New Antiepileptogenic Targets Indicated by Microarray Analysis in a Rat Model for Temporal Lobe Epilepsy. Journal of Neuroscience 26: 11083– 11110. 17065450 PMC6674659 sourceExperimental — accuracy not yet measured
Split into 2 atoms — 1 confirmed, 1 partially supported, 0 disputed, 0 misattributed, 0 unverifiable. Expand the claim to see per-atom verdicts.
- Not matchedcites [38] Aronica E, Gorter J (2007) Gene Expression Profile in Temporal Lobe Epilepsy. Neuroscientist 13: 1– 9. 17404370
Couldn’t be matched to a paper in Crossref, so it can’t be checked.
boostedcorrelational- Asserted: passes — The authors put it forward as true.
- Checkable: passes — It can be checked against evidence.
- Load-bearing: passes — The paper’s conclusions depend on it.
- Based: passes — The paper gives a reason why it holds.
It may state two separate claims as one.
- Partly supported
A result the paper reports from its own data — it cites no other source for it, so there is none to check. The quote shows it is in the paper.
In the paper
“Increased mRNA levels of IRAK-1, IRAK-2 and TRAF-6 were observed after transfection with LNA-anti miR-146a (Fig. 5 B–C, U373; Fig. 5 D, IRAK-1, fetal astrocytes).”
§ MicroRNA-146a: A Key Regulator of Astrocyte-Mediated Inflammatory Response > Results > Effects of miR-146a Inhibition or Overexpression on its Downstream Targets IRAK-1, IRAK-2 and TRAF-6
plaindirect- Asserted: passes — The authors put it forward as true.
- Checkable: passes — It can be checked against evidence.
- Load-bearing: passes — The paper’s conclusions depend on it.
- Based: passes — The paper gives a reason why it holds.
It may state two separate claims as one.
- Rests on an assumption: The U373 glioblastoma cell line and human fetal astrocytes in culture are adequate models of human glial cells in epileptogenic lesions for studying miR-146a-mediated inflammatory responses.
A result the paper reports from its own data — it cites no other source for it, so there is none to check. The quote shows it is in the paper.
In the paper
“Induction of miR-146a (although to a lower extent compared to IL-1ß) was also observed with LPS”
§ MicroRNA-146a: A Key Regulator of Astrocyte-Mediated Inflammatory Response > Results > Regulation of miR-146a Expression by IL-1β in Human Glial Cells in Culture
plaindirect- Asserted: passes — The authors put it forward as true.
- Checkable: passes — It can be checked against evidence.
- Load-bearing: unclear — It is unclear whether the paper’s conclusions depend on it.
- Based: passes — The paper gives a reason why it holds.
It may state two separate claims as one.
A result the paper reports from its own data — it cites no other source for it, so there is none to check. The quote shows it is in the paper.
In the paper
“The in vitro overexpression and knock-down studies showed that transfection with miR-146a mimic reduces the IL-6 and COX-2 mRNA levels in cultures stimulated with IL-1β, whereas LNA-anti-miR-146a had the opposite effect.”
§ MicroRNA-146a: A Key Regulator of Astrocyte-Mediated Inflammatory Response > Discussion > miR-146a Regulates the Expression IL-6 and COX-2
plaindirect- Asserted: passes — The authors put it forward as true.
- Checkable: passes — It can be checked against evidence.
- Load-bearing: passes — The paper’s conclusions depend on it.
- Based: passes — The paper gives a reason why it holds.
It may state two separate claims as one.
- Rests on an assumption: The U373 glioblastoma cell line and human fetal astrocytes in culture are adequate models of human glial cells in epileptogenic lesions for studying miR-146a-mediated inflammatory responses.
A result the paper reports from its own data — it cites no other source for it, so there is none to check. The quote shows it is in the paper.
In the paper
“The effect of IL-1β was concentration and time dependent and was observed from 16 hours after exposure to the cytokine.”
§ MicroRNA-146a: A Key Regulator of Astrocyte-Mediated Inflammatory Response > Discussion > miR-146a is Regulated in Human Glial Cells in Culture by IL-1β
plaindirect- Asserted: passes — The authors put it forward as true.
- Checkable: passes — It can be checked against evidence.
- Load-bearing: unclear — It is unclear whether the paper’s conclusions depend on it.
- Based: passes — The paper gives a reason why it holds.
It may state two separate claims as one.
- Rests on an assumption: The U373 glioblastoma cell line and human fetal astrocytes in culture are adequate models of human glial cells in epileptogenic lesions for studying miR-146a-mediated inflammatory responses.
A result the paper reports from its own data — it cites no other source for it, so there is none to check. The quote shows it is in the paper.
In the paper
“Both cell line and primary astrocytes were found to exhibit a prominent upregulation of miR-146a expression in response to IL-1β stimulation.”
§ MicroRNA-146a: A Key Regulator of Astrocyte-Mediated Inflammatory Response > Discussion > miR-146a is Regulated in Human Glial Cells in Culture by IL-1β
plaindirect- Asserted: passes — The authors put it forward as true.
- Checkable: passes — It can be checked against evidence.
- Load-bearing: passes — The paper’s conclusions depend on it.
- Based: passes — The paper gives a reason why it holds.
It may state two separate claims as one.
- Rests on an assumption: The U373 glioblastoma cell line and human fetal astrocytes in culture are adequate models of human glial cells in epileptogenic lesions for studying miR-146a-mediated inflammatory responses.
A result the paper reports from its own data — it cites no other source for it, so there is none to check. The quote shows it is in the paper.
In the paper
“Accordingly, transfection with LNA in the presence of IL-1ß which blocked the effect of miR-146a, further increased IRAK-1 and IRAK-2 mRNA, as well as IL-6 and COX-2 mRNA and protein levels in vitro.”
§ MicroRNA-146a: A Key Regulator of Astrocyte-Mediated Inflammatory Response > Discussion > miR-146a Regulates the Expression IL-6 and COX-2
plaindirect- Asserted: passes — The authors put it forward as true.
- Checkable: passes — It can be checked against evidence.
- Load-bearing: passes — The paper’s conclusions depend on it.
- Based: passes — The paper gives a reason why it holds.
It may state two separate claims as one.
- Rests on an assumption: The U373 glioblastoma cell line and human fetal astrocytes in culture are adequate models of human glial cells in epileptogenic lesions for studying miR-146a-mediated inflammatory responses.
A result the paper reports from its own data — it cites no other source for it, so there is none to check. The quote shows it is in the paper.
In the paper
“In contrast, LPS induced modest up-regulation whereas IL-6, TNFα and HMGB1 were not effective in inducing significant changes in miR-146a expression.”
§ MicroRNA-146a: A Key Regulator of Astrocyte-Mediated Inflammatory Response > Discussion > miR-146a is Regulated in Human Glial Cells in Culture by IL-1β
plaindirect- Asserted: passes — The authors put it forward as true.
- Checkable: passes — It can be checked against evidence.
- Load-bearing: passes — The paper’s conclusions depend on it.
- Based: passes — The paper gives a reason why it holds.
It may state two separate claims as one.
- Rests on an assumption: The U373 glioblastoma cell line and human fetal astrocytes in culture are adequate models of human glial cells in epileptogenic lesions for studying miR-146a-mediated inflammatory responses.
What the paper did — it cites no source for this, so there is none to check. The quote shows it is in the paper.
In the paper
“Sections without probe or with scramble probes were blank.”
§ MicroRNA-146a: A Key Regulator of Astrocyte-Mediated Inflammatory Response > Materials and Methods > In situ Hybridization
plain- Asserted: passes — The authors put it forward as true.
- Checkable: passes — It can be checked against evidence.
- Load-bearing: fails — The paper’s conclusions may not depend on it.
- Based: passes — The paper gives a reason why it holds.
Probably not a substantial claim. The paper’s conclusions may not depend on it. It may state two separate claims as one.
None of the sources cited for this claim have been checked yet.
In the paper
“The miR-146a has recently been shown to be upregulated in experimental models of epilepsy, as well as in human TLE. [20], [21].”
§ MicroRNA-146a: A Key Regulator of Astrocyte-Mediated Inflammatory Response > Discussion
What the sources say
- Not matchedcites [20] Aronica E, Fluiter K, Iyer A, Zurolo E, Vreijling J, et al (2010) Expression pattern of miR-146a, an inflammation-associated microRNA, in experimental and human temporal lobe epilepsy. Eur J Neurosci 31: 1100– 1107. 20214679
Couldn’t be matched to a paper in Crossref, so it can’t be checked.
- Not checked — no full text of the sourcecites [21] Song YJ, Tian XB, Zhang S, Zhang YX, Li X, et al.. (2011) Temporal Lobe epilepsy induces differential expression of hippocampal miRNAs including let-7e and miR-23a/b. Brain Res. 21376023 source
plaincorrelational- Asserted: passes — The authors put it forward as true.
- Checkable: passes — It can be checked against evidence.
- Load-bearing: passes — The paper’s conclusions depend on it.
- Based: passes — The paper gives a reason why it holds.
It may state two separate claims as one.
- Not matched
In the paper
“Activation of cells of the microglia/macrophage lineage and astrocytes, and concomitant induction of various inflammatory pathways, also have been observed in focal malformations of cortical development (MCD; such as focal cortical dysplasia FCD), which represent major causes of pediatric epilepsy [4].”
§ MicroRNA-146a: A Key Regulator of Astrocyte-Mediated Inflammatory Response > Introduction
What the sources say
- Not checked — no full text of the sourcecites [4] Blümcke I, Vinters HV, Armstrong D, Aronica E, Thom M, et al (2009) Malformations of Cortical Development and Epilepsies: Neuropathological findings with emphasis on Focal Cortical Dysplasia Epileptic. Disorders11: 181– 193. 19736171 source
plaincorrelational- Asserted: passes — The authors put it forward as true.
- Checkable: passes — It can be checked against evidence.
- Load-bearing: fails — The paper’s conclusions may not depend on it.
- Based: passes — The paper gives a reason why it holds.
Probably not a substantial claim. The paper’s conclusions may not depend on it. It may state two separate claims as one.
None of the sources cited for this claim have been checked yet.
In the paper
“Interestingly, this miRNA has been shown to be upregulated in experimental models of epilepsy, as well as in human TLE [20]–[22].”
§ MicroRNA-146a: A Key Regulator of Astrocyte-Mediated Inflammatory Response > Introduction
What the sources say
- Not matchedcites [20] Aronica E, Fluiter K, Iyer A, Zurolo E, Vreijling J, et al (2010) Expression pattern of miR-146a, an inflammation-associated microRNA, in experimental and human temporal lobe epilepsy. Eur J Neurosci 31: 1100– 1107. 20214679
Couldn’t be matched to a paper in Crossref, so it can’t be checked.
- Not checked — no full text of the sourcecites [21] Song YJ, Tian XB, Zhang S, Zhang YX, Li X, et al.. (2011) Temporal Lobe epilepsy induces differential expression of hippocampal miRNAs including let-7e and miR-23a/b. Brain Res. 21376023 source
- Not checked — no full text of the sourcecites [22] Omran A, Peng J, Zhang C, Xiang Q, Xue F, et al (2012) Interleukin-1b and microRNA-146a in an immature rat model and children with mesial temporal lobe epilepsy Epilepsia. 53: 1215– 1224. 22708826 source
plaincorrelational- Asserted: passes — The authors put it forward as true.
- Checkable: passes — It can be checked against evidence.
- Load-bearing: passes — The paper’s conclusions depend on it.
- Based: passes — The paper gives a reason why it holds.
It may state two separate claims as one.
- Not matched
What the paper did — it cites no source for this, so there is none to check. The quote shows it is in the paper.
In the paper
“Transfection efficiency was found to be around 80% by flow cytometry in both U373 and primary astrocytes.”
§ MicroRNA-146a: A Key Regulator of Astrocyte-Mediated Inflammatory Response > Materials and Methods > Transfection of Cells
plain- Asserted: passes — The authors put it forward as true.
- Checkable: passes — It can be checked against evidence.
- Load-bearing: fails — The paper’s conclusions may not depend on it.
- Based: passes — The paper gives a reason why it holds.
Probably not a substantial claim. The paper’s conclusions may not depend on it.
What the paper did — it cites no source for this, so there is none to check. The quote shows it is in the paper.
In the paper
“Furthermore, we also used histologically normal temporal neocortex from patients undergoing extensive surgical resection of the mesial structures for the treatment of medically intractable complex partial epilepsy to control for a possible effect of recurrent seizures, antiepileptic drugs or post mortem interval on the expression of miR146a.”
§ MicroRNA-146a: A Key Regulator of Astrocyte-Mediated Inflammatory Response > Materials and Methods > Human Material
hedged- Asserted: passes — The authors put it forward as true.
- Checkable: passes — It can be checked against evidence.
- Load-bearing: passes — The paper’s conclusions depend on it.
- Based: passes — The paper gives a reason why it holds.
Probably not a substantial claim.
A claim is checked only against the cited paper’s full text, never its abstract, and none is available for its sources.
In the paper
“An increasing body of literature supports the critical role of miRNAs in post-transcriptional gene regulation in several biological processes of the central nervous system (CNS), as well as in the pathogenesis of different disorders (including developmental, neurodegenerative, vascular and neuroinflammatory disorders), and in oncogenesis [10]–[12].”
§ MicroRNA-146a: A Key Regulator of Astrocyte-Mediated Inflammatory Response > Introduction
What the sources say
- Not checked — no full text of the sourcecites [10] Sethi P, Lukiw WJ (2009) Micro-RNA abundance and stability in human brain: specific alterations in Alzheimer's disease temporal lobe neocortex. Neurosci Lett 459: 100– 104. 19406203 source
- Not checked — no full text of the sourcecites [11] Li L, Chen XP, Li YJ (2010) MicroRNA-146a and human disease. Scandinavian J Immunol 71: 227– 231. 20384865 source
- Not checked — no full text of the sourcecites [12] Urbich C, Kuehbacher A, Dimmeler S (2008) Role of microRNAs in vascular diseases, inflammation, and angiogenesis. Cardiovasc Res 79: 581– 588. 18550634 source
boosteddirect- Asserted: passes — The authors put it forward as true.
- Checkable: passes — It can be checked against evidence.
- Load-bearing: fails — The paper’s conclusions may not depend on it.
- Based: passes — The paper gives a reason why it holds.
Probably not a substantial claim. The paper’s conclusions may not depend on it.
In the paper
“All cases were reviewed independently by two neuropathologists and the diagnosis was confirmed according to the international consensus classification system recently proposed for grading FCD [23].”
§ MicroRNA-146a: A Key Regulator of Astrocyte-Mediated Inflammatory Response > Materials and Methods > Human Material
What the sources say
- Not checked — no full text of the sourcecites [23] Blumcke I, Spreafico R (2011) An international consensus classification for focal cortical dysplasias. Lancet neurology 10: 26– 27. 21094091 source
plainn = 6- Asserted: passes — The authors put it forward as true.
- Checkable: passes — It can be checked against evidence.
- Load-bearing: fails — The paper’s conclusions may not depend on it.
- Based: passes — The paper gives a reason why it holds.
Probably not a substantial claim. The paper’s conclusions may not depend on it. It may state two separate claims as one.
A conclusion the paper draws from its own results — it cites no other source for it, so there is none to check. The quote shows it is in the paper.
In the paper
“Although IL-1ß increased miR-146a levels, these levels were not sufficient to significantly reduce the expression of the miR-146a targets studied.”
§ MicroRNA-146a: A Key Regulator of Astrocyte-Mediated Inflammatory Response > Discussion > miR-146a Regulates the Expression IL-6 and COX-2
plain- Asserted: passes — The authors put it forward as true.
- Checkable: passes — It can be checked against evidence.
- Load-bearing: passes — The paper’s conclusions depend on it.
- Based: passes — The paper gives a reason why it holds.
It may state two separate claims as one.
- Rests on an assumption: The U373 glioblastoma cell line and human fetal astrocytes in culture are adequate models of human glial cells in epileptogenic lesions for studying miR-146a-mediated inflammatory responses.
The paper relies on this without support.
The regulation of miR-146a in cultured human fetal astrocytes and U373 cells by IL-1β reflects the regulation of miR-146a in astrocytes in human epilepsy-associated lesions in vivo.
“Furthermore, we investigated the regulation of miR-146a in response to inflammatory molecules in cultured human glial cells (U373 glioblastoma cell line and human astrocytes cell cultures) and further evaluated its role in regulating TLR/IL-1R-interleukin-1 receptor-associated kinase (IRAK)-NF-κB signaling, particularly in astroglia.”
The paper relies on this without support.
There is little information regarding miR-146a function in astrocytes, particularly its effect on astroglia-mediated inflammatory pathways in relation to epilepsy.
“However, there is still little information regarding miR-146a function in astrocytes, in particular regarding the effect on astroglia mediated inflammatory pathways in relation to epilepsy.”
The paper relies on this without support.
The U373 glioblastoma cell line and human fetal astrocytes in culture are adequate models of human glial cells in epileptogenic lesions for studying miR-146a-mediated inflammatory responses.
“Since miR-146a was up-regulated in astrocytes in the epileptogenic lesions (FCD, present results; TLE [20], [21]) the expression of miR-146a was further analyzed in culture, using U373 glioblastoma cell line and human fetal astrocytes.”
Claims other papers make about this one
Each is checked against this paper’s own text: does it say what the citing paper says it does?
The source backs part of the claim, not all of it — or backs it for a different population, condition or comparison.
In the citing paper
“Consistent with the idea of a rescue mechanism, miR-146a-5p has well known immunosuppressive and anti-inflammatory functions [20, 35, 76].”
From Glia-to-neuron transfer of miRNAs via extracellular vesicles: a new mechanism underlying inflammation-induced synaptic alterations (2018) · cites this paper as [35]
Experimental — accuracy not yet measured
Self-check
Percentages, sums and reported differences re-computed from the paper’s own numbers.
Each contradiction between two passages listed here was confirmed by an independent check.
Rated minor: it would not touch a result — a value no result rests on, a p-value that stays on the same side of the significance level, or a conflict that is clerical, resolved elsewhere in the paper, or outside its own findings.
In the paper
§ MicroRNA-146a: A Key Regulator of Astrocyte-Mediated Inflammatory Response > Materials and Methods > Transfection of Cells
“incubation with anti-miR146a LNA or pre-miR146a at a final concentration of 50nM.”
§ MicroRNA-146a: A Key Regulator of Astrocyte-Mediated Inflammatory Response > Results > Effects of miR-146a Inhibition or Overexpression on its Downstream Targets IRAK-1, IRAK-2 and TRAF-6
“(A–C) Quantitative real-time PCR of IRAK-1 (A), IRAK-2 (B) and TRAF-6 (C) expression 24 hours after exposure to IL-1β in U373 glioblastoma cell line transfected with LNA-antimiR-146a (25 nM) or miR-146a mimic (pre-mir-146a, 50 nM).”
Rated minor: it would not touch a result — a value no result rests on, a p-value that stays on the same side of the significance level, or a conflict that is clerical, resolved elsewhere in the paper, or outside its own findings.
In the paper
§ MicroRNA-146a: A Key Regulator of Astrocyte-Mediated Inflammatory Response > Results > Effects of miR-146a Inhibition or Overexpression on its Downstream Targets IRAK-1, IRAK-2 and TRAF-6
“Western blot analysis showed the downregulation of IRAK-1 protein induced by IL-1ß in both U373 (Fig. 5 E) and fetal astrocytes (not shown).”
§ MicroRNA-146a: A Key Regulator of Astrocyte-Mediated Inflammatory Response > Discussion > miR-146a Regulates the Expression IL-6 and COX-2
“Although IL-1ß increased miR-146a levels, these levels were not sufficient to significantly reduce the expression of the miR-146a targets studied.”
Rated minor: it would not touch a result — a value no result rests on, a p-value that stays on the same side of the significance level, or a conflict that is clerical, resolved elsewhere in the paper, or outside its own findings.
In the paper
§ MicroRNA-146a: A Key Regulator of Astrocyte-Mediated Inflammatory Response > Materials and Methods > Human Material
“A total of 6 brain tissue specimens, removed from patients undergoing surgery for intractable epilepsy, were examined.”
§ MicroRNA-146a: A Key Regulator of Astrocyte-Mediated Inflammatory Response > Results > miR-146a Expression in GG and FCD Type IIb
“control cortex (n = 6; autopsy), FCD type IIb (n = 6) and GG (n = 5) specimens.”
Citations
Cites
Measurement of protein using bicinchoninic acid
Smith, P. K., Krohn, R. I., Hermanson, G. T., Mallia, A. K., Gartner, F. H., Provenzano, M. D., Fujimoto, E. K., Goeke, N. M., Olson, B. J., & Klenk, D. C. (1985) · Analytical Biochemistry · doi:10.1016/0003-2697(85)90442-7 · Cited by 18,482
The 2007 WHO Classification of Tumours of the Central Nervous System
Louis, D. N., Ohgaki, H., Wiestler, O. D., Cavenee, W. K., Burger, P. C., Jouvet, A., Scheithauer, B. W., & Kleihues, P. (2007) · Acta Neuropathologica · doi:10.1007/s00401-007-0243-4 · Cited by 15,675
Erratum to: The 2007 WHO classification of tumours of the central nervous system
Louis, D. N., Ohgaki, H., Wiestler, O. D., Cavenee, W. K., Burger, P. C., Jouvet, A., Scheithauer, B. W., & Kleihues, P. (2007) · Zurich Open Repository and Archive (University of Zurich) · doi:10.5167/uzh-156115 · Cited by 4,435
Biologic basis for interleukin-1 in disease.
Dinarello, C. (1996) · Blood · doi:10.1182/blood.v87.6.2095.bloodjournal8762095 · Cited by 4,344
Taganov, K. D., Boldin, M. P., Chang, K.-J., & Baltimore, D. (2006) · Proceedings of the National Academy of Sciences · doi:10.1073/pnas.0605298103 · Cited by 4,317
Assumption-free analysis of quantitative real-time polymerase chain reaction (PCR) data
Ramakers, C. R. B., Ruijter, J. M., Deprez, R. H. L., & Moorman, A. F. M. (2003) · Neuroscience Letters · doi:10.1016/s0304-3940(02)01423-4 · Cited by 3,740
The American Journal of Respiratory and Critical Care Medicine
Klocke, R. A., & Sylvester, J. T. (1994) · American Journal of Respiratory and Critical Care Medicine · Cited by 1,307
Role of microRNAs in vascular diseases, inflammation, and angiogenesis
Urbich, C., Kuehbacher, A., & Dimmeler, S. (2008) · Cardiovascular Research · doi:10.1093/cvr/cvn156 · Cited by 880
Maroso, M., Balosso, S., Ravizza, T., Liu, J., Aronica, E., Iyer, A. M., Rossetti, C., Molteni, M., Casalgrandi, M., Manfredi, A. A., et al. (2010) · Nature Medicine · doi:10.1038/nm.2127 · Cited by 842
Self-citationHou, J., Wang, P., Lin, L., Liu, X., Ma, F., An, H., Wang, Z., & Cao, X. (2009) · The Journal of Immunology · doi:10.4049/jimmunol.0900707 · Cited by 739
Research works printed but not linked: 1
- [43]Iyer A, Zurolo E, Spliet WG, van Rijen PC, Baayen JC, et al (2010) Evaluation of the innate and adaptive immunity in type I and type II focal cortical dysplasias. Epilepsia 51: 1763– 1773. 20345941
Cited by
Sorted by citations
Functional roles of reactive astrocytes in neuroinflammation and neurodegeneration
Patani, R., Hardingham, G. E., & Liddelow, S. A. (2023) · Nature Reviews Neurology · doi:10.1038/s41582-023-00822-1 · Cited by 531
Neuroinflammation in the central nervous system: Symphony of glial cells
Yang, Q., & Zhou, J. (2018) · Glia · doi:10.1002/glia.23571 · Cited by 539
Song, Y., Dou, H., Li, X., Zhao, X., Li, Y., Liu, D., Ji, J., Liu, F., Ding, L., Ni, Y., et al. (2017) · Stem Cells · doi:10.1002/stem.2564 · Cited by 502
microRNA dysregulation in neurodegenerative diseases: A systematic review
Juźwik, C. A., S. Drake, S., Zhang, Y., Paradis-Isler, N., Sylvester, A., Amar-Zifkin, A., Douglas, C., Morquette, B., Moore, C. S., & Fournier, A. E. (2019) · Progress in Neurobiology · doi:10.1016/j.pneurobio.2019.101664 · Cited by 426
EpileptogenesisPreprint
Pitkänen, A., Łukasiuk, K., Dudek, F. E., & Staley, K. J. (2015) · Cold Spring Harbor Perspectives in Medicine · doi:10.1101/cshperspect.a022822 · Cited by 369
Metadata
- Authors
- Iyer, A., Zurolo, E., Prabowo, A., Fluiter, K., Spliet, W. G. M., van Rijen, P. C., Gorter, J. A., & Aronica, E.
- Affiliations
- Amsterdam UMC Location University of Amsterdam (NL)
- University Medical Center Utrecht (NL)
- Stichting Epilepsie Instellingen Nederland (NL)
- Corresponding author
- Aronica, Eleonora
- Venue
- PLoS ONE
- Publisher
- Public Library of Science (PLoS)
- Published
- 2012-09-13
- Volume
- 7
- Issue
- 9
- Pages
- e44789
- ISSN
- 1932-6203 (ISSN-L)
- PMC
- PMC3441440
- OpenAlex
- W2138125988
- Cited by
- 330
- References
- 58
- Citations by year
- 2026: 15 · 2025: 17 · 2024: 12 · 2023: 11 · 2022: 17 · 2021: 18 · 2020: 21 · 2019: 25 · 2018: 30 · 2017: 36 · 2016: 41 · 2015: 29 · 2014: 28 · 2013: 29 · 2012: 1
- FWCI
- 13.20
- Type
- journal article
- Language
- en
- Open access
- gold
- doi.org
- Locations
- PLoS ONE (publishedVersion, cc-by)
- Europe PMC (PubMed Central) (publishedVersion, cc-by)
- PubMed Central (publishedVersion, cc-by)
- PubMed (publishedVersion)
- UvA-DARE (University of Amsterdam) (publishedVersion, cc-by)
- Pure Amsterdam UMC (publishedVersion)
- Data Archiving and Networked Services (DANS) (submittedVersion, other-oa)
- Data Archiving and Networked Services (DANS) (submittedVersion)
- UvA-DARE (University of Amsterdam) (submittedVersion, cc-by)
- DOAJ (DOAJ: Directory of Open Access Journals) (submittedVersion, cc-by-sa)
- Utrecht University Repository (Utrecht University) (submittedVersion, other-oa)
- Figshare (submittedVersion, cc-by)
- Funders
- European Commission (202167, 278486)
- Stichting Kinderen Kankervrij
- Hersenstichting (NEF 13-01)
- Topics
- Life Sciences › Neuroscience › Neurology › Neuroinflammation and Neurodegeneration Mechanisms
- Life Sciences › Biochemistry, Genetics and Molecular Biology › Cancer Research › MicroRNA in disease regulation
- Life Sciences › Biochemistry, Genetics and Molecular Biology › Molecular Biology › Inflammasome and immune disorders
- Keywords
- microRNA-146a, astrocytes, innate immune response, epilepsy, IL-1β signaling, IRAK1, TRAF6, interleukin-6, cyclooxygenase-2, TNF-α, negative feedback regulation, anti-inflammatory therapy
- MeSH terms
- Astrocytes, Brain Diseases, Epilepsy, Female, Gene Expression Regulation, Humans, Immunity, Innate, Male, Pregnancy, Signal Transduction, Interleukin-6, NF-kappa B, Receptors, Interleukin-1, Ganglioglioma, Inflammation Mediators, MicroRNAs, Cell Line, Tumor, TNF Receptor-Associated Factor 6, Toll-Like Receptors, Cyclooxygenase 2, Interleukin-1beta, Interleukin-1 Receptor-Associated Kinases, Malformations of Cortical Development, Malformations of Cortical Development, Group I
About these checks
Registry, retraction, Cites and statistics results are computed, not judged, with one exception: a printed reference that no index lists is read once by a model before it counts as a citation error. Claims are extracted by a model and kept only when their quote appears verbatim in the text; each cited source is then checked, with a model’s help, for whether it says what the claim relies on. Those verdicts can be wrong — read the claim’s quote and the cited source before relying on one.
A language model drew the claims from the paper on 2026-11-06, under version 3 of the claim definition (model deepseek-v4.1-flash, prompt extract-v3).
A second model labelled each claim on 2026-11-06 (model jev-1.13-20260917, definition revision gold-guideline-v0.2).
Cited sources are checked with a language model’s help (gpt-6-sol).
Statistics and arithmetic are recomputed, not judged.
Confidence bands are shown only for fields calibrated on our annotated test set. None is calibrated yet, so no band is shown.
What counts as a claim ›How we measure confidence ›How we check this ›
Are you an author, or do you see a problem with this page? Request a review
