

The DOI matches its Crossref record; 32 of the 32 references it cites were found in a registry or an index.
Neurotoxicity of Perfluorooctane Sulfonate to Hippocampal Cells in Adult Mice
Open accessAbstract
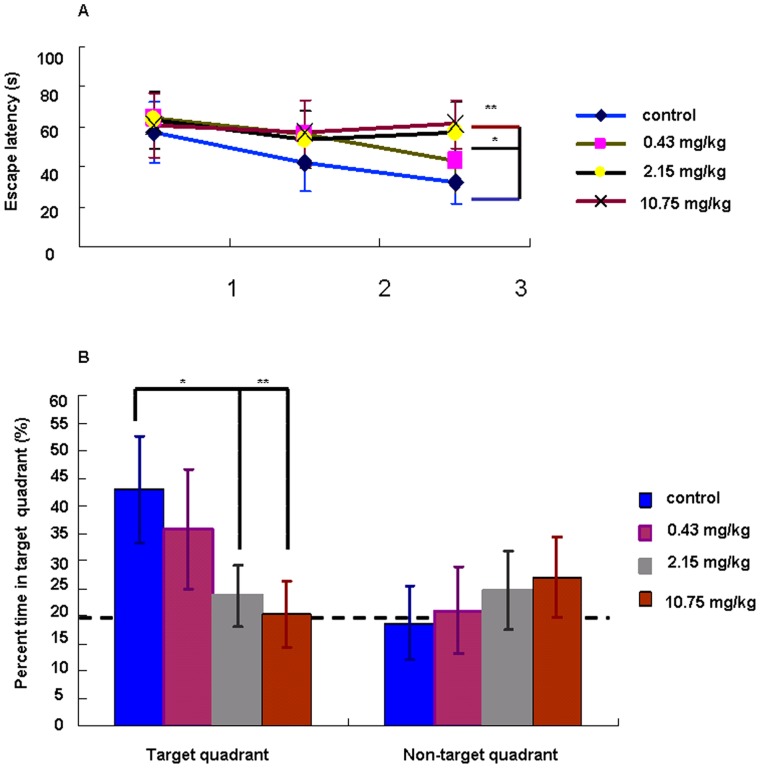
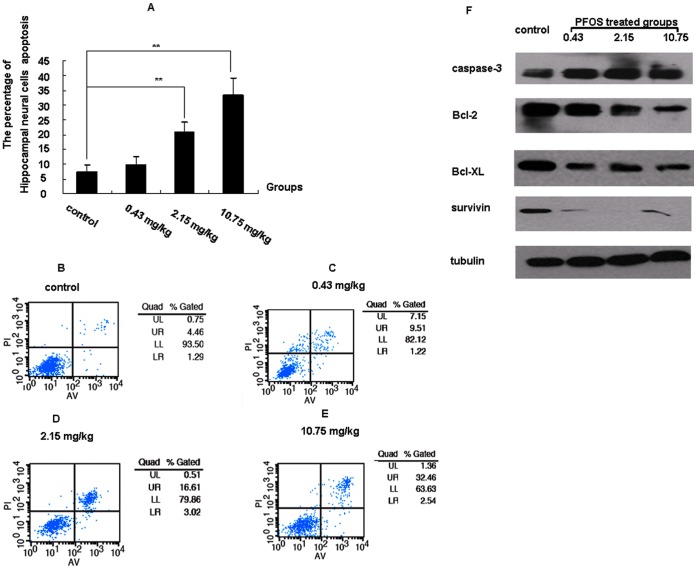
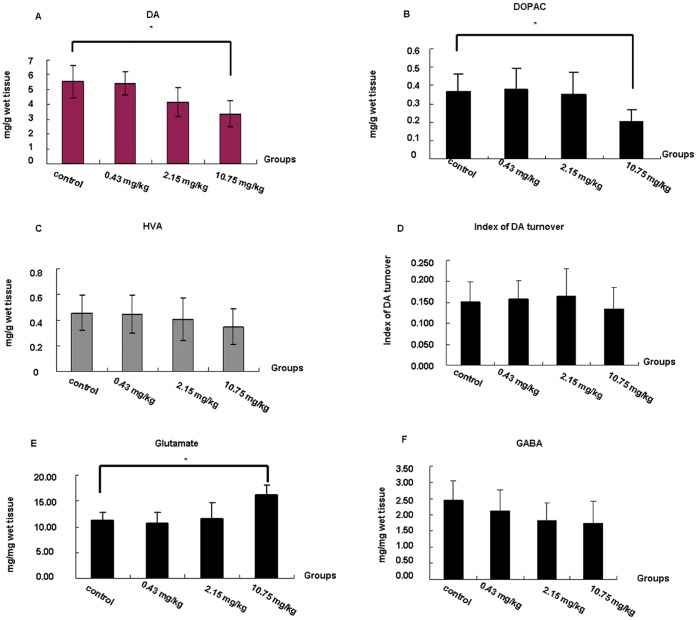
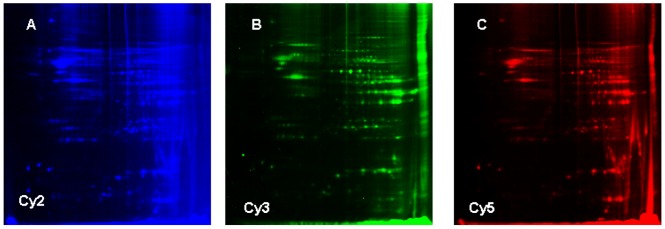
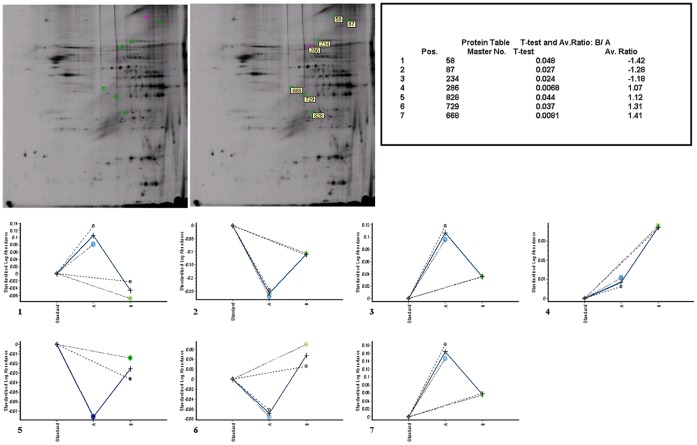
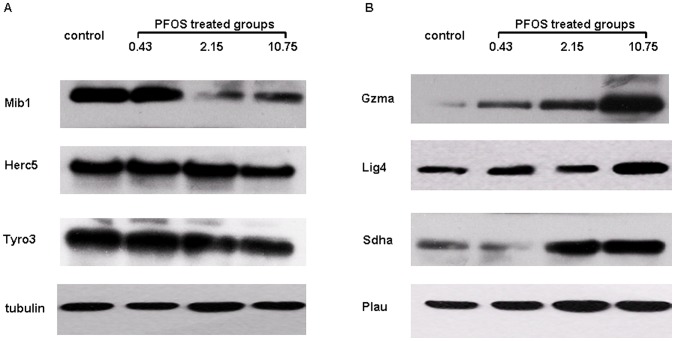
Perfluorooctane sulfonate (PFOS) is a ubiquitous pollutant and found in the environment and in biota. The neurotoxicity of PFOS has received much concern among its various toxic effects when given during developing period of brain. However, little is known about the neurotoxic effects and potential mechanisms of PFOS in the mature brain. Our study demonstrated the neurotoxicity and the potential mechanisms of PFOS in the hippocampus of adult mice for the first time. The impairments of spatial learning and memory were observed by water maze studies after exposure to PFOS for three months. Significant apoptosis was found in hippocampal cells after PFOS exposure, accompanied with a increase of glutamate in the hippocampus and decreases of dopamine (DA) and 3,4-dihydrophenylacetic acid (DOPAC) in Caudate Putamen in the 10.75 mg/kg PFOS group. By two-dimensional fluorescence difference in gel electrophoresis (2D-DIGE) analysis, seven related proteins in the hippocampus that responded to PFOS exposure were identified, among which, Mib1 protein (an E3 ubiquitin-protein ligase), Herc5 (hect domain and RLD 5 isoform 2) and Tyro3 (TYRO3 protein tyrosine kinase 3) were found down-regulated, while Sdha (Succinate dehydrogenase flavoprotein subunit), Gzma (Isoform HF1 of Granzyme A precursor), Plau (Urokinase-type plasminogen activator precursor) and Lig4 (DNA ligase 4) were found up-regulated in the 10.75 mg/kg PFOS-treated group compare with control group. Furthermore, we also found that (i) increased expression of caspase-3 protein and decreased expression of Bcl-2, Bcl-XL and survivin proteins, (ii) the increased glutamate release in the hippocampus. All these might contribute to the dysfunction of hippocampus which finally account for the impairments of spatial learning and memory in adult mice.
Overview
The claims and statistics of this paper haven’t been checked yet.
Run the check — free, no account needed. It reads the open-access text and checks the sources it cites.
Integrity signals
Registry
Cites
Statistics
Figures
Verification
Claims the paper makes
The claims and statistics of this paper haven’t been checked yet.
Run the check — free, no account needed. It reads the open-access text and checks the sources it cites.
Claims other papers make about this one
Each is checked against this paper’s own text: does it say what the citing paper says it does?
The source backs part of the claim, not all of it — or backs it for a different population, condition or comparison.
In the citing paper
“Long et al. (2013) exposed animals to 0.43, 2.15, or 10.75 mg/kg PFOS daily for 3 months, and also noted a dose-dependent impairment in spatial and learning memory.”
From A Critical Review and Meta-Analysis of Impacts of Per- and Polyfluorinated Substances on the Brain and Behavior (2022) · cites this paper as Long et al., 2013
Experimental — accuracy not yet measuredThe source backs part of the claim, not all of it — or backs it for a different population, condition or comparison.
In the citing paper
“There are inconsistencies in the literature regarding the direction of change for dopamine levels with dopamine increasing with PFAS exposure in some studies and decreasing in others”
From A Critical Review and Meta-Analysis of Impacts of Per- and Polyfluorinated Substances on the Brain and Behavior (2022) · cites this paper as Long et al., 2013
Experimental — accuracy not yet measuredThe source backs part of the claim, not all of it — or backs it for a different population, condition or comparison.
In the citing paper
“PFAS exposure has been shown to disrupt glutamate, γ-aminobutyric acid (GABA), dopamine, acetylcholine, and serotonin levels”
From A Critical Review and Meta-Analysis of Impacts of Per- and Polyfluorinated Substances on the Brain and Behavior (2022) · cites this paper as Long et al., 2013
Experimental — accuracy not yet measuredThe cited source says what the claim attributes to it.
In the citing paper
“Exposure to PFOS has been associated with deficits in spatial learning and memory in a Morris Water Maze task in adult mice (Fuentes et al., 2007b; Long et al., 2013).”
From A Critical Review and Meta-Analysis of Impacts of Per- and Polyfluorinated Substances on the Brain and Behavior (2022) · cites this paper as Long et al., 2013
Self-check
Percentages, sums and reported differences re-computed from the paper’s own numbers.
The self-check needs the paper’s full text.
Citations
Cites
Applications of the Morris water maze in the study of learning and memory
D’Hooge, R., & Deyn, P. P. D. (2001) · Brain Research Reviews · doi:10.1016/s0165-0173(01)00067-4 · Cited by 2,083
Spatial memory, recognition memory, and the hippocampus
Broadbent, N. J., Squire, L. R., & Clark, R. E. (2004) · Proceedings of the National Academy of Sciences · doi:10.1073/pnas.0406344101 · Cited by 985
Accumulation of Perfluorooctane Sulfonate in Marine Mammals
Kannan, K., Koistinen, J., Beckmen, K. B., Evans, T. J., Gorzelany, J. F., Hansen, K. J., Jones, P. D., Helle, E., Nyman, M., & Giesy, J. P. (2001) · Environmental Science & Technology · doi:10.1021/es001873w · Cited by 494
Johansson, N., Fredriksson, A., & Eriksson, P. (2008) · NeuroToxicology · doi:10.1016/j.neuro.2007.10.008 · Cited by 463
Growing Concern Over Perfluorinated Chemicals
Renner, R. (2001) · Environmental Science & Technology · doi:10.1021/es012317k · Cited by 417
Neuroendocrine Effects of Perfluorooctane Sulfonate in Rats
Austin, M. E., Kasturi, B. S., Barber, M., Kannan, K., MohanKumar, P. S., & MohanKumar, S. M. J. (2003) · Environmental Health Perspectives · doi:10.1289/ehp.6128 · Cited by 347
Johansson, N., Eriksson, P., & Viberg, H. (2009) · Toxicological Sciences · doi:10.1093/toxsci/kfp029 · Cited by 292
Olsen, G. W., Mair, D. C., Church, T. R., Ellefson, M. E., Reagen, W. K., Boyd, T. M., Herron, R. M., Medhdizadehkashi, Z., Nobiletti, J. B., Rios, J. A., et al. (2008) · Environmental Science & Technology · doi:10.1021/es800071x · Cited by 244
Determinants of Fetal Exposure to Polyfluoroalkyl Compounds in Baltimore, Maryland
Apelberg, B. J., Goldman, L. R., Calafat, A. M., Herbstman, J. B., Kuklenyik, Z., Heidler, J., Needham, L. L., Halden, R. U., & Witter, F. R. (2007) · Environmental Science & Technology · doi:10.1021/es0700911 · Cited by 226
E3 ubiquitin ligases as T cell anergy factors
Mueller, D. L. (2004) · Nature Immunology · doi:10.1038/ni1106 · Cited by 224 · cited 1×
“Among which, Herc5, a proteins with a HECT domain thought to act as E3 protein ligase for ubiquitin [17], was found down-regulated.”
Background
Cited by
Sorted by citations
(CONTAM), E. P. O. C. I. T. F. C., Knutsen, H. K., Alexander, J., Barregård, L., Bignami, M., Brüschweiler, B. J., Ceccatelli, S., Cottrill, B., Dinovi, M., Edler, L., et al. (2018) · EFSA Journal · doi:10.2903/j.efsa.2018.5194 · Cited by 549
Gaballah, S., Swank, A., Sobus, J. R., Howey, X. M., Schmid, J., Catron, T., McCord, J., Hines, E., Strynar, M., & Tal, T. (2020) · Environmental Health Perspectives · doi:10.1289/ehp5843 · Cited by 437
Assessing the human health risks of perfluorooctane sulfonate by in vivo and in vitro studies
Zeng, Z., Song, B., Xiao, R., Zeng, G., Gong, J., Chen, M., Xu, P., Zhang, P., Shen, M., & Yi, H. (2019) · Environment International · doi:10.1016/j.envint.2019.03.002 · Cited by 306
Cao, Y., & Ng, C. (2021) · Environmental Science: Processes & Impacts · doi:10.1039/d1em00228g · Cited by 250
Ojo, A. F., Peng, C., & Ng, J. C. (2021) · Journal of Hazardous Materials · doi:10.1016/j.jhazmat.2020.124863 · Cited by 221
Starnes, H. M., Rock, K. D., Jackson, T. W., & Belcher, S. M. (2022) · Frontiers in Toxicology · doi:10.3389/ftox.2022.881584 · Cited by 166
Brown-Leung, J. M., & Cannon, J. R. (2022) · Chemical Research in Toxicology · doi:10.1021/acs.chemrestox.2c00072 · Cited by 164
Di Nisio, A., Pannella, M., Vogiatzis, S., Sut, S., Dall'Acqua, S., Rocca, M. S., Antonini, A., Porzionato, A., De Caro, R., Bortolozzi, M., et al. (2022) · Environment International · doi:10.1016/j.envint.2021.106982 · Cited by 103
Goodrich, J. A., Walker, D. I., He, J., Lin, X., Baumert, B. O., Hu, X., Alderete, T. L., Chen, Z., Valvi, D., Fuentes, Z. C., et al. (2023) · Environmental Health Perspectives · doi:10.1289/ehp11372 · Cited by 96
Differential toxicity between perfluorooctane sulfonate (PFOS) and perfluorooctanoic acid (PFOA)
Tsuda, S. (2016) · The Journal of Toxicological Sciences · doi:10.2131/jts.41.sp27 · Cited by 95
Shi, L., Zheng, J., Yan, S., Li, Y., Wang, Y., Liu, X., & Xiao, C. (2020) · Journal of Agricultural and Food Chemistry · doi:10.1021/acs.jafc.0c05834 · Cited by 92
Self-citationYu, Y., Wang, C., Zhang, X., Zhu, J., Wang, L., Ji, M., Zhang, Z., Ji, X., & Wang, S. (2019) · Environmental Pollution · doi:10.1016/j.envpol.2019.113429 · Cited by 87
Perfluoroalkyl Chemicals in Neurological Health and Disease: Human Concerns and Animal Models
Piekarski, D., Diaz, K., & McNerney, M. (2020) · NeuroToxicology · doi:10.1016/j.neuro.2020.01.001 · Cited by 76
Perfluorooctane sulfonate effects on the reproductive axis in adult male rats
López-Doval, S., Salgado, R., Pereiro, N., Moyano, R., & Lafuente, A. (2014) · Environmental Research · doi:10.1016/j.envres.2014.07.006 · Cited by 78
Yang, B., Zou, W., Hu, Z., Liu, F., Zhou, L., Yang, S., Kuang, H., Wu, L., Wei, J., Wang, J., et al. (2014) · BioMed Research International · doi:10.1155/2014/409837 · Cited by 73
Involvement of NRF2 in Perfluorooctanoic Acid-Induced Testicular Damage in Male Mice1
Liu, W., Yang, B., Wu, L., Zou, W., Pan, X., Zou, T., Liu, F., Xia, L., Wang, X., & Zhang, D. (2015) · Biology of Reproduction · doi:10.1095/biolreprod.115.128819 · Cited by 69
Ambaye, T. G., Vaccari, M., Prasad, S., & Rtimi, S. (2022) · Environmental Science and Pollution Research · doi:10.1007/s11356-022-21513-2 · Cited by 69
PFAS: exploration of neurotoxicity and environmental impact
Nannaware, M., Mayilswamy, N., & Kandasubramanian, B. (2024) · Environmental Science and Pollution Research · doi:10.1007/s11356-024-32082-x · Cited by 67
Grønnestad, R., Johanson, S. M., Müller, M. H. B., Schlenk, D., Tanabe, P., Krøkje, Å., Jaspers, V. L. B., Jenssen, B. M., Ræder, E. M., Lyche, J. L., et al. (2021) · Toxicology and Applied Pharmacology · doi:10.1016/j.taap.2021.115670 · Cited by 65
Yuan, Z., Shao, X., Miao, Z., Zhao, B., Zheng, Z., & Zhang, J. (2018) · Chemosphere · doi:10.1016/j.chemosphere.2018.05.011 · Cited by 64
Li, Z., Liu, Q., Liu, C., Li, C., Li, Y., Li, S., Liu, X., & Shao, J. (2016) · Toxicology in Vitro · doi:10.1016/j.tiv.2016.11.002 · Cited by 65
Neurotoxic effects of perfluoroalkyl acids: Neurobehavioral deficit and its molecular mechanism
Wang, Y., Wang, L., Chang, W., Zhang, Y., Zhang, Y., & Liu, W. (2019) · Toxicology Letters · doi:10.1016/j.toxlet.2019.01.012 · Cited by 65
Self-citationSalgado, R., López-Doval, S., Pereiro, N., & Lafuente, A. (2016) · Toxicology Letters · doi:10.1016/j.toxlet.2015.10.023 · Cited by 58
Guo, X., Li, Q., Shi, J., Shi, L., Li, B., Xu, A., Zhao, G., & Wu, L. (2016) · Chemosphere · doi:10.1016/j.chemosphere.2016.04.046 · Cited by 58
Nrf2 Signaling Elicits a Neuroprotective Role Against PFOS-mediated Oxidative Damage and Apoptosis
Sun, P., Nie, X., Chen, X., Yin, L., Luo, J., Sun, L., Wan, C., & Jiang, S. (2018) · Neurochemical Research · doi:10.1007/s11064-018-2672-y · Cited by 57
PFOS Disturbs BDNF-ERK-CREB Signalling in Association with Increased MicroRNA-22 in SH-SY5Y Cells
Li, W., He, Q., Wu, C., Pan, X., Wang, J., Tan, Y., Shan, X., & Zeng, H. (2015) · BioMed Research International · doi:10.1155/2015/302653 · Cited by 58
Li, S., Qin, S., Zeng, H., Chou, W., Oudin, A., Kanninen, K. M., Jalava, P., Dong, G., & Zeng, X. (2024) · Eco-Environment & Health · doi:10.1016/j.eehl.2024.08.002 · Cited by 54
Zhang, T., Zhao, S., Dong, F., Jia, Y., Chen, X., Sun, Y., & Zhu, L. Y. (2023) · Environmental Science & Technology · doi:10.1021/acs.est.2c04765 · Cited by 53
Delcourt, N., Pouget, A.-M., Grivaud, A., Nogueira, L., Larvor, F., Marchand, P., Schmidt, E. A., & Bizec, B. L. (2023) · The Journals of Gerontology Series A · doi:10.1093/gerona/glad208 · Cited by 50
Hallgren, S., Fredriksson, A., & Viberg, H. (2015) · Environmental Toxicology and Pharmacology · doi:10.1016/j.etap.2015.06.014 · Cited by 48
Qu, R., Wang, J., Li, X., Zhang, Y., Yin, T., & Yang, P. (2024) · Toxics · doi:10.3390/toxics12090678 · Cited by 49
ROS-mediated apoptosis of HAPI microglia through p53 signaling following PFOS exposure
Ge, J., Wang, C., Nie, X., Yang, J., Lu, H., Song, X., Su, K., Li, T., Han, J., Zhang, Y., et al. (2016) · Environmental Toxicology and Pharmacology · doi:10.1016/j.etap.2016.06.025 · Cited by 47
Zhang, H., Yolton, K. A., Webster, G. M., Ye, X., Calafat, A. M., Dietrich, K. N., Xu, Y. Y., Xie, C., Braun, J. M., Lanphear, B. P., et al. (2017) · Environment International · doi:10.1016/j.envint.2017.11.031 · Cited by 47
Denuzière, A., & Ghersi‐Egea, J. (2022) · NeuroToxicology · doi:10.1016/j.neuro.2022.04.004 · Cited by 43
Basaly, V., Hill, J., Bihaqi, S. W., Marques, E., Slitt, A. L., & Zawia, N. H. (2021) · NeuroToxicology · doi:10.1016/j.neuro.2021.06.008 · Cited by 41
ROS-mediated JNK pathway critically contributes to PFOS-triggered apoptosis in SH-SY5Y cells
Sun, P., Gu, L., Luo, J., Qin, Y., Sun, L., & Jiang, S. (2019) · Neurotoxicology and Teratology · doi:10.1016/j.ntt.2019.106821 · Cited by 39
PFHxS induces apoptosis of neuronal cells via ERK1/2-mediated pathway
Lee, Y. J., Choi, S.-Y., & Yang, J. (2013) · Chemosphere · doi:10.1016/j.chemosphere.2013.09.059 · Cited by 37
Perfluorooctane sulfonate mediates secretion of IL-1β through PI3K/AKT NF-кB pathway in astrocytes
Chen, X., Nie, X., Mao, J., Zhang, Y., Yin, K., Sun, P., Luo, J., Liu, Y., Jiang, S., & Sun, L. (2018) · Neurotoxicology and Teratology · doi:10.1016/j.ntt.2018.03.004 · Cited by 37
Connexin 43 mediates PFOS-induced apoptosis in astrocytes
Dong, L., Yang, X., Gu, W., Zhao, K., Ge, H., Zhou, J., & Bai, X. (2015) · Chemosphere · doi:10.1016/j.chemosphere.2015.02.041 · Cited by 36
Zhu, J., Qian, W., Wang, Y., Gao, R., Wang, J., & Xiao, H. (2015) · Journal of Applied Toxicology · doi:10.1002/jat.3119 · Cited by 35
Self-citationPFOS-induced apoptosis through mitochondrion-dependent pathway in human–hamster hybrid cells
Wang, X., Zhao, G., Liang, J., Jiang, J., Chen, N., Yu, J., Wang, Q., Xu, A., Chen, S., & Wu, L. (2013) · Mutation Research/Genetic Toxicology and Environmental Mutagenesis · doi:10.1016/j.mrgentox.2013.04.004 · Cited by 32
López-Doval, S., Salgado, R., Fernández‐Pérez, B., & Lafuente, A. (2015) · Toxicology Letters · doi:10.1016/j.toxlet.2015.01.012 · Cited by 32
Hallgren, S., & Viberg, H. (2015) · Environmental Toxicology and Pharmacology · doi:10.1016/j.etap.2015.11.016 · Cited by 31
Glioma is associated with exposure to legacy and alternative per- and polyfluoroalkyl substances
Xie, M., Sun, X.-F., Wu, C.-C., Huang, G., Wang, P., Lin, Z., Liu, Y., Liu, L., & Zeng, E. Y. (2022) · Journal of Hazardous Materials · doi:10.1016/j.jhazmat.2022.129819 · Cited by 29
Zhang, H., Zhang, C., Xu, D., Wang, Q., & Xu, D. (2023) · Environmental Pollution · doi:10.1016/j.envpol.2023.121650 · Cited by 29
Perfluorooctane Sulfonate Induces Neuronal Vulnerability by Decreasing GluR2 Expression
Ishida, K., Tsuyama, Y., Sanoh, S., Ohta, S., & Kotake, Y. (2017) · Archives of Toxicology · doi:10.1007/s00204-016-1731-x · Cited by 27
Pini, L., Salvalaggio, A., Wennberg, A. M. V., Dimakou, A., Matteoli, M., & Corbetta, M. (2023) · Ageing Research Reviews · doi:10.1016/j.arr.2023.101867 · Cited by 26
Li, R., Guo, C., Lin, X., Chan, T., Lai, K. P., & Chen, J. (2020) · Chemosphere · doi:10.1016/j.chemosphere.2020.127062 · Cited by 26
Embryonic exposure to PFAS causes long-term, compound-specific behavioral alterations in zebrafish
Hawkey, A. B., Mead, M., Natarajan, S., Gondal, A., Jarrett, O., & Levin, E. D. (2023) · Neurotoxicology and Teratology · doi:10.1016/j.ntt.2023.107165 · Cited by 25
Zhang, B., Wang, Z., Zhang, J., Dai, Y., Ding, J., Guo, J., Qi, X., Wu, C., & Zhou, Z. (2024) · Environment International · doi:10.1016/j.envint.2024.108720 · Cited by 24
Owumi, S. E., Bello, T., & Oyelere, A. K. (2021) · Environmental Toxicology and Pharmacology · doi:10.1016/j.etap.2021.103667 · Cited by 24
Environmental toxicants in the brain: A review of astrocytic metabolic dysfunction
McCann, M. S., & Maguire‐Zeiss, K. A. (2021) · Environmental Toxicology and Pharmacology · doi:10.1016/j.etap.2021.103608 · Cited by 24
Perfluorooctanesulfonic acid exposure altered hypothalamic metabolism and disturbed male fecundity
Li, Z., Lin, Z., Ji, S., Lai, K. P., Wan, H., Wong, C. K. C., & Li, L. (2022) · The Science of The Total Environment · doi:10.1016/j.scitotenv.2022.156881 · Cited by 23
Huang, Q., Zhang, J., Peng, S., Du, M., Ow, S. Y., Pu, H., Pan, C., & Shen, H. (2013) · Journal of Applied Toxicology · doi:10.1002/jat.2963 · Cited by 23
Perfluoroalkyl acids potentiate glutamate excitotoxicity in rat cerebellar granule neurons
Berntsen, H. F., Moldes‐Anaya, A., Bjørklund, C. G., Ragazzi, L., Haug, T. M., Strandabø, R. A. U., Verhaegen, S., Paulsen, R. E., Ropstad, E., & Tasker, R. A. (2020) · Toxicology · doi:10.1016/j.tox.2020.152610 · Cited by 23
Bull, S., Burnett, K., Vassaux, K., Ashdown, L., Brown, T., & Rushton, L. (2014) · EFSA Supporting Publications · doi:10.2903/sp.efsa.2014.en-572 · Cited by 20
Sharma, R. P., Schuhmacher, M., & Kumar, V. (2017) · Toxicology Letters · doi:10.1016/j.toxlet.2017.08.003 · Cited by 20
Simvastatin inhibits the apoptosis of hippocampal cells in a mouse model of Alzheimer's disease
Hu, X., Song, C., Fang, M., & Li, C. (2017) · Experimental and Therapeutic Medicine · doi:10.3892/etm.2017.5620 · Cited by 20
Salgado, R., Pereiro, N., López-Doval, S., & Lafuente, A. (2015) · Food and Chemical Toxicology · doi:10.1016/j.fct.2015.05.013 · Cited by 18
Zhang, Q., Liu, W., Zhao, H., Zhang, Z., Qin, H., Luo, F., & Niu, Q. L. (2018) · Toxicology · doi:10.1016/j.tox.2018.11.015 · Cited by 18
Wang, Y., Zhao, H., Zhang, Q., Liu, W., & Quan, X. (2015) · Toxicology Research · doi:10.1039/c4tx00177j · Cited by 18
Self-citationAssociation between dietary exposure to chemical contaminants and risk of dementia in older persons
Lefèvre‐Arbogast, S., Duquenne, P., Helmer, C., Auriacombe, S., Sirot, V., & Samieri, C. (2024) · Environment International · doi:10.1016/j.envint.2024.109033 · Cited by 17
The role of per‐ and polyfluoroalkyl substances in cognitive impairment and dementia
Gardener, H. E., Levin, B. E., Kannan, K., & Rundek, T. (2025) · Alzheimer s & Dementia · doi:10.1002/alz.70226 · Cited by 17
Kinawy, A. A., Ezzat, A., & Al-Suwaigh, B. R. (2014) · Experimental and Toxicologic Pathology · doi:10.1016/j.etp.2014.02.001 · Cited by 15
Qu, A., Cao, T., Li, Z., Wang, W., Liu, R., Wang, X., Nie, Y., Sun, S., Liu, X., & Zhang, X. (2021) · Environmental Science and Pollution Research · doi:10.1007/s11356-021-15136-2 · Cited by 14
Hu, X., Song, C., Fang, M., & Li, C. (2018) · Experimental and Therapeutic Medicine · doi:10.3892/etm.2018.6057 · Cited by 14
Hmila, I., Hill, J., Shalaby, K. E., Ouararhni, K., Abedsselem, H., Modaresi, S. M. S., Bihaqi, S. W., Marques, E., Sondhi, A., Slitt, A. L., et al. (2024) · Ecotoxicology and Environmental Safety · doi:10.1016/j.ecoenv.2024.116070 · Cited by 13
Mousavi, S. E., Yu, Q., & Shin, H. (2025) · The Science of The Total Environment · doi:10.1016/j.scitotenv.2025.178972 · Cited by 13
Jiang, D. Q. Y., & Guo, T. L. (2024) · Toxics · doi:10.3390/toxics12010039 · Cited by 13
Effects of perfluorooctane sulfonate (PFOS) on cognitive behavior and autophagy of male mice
Zhou, A.-J., Wang, L., Pi, X., Fan, C., Chen, W., Wang, Z., Rong, S., & Wang, T. (2023) · The Journal of Toxicological Sciences · doi:10.2131/jts.48.513 · Cited by 11
Schildroth, S., Henn, B. C., Vines, A. I., Geller, R. J., Lovett, S. M., Coleman, C. M., Bethea, T. N., Botelho, J. C., Calafat, A. M., Milando, C. W., et al. (2024) · The Science of The Total Environment · doi:10.1016/j.scitotenv.2024.172445 · Cited by 10
Currie, S. D., Ji, Y., Huang, Q., Wang, J., & Tang, L. (2024) · Environmental Pollution · doi:10.1016/j.envpol.2024.125257 · Cited by 10
de Macedo, G. T., Claro, M. T., Ferreira, S. A., Loreto, J. S., Ajayi, B. O., Prestes, A. D. S., Adedara, I. A., Müller, T. E., dos Santos, M. M., & Barbosa, N. V. (2025) · The Science of The Total Environment · doi:10.1016/j.scitotenv.2025.179972 · Cited by 7
Li, S., Gao, Z., Zhong, M., Bi, H., & Li, J. (2023) · Toxicology Research · doi:10.1093/toxres/tfad104 · Cited by 7
Wu, P., Ding, C., Yan, M., Qian, B., Wang, W., Sun, P., & Zhao, J. (2019) · The Journal of Toxicological Sciences · doi:10.2131/jts.44.657 · Cited by 6
Persistent organic pollutants: Neurotoxic mechanisms and insights from organoid models
Ji, Z., Chen, L., & Ming, D. (2026) · Toxicology · doi:10.1016/j.tox.2026.154408 · Cited by 5
Perfluorooctane Sulfonate (PFOS) Negatively Impacts Prey Capture Capabilities in Larval Zebrafish
Zoodsma, J. D., Boonkanon, C., Running, L. S., Basharat, R., Atilla‐Gokcumen, G. E., Aga, D. S., & Sirotkin, H. I. (2023) · Environmental Toxicology and Chemistry · doi:10.1002/etc.5819 · Cited by 5
Neurochemical mechanisms of perfluoroalkyl substances (PFAS) neurotoxic action
Brown-Leung, J. M., & Cannon, J. R. (2023) · Advances in neurotoxicology · doi:10.1016/bs.ant.2023.08.002 · Cited by 5
Zhang, H., Zhang, C., Wang, Q., Fu, W., Xing, W., Jin, P., Wu, H., Bu, Y., Xu, D., & Xu, D. (2024) · Environmental Pollution · doi:10.1016/j.envpol.2024.125031 · Cited by 4
Hongal, L., & David, M. (2025) · Journal of Applied Toxicology · doi:10.1002/jat.70009 · Cited by 4
Nisio, A. D., Trevisan, M., Dall’Acqua, S., Pannella, M., Pappalardo, C., Ferlin, A., Foresta, C., & Toni, L. D. (2022) · Toxicology Reports · doi:10.1016/j.toxrep.2022.12.006 · Cited by 4
Yang, J., Wang, Y., Xia, Y., Ren, Y., Wang, Z., Meng, X., Li, S., Liu, X., & Shao, J. (2024) · Neurochemical Research · doi:10.1007/s11064-024-04109-9 · Cited by 5
Self-citationDehghani, Z., Ranjbar, S., Shahabinezhad, F., Sabouri, P., & Mohammadi‐Bardbori, A. (2024) · Toxicology Research · doi:10.1093/toxres/tfae151 · Cited by 4
Moyano, P. M., Guzmán, G., Flores, A., García, J., Guerra-Menéndez, L., Sanjuan, J., Plaza, J. C., Abascal, L., Sierra, O. M., & del Pino, J. (2024) · Biomedicines · doi:10.3390/biomedicines12112441 · Cited by 3
Li, M., Ping, X., Song, H., Sun, J. W., Yang, Q., & Gao, L. (2026) · Toxicology · doi:10.1016/j.tox.2026.154423 · Cited by 3
Impact of per- and polyfluoroalkyl substances (PFAS) on brain development and function
Ko, M. Y., Min, E., Hyun, S., & Ka, M. (2026) · Behavioural Brain Research · doi:10.1016/j.bbr.2026.116348 · Cited by 3
O’Shaughnessy, K. L., Oshiro, W. M., Jackson, T. W., Starnes, H. M., Sasser, A. L., & McMichael, B. D. (2023) · Advances in neurotoxicology · doi:10.1016/bs.ant.2023.09.002 · Cited by 2
Jiang, J., Liu, Q., Zhang, B., Zhao, L., & Xu, D. (2025) · Toxics · doi:10.3390/toxics13080662 · Cited by 2
Li, B., Xu, Y., Guo, X., Wang, M., Li, X., Chen, Z., Wei, Z., Ma, D., & Yun, K. (2026) · Environment International · doi:10.1016/j.envint.2026.110093 · Cited by 2
Photoperiod perturbations impact perfluorohexane sulfonate (PFHxS) induced developmental toxicity
Ferdous, S. R., Rojas, A., Frank, C., Berry, Y., Sabatini, H. M., Luo, X., Sharma, S., Thummel, R., Chouinard, C. D., & Dasgupta, S. (2026) · Journal of Hazardous Materials · doi:10.1016/j.jhazmat.2026.141607 · Cited by 2
Ren, Z., Wang, X., Meng, L., Ren, D., Sun, J., Cai, Y., Duan, Y., Ning, X., Ku, T., & Sang, N. (2026) · Environment & Health · doi:10.1021/envhealth.5c00628 · Cited by 2
Ike, Y., Tomioka, M., & Iino, Y. (2022) · Genetics · doi:10.1093/genetics/iyac025 · Cited by 2
Neita, R., Hynes, K., Mercer, G. V., Schneider, C., & Cahill, L. S. (2025) · Journal of Pharmacological and Toxicological Methods · doi:10.1016/j.vascn.2025.108382 · Cited by 2
Souter, R., Lettoof, D. C., Kemper, C. M., Woolford, L., Chaber, A., Möller, L. M., Gaylard, S. G., Tomo, I., Bossley, M. I., Stevenson, G. J., et al. (2026) · Archives of Environmental Contamination and Toxicology · doi:10.1007/s00244-025-01179-w · Cited by 2
Wang, M., Liu, J., Zhang, L., He, Y., Zhao, Y., & Zheng, S. (2024) · Research Square · doi:10.21203/rs.3.rs-3852505/v1 · Cited by 2
Jiang, Z., Wei, C., & Ma, A. (2026) · Neurotoxicity Research · doi:10.1007/s12640-026-00780-8 · Cited by 1
Neurobehavioral Impacts of the Autism Risk Gene, WAC: Studies Involving C. elegans and Mice
Boonpraman, N., Kim, D.-W., Tislerics, E., Barot, J., Pacheco-Cruz, D., Kuhn, N. C., Vogt, D. L., & Sammi, S. R. (2026) · Molecular Neurobiology · doi:10.1007/s12035-026-05964-z · Cited by 1
Lorentzen, K. (2013) · BIBSYS Brage (BIBSYS (Norway)) · Cited by 1
Examining perfluorohexane sulfonate (PFHxS) impacts on sensorimotor and circadian rhythm developmentPreprint
Ferdous, S. R., Rojas, A., Frank, C., Sabatini, H. M., Luo, X., Sharma, S., Thummel, R., Chouinard, C. D., & Dasgupta, S. (2024) · bioRxiv (Cold Spring Harbor Laboratory) · doi:10.1101/2024.10.08.617320 · Cited by 1
Metadata
- Authors
- Long, Y., Wang, Y., Ji, G., Yan, L., Hu, F., & Gu, A.
- Affiliations
- China Pharmaceutical University (CN)
- Nanjing Medical University (CN)
- Ministry of Ecology and Environment (CN)
- State Key Laboratory of Reproductive Medicine (CN)
- Corresponding author
- Gu, Aihua
- Venue
- PLoS ONE
- Publisher
- Public Library of Science (PLoS)
- Published
- 2013-01-30
- Volume
- 8
- Issue
- 1
- Pages
- e54176
- ISSN
- 1932-6203 (ISSN-L)
- PMC
- PMC3559704
- OpenAlex
- W2070928735
- Cited by
- 106
- References
- 32
- Citations by year
- 2026: 12 · 2025: 9 · 2024: 15 · 2023: 11 · 2022: 8 · 2021: 7 · 2020: 7 · 2019: 5 · 2018: 6 · 2017: 3 · 2016: 5 · 2015: 10 · 2014: 4 · 2013: 4
- FWCI
- 6.13
- Type
- journal article
- Language
- en
- Open access
- gold
- doi.org
- Locations
- PLoS ONE (publishedVersion, cc-by)
- Europe PMC (PubMed Central) (publishedVersion, other-oa)
- PubMed Central (publishedVersion, cc-by)
- PubMed (publishedVersion)
- DOAJ (DOAJ: Directory of Open Access Journals) (submittedVersion, cc-by-sa)
- Figshare (submittedVersion, cc-by)
- Funders
- National Natural Science Foundation of China (81172694, 30901210)
- Government of Jiangsu Province
- Natural Science Foundation of Jiangsu Province
- Priority Academic Program Development of Jiangsu Higher Education Institutions
- Topics
- Physical Sciences › Environmental Science › Environmental Chemistry › Per- and polyfluoroalkyl substances research
- Physical Sciences › Environmental Science › Health, Toxicology and Mutagenesis › Toxic Organic Pollutants Impact
- Life Sciences › Neuroscience › Developmental Neuroscience › Anesthesia and Neurotoxicity Research
- Keywords
- PFOS, hippocampal neurons, apoptosis, spatial learning and memory impairment, glutamate release, dopamine, caudate-putamen, MIB-1, HERC5, Tyro3, caspase-3, Bcl-2 family proteins, survivin, ubiquitin-proteasome system, protein expression profiling, perfluorinated compounds
- MeSH terms
- Animals, Dopamine, Fluorocarbons, Gene Expression Regulation, Hippocampus, Memory, 3,4-Dihydroxyphenylacetic Acid, Apoptosis, Alkanesulfonic Acids, Glutamic Acid, Maze Learning, Mice, Caspase 3
About these checks
Registry, retraction, Cites and statistics results are computed, not judged, with one exception: a printed reference that no index lists is read once by a model before it counts as a citation error. Claims are extracted by a model and kept only when their quote appears verbatim in the text; each cited source is then checked, with a model’s help, for whether it says what the claim relies on. Those verdicts can be wrong — read the claim’s quote and the cited source before relying on one.
Statistics and arithmetic are recomputed, not judged.
Confidence bands are shown only for fields calibrated on our annotated test set. None is calibrated yet, so no band is shown.
What counts as a claim ›How we measure confidence ›How we check this ›
Are you an author, or do you see a problem with this page? Request a review
