Cited by 145

The DOI matches its Crossref record; 10 of the 10 references it cites were found in a registry or an index.

Autophagy Activation Clears ELAVL1/HuR-Mediated Accumulation of SQSTM1/p62 during Proteasomal Inhibition in Human Retinal Pigment Epithelial Cells

Viiri, Johanna, Amadio, Marialaura, Marchesi, Nicoletta, Hyttinen, Juha M. T., Kivinen, Niko, Sironen, Reijo, Rilla, Kirsi, Akhtar, Saeed, Provenzani, Alessandro, D'Agostino, Vito Giuseppe, Govoni, Stefano, Pascale, Alessia, Agostini, Hansjurgen, Petrovski, Goran, Salminen, Antero, Kaarniranta, Kai·2013·PLoS ONE

Overview

The claims and statistics of this paper haven’t been checked yet.

Run the check — free, no account needed. It reads the open-access text and checks the sources it cites.

A few free checks a day · papers already verified open instantly · results are public

Integrity signals

Registry

Crossref · 10.1371/journal.pone.0069563

Cites

10 of 10 references verified0 citation errors · 0 not checkable

Statistics

Figures

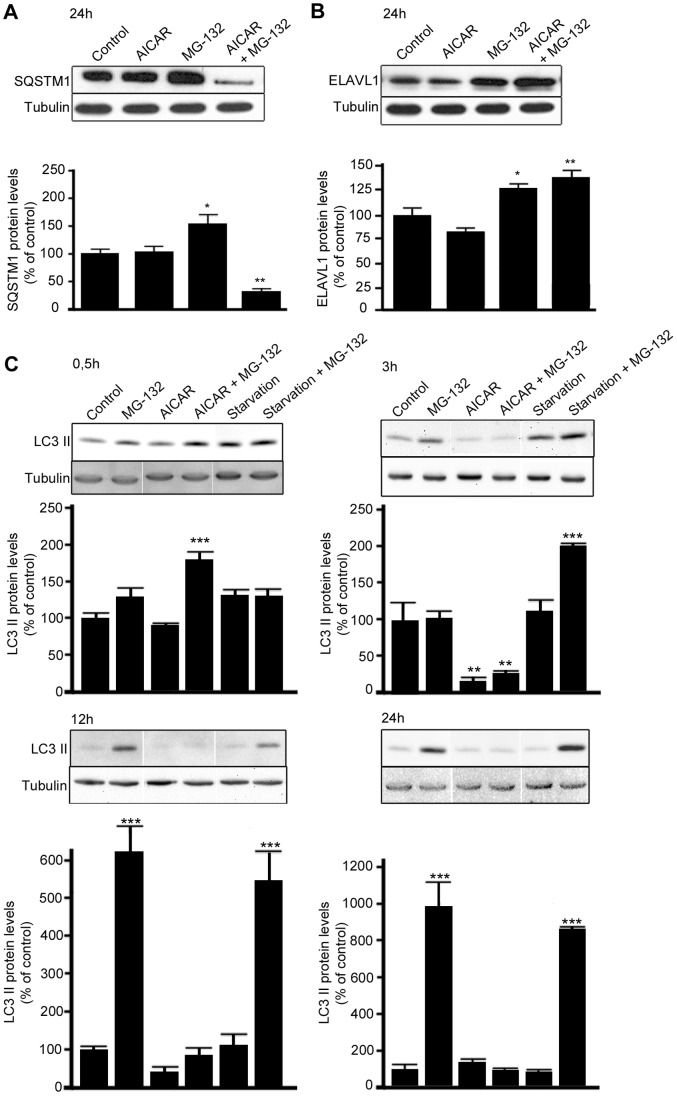
Figure 1 MG-132-induced increase of SQSTM1/p62 but not ELAVL1/HuR protein levels is counteracted by AICAR treatment. Representative western blotting (upper) and densitometric analysis (lower) of SQSTM1/p62 (A), ELAVL1/HuR (B) and MAP1LC3A/LC3-II (C) proteins in the total homogenates of ARPE-19 cells after starvation or/and exposure to AICAR (2 mM) or/and MG-132 (5 µM) for 0,5 h, 3 h, 12 h and 24 h. α-tubulin was used as a loading control. Control cells were exposed only to solvent (DMSO). Results are expressed as means ± S.E.M. The data were analyzed by ANOVA, followed by Dunnett’s Multiple Comparison Test; *p<0.05, **p<0.01, control vs. treated, n = 7 (SQSTM1/p62 and ELAVL1/HuR), n = 3 (MAP1LC3A/LC3-II).
Figure 1 MG-132-induced increase of SQSTM1/p62 but not ELAVL1/HuR protein levels is counteracted by AICAR treatment. Representative western blotting (upper) and densitometric analysis (lower) of SQSTM1/p62 (A), ELAVL1/HuR (B) and MAP1LC3A/LC3-II (C) proteins in the total homogenates of ARPE-19 cells after starvation or/and exposure to AICAR (2 mM) or/and MG-132 (5 µM) for 0,5 h, 3 h, 12 h and 24 h. α-tubulin was used as a loading control. Control cells were exposed only to solvent (DMSO). Results are expressed as means ± S.E.M. The data were analyzed by ANOVA, followed by Dunnett’s Multiple Comparison Test; *p<0.05, **p<0.01, control vs. treated, n = 7 (SQSTM1/p62 and ELAVL1/HuR), n = 3 (MAP1LC3A/LC3-II).CC BY · PubMed Central
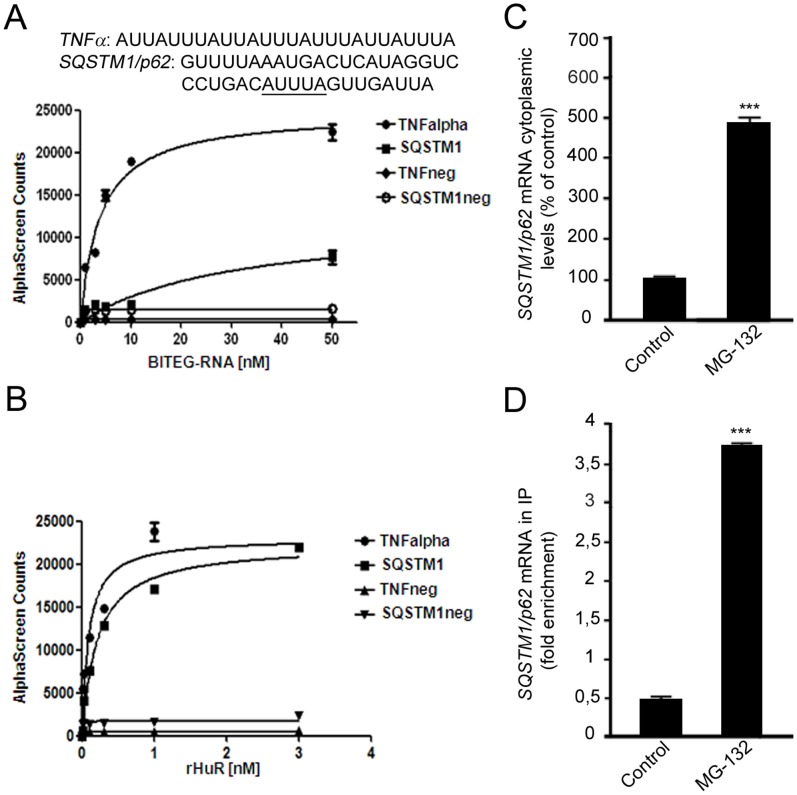
Figure 2 SQSTM1/p62 transcript as a new target of the RNA-binding ELAVL1/HuR protein. (A): RNA-binding activity of ELAVL1/HuR evaluated by AlphaScreen technology. Saturation binding experiments investigated by titrating a series of biotinylated single-stranded (BITEG-) RNAs, including TNFneg and SQSTM1/p62neg, that we designated as negative controls, against 1 nM of rELAVL1/HuR. Calculated dissociation constants (Kd) for TNFalpha (3.83±0.69 nM, R2 = 0.97), and SQSTM1/p62 (30.85±13.22 nM R2 = 0.91) are indicated. The plots represent mean ± SD of two independent experiments. (B): Saturation binding experiments as function of rELAVL1/HuR concentrations against four different type of RNA-substrates at 50 nM concentration. 1 nM of rELAVL1/HuR was enough to reach saturation of the binding. The plots represent Mean ± SD of two independent experiments. (C): Effect of MG-132 exposure on SQSTM1/p62 gene expression. Determination of SQSTM1/p62 mRNA by real-time qPCR in human ARPE-19 cells following treatments with solvent (control) or 5 µM MG-132 for 24 hrs. SQSTM1/p62 mRNA expression in control cells was taken as 100%. The values obtained from total cellular mRNA have been normalized to the level of RPL6 mRNA and expressed as mean ± S.E.M. ***p<0.001; Student’s t test; n = 3. (D): The binding of ELAVL1/HuR protein to SQSTM1/p62 transcript increases in the cytoplasm following MG-132 stimulus. Fold enrichment detected by quantitative real-time RT-PCR of SQSTM1/p62 mRNA in control and 24 h MG-132 RPE cells following immunoprecipitation with anti-ELAV antibody (IP) in the cytoplasm. ***p<0.001, Student’s t-test, n = 3. The data of SQSTM1/p62 were normalized with respect to the data obtained from immunoprecipitation with an irrelevant antibody as a negative control.
Figure 2 SQSTM1/p62 transcript as a new target of the RNA-binding ELAVL1/HuR protein. (A): RNA-binding activity of ELAVL1/HuR evaluated by AlphaScreen technology. Saturation binding experiments investigated by titrating a series of biotinylated single-stranded (BITEG-) RNAs, including TNFneg and SQSTM1/p62neg, that we designated as negative controls, against 1 nM of rELAVL1/HuR. Calculated dissociation constants (Kd) for TNFalpha (3.83±0.69 nM, R2 = 0.97), and SQSTM1/p62 (30.85±13.22 nM R2 = 0.91) are indicated. The plots represent mean ± SD of two independent experiments. (B): Saturation binding experiments as function of rELAVL1/HuR concentrations against four different type of RNA-substrates at 50 nM concentration. 1 nM of rELAVL1/HuR was enough to reach saturation of the binding. The plots represent Mean ± SD of two independent experiments. (C): Effect of MG-132 exposure on SQSTM1/p62 gene expression. Determination of SQSTM1/p62 mRNA by real-time qPCR in human ARPE-19 cells following treatments with solvent (control) or 5 µM MG-132 for 24 hrs. SQSTM1/p62 mRNA expression in control cells was taken as 100%. The values obtained from total cellular mRNA have been normalized to the level of RPL6 mRNA and expressed as mean ± S.E.M. ***p<0.001; Student’s t test; n = 3. (D): The binding of ELAVL1/HuR protein to SQSTM1/p62 transcript increases in the cytoplasm following MG-132 stimulus. Fold enrichment detected by quantitative real-time RT-PCR of SQSTM1/p62 mRNA in control and 24 h MG-132 RPE cells following immunoprecipitation with anti-ELAV antibody (IP) in the cytoplasm. ***p<0.001, Student’s t-test, n = 3. The data of SQSTM1/p62 were normalized with respect to the data obtained from immunoprecipitation with an irrelevant antibody as a negative control.CC BY · PubMed Central
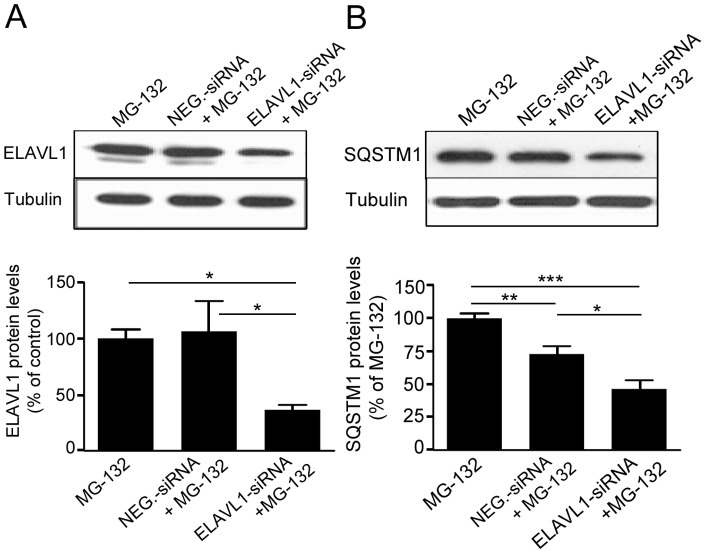
Figure 3 The MG-132-mediated upregulation of SQSTM1/p62 protein expression requires the specific presence of ELAVL1/HuR protein. Representative western blotting (upper) and densitometric analysis (lower) of ELAVL1/HuR (A) and SQSTM1/p62 (B) proteins in the total homogenates of ELAVL1/HuR silenced ARPE-19 cells and negative control (NEG-siRNA) cells after exposure to 5 µM MG-132 for 24 h. α-tubulin was used as a loading control. Results are expressed as means ± S.E.M. *p<0.05; **p<0.01; ***p<0.001, Tukey’s multiple comparison test; n = 5.
Figure 3 The MG-132-mediated upregulation of SQSTM1/p62 protein expression requires the specific presence of ELAVL1/HuR protein. Representative western blotting (upper) and densitometric analysis (lower) of ELAVL1/HuR (A) and SQSTM1/p62 (B) proteins in the total homogenates of ELAVL1/HuR silenced ARPE-19 cells and negative control (NEG-siRNA) cells after exposure to 5 µM MG-132 for 24 h. α-tubulin was used as a loading control. Results are expressed as means ± S.E.M. *p<0.05; **p<0.01; ***p<0.001, Tukey’s multiple comparison test; n = 5.CC BY · PubMed Central
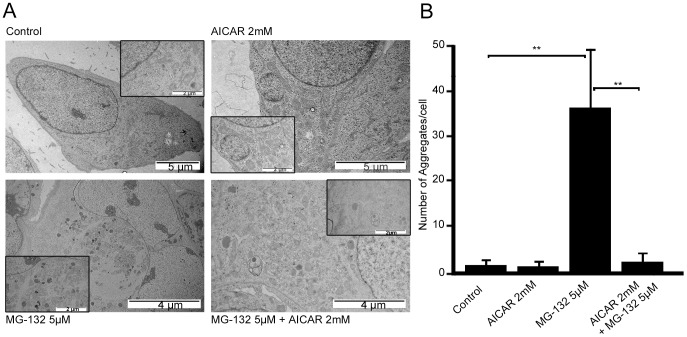
Figure 4 Transmission electron micrographs of ARPE-19 cells exposed to AICAR or/and MG-132 and aggregate quantification. (A) Representative transmission electron micrographs of ARPE-19 untreated control cells, cells exposed to AICAR 2 mM or/and MG-132 5 µM for 24 h. Aggregates are indicated by arrows. (B) Quantification of aggregates in ARPE-19 cells exposed to AICAR 2 mM or/and MG-132 5 µM for 24 h. Eight parallel samples were measured in all treatments. **p<0.01, Mann–Whitney.
Figure 4 Transmission electron micrographs of ARPE-19 cells exposed to AICAR or/and MG-132 and aggregate quantification. (A) Representative transmission electron micrographs of ARPE-19 untreated control cells, cells exposed to AICAR 2 mM or/and MG-132 5 µM for 24 h. Aggregates are indicated by arrows. (B) Quantification of aggregates in ARPE-19 cells exposed to AICAR 2 mM or/and MG-132 5 µM for 24 h. Eight parallel samples were measured in all treatments. **p<0.01, Mann–Whitney.CC BY · PubMed Central
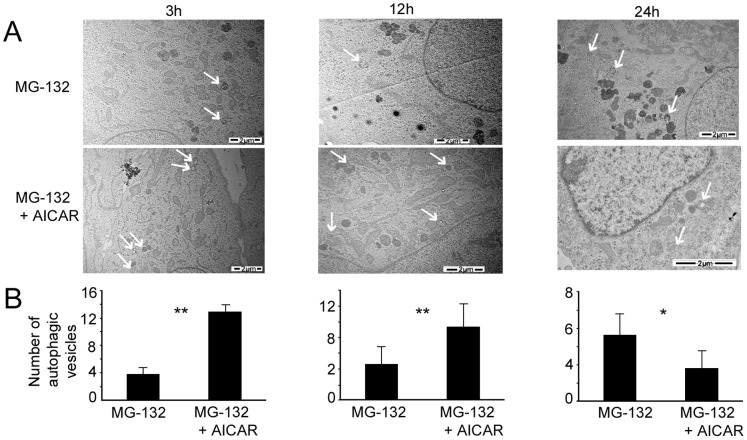
Figure 5 Transmission electron micrographs of ARPE-19 cells exposed to AICAR or/and MG-132 and autophagic vesicles quantification. (A) Representative transmission electron micrographs of ARPE-19 cells exposed to MG-132 5 µM solely and with AICAR 2 mM for 3 h, 12 h and 24 h. Autophagic vesicles are indicated by arrows. (B) Quantification of autophagic vesicles in ARPE-19 exposed to MG-132 5 µM solely and with AICAR 2 mM for 3 h, 12 h and 24 h. Six parallel samples were measured in all treatments. *p<0.05, **p<0.01, Mann–Whitney.
Figure 5 Transmission electron micrographs of ARPE-19 cells exposed to AICAR or/and MG-132 and autophagic vesicles quantification. (A) Representative transmission electron micrographs of ARPE-19 cells exposed to MG-132 5 µM solely and with AICAR 2 mM for 3 h, 12 h and 24 h. Autophagic vesicles are indicated by arrows. (B) Quantification of autophagic vesicles in ARPE-19 exposed to MG-132 5 µM solely and with AICAR 2 mM for 3 h, 12 h and 24 h. Six parallel samples were measured in all treatments. *p<0.05, **p<0.01, Mann–Whitney.CC BY · PubMed Central
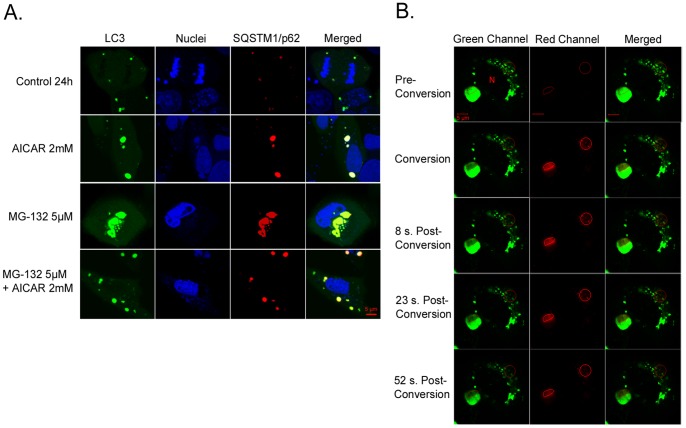
Figure 6 Colocalization of SQSTM1/p62 and MAP1LC3A/LC3 and position changes of SQSTM1/p62, revealed by confocal microscopy analysis. A light merge orange/yellow signal of colocalizing MAP1LC3A/LC3 (pDendra2-hLC3, green) and SQSTM1/p62 (pDsRed2-hp62, red) is detectable, usually near to the cell nuclei. Nuclei are stained with blue dye. The scale bar equals to 5 µm. (A): Confocal microscopy images of untreated control ARPE-19 cells and cells exposed to AICAR 2 mM or/and MG-132 5 µM for 24 h. A = Aggregates (B): Position of SQSTM1/p62 (pDendra2-hp62) in ARPE-19 cells, revealed by confocal microscopy analysis. SQSTM1/p62 in two different areas was photoconverted within approximately 7 sec (circled). Within 1 minute after photoconversion, the photoconverted SQSTM1/p62 is stationary. Cells have been exposed to 5 µM MG-132 for 24 h. N = Cell nucleus.
Figure 6 Colocalization of SQSTM1/p62 and MAP1LC3A/LC3 and position changes of SQSTM1/p62, revealed by confocal microscopy analysis. A light merge orange/yellow signal of colocalizing MAP1LC3A/LC3 (pDendra2-hLC3, green) and SQSTM1/p62 (pDsRed2-hp62, red) is detectable, usually near to the cell nuclei. Nuclei are stained with blue dye. The scale bar equals to 5 µm. (A): Confocal microscopy images of untreated control ARPE-19 cells and cells exposed to AICAR 2 mM or/and MG-132 5 µM for 24 h. A = Aggregates (B): Position of SQSTM1/p62 (pDendra2-hp62) in ARPE-19 cells, revealed by confocal microscopy analysis. SQSTM1/p62 in two different areas was photoconverted within approximately 7 sec (circled). Within 1 minute after photoconversion, the photoconverted SQSTM1/p62 is stationary. Cells have been exposed to 5 µM MG-132 for 24 h. N = Cell nucleus.CC BY · PubMed Central
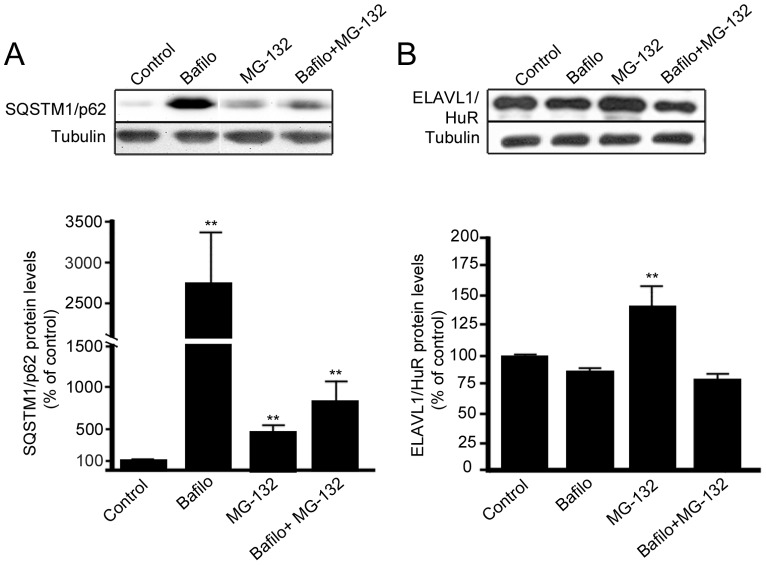
Figure 7 SQSTM1/p62 protein, but not ELAVL1/HuR protein, is degraded by autophagy in ARPE-19 cells. Representative western blotting and densitometric analysis of SQSTM1/p62 (A) and ELAVL1/HuR (B) proteins in the total homogenates of ARPE-19 cells after exposure to bafilomycin (50 nM) or/and MG-132 (5 µM) for 24 h. α-tubulin was used as a loading control. Results are expressed as means ± S.D. The data were analyzed by ANOVA, followed by Mann-Whitney; **p<0.01, untreated control cells vs. treated cells, n = 7.
Figure 7 SQSTM1/p62 protein, but not ELAVL1/HuR protein, is degraded by autophagy in ARPE-19 cells. Representative western blotting and densitometric analysis of SQSTM1/p62 (A) and ELAVL1/HuR (B) proteins in the total homogenates of ARPE-19 cells after exposure to bafilomycin (50 nM) or/and MG-132 (5 µM) for 24 h. α-tubulin was used as a loading control. Results are expressed as means ± S.D. The data were analyzed by ANOVA, followed by Mann-Whitney; **p<0.01, untreated control cells vs. treated cells, n = 7.CC BY · PubMed Central
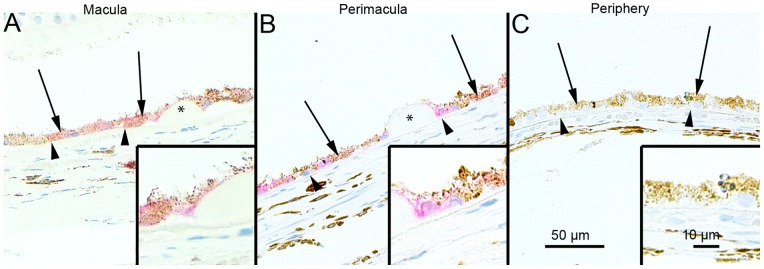
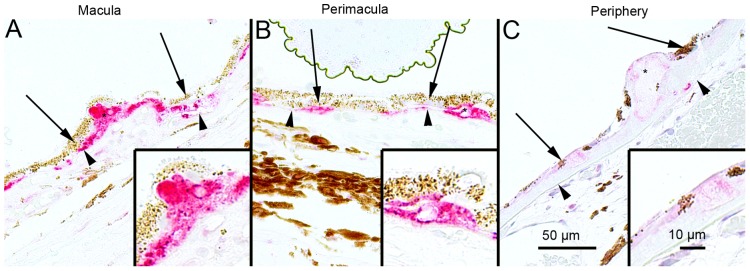
Figure 8 Sections of eyes with clinically diagnosed AMD immunostained for SQSTM1/p62. The extent of cytoplasmic immunopositivity in the retinal pigment epithelial cells (RPE, shown by arrows) and in the drusen was evaluated microscopically (no staining or positive staining) by selecting 5 mm long areas of foveomacular (A), perimacular (B) and peripheral (C) regions. The SQSTM1/p62 staining in the foveomacular areas was more extensive as compared to the perimacular and peripheral areas (B and C, respectively). The drusen (shown by asterisks) were mostly SQSTM1/p62 negative. The nuclei of RPE cells were SQSTM1/p62 negative. (Original magnifications of x 200 and in insets x 400; Bruch's membrane shown by arrow heads).
Figure 8 Sections of eyes with clinically diagnosed AMD immunostained for SQSTM1/p62. The extent of cytoplasmic immunopositivity in the retinal pigment epithelial cells (RPE, shown by arrows) and in the drusen was evaluated microscopically (no staining or positive staining) by selecting 5 mm long areas of foveomacular (A), perimacular (B) and peripheral (C) regions. The SQSTM1/p62 staining in the foveomacular areas was more extensive as compared to the perimacular and peripheral areas (B and C, respectively). The drusen (shown by asterisks) were mostly SQSTM1/p62 negative. The nuclei of RPE cells were SQSTM1/p62 negative. (Original magnifications of x 200 and in insets x 400; Bruch's membrane shown by arrow heads).CC BY · PubMed Central
Figure 9 Sections of eyes with clinically diagnosed AMD immunostained for ubiquitin. The extent of Bruch’s membrane immunopositivity of the retinal pigment epithelial cells (RPE, shown by arrows) and in the drusen (asterisks) was evaluated microscopically (no staining or positive staining) by selecting 5 mm long areas of foveomacular (A), perimacular (B) and peripheral (C) regions. The uniform staining of ubiquitin in RPE cells Bruch’s membrane was observed in all these regions (arrows). There were no differences in the extent of staining between these regions in each group. The nuclei of RPE cells were mostly ubiquitin negative. Most of the drusen were strongly ubiquitin-positive (asterisks). (Original magnifications of x 200 and in insets x 400; Bruch's membrane shown by arrow heads).
Figure 9 Sections of eyes with clinically diagnosed AMD immunostained for ubiquitin. The extent of Bruch’s membrane immunopositivity of the retinal pigment epithelial cells (RPE, shown by arrows) and in the drusen (asterisks) was evaluated microscopically (no staining or positive staining) by selecting 5 mm long areas of foveomacular (A), perimacular (B) and peripheral (C) regions. The uniform staining of ubiquitin in RPE cells Bruch’s membrane was observed in all these regions (arrows). There were no differences in the extent of staining between these regions in each group. The nuclei of RPE cells were mostly ubiquitin negative. Most of the drusen were strongly ubiquitin-positive (asterisks). (Original magnifications of x 200 and in insets x 400; Bruch's membrane shown by arrow heads).CC BY · PubMed Central
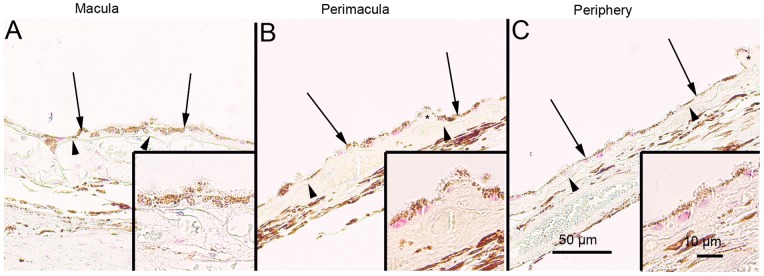
Figure 10 Sections of eyes with clinically diagnosed AMD immunostained for ELAVL1/HuR. The immunopositivity of the nuclei of RPE cells (shown by arrows) and the extent of immunopositivity in the drusen (asterisks) was evaluated microscopically (no staining or positive staining) by selecting 5 mm long areas of foveomacular (A), perimacular (B) and peripheral (C) regions. The foveomacular nuclei showed less extensive immunopositivity for ELAVL1/HuR than the perimacular and peripheral regions. However this difference was not statistically significant in any of the groups studied (p>0.1). The cytoplasms of RPE cells were ELAVL1/HuR negative. Most of the drusen were ELAVL1/HuR-negative. (Original magnifications of x 200 and in insets x 400; Bruch's membrane shown by arrow heads).
Figure 10 Sections of eyes with clinically diagnosed AMD immunostained for ELAVL1/HuR. The immunopositivity of the nuclei of RPE cells (shown by arrows) and the extent of immunopositivity in the drusen (asterisks) was evaluated microscopically (no staining or positive staining) by selecting 5 mm long areas of foveomacular (A), perimacular (B) and peripheral (C) regions. The foveomacular nuclei showed less extensive immunopositivity for ELAVL1/HuR than the perimacular and peripheral regions. However this difference was not statistically significant in any of the groups studied (p>0.1). The cytoplasms of RPE cells were ELAVL1/HuR negative. Most of the drusen were ELAVL1/HuR-negative. (Original magnifications of x 200 and in insets x 400; Bruch's membrane shown by arrow heads).CC BY · PubMed Central
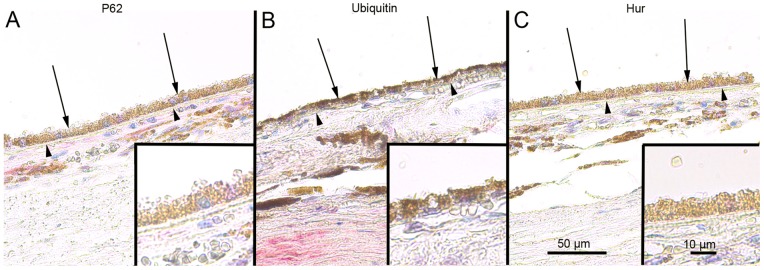
Figure 11 Sections of foveomacular areas of age-matched control eyes for SQSTM1/p62, ubiquitin and ELAVL1/HuR. The extent of cytoplasmic immunopositivity for SQSTM1/p62, Bruch’s membrane immunopositivity for ubiquitin and the immunopositivity of nuclei of RPE cells for ELAVL1/HuR (foveomacular areas shown; A, B and C respectively) in the RPE cells (shown by arrows) was evaluated microscopically (no staining or positive staining). For SQSTM1/p62 there were only a few immunopositive cytoplasm’s randomly distributed through-out the RPE cell layer and the nuclei were negative. Bruch’s membrane (shown by arrowheads) was immunopositive for ubiquitin occasionally through-out the RPE cell layer in very small amounts while all of the nuclei were negative. Half of the nuclei showed minor immunopositivity for ELAVL1/HuR while the cytoplasm’s of RPE cells were negative. The foveomacular areas showed no difference in immunohistochemical stainings when compared to areas of perimacular and peripheral retina in all of the proteins studied. (Original magnifications of x 200 and in insets x 400).
Figure 11 Sections of foveomacular areas of age-matched control eyes for SQSTM1/p62, ubiquitin and ELAVL1/HuR. The extent of cytoplasmic immunopositivity for SQSTM1/p62, Bruch’s membrane immunopositivity for ubiquitin and the immunopositivity of nuclei of RPE cells for ELAVL1/HuR (foveomacular areas shown; A, B and C respectively) in the RPE cells (shown by arrows) was evaluated microscopically (no staining or positive staining). For SQSTM1/p62 there were only a few immunopositive cytoplasm’s randomly distributed through-out the RPE cell layer and the nuclei were negative. Bruch’s membrane (shown by arrowheads) was immunopositive for ubiquitin occasionally through-out the RPE cell layer in very small amounts while all of the nuclei were negative. Half of the nuclei showed minor immunopositivity for ELAVL1/HuR while the cytoplasm’s of RPE cells were negative. The foveomacular areas showed no difference in immunohistochemical stainings when compared to areas of perimacular and peripheral retina in all of the proteins studied. (Original magnifications of x 200 and in insets x 400).CC BY · PubMed Central
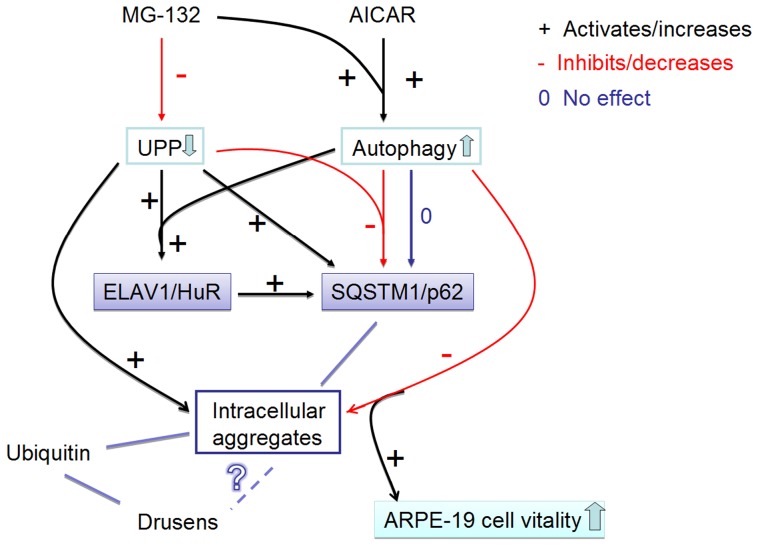
Figure 12 Summary of the results. The proteasome inhibitor MG-132 down-regulates (−) the ubiquitin-proteasome pathway (UPP). AMPK-activator AICAR and proteasome inhibitor MG-132 co-treatment activates (+) the autophagy. UPP inhibition significantly increases (+) SQSTM1/p62 protein levels, while autophagy induction during UPP inhibition robustly decreases (−) SQSTM1/p62 protein levels. Since SQSTM1/p62 localizes to aggregates, the decreasing of SQSTM1/p62 reveals its autophagy clearance. In addition, proteasome inhibition significantly increases ELAVL1/HuR protein levels by itself and during the autophagy induction (+). Proteasome inhibition induces a positive regulation of SQSTM1/p62 expression that occurs also at post-transcriptional level via ELAVL1/HuR protein (+). Activated autophagy is able to completely abolish the MG-132-induced protein aggregation (−), which, in turn improves the cell vitality. Ubiquitin is also found in intracellular aggregates in ARPE-19 cells as well as from drusens. In contrast, SQSTM1/p62 is found only in the intracellular aggregates in ARPE-19 cells, but not in drusens. However, SQSTM1/p62 levels were high in macular area of RPE cells revealing impaired autophagy. What is the relation between drusen and intracellular aggregates remains still unknown. Red lines with minus symbol represent inhibiting and decreasing events in ARPE-19 cells. Black lines and plus symbol represent activating and increasing events in the ARPE-19 cell. Zero (0) and dark blue line indicate neutral effects in the ARPE-19 cell. UPP: ubiquitin-proteasome pathway.
Figure 12 Summary of the results. The proteasome inhibitor MG-132 down-regulates (−) the ubiquitin-proteasome pathway (UPP). AMPK-activator AICAR and proteasome inhibitor MG-132 co-treatment activates (+) the autophagy. UPP inhibition significantly increases (+) SQSTM1/p62 protein levels, while autophagy induction during UPP inhibition robustly decreases (−) SQSTM1/p62 protein levels. Since SQSTM1/p62 localizes to aggregates, the decreasing of SQSTM1/p62 reveals its autophagy clearance. In addition, proteasome inhibition significantly increases ELAVL1/HuR protein levels by itself and during the autophagy induction (+). Proteasome inhibition induces a positive regulation of SQSTM1/p62 expression that occurs also at post-transcriptional level via ELAVL1/HuR protein (+). Activated autophagy is able to completely abolish the MG-132-induced protein aggregation (−), which, in turn improves the cell vitality. Ubiquitin is also found in intracellular aggregates in ARPE-19 cells as well as from drusens. In contrast, SQSTM1/p62 is found only in the intracellular aggregates in ARPE-19 cells, but not in drusens. However, SQSTM1/p62 levels were high in macular area of RPE cells revealing impaired autophagy. What is the relation between drusen and intracellular aggregates remains still unknown. Red lines with minus symbol represent inhibiting and decreasing events in ARPE-19 cells. Black lines and plus symbol represent activating and increasing events in the ARPE-19 cell. Zero (0) and dark blue line indicate neutral effects in the ARPE-19 cell. UPP: ubiquitin-proteasome pathway.CC BY · PubMed Central

Verification

Claims the paper makes

The claims and statistics of this paper haven’t been checked yet.

Run the check — free, no account needed. It reads the open-access text and checks the sources it cites.

A few free checks a day · papers already verified open instantly · results are public

Claims other papers make about this one

Each is checked against this paper’s own text: does it say what the citing paper says it does?

Self-check

Percentages, sums and reported differences re-computed from the paper’s own numbers.

The self-check needs the paper’s full text.

Citations

Cites

Research works printed but not linked: 54

  1. D Pascolini, 2004, Global update of available data on visual impairment: a compilation of population based prevalence studies, Ophthalmic Epidemiol, 11, 67, 10.1076/opep.11.2.67.28158 · DOI
  2. K Kaarniranta, 2011, Age-related macular degeneration (AMD): Alzheimer's disease in the eye?, J Alzheimers Dis, 24, 615, 10.3233/JAD-2011-101908 · DOI · Paper page
  3. A Gordois, 2012, An estimation of the worldwide economic and health burden of visual impairment, Glob Public Health, 7, 465, 10.1080/17441692.2011.634815 · DOI
  4. KM Geh, 2006, Age related macular degeneration emerging pathogenetic and therapeutic concepts, Ann Med, 38, 450, 10.1080/07853890600946724 · DOI
  5. DS Friedman, 2004, Prevalence of age related macular degeneration in the United States, Arch Ophthalmol, 122, 564, 10.1001/archopht.122.4.564 · DOI
  6. K Kaarniranta, 2009, Heat shock proteins as gatekeepers of proteolytic pathways- Implications for age-related macular degeneration (AMD), Ageing Res Rev, 8, 128, 10.1016/j.arr.2009.01.001 · DOI
  7. Sin HP, Liu DT, Lam DS (2012) Lifestyle modification, nutritional and vitamins supplements for age-related macular degeneration. Acta Ophthalmol Jan 23. doi:10.1111/j.1755-3768.2011.02357.x. Epub ahead of print. · DOI
  8. K Kaarniranta, 2009, NF-kappaB signaling as a putative target for omega-3 metabolites in the prevention of age-related macular degeneration (AMD), Exp Gerontol, 44, 685, 10.1016/j.exger.2009.09.002 · DOI
  9. Terman A, Kurz T, Navratil M, Arriaga EA, Brunk UT (2010) Mitochondrial turnover and aging of long-lived postmitotic cells: the mitochondrial–lysosomal axis theory of aging, Antioxid Redox Signal 12; 503–535. · DOI · Paper page
  10. Z Yang, 2010, Eaten alive: a history of macroautophagy, Nat Cell Biol, 2, 814, 10.1038/ncb0910-814 · DOI
  11. N Mizushima, 2011, Autophagy: renovation of cells and tissues, Cell, 147, 728, 10.1016/j.cell.2011.10.026 · DOI
  12. Z Yang, 2010, Mammalian autophagy: core molecular machinery and signalling regulation, Curr Opin Cell Biol, 22, 124, 10.1016/j.ceb.2009.11.014 · DOI · Paper page
  13. G Bjørkøy, 2005, p62/SQSTM1 forms protein aggregates degraded by autophagy and has a protective effect on huntingtin-induced cell death, J Cell Biol, 171, 603, 10.1083/jcb.200507002 · DOI · Paper page
  14. VI Korolchuk, 2009, A novel link between autophagy and the ubiquitin-proteasome system, Autophagy, 5, 862, 10.4161/auto.8840 · DOI
  15. S Pankiv, 2010, Nucleocytoplasmic shuttling of p62/SQSTM1 and its role in recruitment of nuclear polyubiquitinated proteins to promyelocytic leukemia bodies, J Biol Chem, 285, 5941, 10.1074/jbc.M109.039925 · DOI
  16. J Viiri, 2010, p62/sequestosome 1 as a regulator of proteasome inhibitor-induced autophagy in human retinal pigment epithelial cells, Mol Vis, 16, 1399
  17. M Komatsu, 2007, Homeostatic levels of p62 control cytoplasmic inclusion body formation in autophagy-deficient mice, Cell, 131, 1149, 10.1016/j.cell.2007.10.035 · DOI · Paper page
  18. E Kuusisto, 2001, Ubiquitin-binding protein p62 is present in neuronal and glial inclusions in human tauopathies and synucleinopathies, Neuroreport, 12, 2085, 10.1097/00001756-200107200-00009 · DOI
  19. E Kuusisto, 2002, Early accumulation of p62 in neurofibrillary tangles in Alzheimer's disease: possible role in tangle formation, Neuropathol Appl Neurobiol, 28, 228, 10.1046/j.1365-2990.2002.00394.x · DOI
  20. K Zatloukal, 2002, p62 Is a common component of cytoplasmic inclusions in proteinaggregation diseases, Am J Pathol, 160, 255, 10.1016/S0002-9440(10)64369-6 · DOI · Paper page
  21. H Braak, 2011, Nerve cells immunoreactive for p62 in select hypothalamic and brainstem nuclei of controls and Parkinson's disease cases, J Neural Transm, 118, 809, 10.1007/s00702-010-0508-2 · DOI
  22. A Salminen, 2012, Emerging role of p62/sequestosome-1 in the pathogenesis of Alzheimer's disease, Prog Neurobiol, 96, 87, 10.1016/j.pneurobio.2011.11.005 · DOI · Paper page
  23. T Geetha, 2012, Sequestosome 1/p62: across diseases, Biomarkers, 17, 99, 10.3109/1354750X.2011.653986 · DOI
  24. T Ishii, 1997, Low micromolar levels of hydrogen peroxide and proteasome inhibitors induce the 60-kDa A170 stress protein in murine peritoneal macrophages, Biochem Biophys Res Commun, 6, 33, 10.1006/bbrc.1997.6221 · DOI
  25. U Nagaoka, 2004, Increased expression of p62 in expanded polyglutamine-expressing cells and its association with polyglutamine inclusions, J Neurochem, 91, 57, 10.1111/j.1471-4159.2004.02692.x · DOI
  26. E Kuusisto, 2001, Ubiquitin-binding protein p62 expression is induced during apoptosis and proteosomal inhibition in neuronal cells, Biochem Biophys Res Commun, 280, 223, 10.1006/bbrc.2000.4107 · DOI · Paper page
  27. S Srikantan, 2012, HuR function in disease, Front Biosci, 17, 189, 10.2741/3921 · DOI · Paper page
  28. A Pascale, 2012, The complex world of post-transcriptional mechanisms: is their deregulation a common link for diseases? Focus on ELAV-like RNA-binding proteins, Cell Mol Life Sci, 69, 501, 10.1007/s00018-011-0810-7 · DOI
  29. NG Gurskaya, 2006, Engineering of a monomeric green-to-red photoactivatable fluorescent protein induced by blue light, Nat Biotechnol, 24, 461, 10.1038/nbt1191 · DOI · Paper page
  30. H Inoue, 1990, High efficiency transformation of Escherichia coli with plasmids, Gene, 96, 23, 10.1016/0378-1119(90)90336-P · DOI
  31. Sambrook J, Fritsch EF, Maniatis T (1990) Extraction and purification of plasmid DNA. In: Molecular Cloning: A Laboratory Manual. 2nd edition. Plainview, NY: Cold Spring Harbor Press, 1.25–1.28.
  32. SA Tenenbaum, 2002, Ribonomics: identifying mRNA subsets in mRNP complexes using antibodies to RNA-binding proteins and genomic arrays, Methods, 26, 191, 10.1016/S1046-2023(02)00022-1 · DOI
  33. K Nakaso, 2004, Transcriptional activation of p62/A170/ZIP during the formation of the aggregates: possible mechanisms and the role in Lewy body formation in Parkinson's disease, Brain Res, 1012, 42, 10.1016/j.brainres.2004.03.029 · DOI · Paper page
  34. B Schaljo, 2009, Tristetraprolin is required for full anti-inflammatory response of murine macrophages to IL-10, J Immunol, 183, 1197, 10.4049/jimmunol.0803883 · DOI
  35. DJ Klionsky, 2008, Does bafilomycin A1 block the fusion of autophagosomes with lysosomes?, Autophagy, 4, 849, 10.4161/auto.6845 · DOI · Paper page
  36. K Abdelmohsen, 2008, miR-519 reduces cell proliferation by lowering RNA-binding protein HuR levels, Proc Natl Acad Sci U S A, 105, 20297, 10.1073/pnas.0809376106 · DOI · Paper page
  37. M Amadio, 2008, Post-transcriptional regulation of HSP70 expression following oxidative stress in SH-SY5Y cells: the potential involvement of the RNA-binding protein HuR, Curr Pharm Des, 14, 2651, 10.2174/138161208786264052 · DOI
  38. MA Bonelli, 2004, Proteasome inhibition increases HuR level, restores heat-inducible HSP72 expression and thermotolerance in WI-38 senescent human fibroblasts, Exp Gerontol, 39, 423, 10.1016/j.exger.2003.12.004 · DOI
  39. VI Korolchuk, 2009, Autophagy inhibition compromises degradation of ubiquitin-proteasome pathway substrates, Mol Cell, 33, 517, 10.1016/j.molcel.2009.01.021 · DOI · Paper page
  40. HR Samari, 1998, Inhibition of hepatocytic autophagy by adenosine, aminoimidazole-4-carboxamide riboside, and N6-mercaptopurine riboside. Evidence for involvement of amp-activated protein kinase, J Biol Chem, 273, 23758, 10.1074/jbc.273.37.23758 · DOI · Paper page
  41. D Meley, 2006, AMP-activated protein kinase and the regulation of autophagic proteolysis, J Biol Chem, 281, 34870, 10.1074/jbc.M605488200 · DOI · Paper page
  42. Y Matsui, 2007, Distinct roles of autophagy in the heart during ischemia and reperfusion: roles of AMP-activated protein kinase and Beclin 1 in mediating autophagy, Circ Res, 100, 914, 10.1161/01.RES.0000261924.76669.36 · DOI · Paper page
  43. R Viana, 2008, Role of AMP-activated protein kinase in autophagy and proteasome function, Biochem Biophys Res Commun, 369, 964, 10.1016/j.bbrc.2008.02.126 · DOI
  44. AL Wang, 2009, Autophagy, exosomes and drusen formation in age-related macular degeneration, Autophagy, 5, 563, 10.4161/auto.5.4.8163 · DOI
  45. T Ryhänen, 2009, Crosstalk between Hsp70 molecular chaperone, lysosomes and proteasomes in autophagy-mediated proteolysis in human retinal pigment epithelial cells, J Cell Mol Med, 13, 3616, 10.1111/j.1582-4934.2008.00577.x · DOI · Paper page
  46. AL Wang, 2009, Using LC3 to monitor autophagy flux in the retinal pigment epithelium, Autophagy, 5, 1190, 10.4161/auto.5.8.10087 · DOI
  47. T Kurz, 2009, ARPE-19 retinal pigment epithelial cells are highly resistant to oxidative stress and exercise strict control over their lysosomal redox-active iron, Autophagy, 5, 494, 10.4161/auto.5.4.7961 · DOI
  48. TU Krohne, 2010, Lipid peroxidation products reduce lysosomal protease activities in human retinal pigment epithelial cells via two different mechanisms of action, Exp Eye Res, 90, 261, 10.1016/j.exer.2009.10.014 · DOI
  49. K Kaarniranta, 2010, Mechanisms of protein aggregation in the retinal pigment epithelial cells, Front Biosci, 1, 1374, 10.2741/e198 · DOI
  50. FA Shamsi, 2001, Inhibition of RPE lysosomal and antioxidant activity by the age pigment lipofuscin, Invest Ophthalmol Vis Sci, 42, 3041
  51. TU Krohne, 2010, Apical-to-basolateral transcytosis of photoreceptor outer segments induced by lipid peroxidation products in human retinal pigment epithelial cells, Invest Ophthalmol Vis Sci, 51, 553, 10.1167/iovs.09-3755 · DOI
  52. RF Mullins, 2000, Drusen associated with aging and age-related macular degeneration contain proteins common to extracellular deposits associated with atherosclerosis, elastosis, amyloidosis, and dense deposit disease, FASEB J, 14, 835, 10.1096/fasebj.14.7.835 · DOI · Paper page
  53. Y Li, 2008, Alterations of activity and intracellular distribution of the 20S proteasome in ageing retinal pigment epithelial cells, Exp Gerontol, 43, 1114, 10.1016/j.exger.2008.08.052 · DOI
  54. K Kaarniranta, 2013, Autophagy and heterophagy dysregulation leads to retinal pigment epithelium dysfunction and development of age-related macular degeneration, Autophagy, 9, 973, 10.4161/auto.24546 · DOI · Paper page

Cited by

Sorted by citations

See all 145

Metadata

Authors
Viiri, J., Amadio, M., Marchesi, N., Hyttinen, J. M. T., Kivinen, N., Sironen, R., Rilla, K., Akhtar, S., Provenzani, A., D'Agostino, V. G., Govoni, S., Pascale, A., Agostini, H., Petrovski, G., Salminen, A., & Kaarniranta, K.
Venue
PLoS ONE
Published
2013-07-29
Volume
8
Issue
7
Pages
e69563
ISSN
1932-6203
Cited by
145
References
10
Language
en

About these checks

Registry, retraction, Cites and statistics results are computed, not judged, with one exception: a printed reference that no index lists is read once by a model before it counts as a citation error. Claims are extracted by a model and kept only when their quote appears verbatim in the text; each cited source is then checked, with a model’s help, for whether it says what the claim relies on. Those verdicts can be wrong — read the claim’s quote and the cited source before relying on one.

Statistics and arithmetic are recomputed, not judged.

Confidence bands are shown only for fields calibrated on our annotated test set. None is calibrated yet, so no band is shown.

What counts as a claim ›How we measure confidence ›How we check this ›

Are you an author, or do you see a problem with this page? Request a review