

Increased Functional Connectivity between Prefrontal Cortex and Reward System in Pathological Gambling
Open accessThe DOI matches its Crossref record; 71 of the 72 references it cites were found in a registry or an index.
Abstract
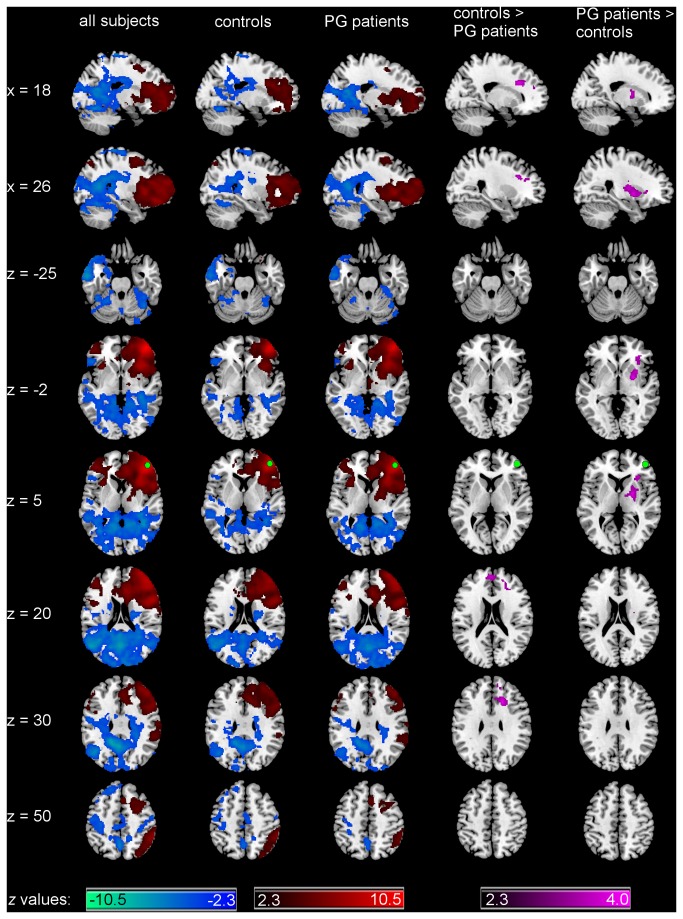
Pathological gambling (PG) shares clinical characteristics with substance-use disorders and is thus discussed as a behavioral addiction. Recent neuroimaging studies on PG report functional changes in prefrontal structures and the mesolimbic reward system. While an imbalance between these structures has been related to addictive behavior, whether their dysfunction in PG is reflected in the interaction between them remains unclear. We addressed this question using functional connectivity resting-state fMRI in male subjects with PG and controls. Seed-based functional connectivity was computed using two regions-of-interest, based on the results of a previous voxel-based morphometry study, located in the prefrontal cortex and the mesolimbic reward system (right middle frontal gyrus and right ventral striatum). PG patients demonstrated increased connectivity from the right middle frontal gyrus to the right striatum as compared to controls, which was also positively correlated with nonplanning aspect of impulsiveness, smoking and craving scores in the PG group. Moreover, PG patients demonstrated decreased connectivity from the right middle frontal gyrus to other prefrontal areas as compared to controls. The right ventral striatum demonstrated increased connectivity to the right superior and middle frontal gyrus and left cerebellum in PG patients as compared to controls. The increased connectivity to the cerebellum was positively correlated with smoking in the PG group. Our results provide further evidence for alterations in functional connectivity in PG with increased connectivity between prefrontal regions and the reward system, similar to connectivity changes reported in substance use disorder.
Overview
The claims and statistics of this paper haven’t been checked yet.
Free: it reads the open-access text and checks the first 5 claims that cite a source we can check. Create a free account to check every claim.
Integrity signals
Registry
Cites
Statistics
Figures



Verification
Claims the paper makes
The claims and statistics of this paper haven’t been checked yet.
Free: it reads the open-access text and checks the first 5 claims that cite a source we can check. Create a free account to check every claim.
Claims other papers make about this one
Each is checked against this paper’s own text: does it say what the citing paper says it does?
The source backs part of the claim, not all of it — or backs it for a different population, condition or comparison.
In the citing paper
“the abnormal functional connections may lead to some cognitive impairment, such as in reward and executive control (58–60)”
From Altered functional connectivity between the cerebellum and the cortico-striato-thalamo-cortical circuit in obsessive-compulsive disorder (2019) · cites this paper as [58]
Experimental — accuracy not yet measured
Self-check
Percentages, sums and reported differences re-computed from the paper’s own numbers.
The self-check needs the paper’s full text.
Citations
Cites
Diagnostic and Statistical Manual of Mental Disorders
Williams, J. B. W., & First, M. (2013) · Encyclopedia of Social Work · doi:10.1093/acrefore/9780199975839.013.104 · Cited by 109,519
The assessment and analysis of handedness: The Edinburgh inventory
Oldfield, R. C. (1971) · Neuropsychologia · doi:10.1016/0028-3932(71)90067-4 · Cited by 35,900
An Integrative Theory of Prefrontal Cortex Function
Miller, E. K., & Cohen, J. D. (2001) · Annual Review of Neuroscience · doi:10.1146/annurev.neuro.24.1.167 · Cited by 12,803 · cited 1×
“prefrontal cortex (PFC) [5].”
Diagnostic and Statistical Manual of Mental Disorders
Siegel, L. J., & Fletcher‐Janzem, E. (2008) · Encyclopedia of Special Education · doi:10.1002/9780470373699.speced0655 · Cited by 8,477
Spontaneous fluctuations in brain activity observed with functional magnetic resonance imaging
Fox, M. D., & Raichle, M. E. (2007) · Nature Reviews Neuroscience · doi:10.1038/nrn2201 · Cited by 6,700
Correspondence of the brain's functional architecture during activation and rest
Smith, S. M., Fox, P. T., Miller, K. L., Glahn, D. C., Fox, P. M., Mackay, C. E., Filippini, N., Watkins, K. E., Toro, R., Laird, A. R., et al. (2009) · Proceedings of the National Academy of Sciences · doi:10.1073/pnas.0905267106 · Cited by 5,150 · cited 1×
“Patterns of intrinsic functional connectivity are correlated with similar patterns to those activated during tasks-related activity [34,35].”
BackgroundInhibition and the right inferior frontal cortex
Aron, A. R., Robbins, T. W., & Poldrack, R. A. (2004) · Trends in Cognitive Sciences · doi:10.1016/j.tics.2004.02.010 · Cited by 3,197
Separate neural systems value immediate and delayed monetary rewards
McClure, S. M., Laibson, D. I., Loewenstein, G., & Cohen, J. D. (2004) · Science · doi:10.1126/science.1100907 · Cited by 3,089 · cited 1×
“regulation [64-67].”
Dysfunction of the prefrontal cortex in addiction: neuroimaging findings and clinical implications
Goldstein, R. Z., & Volkow, N. D. (2011) · Nature Reviews Neuroscience · doi:10.1038/nrn3119 · Cited by 2,749
Decision making, impulse control and loss of willpower to resist drugs: a neurocognitive perspective
Bechara, A. (2005) · Nature Neuroscience · doi:10.1038/nn1584 · Cited by 2,149 · cited 2×
“Taking these alterations into account, an imbalance between prefrontal brain activity and mesolimbic function has been suggested to contribute to addictive behavior [18,19].”
BackgroundNetwork modelling methods for FMRI
Smith, S. M., Miller, K. L., Salimi-Khorshidi, G., Webster, M., Beckmann, C. F., Nichols, T. E., Ramsey, J. D., & Woolrich, M. W. (2011) · NeuroImage · doi:10.1016/j.neuroimage.2010.08.063 · Cited by 1,878
Van Dijk, K. R. A., Hedden, T., Venkataraman, A., Evans, K. C., Lazar, S. W., & Buckner, R. L. (2010) · Journal of Neurophysiology · doi:10.1152/jn.00783.2009 · Cited by 1,844
Introduction to Behavioral Addictions
Grant, J. E., Potenza, M. N., Weinstein, A., & Gorelick, D. A. (2010) · The American Journal of Drug and Alcohol Abuse · doi:10.3109/00952990.2010.491884 · Cited by 1,242
Functional connectivity of human striatum: a resting state FMRI study
Di Martino, A., Scheres, A., Margulies, D. S., Kelly, A. M. C., Uddin, L. Q., Shehzad, Z., Biswal, B., Walters, J. R., Castellanos, F. X., & Milham, M. P. (2008) · Cerebral Cortex · doi:10.1093/cercor/bhn041 · Cited by 1,090
Self-citationGoldapple, K., Segal, Z., Garson, C., Lau, M., Bieling, P., Kennedy, S., & Mayberg, H. (2004) · Archives of General Psychiatry · doi:10.1001/archpsyc.61.1.34 · Cited by 1,068
Cognitive neuroscience of self-regulation failure
Heatherton, T. F., & Wagner, D. D. (2011) · Trends in Cognitive Sciences · doi:10.1016/j.tics.2010.12.005 · Cited by 1,033
Simmonds, D. J., Pekar, J. J., & Mostofsky, S. H. (2008) · Neuropsychologia · doi:10.1016/j.neuropsychologia.2007.07.015 · Cited by 1,015
Saad, Z. S., Gotts, S. J., Murphy, K., Chen, G., Jo, H. J., Martin, A., & Cox, R. W. (2012) · Brain Connectivity · doi:10.1089/brain.2012.0080 · Cited by 859 · cited 1×
“Global signal was not removed as it has recently been shown that this preprocessing step can induce false-positive group differences [56].”
BackgroundPathological gambling is linked to reduced activation of the mesolimbic reward system
Reuter, J., Raedler, T., Rose, M., Hand, I., Gläscher, J., & Büchel, C. (2005) · Nature Neuroscience · doi:10.1038/nn1378 · Cited by 734 · cited 4×
“[27] showed that ventral striatal and ventromedial”
BackgroundInfluentialKnoch, D., Gianotti, L. R. R., Pascual-Leone, A., Treyer, V., Regard, M., Hohmann, M., & Brugger, P. (2006) · Journal of Neuroscience · doi:10.1523/jneurosci.0804-06.2006 · Cited by 517
Resting state functional connectivity in addiction: Lessons learned and a road ahead
Sutherland, M. T., McHugh, M. J., Pariyadath, V., & Stein, E. A. (2012) · NeuroImage · doi:10.1016/j.neuroimage.2012.01.117 · Cited by 494
The neural substrates of reward processing in humans: the modern role of FMRI
McClure, S. M., York, M. K., & Montague, P. R. (2004) · The Neuroscientist · doi:10.1177/1073858404263526 · Cited by 480 · cited 1×
“processing [6].”
Dysfunction of reward processing correlates with alcohol craving in detoxified alcoholics
Wrase, J., Schlagenhauf, F., Kienast, T., Wüstenberg, T., Bermpohl, F., Kahnt, T., Beck, A., Ströhle, A., Juckel, G., Knutson, B., et al. (2007) · NeuroImage · doi:10.1016/j.neuroimage.2006.11.043 · Cited by 479
Self-citationMeta‐analysis of neuroimaging studies of the Wisconsin Card‐Sorting task and component processes
Buchsbaum, B. R., Greer, S., Chang, W., & Berman, K. F. (2005) · Human Brain Mapping · doi:10.1002/hbm.20128 · Cited by 477 · cited 1×
“situated in the right hemisphere [61-63].”
Goudriaan, A. E., Oosterlaan, J., De Beurs, E., & Van Den Brink, W. (2006) · Addiction · doi:10.1111/j.1360-0443.2006.01380.x · Cited by 467 · cited 2×
“Together with the results of imaging and behavioral studies on PG that report diminished ventromedial PFC activity [20,59] and impaired executive function and decision-making [21-24], our finding suggests an alteration in the functional organization of the PFC.”
BackgroundResultVentral striatal activation during reward anticipation correlates with impulsivity in alcoholics
Beck, A., Schlagenhauf, F., Wüstenberg, T., Hein, J., Kienast, T., Kahnt, T., Schmack, K., Hägele, C., Knutson, B., Heinz, A., et al. (2009) · Biological Psychiatry · doi:10.1016/j.biopsych.2009.04.035 · Cited by 461
Self-citationGoudriaan, A. E., Oosterlaan, J., de Beurs, E., & van den Brink, W. (2005) · Cognitive Brain Research · doi:10.1016/j.cogbrainres.2005.01.017 · Cited by 445
Frontal lobe dysfunction in pathological gambling patients
Cavedini, P., Riboldi, G., Keller, R., D’Annucci, A., & Bellodi, L. (2002) · Biological Psychiatry · doi:10.1016/s0006-3223(01)01227-6 · Cited by 418
Heinz, A., Siessmeier, T., Wrase, J., Hermann, D., Klein, S., Grüsser-Sinopoli, S. M., Flor, H., Braus, D. F., Buchholz, H. G., Gründer, G., et al. (2004) · American Journal of Psychiatry · doi:10.1176/ajp.161.10.1783 · Cited by 408 · cited 2×
“An imbalance between prefrontal function and the mesolimbic reward system has been suggested to contribute to addictive behavior [18,19] based on studies in patients reporting altered function of the PFC [10], as well as functional changes in areas of the reward system such as the ventral striatum [11-16].”
BackgroundSelf-citationAn fMRI Stroop Task Study of Ventromedial Prefrontal Cortical Function in Pathological Gamblers
Potenza, M. N., Leung, H.-C., Blumberg, H. P., Peterson, B. S., Fulbright, R. K., Lacadie, C. M., Skudlarski, P., & Gore, J. C. (2003) · American Journal of Psychiatry · doi:10.1176/appi.ajp.160.11.1990 · Cited by 400 · cited 2×
“Together with the results of imaging and behavioral studies on PG that report diminished ventromedial PFC activity [20,59] and impaired executive function and decision-making [21-24], our finding suggests an alteration in the functional organization of the PFC.”
BackgroundResultAlterations in brain structure and functional connectivity in prescription opioid-dependent patients
Upadhyay, J., Maleki, N., Potter, J., Elman, I., Rudrauf, D., Knudsen, J., Wallin, D., Pendse, G., McDonald, L., Griffin, M., et al. (2010) · Brain · doi:10.1093/brain/awq138 · Cited by 393
Cue-Induced Brain Activity in Pathological Gamblers
Crockford, D. N., Goodyear, B., Edwards, J., Quickfall, J., & el-Guebaly, N. (2005) · Biological Psychiatry · doi:10.1016/j.biopsych.2005.04.037 · Cited by 375 · cited 1×
“Moreover, PG patients displayed decreased prefrontal activation when obtaining monetary reward [25-27], and increased dorsolateral prefrontal activation in response to videos and pictures with gambling scenes [28,29], suggesting changes in the processing of reward-indicating stimuli.”
BackgroundAddiction related alteration in resting-state brain connectivity
Ma, N., Liu, Y., Li, N., Wang, C.-X., Zhang, H., Jiang, X.-F., Xu, H.-S., Fu, X.-M., Hu, X., & Zhang, D.-R. (2010) · NeuroImage · doi:10.1016/j.neuroimage.2009.08.037 · Cited by 324
de Ruiter, M. B., Veltman, D. J., Goudriaan, A. E., Oosterlaan, J., Sjoerds, Z., & van den Brink, W. (2009) · Neuropsychopharmacology · doi:10.1038/npp.2008.175 · Cited by 320
Tanabe, J., Thompson, L., Claus, E., Dalwani, M., Hutchison, K., & Banich, M. T. (2007) · Human Brain Mapping · doi:10.1002/hbm.20344 · Cited by 309
Executive function and fluid intelligence after frontal lobe lesions
Roca, M., Parr, A., Thompson, R., Woolgar, A., Torralva, T., Antoun, N., Manes, F., & Duncan, J. (2010) · Brain · doi:10.1093/brain/awp269 · Cited by 308
Balodis, I. M., Kober, H., Worhunsky, P. D., Stevens, M. C., Pearlson, G. D., & Potenza, M. N. (2012) · Biological Psychiatry · doi:10.1016/j.biopsych.2012.01.006 · Cited by 305
Gu, H., Salmeron, B. J., Ross, T. J., Geng, X., Zhan, W., Stein, E. A., & Yang, Y. (2010) · NeuroImage · doi:10.1016/j.neuroimage.2010.06.066 · Cited by 305
David, S. P., Munafò, M. R., Johansen-Berg, H., Smith, S. M., Rogers, R. D., Matthews, P. M., & Walton, R. T. (2005) · Biological Psychiatry · doi:10.1016/j.biopsych.2005.04.028 · Cited by 281
The gambling symptom assessment scale (G-SAS): a reliability and validity study
Kim, S. W., Grant, J. E., Potenza, M. N., Blanco, C., & Hollander, E. (2009) · Psychiatry Research · doi:10.1016/j.psychres.2007.11.008 · Cited by 257 · cited 5×
“We Found Significantly Higher Scores for Gambling Severity (KFG, G-SAS), Craving for Gambling (VAS) and Impulsiveness (BIS-10) in PG Patients as Compared to Controls (Table 1).”
MethodInfluentialReduced Interhemispheric Resting State Functional Connectivity in Cocaine Addiction
Kelly, C., Zuo, X.-N., Gotimer, K., Cox, C. L., Lynch, L., Brock, D., Imperati, D., Garavan, H., Rotrosen, J., Castellanos, F. X., et al. (2011) · Biological Psychiatry · doi:10.1016/j.biopsych.2010.11.022 · Cited by 230
Lower Ventral Striatal Activation During Reward Anticipation in Adolescent Smokers
Peters, J., Bromberg, U., Schneider, S., Brassen, S., Menz, M., Banaschewski, T., Conrod, P. J., Flor, H., Gallinat, J., Garavan, H., et al. (2011) · American Journal of Psychiatry · doi:10.1176/appi.ajp.2010.10071024 · Cited by 218
Self-citationCauda, F., Cavanna, A. E., D'agata, F., Sacco, K., Duca, S., & Geminiani, G. C. (2011) · Journal of Cognitive Neuroscience · doi:10.1162/jocn.2011.21624 · Cited by 210
Resisting the Power of Temptations: The Right Prefrontal Cortex and Self‐Control
KNOCH, D., & FEHR, E. (2007) · Annals of the New York Academy of Sciences · doi:10.1196/annals.1390.004 · Cited by 208
Disruption of Functional Connectivity of the Default-Mode Network in Alcoholism
Chanraud, S., Pitel, A.-L., Pfefferbaum, A., & Sullivan, E. V. (2011) · Cerebral Cortex · doi:10.1093/cercor/bhq297 · Cited by 202
Hypersensitivity to Reward in Problem Gamblers
Hewig, J., Kretschmer, N., Trippe, R. H., Hecht, H., Coles, M. G. H., Holroyd, C. B., & Miltner, W. H. R. (2010) · Biological Psychiatry · doi:10.1016/j.biopsych.2009.11.009 · Cited by 182
Chronic effects of cannabis use on the human reward system: An fMRI study
van Hell, H. H., Vink, M., Ossewaarde, L., Jager, G., Kahn, R. S., & Ramsey, N. F. (2010) · European Neuropsychopharmacology · doi:10.1016/j.euroneuro.2009.11.010 · Cited by 174
Distorted expectancy coding in problem gambling: is the addictive in the anticipation?
van Holst, R. J., Veltman, D. J., Büchel, C., van den Brink, W., & Goudriaan, A. E. (2012) · Biological Psychiatry · doi:10.1016/j.biopsych.2011.12.030 · Cited by 155
Diekhof, E. K., & Gruber, O. (2010) · The Journal of Neuroscience · doi:10.1523/jneurosci.4690-09.2010 · Cited by 151
Jia, Z., Worhunsky, P. D., Carroll, K. M., Rounsaville, B. J., Stevens, M. C., Pearlson, G. D., & Potenza, M. N. (2011) · Biological Psychiatry · doi:10.1016/j.biopsych.2011.05.008 · Cited by 147
The Common Neural Basis of Exerting Self-Control in Multiple Domains
Cohen, J. R., & Lieberman, M. D. (2010) · Self Control in Society, Mind, and Brain · doi:10.1093/acprof:oso/9780195391381.003.0008 · Cited by 147
Functional connectivity of reward processing in the brain
Camara, E. (2008) · Frontiers in Human Neuroscience · doi:10.3389/neuro.09.019.2008 · Cited by 141 · cited 1×
“striatum and medial parts of PFC [7-9].”
Enhanced cue reactivity and fronto-striatal functional connectivity in cocaine use disorders
Wilcox, C. E., Teshiba, T. M., Merideth, F., Ling, J., & Mayer, A. R. (2011) · Drug and Alcohol Dependence · doi:10.1016/j.drugalcdep.2011.01.009 · Cited by 133
Response Inhibition during Cue Reactivity in Problem Gamblers: An fMRI Study
van Holst, R. J., van Holstein, M., van den Brink, W., Veltman, D. J., & Goudriaan, A. E. (2012) · PLoS ONE · doi:10.1371/journal.pone.0030909 · Cited by 131
Higher volume of ventral striatum and right prefrontal cortex in pathological gambling
Koehler, S., Hasselmann, E., Wüstenberg, T., Heinz, A., & Romanczuk‐Seiferth, N. (2013) · Brain Structure and Function · doi:10.1007/s00429-013-0668-6 · Cited by 125
Self-citationChoi, J.-S., Shin, Y.-C., Jung, W. H., Jang, J. H., Kang, D.-H., Choi, C.-H., Choi, S.-W., Lee, J.-Y., Hwang, J. Y., & Kwon, J. S. (2012) · PLoS ONE · doi:10.1371/journal.pone.0045938 · Cited by 122
Reward networks in the brain as captured by connectivity measures
Camara, E. (2009) · Frontiers in Neuroscience · doi:10.3389/neuro.01.034.2009 · Cited by 119
Disrupted Functional Connectivity with Dopaminergic Midbrain in Cocaine Abusers
Tomasi, D., Volkow, N. D., Wang, R., Carrillo, J. H., Maloney, T., Alia-Klein, N., Woicik, P. A., Telang, F., & Goldstein, R. Z. (2010) · PLoS ONE · doi:10.1371/journal.pone.0010815 · Cited by 116
Problem gamblers exhibit reward hypersensitivity in medial frontal cortex during gambling
Oberg, S., Christie, G. J., & Tata, M. S. (2011) · Neuropsychologia · doi:10.1016/j.neuropsychologia.2011.09.037 · Cited by 112
Lateral Prefrontal Cortex Subregions Make Dissociable Contributions during Fluid Reasoning
Hampshire, A., Thompson, R., Duncan, J., & Owen, A. M. (2011) · Cerebral Cortex · doi:10.1093/cercor/bhq085 · Cited by 112
Gray matter deficits and resting-state abnormalities in abstinent heroin-dependent individuals
Yuan, K., Qin, W., Dong, M., Liu, J., Sun, J., Liu, P., Zhang, Y., Wang, W., Wang, Y., Li, Q., et al. (2010) · Neuroscience Letters · doi:10.1016/j.neulet.2010.07.005 · Cited by 103
Effects of beta-amyloid accumulation on neural function during encoding across the adult lifespan
Kennedy, K. M., Rodrigue, K. M., Devous, M. D., Hebrank, A. C., Bischof, G. N., & Park, D. C. (2012) · NeuroImage · doi:10.1016/j.neuroimage.2012.03.077 · Cited by 83
Executive function abnormalities in pathological gamblers
Marazziti, D., Catena Dell'Osso, M., Conversano, C., Consoli, G., Vivarelli, L., Mungai, F., Di Nasso, E., & Golia, F. (2008) · Clinical Practice and Epidemiology in Mental Health · doi:10.1186/1745-0179-4-7 · Cited by 76
Wang, Y., Zhu, J., Li, Q., Li, W., Wu, N., Zheng, Y., Chang, H., Chen, J., & Wang, W. (2013) · PLoS ONE · doi:10.1371/journal.pone.0058098 · Cited by 76
Diekhof, E. K., Nerenberg, L., Falkai, P., Dechent, P., Baudewig, J., & Gruber, O. (2012) · Human Brain Mapping · doi:10.1002/hbm.21398 · Cited by 71
Reduced Fronto‐Cerebellar Functional Connectivity in Chronic Alcoholic Patients
Rogers, B. P., Parks, M. H., Nickel, M. K., Katwal, S. B., & Martin, P. R. (2012) · Alcoholism: Clinical and Experimental Research · doi:10.1111/j.1530-0277.2011.01614.x · Cited by 62
Liu, J., Qin, W., Yuan, K., Li, J., Wang, W., Li, Q., Wang, Y., Sun, J., von Deneen, K. M., Liu, Y., et al. (2011) · PLoS ONE · doi:10.1371/journal.pone.0023098 · Cited by 59
Abnormalities of functional brain networks in pathological gambling: a graph-theoretical approach
Tschernegg, M., Crone, J. S., Eigenberger, T., Schwartenbeck, P., Fauth-Bühler, M., Lemènager, T., Mann, K., Thon, N., Wurst, F. M., & Kronbichler, M. (2013) · Frontiers in Human Neuroscience · doi:10.3389/fnhum.2013.00625 · Cited by 48
Understanding the brain through neuroinformatics
Bjaalie, J. G. (2008) · Frontiers in Neuroscience · doi:10.3389/neuro.01.022.2008 · Cited by 25
[The therapeutic concept of euthymic treatment. The little school of pleasure].
Lutz, R. (2005) · PubMed · Cited by 6
Factor structure of the Barratt impulsiveness scale
Patton, J. H., Stanford, M. S., & Barratt, E. S. (1995) · Journal of Clinical Psychology · doi:10.1002/1097-4679(199511)51:6<768::aid-jclp2270510607>3.0.co;2-1
Research works printed but not linked: 1
- M First, 2001, Structured Clinical Interview for DSM-IV-TR Axis I Disorders, Research Version, Patient Edition with Psychotic Screen (SCID-I/PW/PSYSCREEN)
Cited by
Peters, S. K., Dunlop, K., & Downar, J. (2016) · Frontiers in Systems Neuroscience · doi:10.3389/fnsys.2016.00104 · Cited by 611
“Conversely, gambling addiction has displayed increased PFC connectivity to the striatum; this connectivity was associated with impulsivity, smoking frequency and craving severity (Koehler et al., 2013).”
BackgroundBargeron, A. H., & Hormes, J. M. (2017) · Computers in Human Behavior · doi:10.1016/j.chb.2016.11.029 · Cited by 204
Brand, M., Snagowski, J., Laier, C., & Maderwald, S. (2016) · NeuroImage · doi:10.1016/j.neuroimage.2016.01.033 · Cited by 198
“…Grüsser et al., 2004; Heinz, Beck, Grüsser, Grace, & Wrase, 2008; Ko, Liu, Yen, Chen, et al., 2013; Ko, Liu, Yen, Yen, et al., 2013; Ko et al., 2009; Koehler et al., 2013; Potenza, 2008; Potenza et al., 2013; Potenza et al., 2003; Romanczuk-Seiferth, Koehler, Dreesen, Wüstenberg, & Heinz, 2015).”
Disordered gambling: the evolving concept of behavioral addiction
Clark, L. (2014) · Annals of the New York Academy of Sciences · doi:10.1111/nyas.12558 · Cited by 194
Neuroimaging of reward mechanisms in Gambling disorder: an integrative review
Clark, L., Boileau, I., & Zack, M. H. (2018) · Molecular Psychiatry · doi:10.1038/s41380-018-0230-2 · Cited by 175
Metadata
- Authors
- Koehler, S., Ovadia-Caro, S., van der Meer, E., Villringer, A., Heinz, A., Romanczuk-Seiferth, N., & Margulies, D. S.
- Affiliations
- Humboldt-Universität zu Berlin (DE)
- Max Planck Society (DE)
- Corresponding author
- Koehler, Saskia
- Venue
- PLoS ONE
- Publisher
- Public Library of Science (PLoS)
- Published
- 2013-12-19
- Volume
- 8
- Issue
- 12
- Pages
- e84565
- ISSN
- 1932-6203 (ISSN-L)
- PMC
- PMC3868704
- OpenAlex
- W1968016381
- Cited by
- 86
- References
- 72
- Citations by year
- 2025: 7 · 2024: 7 · 2023: 10 · 2022: 6 · 2021: 3 · 2020: 6 · 2019: 8 · 2018: 9 · 2017: 7 · 2016: 8 · 2015: 9 · 2014: 6
- FWCI
- 8.52
- Type
- journal article
- Language
- en
- Update notices
- correction (2015-07-21)
- Open access
- gold
- doi.org
- Licence
- Locations
- PLoS ONE (publishedVersion, cc-by)
- Europe PMC (PubMed Central) (publishedVersion, cc-by)
- PubMed Central (publishedVersion, cc-by)
- PubMed (publishedVersion)
- DOAJ (DOAJ: Directory of Open Access Journals) (submittedVersion, cc-by-sa)
- Max Planck Digital Library (submittedVersion, other-oa)
- Figshare (submittedVersion, cc-by)
- MPG.PuRe (Max Planck Society) (submittedVersion, other-oa)
- Funders
- Bristol-Myers Squibb
- Eli Lilly and Company
- Minerva Foundation
- Deutsche Forschungsgemeinschaft (HE 2597/4, HE 2597/4-3, EXC257, 01QG87164, 01GQ0411, STE 1430/2-1)
- Bundesministerium für Bildung und Forschung (01QG87164, 01GQ0411, 01GS08152)
- Cilag
- Topics
- Social Sciences › Psychology › Clinical Psychology › Gambling Behavior and Treatments
- Life Sciences › Neuroscience › Cognitive Neuroscience › Functional Brain Connectivity Studies
- Life Sciences › Neuroscience › Cognitive Neuroscience › Neural and Behavioral Psychology Studies
- Keywords
- gambling addiction, functional connectivity, prefrontal cortex, mesolimbic reward system, ventral striatum, middle frontal gyrus, cerebellum, impulsivity, smoking, craving, behavioral addiction, substance use disorders
- MeSH terms
- Adult, Basal Ganglia, Brain Mapping, Gambling, Humans, Magnetic Resonance Imaging, Male, Nerve Net, Psychometrics, Reward, Behavior, Addictive, Prefrontal Cortex, Self Report
About these checks
Registry, retraction, Cites and statistics results are computed, not judged, with one exception: a printed reference that no index lists is read once by a model before it counts as a citation error. Claims are extracted by a model and kept only when their quote appears verbatim in the text; each cited source is then checked, with a model’s help, for whether it says what the claim relies on. Those verdicts can be wrong — read the claim’s quote and the cited source before relying on one.
Statistics and arithmetic are recomputed, not judged.
Confidence bands are shown only for fields calibrated on our annotated test set. None is calibrated yet, so no band is shown.
What counts as a claim ›How we measure confidence ›How we check this ›
Are you an author, or do you see a problem with this page? Request a review
Data sources
Bibliographic data: Semantic Scholar, OpenAlex, Crossref.
Contains information from the Semantic Scholar Academic Graph Datasets, made available under the ODC Attribution License (ODC-BY 1.0).
Semantic Scholar’s data is described in: Kinney, R., et al. (2023). The Semantic Scholar Open Data Platform. arXiv:2301.10140.
