

The DOI matches its Crossref record; 42 of the 42 references it cites were found in a registry or an index.
The Acute Satellite Cell Response and Skeletal Muscle Hypertrophy following Resistance Training
Open accessAbstract
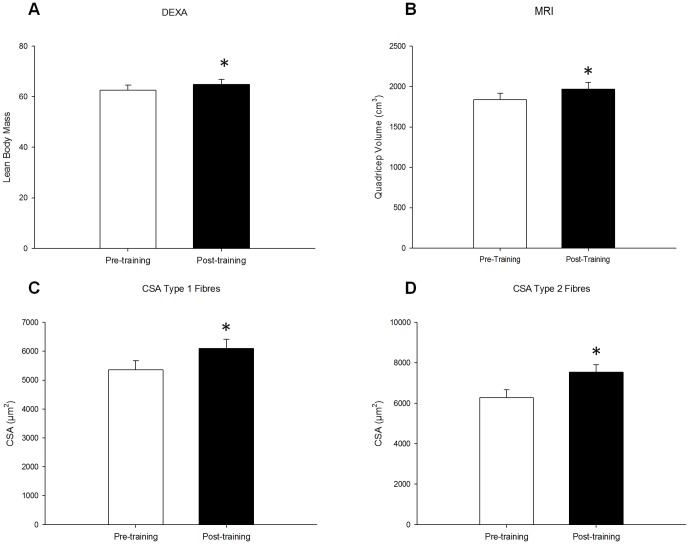
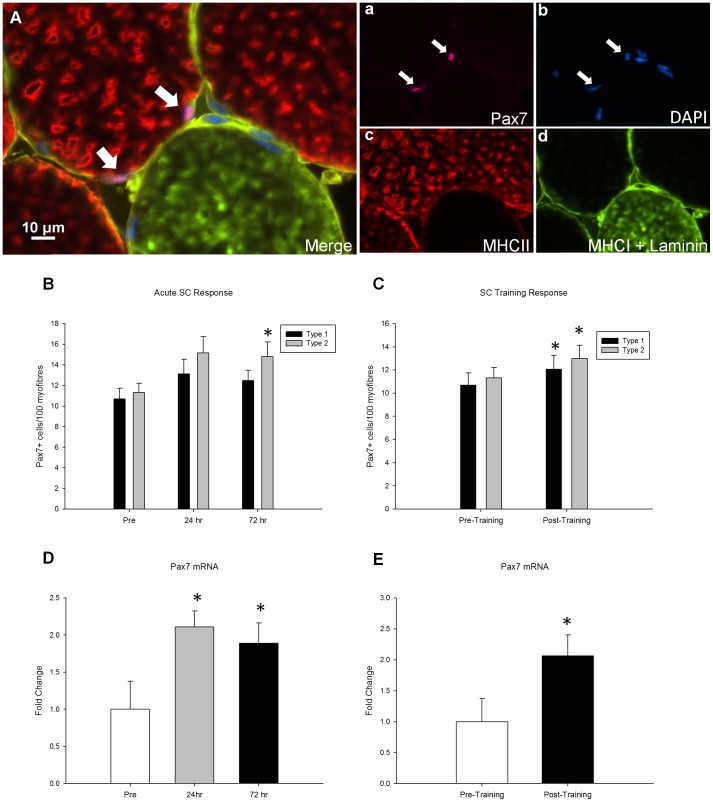
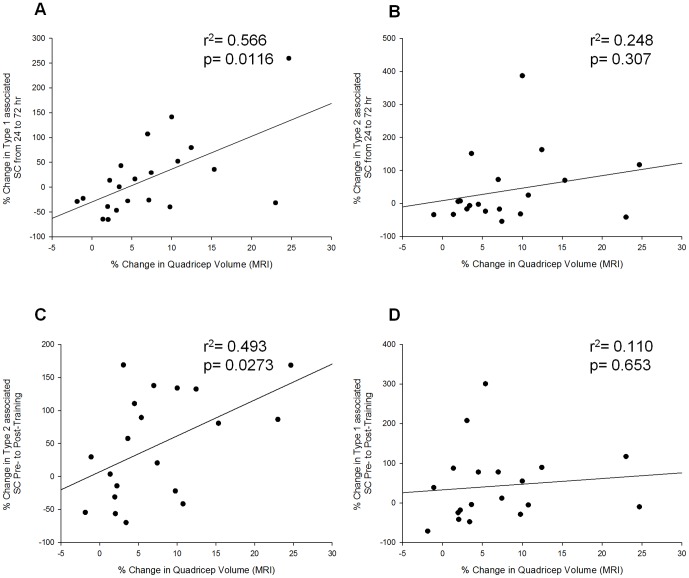
The extent of skeletal muscle hypertrophy in response to resistance training is highly variable in humans. The main objective of this study was to explain the nature of this variability. More specifically, we focused on the myogenic stem cell population, the satellite cell (SC) as a potential mediator of hypertrophy. Twenty-three males (aged 18-35 yrs) participated in 16 wk of progressive, whole body resistance training, resulting in changes of 7.9±1.6% (range of -1.9-24.7%) and 21.0±4.0% (range of -7.0 to 51.7%) in quadriceps volume and myofibre cross-sectional area (CSA), respectively. The SC response to a single bout of resistance exercise (80% 1RM), analyzed via immunofluorescent staining resulted in an expansion of type II fibre associated SC 72 h following exercise (pre: 11.3±0.9; 72 h: 14.8±1.4 SC/type II fibre; p<0.05). Training resulted in an expansion of the SC pool associated with type I (pre: 10.7±1.1; post: 12.1±1.2 SC/type I fibre; p<0.05) and type II fibres (pre: 11.3±0.9; post: 13.0±1.2 SC/type II fibre; p<0.05). Analysis of individual SC responses revealed a correlation between the relative change in type I associated SC 24 to 72 hours following an acute bout of resistance exercise and the percentage increase in quadriceps lean tissue mass assessed by MRI (r2 = 0.566, p = 0.012) and the relative change in type II associated SC following 16 weeks of resistance training and the percentage increase in quadriceps lean tissue mass assessed by MRI (r2 = 0.493, p = 0.027). Our results suggest that the SC response to resistance exercise is related to the extent of muscular hypertrophy induced by training.
Overview
The claims and statistics of this paper haven’t been checked yet.
Run the check — free, no account needed. It reads the open-access text and checks the sources it cites.
Integrity signals
Registry
Cites
Statistics
Figures
Verification
Claims the paper makes
The claims and statistics of this paper haven’t been checked yet.
Run the check — free, no account needed. It reads the open-access text and checks the sources it cites.
Claims other papers make about this one
Each is checked against this paper’s own text: does it say what the citing paper says it does?
The source backs part of the claim, not all of it — or backs it for a different population, condition or comparison.
In the citing paper
“The different exercise modes also appear to generate a fibre type specific satellite cell response which may also increase the complexity in delineating its role in the specificity of adaptation and any incompatibility with concurrent training (Babcock et al., 2012;Joanisse et al., 2013;Bellamy et al., 2014).”
From Concurrent exercise training: do opposites distract? (2017) · cites this paper as Bellamy et al., 2014
Experimental — accuracy not yet measuredThe source backs part of the claim, not all of it — or backs it for a different population, condition or comparison.
In the citing paper
“It should be noted that resistance and aerobic exercise independently have the potential to induce satellite cell responses for skeletal muscle remodelling”
From Concurrent exercise training: do opposites distract? (2017) · cites this paper as Bellamy et al., 2014
Experimental — accuracy not yet measured
Self-check
Percentages, sums and reported differences re-computed from the paper’s own numbers.
The self-check needs the paper’s full text.
Citations
Cites
Satellite Cells and the Muscle Stem Cell Niche
Yin, H., Price, F., & Rudnicki, M. A. (2013) · Physiological Reviews · doi:10.1152/physrev.00043.2011 · Cited by 2,166
Double muscling in cattle due to mutations in the myostatin gene
McPherron, A. C., & Lee, S.-J. (1997) · Proceedings of the National Academy of Sciences · doi:10.1073/pnas.94.23.12457 · Cited by 2,039
Myostatin Inhibits Myoblast Differentiation by Down-regulating MyoD Expression
Langley, B. C., Thomas, M., Bishop, A., Sharma, M., Gilmour, S., & Kambadur, R. (2002) · Journal of Biological Chemistry · doi:10.1074/jbc.m204291200 · Cited by 910
Myostatin negatively regulates satellite cell activation and self-renewal
McCroskery, S., Thomas, M., Maxwell, L., Sharma, M., & Kambadur, R. (2003) · The Journal of Cell Biology · doi:10.1083/jcb.200207056 · Cited by 784
Effective fiber hypertrophy in satellite cell-depleted skeletal muscle
McCarthy, J. J., Mula, J., Miyazaki, M., Erfani, R., Garrison, K., Farooqui, A. B., Srikuea, R., Lawson, B. A., Grimes, B., Keller, C., et al. (2011) · Development · doi:10.1242/dev.068858 · Cited by 616
Petrella, J. K., Kim, J.-S., Mayhew, D. L., Cross, J. M., & Bamman, M. M. (2008) · Journal of Applied Physiology · doi:10.1152/japplphysiol.01215.2007 · Cited by 435 · cited 1×
“exposure to exercise of the same relative intensity [1,2].”
BackgroundJones, S. W., Hill, R. J. W., Krasney, P. A., O'Conner, B., Peirce, N. S., & Greenhaff, P. L. (2004) · The FASEB Journal · doi:10.1096/fj.03-1228fje · Cited by 422
Davidsen, P. K., Gallagher, I. J., Hartman, J. W., Tarnopolsky, M. A., Dela, F., Helge, J. W., Timmons, J. A., & Phillips, S. M. (2011) · Journal of Applied Physiology · doi:10.1152/japplphysiol.00901.2010 · Cited by 385
Self-citationVerdijk, L. B., Gleeson, B. G., Jonkers, R. A. M., Meijer, K., Savelberg, H. H. C. M., Dendale, P., & van Loon, L. J. C. (2009) · The Journals of Gerontology Series A: Biological Sciences and Medical Sciences · doi:10.1093/gerona/gln050 · Cited by 372
Petrella, J. K., Kim, J.-S., Cross, J. M., Kosek, D. J., & Bamman, M. M. (2006) · American Journal of Physiology-Endocrinology and Metabolism · doi:10.1152/ajpendo.00190.2006 · Cited by 356
Cited by
Sorted by citations
Exercise Attenuates the Major Hallmarks of Aging
Garatachea, N., Pareja-Galeano, H., Sanchis-Gomar, F., Santos-Lozano, A., Fiuza-Luces, C., Morán, M., Emanuele, E., Joyner, M. J., & Lucia, A. (2015) · Rejuvenation Research · doi:10.1089/rej.2014.1623 · Cited by 413
Satellite cells in human skeletal muscle plasticity
Snijders, T., Nederveen, J. P., McKay, B. R., Joanisse, S., Verdijk, L. B., van Loon, L. J. C., & Parise, G. (2015) · Frontiers in Physiology · doi:10.3389/fphys.2015.00283 · Cited by 381
Self-citationConcurrent exercise training: do opposites distract?
Coffey, V. G., & Hawley, J. A. (2017) · The Journal of Physiology · doi:10.1113/jp272270 · Cited by 351
Muscle fiber type diversification during exercise and regeneration
Qaisar, R., Bhaskaran, S., & Van Remmen, H. (2016) · Free Radical Biology and Medicine · doi:10.1016/j.freeradbiomed.2016.03.025 · Cited by 283
Damas, F., Libardi, C. A., & Ugrinowitsch, C. (2018) · European Journal of Applied Physiology · doi:10.1007/s00421-017-3792-9 · Cited by 254
Aging Hallmarks: The Benefits of Physical Exercise
Rebelo-Marques, A., De Sousa Lages, A., Andrade, R., Ribeiro, C. F., Mota-Pinto, A., Carrilho, F., & Espregueira-Mendes, J. (2018) · Frontiers in Endocrinology · doi:10.3389/fendo.2018.00258 · Cited by 246
Roberts, M. D., McCarthy, J. J., Hornberger, T. A., Phillips, S. M., Mackey, A. L., Nader, G. A., Boppart, M. D., Kavazis, A. N., Reidy, P. T., Ogasawara, R., et al. (2023) · Physiological Reviews · doi:10.1152/physrev.00039.2022 · Cited by 214
Self-citationRoberts, L. A., Raastad, T., Markworth, J. F., Figueiredo, V. C., Egner, I. M., Shield, A., Cameron‐Smith, D., Coombes, J. S., & Peake, J. M. (2015) · The Journal of Physiology · doi:10.1113/jp270570 · Cited by 218
Haun, C. T., Vann, C. G., Roberts, B. M., Vigotsky, A. D., Schoenfeld, B. J., & Roberts, M. D. (2019) · Frontiers in Physiology · doi:10.3389/fphys.2019.00247 · Cited by 192
Divergent Roles of Inflammation in Skeletal Muscle Recovery From Injury
Howard, E. E., Pasiakos, S. M., Blesso, C. N., Fussell, M. A., & Rodriguez, N. R. (2020) · Frontiers in Physiology · doi:10.3389/fphys.2020.00087 · Cited by 187
McGlory, C., Gorissen, S. H. M., Kamal, M. J., Bahniwal, R., Hector, A. J., Baker, S. K., Chabowski, A., & Phillips, S. M. (2019) · The FASEB Journal · doi:10.1096/fj.201801857rrr · Cited by 162
Self-citationJorgenson, K. W., Phillips, S. M., & Hornberger, T. A. (2020) · Cells · doi:10.3390/cells9071658 · Cited by 155
Self-citationStarring or supporting role? Satellite cells and skeletal muscle fiber size regulation
Murach, K. A., Fry, C. S., Kirby, T. J., Jackson, J. R., Lee, J. D., White, S. H., Dupont-Versteegden, E. E., McCarthy, J. J., & Peterson, C. A. (2018) · Physiology · doi:10.1152/physiol.00019.2017 · Cited by 137
Osteosarcopenic Obesity: Current Knowledge, Revised Identification Criteria and Treatment Principles
Kelly, O. J., Gilman, J. C., Boschiero, D., & Ilich, J. Z. (2019) · Nutrients · doi:10.3390/nu11040747 · Cited by 131
Nederveen, J. P., Joanisse, S., Snijders, T., Ivankovic, V., Baker, S. K., Phillips, S. M., & Parise, G. (2016) · Journal of Cachexia Sarcopenia and Muscle · doi:10.1002/jcsm.12105 · Cited by 126
Self-citationMyonuclear accretion is a determinant of exercise-induced remodeling in skeletal muscle
Goh, Q., Song, T., Petrany, M. J., Cramer, A., Sun, C., Sadayappan, S., Lee, S., & Millay, D. P. (2019) · eLife · doi:10.7554/elife.44876 · Cited by 111
Mechanisms of Blood Flow Restriction: The New Testament
Jessee, M. B., Mattocks, K. T., Buckner, S. L., Dankel, S. J., Mouser, J. G., Abe, T., & Loenneke, J. P. (2018) · Techniques in Orthopaedics · doi:10.1097/bto.0000000000000252 · Cited by 109
Roberts, M. D., Haun, C. T., Mobley, C. B., Mumford, P. W., Romero, M. A., Roberson, P. A., Vann, C. G., & McCarthy, J. J. (2018) · Frontiers in Physiology · doi:10.3389/fphys.2018.00834 · Cited by 107
Murach, K. A., Englund, D. A., Dupont‐Versteegden, E. E., McCarthy, J. J., & Peterson, C. A. (2018) · Frontiers in Physiology · doi:10.3389/fphys.2018.00635 · Cited by 96
Psilander, N., Eftestøl, E., Cumming, K. T., Juvkam, I., Ekblom, M. M., Sunding, K., Wernbom, M., Holmberg, H.-C., Ekblom, B., Bruusgaard, J. C., et al. (2019) · Journal of Applied Physiology · doi:10.1152/japplphysiol.00917.2018 · Cited by 95
Fusion-independent satellite cell communication to muscle fibers during load-induced hypertrophy
Murach, K. A., Vechetti, I. J., Van Pelt, D. W., Crow, S. E., Dungan, C. M., Figueiredo, V. C., Kosmac, K., Fu, X., Richards, C. I., Fry, C. S., et al. (2020) · Function · doi:10.1093/function/zqaa009 · Cited by 94
Joanisse, S., Lim, C., McKendry, J., Mcleod, J. C., Stokes, T., & Phillips, S. M. (2020) · F1000Research · doi:10.12688/f1000research.21588.1 · Cited by 90
Self-citationHector, A. J., McGlory, C., Damas, F., Mazara, N., Baker, S. K., & Phillips, S. M. (2018) · The FASEB Journal · doi:10.1096/fj.201700158rr · Cited by 91
Self-citationD’Souza, R. F., Markworth, J. F., Aasen, K. M. M., Zeng, N., Cameron‐Smith, D., & Mitchell, C. J. (2017) · PLoS ONE · doi:10.1371/journal.pone.0181594 · Cited by 86
Self-citationNederveen, J. P., Joanisse, S., Snijders, T., Thomas, A. C. Q., Kumbhare, D. A., & Parise, G. (2018) · The Journal of Physiology · doi:10.1113/jp275155 · Cited by 81
Self-citationGarg, K., & Boppart, M. D. (2016) · Journal of Applied Physiology · doi:10.1152/japplphysiol.00594.2016 · Cited by 77
Vanin, A. A., Miranda, E. F., Machado, C. D. S. M., de Paiva, P. R. V., Albuquerque‐Pontes, G. M., Casalechi, H. L., de Carvalho, P. D. T. C., & Leal‐Junior, E. C. P. (2016) · Lasers in Medical Science · doi:10.1007/s10103-016-2015-7 · Cited by 79
Oikawa, S. Y., McGlory, C., D'Souza, L. K., Morgan, A. K., Saddler, N. I., Baker, S. K., Parise, G., & Phillips, S. M. (2018) · The American Journal of Clinical Nutrition · doi:10.1093/ajcn/nqy193 · Cited by 76
Self-citationContribution of muscle satellite cells to sarcopenia
Huo, F., Liu, Q., & Liu, H. (2022) · Frontiers in Physiology · doi:10.3389/fphys.2022.892749 · Cited by 74
Karlsen, A., Soendenbroe, C., Malmgaard‐Clausen, N. M., Wagener, F., Moeller, C. E., Senhaji, Z., Damberg, K., Andersen, J. L., Schjerling, P., Kjær, M., et al. (2020) · The FASEB Journal · doi:10.1096/fj.202000196r · Cited by 73
Karlsen, A., Bechshøft, R. L., Malmgaard‐Clausen, N. M., Andersen, J. L., Schjerling, P., Kjær, M., & Mackey, A. L. (2019) · Acta Physiologica · doi:10.1111/apha.13271 · Cited by 73
Snijders, T., Smeets, J. S. J., van Kranenburg, J. M. X., Kies, A. K., van Loon, L. J. C., & Verdijk, L. B. (2015) · Acta Physiologica · doi:10.1111/apha.12609 · Cited by 67
Muscle Fiber Hypertrophy and Myonuclei Addition: A Systematic Review and Meta-analysis
Conceição, M. S., VECHIN, F. C., Lixandrão, M. E., Damas, F., Libardi, C. A., Tricoli, V., Roschel, H., CAMERA, D. M., & Ugrinowitsch, C. (2018) · Medicine & Science in Sports & Exercise · doi:10.1249/mss.0000000000001593 · Cited by 60
Lactate Stimulates a Potential for Hypertrophy and Regeneration of Mouse Skeletal Muscle
Ohno, Y., Ando, K., Ito, T., Suda, Y., Matsui, Y., Oyama, A., Kaneko, H., Yokoyama, S., Egawa, T., & Goto, K. (2019) · Nutrients · doi:10.3390/nu11040869 · Cited by 67
Tendon tissue microdamage and the limits of intrinsic repair
Stauber, T., Blache, U., & Snedeker, J. G. (2019) · Matrix Biology · doi:10.1016/j.matbio.2019.07.008 · Cited by 67
Altered muscle satellite cell activation following 16 wk of resistance training in young men
Nederveen, J. P., Snijders, T., Joanisse, S., Wavell, C. G., Mitchell, C. J., Johnston, L. M., Baker, S. K., Phillips, S. M., & Parise, G. (2016) · American Journal of Physiology-Regulatory, Integrative and Comparative Physiology · doi:10.1152/ajpregu.00221.2016 · Cited by 65
Self-citationHaun, C. T., Vann, C. G., Mobley, C. B., Osburn, S. C., Mumford, P. W., Roberson, P. A., Romero, M. A., Fox, C. D., Parry, H. A., Kavazis, A. N., et al. (2019) · Frontiers in Physiology · doi:10.3389/fphys.2019.00297 · Cited by 60
Lavin, K. M., Coen, P. M., Baptista, L. C. P., Bell, M. B., Drummer, D. J., Harper, S. A., Lixandrão, M. E., McAdam, J. S., O’Bryan, S. M., Ramos, S. V., et al. (2022) · Comprehensive physiology · doi:10.1002/cphy.c200033 · Cited by 78
The Myotendinous Junction—A Vulnerable Companion in Sports. A Narrative Review
Jakobsen, J., & Krogsgaard, M. (2021) · Frontiers in Physiology · doi:10.3389/fphys.2021.635561 · Cited by 45
Bjørnsen, T., Wernbom, M., Løvstad, A., Paulsen, G., D’Souza, R. F., Cameron-Smith, D., Flesche, A., Hisdal, J., Berntsen, S., & Raastad, T. (2019) · Journal of Applied Physiology · doi:10.1152/japplphysiol.00397.2018 · Cited by 59
Relationship Between Muscle Swelling and Hypertrophy Induced by Resistance Training
Hirono, T., Ikezoe, T., Taniguchi, M., Tanaka, H., Saeki, J., Yagi, M., Umehara, J., & Ichihashi, N. (2020) · The Journal of Strength and Conditioning Research · doi:10.1519/jsc.0000000000003478 · Cited by 68
CURRENT CONCEPTS OF MUSCLE AND TENDON ADAPTATION TO STRENGTH AND CONDITIONING.
Brumitt, J., & Cuddeford, T. J. (2015) · PubMed Central · Cited by 60
Muscles adaptation to aging and training: architectural changes – a randomised trial
Létocart, A., Mabesoone, F., Charleux, F., Couppé, C., Svensson, R. B., Marin, F., Magnusson, S. P., & Grosset, J.-F. (2021) · BMC Geriatrics · doi:10.1186/s12877-020-02000-0 · Cited by 60
MicroRNAs in Muscle: Characterizing the Powerlifter Phenotype
D’Souza, R. F., Bjørnsen, T., Zeng, N., Aasen, K. M. M., Raastad, T., Cameron‐Smith, D., & Mitchell, C. J. (2017) · Frontiers in Physiology · doi:10.3389/fphys.2017.00383 · Cited by 55
Self-citationDamas, F., Libardi, C. A., Ugrinowitsch, C., VECHIN, F. C., Lixandrão, M. E., Snijders, T., Nederveen, J. P., Bacurau, A. V. N., Brum, P. C., Tricoli, V., et al. (2018) · PLoS ONE · doi:10.1371/journal.pone.0191039 · Cited by 54
Self-citationThe role of the neural stimulus in regulating skeletal muscle hypertrophy
Alix‐Fages, C., Vecchio, A. D., Baz-Valle, E., Santos‐Concejero, J., & Balsalobre‐Fernández, C. (2022) · European Journal of Applied Physiology · doi:10.1007/s00421-022-04906-6 · Cited by 54
Sharples, A. P., & Turner, D. C. (2023) · American Journal of Physiology-Cell Physiology · doi:10.1152/ajpcell.00099.2023 · Cited by 57
The effect of exercise mode on the acute response of satellite cells in old men
Nederveen, J. P., Joanisse, S., Séguin, C., Bell, K. E., Baker, S. K., Phillips, S. M., & Parise, G. (2015) · Acta Physiologica · doi:10.1111/apha.12601 · Cited by 52
Self-citationDamas, F., Ugrinowitsch, C., Libardi, C. A., Jannig, P. R., Hector, A. J., McGlory, C., Lixandrão, M. E., VECHIN, F. C., Montenegro, H., Tricoli, V., et al. (2018) · European Journal of Applied Physiology · doi:10.1007/s00421-018-3984-y · Cited by 51
Self-citationBoppart, M. D., Lisio, M. D., & Witkowski, S. (2015) · Progress in molecular biology and translational science · doi:10.1016/bs.pmbts.2015.07.005 · Cited by 52
Sawan, S. A., Hodson, N. W., Babits, P., Malowany, J. M., Kumbhare, D. A., & Moore, D. R. (2021) · Journal of Applied Physiology · doi:10.1152/japplphysiol.00424.2021 · Cited by 50
Influence of sex and fiber type on the satellite cell pool in human skeletal muscle
Horwath, O., Moberg, M., Larsen, F. J., Philp, A., Apró, W., & Ekblom, B. T. (2020) · Scandinavian Journal of Medicine and Science in Sports · doi:10.1111/sms.13848 · Cited by 44
Cornish, S. M., Bugera, E. M., Duhamel, T. A., Peeler, J. D., & Anderson, J. E. (2020) · European Journal of Applied Physiology · doi:10.1007/s00421-020-04337-1 · Cited by 43
Protein Supplementation Does Not Affect Myogenic Adaptations to Resistance Training
Reidy, P. T., Fry, C. S., Igbinigie, S. N., Deer, R., Jennings, K., Cope, M. B., Mukherjea, R., Volpi, E., & Rasmussen, B. B. (2017) · Medicine & Science in Sports & Exercise · doi:10.1249/mss.0000000000001224 · Cited by 44
Early myogenic responses to acute exercise before and after resistance training in young men
Caldow, M. K., Thomas, E. E., Dale, M. J., Tomkinson, G. R., Buckley, J. D., & Cameron‐Smith, D. (2015) · Physiological Reports · doi:10.14814/phy2.12511 · Cited by 38
Protein Availability and Satellite Cell Dynamics in Skeletal Muscle
Shamim, B., Hawley, J. A., & CAMERA, D. M. (2018) · Sports Medicine · doi:10.1007/s40279-018-0883-7 · Cited by 42
Shi, J., Yang, Y., Zhang, J., Feng, Y., & Shao, B. (2016) · Ecotoxicology and Environmental Safety · doi:10.1016/j.ecoenv.2016.05.025 · Cited by 32
Potential Roles of Vascular Endothelial Growth Factor During Skeletal Muscle Hypertrophy
Huey, K. A. (2018) · Exercise and Sport Sciences Reviews · doi:10.1249/jes.0000000000000152 · Cited by 32
Conceição, M. S., & Ugrinowitsch, C. (2019) · Journal of Cachexia Sarcopenia and Muscle · doi:10.1002/jcsm.12397 · Cited by 32
Murach, K. A., Walton, R. G., Fry, C. S., Michaelis, S. L., Groshong, J. S., Finlin, B. S., Kern, P. A., & Peterson, C. A. (2016) · Physiological Reports · doi:10.14814/phy2.12973 · Cited by 30
Heisterberg, M. F., Andersen, J. L., Schjerling, P., Lund, A., Dalskov, S., Jønsson, A. O., Warming, N., Fogelstrøm, M., Kjær, M., & Mackey, A. L. (2018) · Journal of Applied Physiology · doi:10.1152/japplphysiol.00106.2018 · Cited by 30
Thomas, A. C. Q., Brown, A., Hatt, A. A., Manta, K., Costa‐Parke, A., Kamal, M. J., Joanisse, S., McGlory, C., Phillips, S. M., Kumbhare, D. A., et al. (2022) · The FASEB Journal · doi:10.1096/fj.202200398rr · Cited by 29
Self-citationVanin, A. A., Miranda, E. F., Machado, C. D. S. M., de Paiva, P. R. V., Albuquerque‐Pontes, G. M., Casalechi, H. L., de Carvalho, P. D. T. C., & Leal‐Junior, E. C. P. (2016) · Lasers in Medical Science · doi:10.1007/s10103-016-2121-6 · Cited by 29
The Impact of Aerobic Exercise on the Muscle Stem Cell Response
Joanisse, S., Snijders, T., Nederveen, J. P., & Parise, G. (2018) · Exercise and Sport Sciences Reviews · doi:10.1249/jes.0000000000000153 · Cited by 28
Self-citationPugh, J. K., Faulkner, S. H., Turner, M. C., & Nimmo, M. A. (2018) · European Journal of Applied Physiology · doi:10.1007/s00421-017-3721-y · Cited by 27
Monocyte Recruitment after High-Intensity and High-Volume Resistance Exercise
Wells, A. J., Hoffman, J. R., Jajtner, A. R., Varanoske, A. N., Church, D. D., Gonzalez, A. M., Townsend, J. R., Boone, C. H., Baker, K. M., Beyer, K. S., et al. (2016) · Medicine & Science in Sports & Exercise · doi:10.1249/mss.0000000000000878 · Cited by 27
Guilherme, J. P. L. F., Semenova, E. A., Borisov, O., Kostryukova, E., Vepkhvadze, T. F., Lysenko, E. A., Andryushchenko, O. N., Andryushchenko, L. B., Lednev, E. M., Larin, A. K., et al. (2020) · The Journal of Strength and Conditioning Research · doi:10.1519/jsc.0000000000003756 · Cited by 29
Ato, S., Kido, K., Sato, K., & Fujita, S. (2019) · Experimental Physiology · doi:10.1113/ep087585 · Cited by 26
Efficacy of a new strength training design: the 3/7 method
Stragier, S., Baudry, S., Carpentier, A., & Duchateau, J. (2019) · European Journal of Applied Physiology · doi:10.1007/s00421-019-04099-5 · Cited by 27
Bang, H. S., Seo, D. Y., Chung, Y. M., Kim, D. H., Lee, S., Lee, S. R., Kwak, H., Kim, T. N., Kim, M., Oh, K.-M., et al. (2017) · Korean Journal of Physiology and Pharmacology · doi:10.4196/kjpp.2017.21.6.651 · Cited by 21
Satellite cell function, intramuscular inflammation and exercise in chronic kidney disease
O’Sullivan, T. F., Smith, A. C., & Watson, E. L. (2018) · Clinical Kidney Journal · doi:10.1093/ckj/sfy052 · Cited by 22
Pax7+ Satellite Cells in Human Skeletal Muscle After Exercise: A Systematic Review and Meta-analysis
Dewi, L., Lin, Y., Nicholls, A., Condello, G., Huang, C., & Kuo, C. (2022) · Sports Medicine · doi:10.1007/s40279-022-01767-z · Cited by 21
Reidy, P. T., Fry, C. S., Dickinson, J. M., Drummond, M. J., & Rasmussen, B. B. (2017) · Physiological Reports · doi:10.14814/phy2.13269 · Cited by 18
Nederveen, J. P., Fortino, S. A., Baker, J. M., Snijders, T., Joanisse, S., McGlory, C., McKay, B. R., Kumbhare, D. A., & Parise, G. (2019) · Journal of Applied Physiology · doi:10.1152/japplphysiol.01123.2018 · Cited by 21
Self-citationEarly accentuated muscle hypertrophy is strongly associated with myonuclear accretion
Lundberg, T. R., Martínez-Aranda, L. M., Sanz, G., Hansson, B., von Walden, F., Tesch, P. A., & Fernandez‐Gonzalo, R. (2020) · American Journal of Physiology-Regulatory, Integrative and Comparative Physiology · doi:10.1152/ajpregu.00061.2020 · Cited by 19
Filippo, C. D., Trotta, M. C., Maisto, R., Siniscalco, D., Luongo, M., Mascolo, L., Alfano, R., Accardo, M., Rossi, C., Ferraraccio, F., et al. (2015) · Oxidative Medicine and Cellular Longevity · doi:10.1155/2015/190640 · Cited by 19
Mitchell, C. J., D'Souza, R. F., Figueiredo, V. C., Chan, A., Aasen, K., Durainayagam, B., Mitchell, S., Sinclair, A. J., Egner, I. M., Raastad, T., et al. (2018) · Journal of Applied Physiology · doi:10.1152/japplphysiol.01100.2017 · Cited by 18
Self-citationMoesgaard, L., Jessen, S., Mackey, A. L., & Hostrup, M. (2022) · Journal of Applied Physiology · doi:10.1152/japplphysiol.00235.2022 · Cited by 17
Skeletal Muscle Loading Changes its Regenerative Capacity
Teixeira, E., & Duarte, J. A. (2016) · Sports Medicine · doi:10.1007/s40279-015-0462-0 · Cited by 19
Muscle stem cell dysfunction impairs muscle regeneration in a mouse model of Down syndrome
Pawlikowski, B. T., Betta, N. D., Elston, T. L., Williams, D. A., & Olwin, B. B. (2018) · Scientific Reports · doi:10.1038/s41598-018-22342-5 · Cited by 17
One bout of vibration exercise with vascular occlusion activates satellite cells
Aguayo, D., Mueller, S. M., Boutellier, U., Auer, M., Jung, H. H., Flück, M., & Toigo, M. (2015) · Experimental Physiology · doi:10.1113/ep085330 · Cited by 16
Beaudry, K. M., Binet, E. R., Collao, N., & Lisio, M. D. (2022) · Frontiers in Physiology · doi:10.3389/fphys.2022.915390 · Cited by 16
Cytokine Mediated Control of Muscle Stem Cell Function
Joanisse, S., & Parise, G. (2016) · Advances in experimental medicine and biology · doi:10.1007/978-3-319-27511-6_2 · Cited by 17
Self-citationSon, J. S., Kim, J. H., Kim, H.-J., Yoon, D. H., Kim, J., Song, H. S., & Song, W. J. (2015) · Muscle & Nerve · doi:10.1002/mus.24940 · Cited by 16
Healthy skeletal muscle aging: The role of satellite cells, somatic mutations and exercise
Franco, I., Fernandez‐Gonzalo, R., Vrtačnik, P., Lundberg, T. R., Eriksson, M., & Gustafsson, T. P. (2019) · International review of cytology · doi:10.1016/bs.ircmb.2019.03.003 · Cited by 18
Effects of physical exercise on the prevention of stem cells senescence
Valenti, M. T., Carbonare, L. D., Dorelli, G., & Mottes, M. (2019) · Stem Cell Reviews and Reports · doi:10.1007/s12015-019-09928-w · Cited by 15
Hansen, S. K., Ratzer, J., Nielsen, J. L., Suetta, C., Karlsen, A., Kvorning, T., Frandsen, U., & Aagaard, P. (2020) · Journal of Applied Physiology · doi:10.1152/japplphysiol.00015.2020 · Cited by 15
Burd, N. A., Beals, J. W., van Vliet, S., & van Loon, L. J. C. (2015) · Journal of Applied Physiology · doi:10.1152/japplphysiol.01069.2014 · Cited by 14
Telles, G. D., Libardi, C. A., Conceição, M. S., VECHIN, F. C., Lixandrão, M. E., Mangone, F. R., Pavanelli, A. C., Nagai, M. A., CAMERA, D. M., Hawley, J. A., et al. (2022) · Medicine & Science in Sports & Exercise · doi:10.1249/mss.0000000000003049 · Cited by 14
Binet, E. R., McKenna, C. F., Salvador, A. F., Martinez, I. G., Alamilla, R. A., Collao, N., Bodnariuc, G., Khan, N. A., Paluska, S. A., Burd, N. A., et al. (2022) · Journal of Applied Physiology · doi:10.1152/japplphysiol.00274.2022 · Cited by 15
Effect of Losartan on the Acute Response of Human Elderly Skeletal Muscle to Exercise
Heisterberg, M. F., Andersen, J. L., Schjerling, P., Bülow, J., Lauersen, J. B., Roeber, H. L., Kjær, M., & Mackey, A. L. (2017) · Medicine & Science in Sports & Exercise · doi:10.1249/mss.0000000000001438 · Cited by 15
Hosseini, S. R. A., Moienneia, N., & Rad, M. M. (2017) · Obesity Medicine · doi:10.1016/j.obmed.2017.01.004 · Cited by 14
HEMA 3 Staining: A Simple Alternative for the Assessment of Myoblast Differentiation
Levitt, D. E., Adler, K. A., & Simon, L. (2019) · Current Protocols in Stem Cell Biology · doi:10.1002/cpsc.101 · Cited by 13
Myogenic marker expression as a function of age and exercise-based therapy in the tongue
Kletzien, H., Kelm‐Nelson, C. A., Wang, S. M., Suzuki, M., & Connor, N. P. (2020) · Experimental Gerontology · doi:10.1016/j.exger.2020.111104 · Cited by 12
Schaaf, G., Canibano‐Fraile, R., van Gestel, T. J. M., van der Ploeg, A. T., & Pijnappel, W. W. M. P. (2019) · Annals of Translational Medicine · doi:10.21037/atm.2019.04.48 · Cited by 14
Pavis, G. F., Jameson, T. S. O., Blackwell, J. R., Fulford, J., Abdelrahman, D. R., Murton, A. J., Alamdari, N., Mikus, C. R., Wall, B. T., & Stephens, F. B. (2022) · American Journal of Physiology-Endocrinology and Metabolism · doi:10.1152/ajpendo.00328.2021 · Cited by 13
Mitchell, C. J., Churchward‐Venne, T. A., Cameron‐Smith, D., & Phillips, S. M. (2015) · Journal of Applied Physiology · doi:10.1152/japplphysiol.01056.2014 · Cited by 11
Self-citationMcKay, J., Nasb, M., & Hafsi, K. (2021) · International Orthopaedics · doi:10.1007/s00264-021-05253-5 · Cited by 10
Sorensen, J. R., Fuqua, J. D., Deyhle, M. R., Parmley, J., Skousen, C., Hancock, C. R., Parcell, A. C., & Hyldahl, R. D. (2018) · PLoS ONE · doi:10.1371/journal.pone.0198611 · Cited by 10
Skeletal muscle hypertrophy: molecular and applied aspects of exercise physiology
Arantes, V. H. F., da Silva, D. P., Alvarenga, R., Terra, A., Koch, A. J., Machado, M., & Pompeu, F. A. M. S. (2020) · German Journal of Exercise and Sport Research · doi:10.1007/s12662-020-00652-z · Cited by 12
Metadata
- Authors
- Bellamy, L. M., Joanisse, S., Grubb, A., Mitchell, C. J., McKay, B. R., Phillips, S. M., Baker, S., & Parise, G.
- Affiliations
- McMaster University (CA)
- Corresponding author
- Parise, Gianni
- ORCID
- Venue
- PLoS ONE
- Publisher
- Public Library of Science (PLoS)
- Published
- 2014-10-14
- Volume
- 9
- Issue
- 10
- Pages
- e109739
- ISSN
- 1932-6203 (ISSN-L)
- PMC
- PMC4196938
- OpenAlex
- W1984074879
- Cited by
- 149
- References
- 42
- Citations by year
- 2026: 2 · 2025: 7 · 2024: 6 · 2023: 5 · 2022: 14 · 2021: 10 · 2020: 16 · 2019: 19 · 2018: 20 · 2017: 15 · 2016: 16 · 2015: 16 · 2014: 3
- FWCI
- 6.84
- Type
- journal article
- Language
- en
- Open access
- gold
- doi.org
- Locations
- PLoS ONE (publishedVersion, cc-by)
- PubMed Central (publishedVersion, cc-by)
- PubMed (publishedVersion)
- e-space (Manchester Metropolitan University) (acceptedVersion)
- DOAJ (DOAJ: Directory of Open Access Journals) (submittedVersion, cc-by-sa)
- Figshare (submittedVersion, cc-by)
- ResearchSpace (University of Auckland) (submittedVersion, cc-by)
- Topics
- Life Sciences › Biochemistry, Genetics and Molecular Biology › Molecular Biology › Muscle Physiology and Disorders
- Health Sciences › Nursing › Nutrition and Dietetics › Muscle metabolism and nutrition
- Health Sciences › Medicine › Physiology (medical) › Exercise and Physiological Responses
- Keywords
- satellite cells, skeletal muscle hypertrophy, resistance training, myogenic stem cells, muscle fiber cross-sectional area, type I muscle fibers, fast-twitch muscle, quadriceps, lean body mass
- MeSH terms
- Adolescent, Adult, Cell Cycle, Humans, Hypertrophy, Male, Muscle, Skeletal, Muscle Fibers, Slow-Twitch, Satellite Cells, Skeletal Muscle, Cell Proliferation, PAX7 Transcription Factor, Resistance Training, Myostatin, Young Adult
About these checks
Registry, retraction, Cites and statistics results are computed, not judged, with one exception: a printed reference that no index lists is read once by a model before it counts as a citation error. Claims are extracted by a model and kept only when their quote appears verbatim in the text; each cited source is then checked, with a model’s help, for whether it says what the claim relies on. Those verdicts can be wrong — read the claim’s quote and the cited source before relying on one.
Statistics and arithmetic are recomputed, not judged.
Confidence bands are shown only for fields calibrated on our annotated test set. None is calibrated yet, so no band is shown.
What counts as a claim ›How we measure confidence ›How we check this ›
Are you an author, or do you see a problem with this page? Request a review
