

The DOI matches its Crossref record; 41 of the 41 references it cites were found in a registry or an index.
Fecal Microbiota in Healthy Subjects Following Omnivore, Vegetarian and Vegan Diets: Culturable Populations and rRNA DGGE Profiling
Open accessAbstract
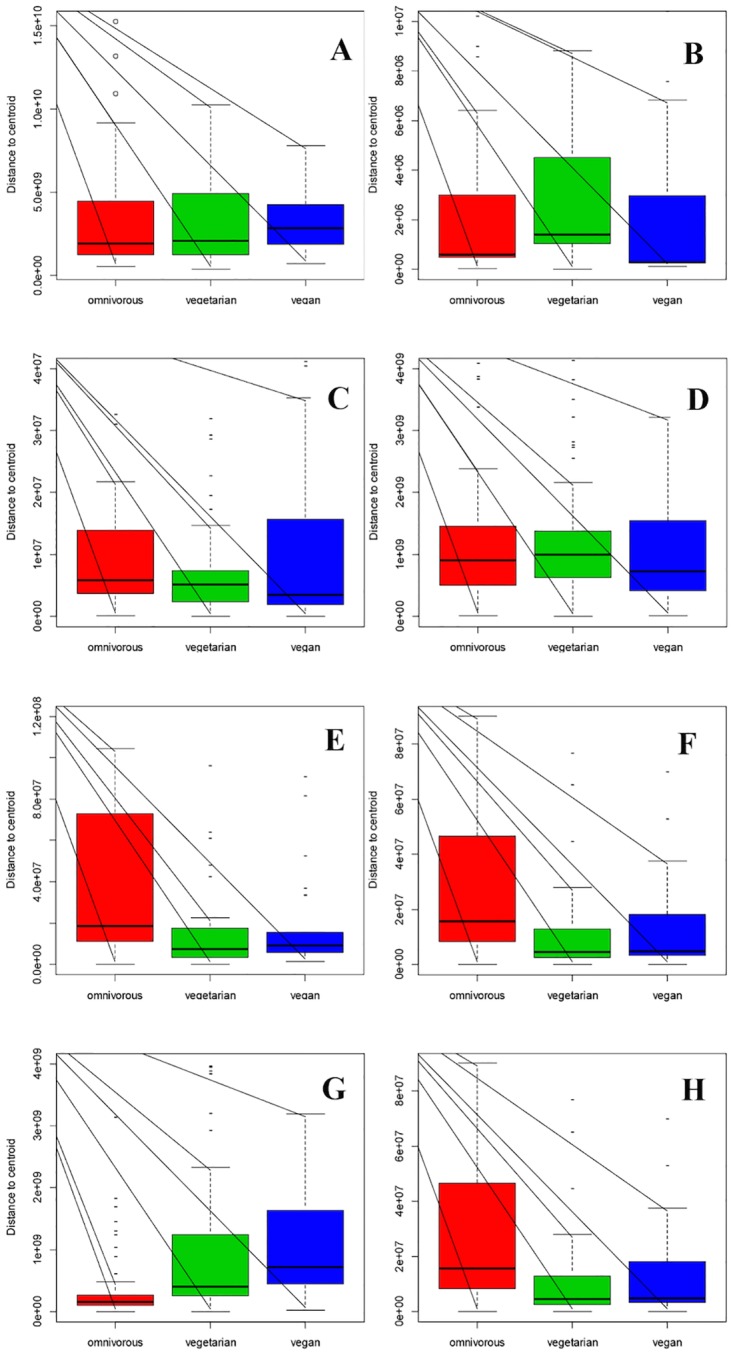
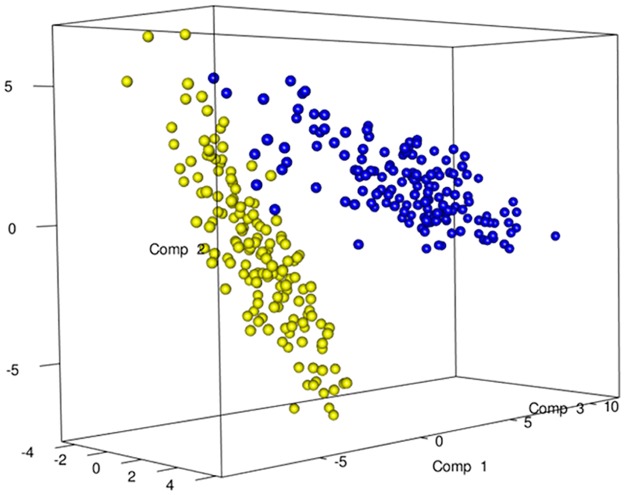
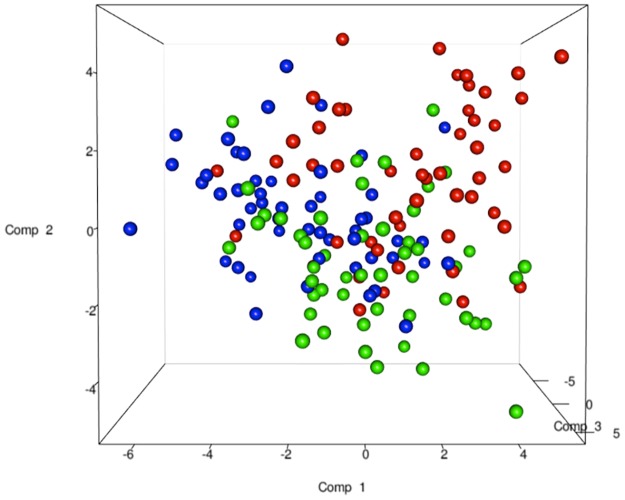
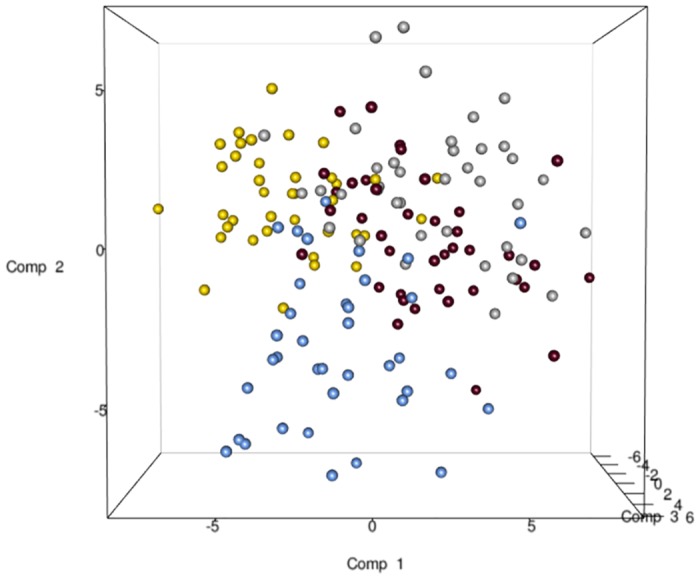
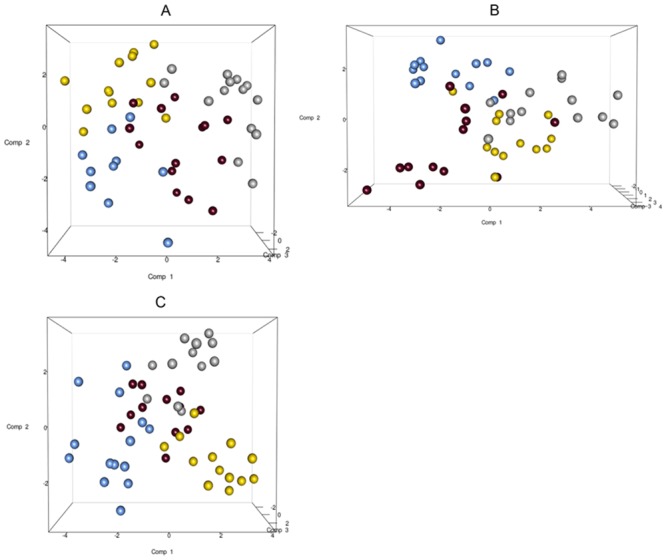
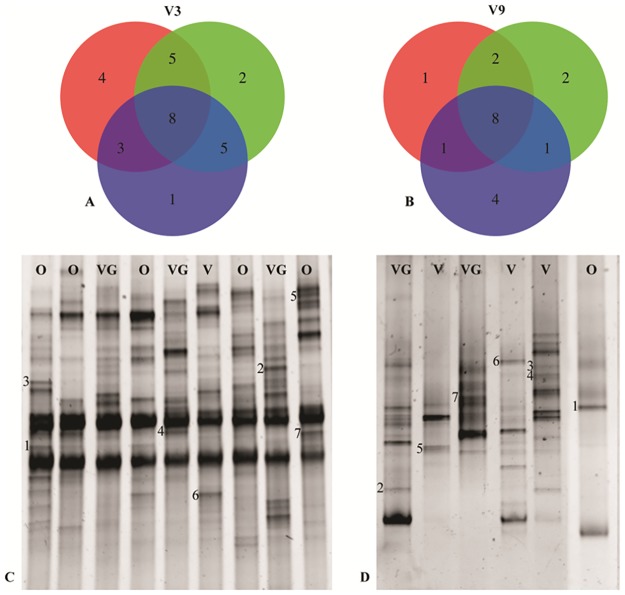
In this study, the fecal microbiota of 153 healthy volunteers, recruited from four different locations in Italy, has been studied by coupling viable counts, on different microbiological media, with ribosomal RNA Denaturing Gradient Gel Electrophoresis (rRNA-DGGE). The volunteers followed three different diets, namely omnivore, ovo-lacto-vegetarian and vegan. The results obtained from culture-dependent and -independent methods have underlined a high level of similarity of the viable fecal microbiota for the three investigated diets. The rRNA DGGE profiles were very complex and comprised a total number of bands that varied from 67 to 64 for the V3 and V9 regions of the 16S rRNA gene, respectively. Only a few bands were specific in/of all three diets, and the presence of common taxa associated with the dietary habits was found. As far as the viable counts are concerned, the high similarity of the fecal microbiota was once again confirmed, with only a few of the investigated groups showing significant differences. Interestingly, the samples grouped differently, according to the recruitment site, thus highlighting a higher impact of the food consumed by the volunteers in the specific geographical locations than that of the type of diet. Lastly, it should be mentioned that the fecal microbiota DGGE profiles obtained from the DNA were clearly separated from those produced using RNA, thus underlining a difference between the total and viable populations in the fecal samples.
Overview
The claims and statistics of this paper haven’t been checked yet.
Run the check — free, no account needed. It reads the open-access text and checks the sources it cites.
Integrity signals
Registry
Cites
Statistics
Figures
Verification
Claims the paper makes
The claims and statistics of this paper haven’t been checked yet.
Run the check — free, no account needed. It reads the open-access text and checks the sources it cites.
Claims other papers make about this one
Each is checked against this paper’s own text: does it say what the citing paper says it does?
In the citing paper
“While the amounts of Bacteroides and Firmicutes associated with vegan, vegetarian and omnivore diets from these studies and others [137, 138] are conflicting, it can be concluded that eating vegetables, fiber and/or resistant starch along with animal protein seems to diminish the negative effects of the potentially harmful byproducts from amino acids fermented by the gut microbiota.”
From Exercise-induced stress behavior, gut-microbiota-brain axis and diet: a systematic review for athletes (2016) · cites this paper as [138]
Self-check
Percentages, sums and reported differences re-computed from the paper’s own numbers.
The self-check needs the paper’s full text.
Citations
Cites
PAST: PALEONTOLOGICAL STATISTICAL SOFTWARE PACKAGE FOR EDUCATION AND DATA ANALYSIS
Hammer, Ø., Harper, D. A. T., & Ryan, P. D. (2001) · Palaeontologia Electronica · Cited by 17,871
Muyzer, G., de Waal, E. C., & Uitterlinden, A. G. (1993) · Applied and Environmental Microbiology · doi:10.1128/aem.59.3.695-700.1993 · Cited by 11,490
Diet rapidly and reproducibly alters the human gut microbiome
David, L. A., Maurice, C. F., Carmody, R. N., Gootenberg, D. B., Button, J. E., Wolfe, B. E., Ling, A. V., Devlin, A. S., Varma, Y., Fischbach, M. A., et al. (2014) · Nature · doi:10.1038/nature12820 · Cited by 10,100
Diversity of the Human Intestinal Microbial Flora
Eckburg, P. B., Bik, E. M., Bernstein, C. N., Purdom, E., Dethlefsen, L., Sargent, M., Gill, S. R., Nelson, K. E., & Relman, D. A. (2005) · Science · doi:10.1126/science.1110591 · Cited by 7,913
Human gut microbiome viewed across age and geography
Yatsunenko, T., Rey, F. E., Manary, M. J., Trehan, I., Dominguez-Bello, M. G., Contreras, M., Magris, M., Hidalgo, G., Baldassano, R. N., Anokhin, A. P., et al. (2012) · Nature · doi:10.1038/nature11053 · Cited by 7,815
Linking long-term dietary patterns with gut microbial enterotypes
Wu, G. D., Chen, J., Hoffmann, C., Bittinger, K., Chen, Y.-Y., Keilbaugh, S. A., Bewtra, M., Knights, D., Walters, W. A., Knight, R., et al. (2011) · Science · doi:10.1126/science.1208344 · Cited by 6,513
De Filippo, C., Cavalieri, D., Di Paola, M., Ramazzotti, M., Poullet, J. B., Massart, S., Collini, S., Pieraccini, G., & Lionetti, P. (2010) · Proceedings of the National Academy of Sciences · doi:10.1073/pnas.1005963107 · Cited by 5,579
Gut microbiota composition correlates with diet and health in the elderly
Claesson, M. J., Jeffery, I. B., Conde, S., Power, S. E., O’Connor, E. M., Cusack, S., Harris, H. M. B., Coakley, M., Lakshminarayanan, B., O’Sullivan, O., et al. (2012) · Nature · doi:10.1038/nature11319 · Cited by 3,314
The gut flora as a forgotten organ
O'Hara, A. M., & Shanahan, F. (2006) · The EMBO Reports · doi:10.1038/sj.embor.7400731 · Cited by 2,791
The influence of diet on the gut microbiota
Scott, K. P., Gratz, S. W., Sheridan, P. O., Flint, H. J., & Duncan, S. H. (2013) · Pharmacological Research · doi:10.1016/j.phrs.2012.10.020 · Cited by 1,052
Towards the human intestinal microbiota phylogenetic core
Tap, J., Mondot, S., Levenez, F., Pelletier, E., Caron, C., Furet, J., Ugarte, E., Muñoz‐Tamayo, R., Paslier, D. L. E., Nalin, R., et al. (2009) · Environmental Microbiology · doi:10.1111/j.1462-2920.2009.01982.x · Cited by 927
Ferris, M. J., Muyzer, G., & Ward, D. M. (1996) · Applied and Environmental Microbiology · doi:10.1128/aem.62.2.340-346.1996 · Cited by 901
Wu, G. D., Compher, C., Chen, E. Z., Smith, S. A., Shah, R. D., Bittinger, K., Chehoud, C., Albenberg, L. G., Nessel, L., Gilroy, E., et al. (2016) · Gut · doi:10.1136/gutjnl-2014-308209 · Cited by 512
A vegan or vegetarian diet substantially alters the human colonic faecal microbiota
Zimmer, J., Lange, B., Frick, J.-S., Sauer, H., Zimmermann, K., Schwiertz, A., Rusch, K., Klosterhalfen, S., & Enck, P. (2012) · European Journal of Clinical Nutrition · doi:10.1038/ejcn.2011.141 · Cited by 465 · cited 2×
“However, in a recent study it has been reported that there was no significant difference for Bifidobacterium between the three diets [35].”
BackgroundResultIntestinal bacteria and ageing
Woodmansey, E. J. (2007) · Journal of Applied Microbiology · doi:10.1111/j.1365-2672.2007.03400.x · Cited by 462
Breast-v.formula-feeding: impacts on the digestive tract and immediate and long-term health effects
Le Huërou-Luron, I., Blat, S., & Boudry, G. (2010) · Nutrition Research Reviews · doi:10.1017/s0954422410000065 · Cited by 407
Agans, R., Rigsbee, L., Kenche, H., Michail, S., Khamis, H. J., & Paliy, O. (2011) · FEMS Microbiology Ecology · doi:10.1111/j.1574-6941.2011.01120.x · Cited by 343
Vegetarian diets, low-meat diets and health: a review
McEvoy, C. T., Temple, N., & Woodside, J. V. (2012) · Public Health Nutrition · doi:10.1017/s1368980012000936 · Cited by 316
Human gut microbiota community structures in urban and rural populations in Russia
Tyakht, A., Kostryukova, E., Popenko, A., Belenikin, M. S., Pavlenko, A. V., Larin, A. K., Karpova, I. Y., Selezneva, O. V., Semashko, T. A., Ospanova, E. A., et al. (2013) · Nature Communications · doi:10.1038/ncomms3469 · Cited by 290
Impact of Coffee Consumption on the Gut Microbiota: A Human Volunteer Study
Jaquet, M., Rochat, I., Moulin, J., Cavin, C., & Bibiloni, R. (2009) · International Journal of Food Microbiology · doi:10.1016/j.ijfoodmicro.2009.01.011 · Cited by 232
Lifestyle-related disease in Crohn’s disease: Relapse prevention by a semi-vegetarian diet
Chiba, M. (2010) · World Journal of Gastroenterology · doi:10.3748/wjg.v16.i20.2484 · Cited by 231
Association of dietary type with fecal microbiota in vegetarians and omnivores in Slovenia
Matijašić, B. B., Obermajer, T., Lipoglavšek, L., Grabnar, I., Avguštin, G., & Rogelj, I. (2013) · European Journal of Nutrition · doi:10.1007/s00394-013-0607-6 · Cited by 228
Kim, M., Hwang, S., Park, E., & Bae, J. (2013) · Environmental Microbiology Reports · doi:10.1111/1758-2229.12079 · Cited by 220
Mai, V., McCrary, Q. M., Sinha, R. R., & Glei, M. (2009) · Nutrition Journal · doi:10.1186/1475-2891-8-49 · Cited by 171
Effect of lactose on gut microbiota and metabolome of infants with cow’s milk allergy
Francavilla, R., Calasso, M. P., Calace, L., Siragusa, S., Ndagijimana, M., Vernocchi, P., Brunetti, L. M., Mancino, G., Tedeschi, G., Guerzoni, E., et al. (2012) · Pediatric Allergy and Immunology · doi:10.1111/j.1399-3038.2012.01286.x · Cited by 161
Statistical Analyses of Complex Denaturing Gradient Gel Electrophoresis Profiles
Gafan, G. P., Lucas, V. S., ROBERTS, G. J., Petrie, A., Wilson, M., & Spratt, D. A. (2005) · Journal of Clinical Microbiology · doi:10.1128/jcm.43.8.3971-3978.2005 · Cited by 156
Fecal Microbial Diversity in a Strict Vegetarian as Determined by Molecular Analysis and Cultivation
Hayashi, H., Sakamoto, M., & Benno, Y. (2002) · Microbiology and Immunology · doi:10.1111/j.1348-0421.2002.tb02769.x · Cited by 149
Impact of Consumption of Oligosaccharide-Containing Biscuits on the Fecal Microbiota of Humans
Tannock, G. W., Munro, K., Bibiloni, R., Simon, M. A., Hargreaves, P., Gopal, P. K., Harmsen, H. J. M., & Welling, G. W. (2004) · Applied and Environmental Microbiology · doi:10.1128/aem.70.4.2129-2136.2004 · Cited by 144
Functional Metagenomics Reveals Novel Pathways of Prebiotic Breakdown by Human Gut Bacteria
Cecchini, D. A., Laville, É., Laguerre, S., Robe, P., Leclerc, M., Dore, J. M., Henrissat, B., Remaud‐Siméon, M., MONSAN, P. F., & Potocki-Véronèse, G. (2013) · PLoS ONE · doi:10.1371/journal.pone.0072766 · Cited by 115
Analysis of the Human Gut Microbiome and Association With Disease
Wu, G. D., & Lewis, J. D. (2013) · Clinical Gastroenterology and Hepatology · doi:10.1016/j.cgh.2013.03.038 · Cited by 113
Ceuppens, S., Li, D., Uyttendaele, M., Renault, P., Ross, R. P., Ranst, M. A. V., Cocolin, L., & Donaghy, J. (2014) · Comprehensive Reviews in Food Science and Food Safety · doi:10.1111/1541-4337.12072 · Cited by 90
Self-citationFoerster, J., Maskarinec, G., Reichardt, N., Tett, A., Narbad, A., Blaut, M., & Boeing, H. (2014) · PLoS ONE · doi:10.1371/journal.pone.0109606 · Cited by 79
Maukonen, J., Mättö, J., Satokari, R. M., Söderlund, H., Mattila, T., & Saarela, M. (2006) · FEMS Microbiology Ecology · doi:10.1111/j.1574-6941.2006.00179.x · Cited by 68
Ruengsomwong, S., Korenori, Y., Sakamoto, N., Wannissorn, B., Nakayama, J., & Nitisinprasert, S. (2014) · Journal of Microbiology and Biotechnology · doi:10.4014/jmb.1310.10043 · Cited by 61
Bianchi, F., Rossi, E. A., Sakamoto, I. K., Adorno, M. Â. T., de Wiele, T. V., & Sivieri, K. (2014) · Food Research International · doi:10.1016/j.foodres.2014.05.072 · Cited by 55
Soare, A., Khazrai, Y. M., Toro, R. D., Roncella, E., Fontana, L., Fallucca, S., Angeletti, S., Formisano, V., Capata, F., Ruiz, V., et al. (2014) · Nutrition & Metabolism · doi:10.1186/1743-7075-11-39 · Cited by 46
Novel strategies for liver therapy using stem cells
Rashid, S. T., Takebe, T., & Nakauchi, H. (2014) · Gut · doi:10.1136/gutjnl-2014-307480 · Cited by 31
l -Galactose Metabolism in Bacteroides vulgatus from the Human Gut Microbiota
Hobbs, M. E., Williams, H. J., Hillerich, B., Almo, S. C., & Raushel, F. M. (2014) · Biochemistry · doi:10.1021/bi500656m · Cited by 31
Bertrand, X., Dufour, V., Millon, L., Beuvier, É., Gbaguidi‐Haore, H., Piarroux, R., Vuitton, D. A., & Talon, D. R. (2006) · Journal of Applied Microbiology · doi:10.1111/j.1365-2672.2006.03148.x · Cited by 11
Human gut microbiota: onset and shaping through life stages and perturbations
Putignani, L. (2012) · Frontiers in Cellular and Infection Microbiology · doi:10.3389/fcimb.2012.00144 · Cited by 11
Human gut microbiota: onset and shaping through life stages and perturbations
(2013) · Frontiers research topics · doi:10.3389/978-2-88919-087-4 · Cited by 2
Research works printed but not linked: 1
- L Vauterin, 1992, Computer-aided objective comparison of electrophoresis patterns for grouping and identification of microorganisms, Eur. J. Clin.Microbiol, 37
Cited by
Sorted by citations
Gut Bacteroides species in health and disease
Zafar, H., & Saier, M. H. (2021) · Gut Microbes · doi:10.1080/19490976.2020.1848158 · Cited by 1,303
Clark, A., & Mach, N. (2016) · Journal of the International Society of Sports Nutrition · doi:10.1186/s12970-016-0155-6 · Cited by 583
“While the amounts of Bacteroides and Firmicutes associated with vegan, vegetarian and omnivore diets from these studies and others [137, 138] are conflicting, it can be concluded that eating vegetables, fiber and/or resistant starch along”
BackgroundPrecup, G., & Vodnar, D.-C. (2019) · British Journal of Nutrition · doi:10.1017/s0007114519000680 · Cited by 378
The Safe and Effective Use of Plant-Based Diets with Guidelines for Health Professionals
Craig, W. J., Mangels, A. R., Fresán, U., Marsh, K. A., Miles, F. L., Saunders, A. V., Haddad, E. H., Heskey, C. E., JOHNSTON, P. K., Larson‐Meyer, E., et al. (2021) · Nutrients · doi:10.3390/nu13114144 · Cited by 379
Gut microbiota diversity according to dietary habits and geographical provenance
Senghor, B., Sokhna, C., Ruimy, R., & Lagier, J. (2018) · Human Microbiome Journal · doi:10.1016/j.humic.2018.01.001 · Cited by 339
Metadata
- Authors
- Ferrocino, I., Di Cagno, R., De Angelis, M., Turroni, S., Vannini, L., Bancalari, E., Rantsiou, K., Cardinali, G., Neviani, E., & Cocolin, L.
- Affiliations
- University of Turin (IT)
- University of Bologna (IT)
- University of Parma (IT)
- University of Perugia (IT)
- Corresponding author
- Cocolin, Luca
- ORCID
- Venue
- PLOS ONE
- Publisher
- Public Library of Science (PLoS)
- Published
- 2015-06-02
- Volume
- 10
- Issue
- 6
- Pages
- e0128669
- ISSN
- 1932-6203 (ISSN-L)
- PMC
- PMC4452701
- OpenAlex
- W563597376
- Cited by
- 107
- References
- 41
- Citations by year
- 2026: 3 · 2025: 6 · 2024: 4 · 2023: 12 · 2022: 8 · 2021: 17 · 2020: 11 · 2019: 10 · 2018: 13 · 2017: 17 · 2016: 6
- FWCI
- 5.21
- Type
- journal article
- Language
- en
- Open access
- gold
- doi.org
- Licence
- Locations
- PLoS ONE (publishedVersion, cc-by)
- PubMed Central (publishedVersion, cc-by)
- PubMed (publishedVersion)
- Archivio istituzionale della ricerca (Alma Mater Studiorum Università di Bologna) (submittedVersion, cc-by)
- Institutional Research Information System University of Turin (University of Turin) (submittedVersion, other-oa)
- DOAJ (DOAJ: Directory of Open Access Journals) (submittedVersion, cc-by-sa)
- Figshare (submittedVersion, cc-by)
- CINECA IRIS Institutional Research Information System (University of Bari Aldo Moro) (submittedVersion, other-oa)
- Open Research (University of Surrey) (submittedVersion)
- Funders
- Ministero dell’Istruzione, dell’Università e della Ricerca (PRIN 2010-2011 “, 2010-2011, (PRIN 2010))
- Topics
- Life Sciences › Biochemistry, Genetics and Molecular Biology › Molecular Biology › Gut microbiota and health
- Life Sciences › Agricultural and Biological Sciences › Food Science › Probiotics and Fermented Foods
- Health Sciences › Nursing › Nutrition and Dietetics › Infant Nutrition and Health
- Keywords
- fecal microbiota, diet, omnivorous diet, vegetarian diet, vegan diet, 16S rRNA gene, viable cell count, culturable microorganisms, regional variation
- MeSH terms
- Diet, Vegan, Adolescent, Adult, Diet, Female, Humans, Italy, Male, Middle Aged, Diet, Vegetarian, Denaturing Gradient Gel Electrophoresis, Microbiota
About these checks
Registry, retraction, Cites and statistics results are computed, not judged, with one exception: a printed reference that no index lists is read once by a model before it counts as a citation error. Claims are extracted by a model and kept only when their quote appears verbatim in the text; each cited source is then checked, with a model’s help, for whether it says what the claim relies on. Those verdicts can be wrong — read the claim’s quote and the cited source before relying on one.
Statistics and arithmetic are recomputed, not judged.
Confidence bands are shown only for fields calibrated on our annotated test set. None is calibrated yet, so no band is shown.
What counts as a claim ›How we measure confidence ›How we check this ›
Are you an author, or do you see a problem with this page? Request a review
