

GO-PCA: An Unsupervised Method to Explore Gene Expression Data Using Prior Knowledge
Open accessPublished version of a preprint
The DOI matches its Crossref record; 62 of the 62 references it cites were found in a registry or an index.
Abstract
METHOD: Genome-wide expression profiling is a widely used approach for characterizing heterogeneous populations of cells, tissues, biopsies, or other biological specimen. The exploratory analysis of such data typically relies on generic unsupervised methods, e.g. principal component analysis (PCA) or hierarchical clustering. However, generic methods fail to exploit prior knowledge about the molecular functions of genes. Here, I introduce GO-PCA, an unsupervised method that combines PCA with nonparametric GO enrichment analysis, in order to systematically search for sets of genes that are both strongly correlated and closely functionally related. These gene sets are then used to automatically generate expression signatures with functional labels, which collectively aim to provide a readily interpretable representation of biologically relevant similarities and differences. The robustness of the results obtained can be assessed by bootstrapping. RESULTS: I first applied GO-PCA to datasets containing diverse hematopoietic cell types from human and mouse, respectively. In both cases, GO-PCA generated a small number of signatures that represented the majority of lineages present, and whose labels reflected their respective biological characteristics. I then applied GO-PCA to human glioblastoma (GBM) data, and recovered signatures associated with four out of five previously defined GBM subtypes. My results demonstrate that GO-PCA is a powerful and versatile exploratory method that reduces an expression matrix containing thousands of genes to a much smaller set of interpretable signatures. In this way, GO-PCA aims to facilitate hypothesis generation, design of further analyses, and functional comparisons across datasets.
Overview
The claims and statistics of this paper haven’t been checked yet.
Free: it reads the open-access text and checks the first 5 claims that cite a source we can check. Create a free account to check every claim.
Integrity signals
Registry
Cites
Statistics
Figures
Verification
Claims the paper makes
The claims and statistics of this paper haven’t been checked yet.
Free: it reads the open-access text and checks the first 5 claims that cite a source we can check. Create a free account to check every claim.
Claims other papers make about this one
Each is checked against this paper’s own text: does it say what the citing paper says it does?
The cited source says what the claim attributes to it.
In the citing paper
“Similar approaches have been used in other biological settings1, and enhanced resolution, for example from pseudotemporal ordering, has helped recover such dependencies135,137.”
From Revealing the vectors of cellular identity with single-cell genomics (2016) · cites this paper as [137]
In the citing paper
“Thus, the large variation induced by the cell cycle in some scRNA-seq experiments may conceal other important sources of biological variation101, especially cellular differentiation processes137,141,151,152.”
From Revealing the vectors of cellular identity with single-cell genomics (2016) · cites this paper as [137]
Self-check
Percentages, sums and reported differences re-computed from the paper’s own numbers.
The self-check needs the paper’s full text.
Citations
Cites
Controlling the False Discovery Rate: A Practical and Powerful Approach to Multiple Testing
Benjamini, Y., & Hochberg, Y. (1995) · Journal of the Royal Statistical Society Series B: Statistical Methodology · doi:10.1111/j.2517-6161.1995.tb02031.x · Cited by 109,482 · cited 1×
“In combination with an FDR criterion [47], a jackstraw-like approach could allow GO-PCA to adjust the XL-mHG L parameter in a “smart” way for each PC.”
Scikit-learn: Machine Learning in Python
Pedregosa, F., Varoquaux, G., Gramfort, A., Michel, V., Thirion, B., Grisel, O., Blondel, M., Müller, A., Nothman, J., Louppe, G., et al. (2012) · arXiv · doi:10.48550/arxiv.1201.0490 · Cited by 71,016 · cited 1×
“PCA module from the scikit-learn Python package [48], version 0.”
Subramanian, A., Tamayo, P., Mootha, V. K., Mukherjee, S., Ebert, B. L., Gillette, M. A., Paulovich, A., Pomeroy, S. L., Golub, T. R., Lander, E. S., et al. (2005) · Proceedings of the National Academy of Sciences · doi:10.1073/pnas.0506580102 · Cited by 53,625 · cited 2×
“In light of the intuitive appeal of this idea, as well as its highly successful application in supervised settings [14], there exist surprisingly few methods that exploit prior biological”
An Introduction to the Bootstrap
Efron, B., & Tibshirani, R. J. (1994) · doi:10.1201/9780429246593 · Cited by 40,500
Molecular portraits of human breast tumours
Perou, C. M., Sørlie, T., Eisen, M. B., van de Rijn, M., Jeffrey, S. S., Rees, C. A., Pollack, J. R., Ross, D. T., Johnsen, H., Akslen, L. A., et al. (2000) · Nature · doi:10.1038/35021093 · Cited by 16,261 · cited 1×
“, the identification of clinically relevant cancer subtypes [10, 11]), arriving at such results typically requires significant human effort combined with expert knowledge, and can be fraught with difficulties.”
Cluster analysis and display of genome-wide expression patterns
Eisen, M. B., Spellman, P. T., Brown, P. O., & Botstein, D. (1998) · Proceedings of the National Academy of Sciences · doi:10.1073/pnas.95.25.14863 · Cited by 16,184 · cited 1×
“Popular approaches include principal component analysis (PCA) [5], hierarchical clustering [6], k-means clustering, consensus clustering [7], non-negative matrix factorization (reviewed in [8]), mixture models (e.”
Nishimura, R., Osako, T., Nishiyama, Y., Tashima, R., Nakano, M., Fujisue, M., Toyozumi, Y., & Arima, N. (2013) · Oncology · doi:10.1159/000353099 · Cited by 13,166
Distinct types of diffuse large B-cell lymphoma identified by gene expression profiling
Alizadeh, A. A., Eisen, M. B., Davis, R. E., Ma, C., Lossos, I. S., Rosenwald, A., Boldrick, J. C., Sabet, H., Tran, T., Yu, X., et al. (2000) · Nature · doi:10.1038/35000501 · Cited by 9,925 · cited 1×
“, the identification of clinically relevant cancer subtypes [10, 11]), arriving at such results typically requires significant human effort combined with expert knowledge, and can be fraught with difficulties.”
Statistical significance for genomewide studies
Storey, J. D., & Tibshirani, R. (2003) · Proceedings of the National Academy of Sciences · doi:10.1073/pnas.1530509100 · Cited by 9,692
Bolstad, B. M., Irizarry, R. A., Åstrand, M., & Speed, T. P. (2003) · Bioinformatics · doi:10.1093/bioinformatics/19.2.185 · Cited by 8,266 · cited 1×
“The resulting matrix containing expression for 10,785 genes was quantile-normalized [52].”
Verhaak, R. G. W., Hoadley, K. A., Purdom, E., Wang, V., Qi, Y., Wilkerson, M. D., Miller, C. R., Ding, L., Golub, T., Mesirov, J. P., et al. (2010) · Cancer Cell · doi:10.1016/j.ccr.2009.12.020 · Cited by 7,575 · cited 1×
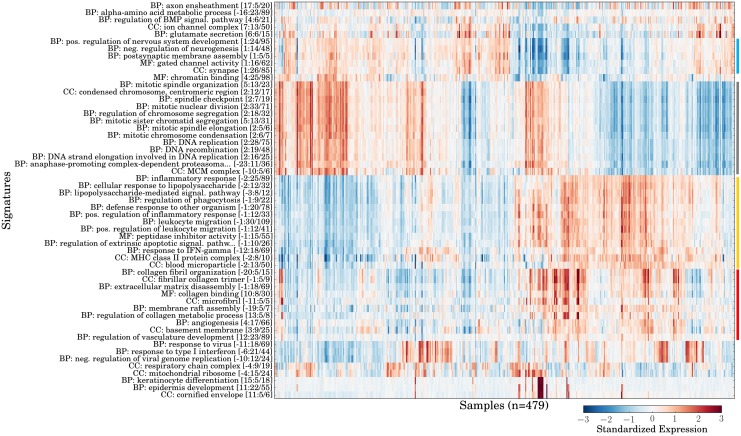
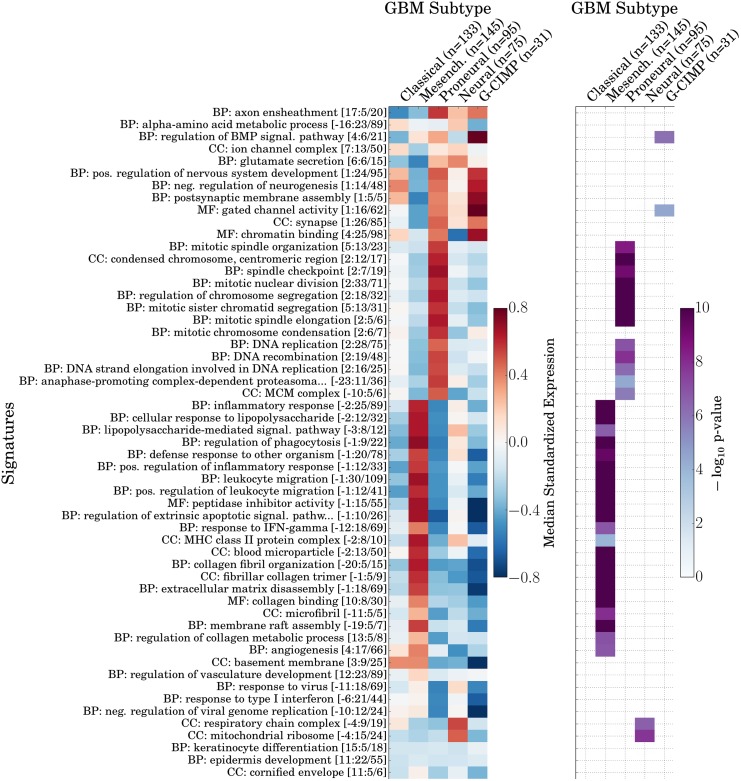
“Four of these subtypes (Classical, Mesenchymal, Proneural, and Neural) were originally defined based on consensus clustering of gene expression data, and shown to correlate with different chromosomal aberrations and mutations [41].”
NWChem: A comprehensive and scalable open-source solution for large scale molecular simulations
Valiev, M., Bylaska, E. J., Govind, N., Kowalski, K., Straatsma, T. P., Van Dam, H. J. J., Wang, D., Nieplocha, J., Apra, E., Windus, T. L., et al. (2010) · Computer Physics Communications · doi:10.1016/j.cpc.2010.04.018 · Cited by 5,779
Single-cell RNA-seq highlights intratumoral heterogeneity in primary glioblastoma
Patel, A. P., Tirosh, I., Trombetta, J. J., Shalek, A. K., Gillespie, S. M., Wakimoto, H., Cahill, D. P., Nahed, B. V., Curry, W. T., Martuza, R. L., et al. (2014) · Science · doi:10.1126/science.1254257 · Cited by 5,063
The Somatic Genomic Landscape of Glioblastoma
Brennan, C. W., Verhaak, R. G. W., McKenna, A., Campos, B., Noushmehr, H., Salama, S. R., Zheng, S., Chakravarty, D., Sanborn, J. Z., Berman, S. H., et al. (2013) · Cell · doi:10.1016/j.cell.2013.09.034 · Cited by 5,016 · cited 4×
“I curated a set of 479 glioblastoma transcriptomes from TCGA based on clinical annotation data from Supplementary Table 7 (“Clinical and Molecular Subclass Data Table”) in [40].”
InfluentialElkablawy, M. A., Albasri, A. M., Mohammed, R. A., Hussainy, A. S., Nouh, M. M., & Alhujaily, A. S. (2016) · Saudi Medical Journal · doi:10.15537/smj.2016.2.12285 · Cited by 4,382
Innate and adaptive immune cells in the tumor microenvironment
Gajewski, T. F., Schreiber, H., & Fu, Y.-X. (2013) · Nature Immunology · doi:10.1038/ni.2703 · Cited by 4,148
GOrilla: a tool for discovery and visualization of enriched GO terms in ranked gene lists
Eden, E., Navon, R., Steinfeld, I., Lipson, D., & Yakhini, Z. (2009) · BMC Bioinformatics · doi:10.1186/1471-2105-10-48 · Cited by 3,356
Droplet barcoding for single-cell transcriptomics applied to embryonic stem cells
Klein, A. M., Mazutis, L., Akartuna, I., Tallapragada, N., Veres, A., Li, V., Peshkin, L., Weitz, D. A., & Kirschner, M. W. (2015) · Cell · doi:10.1016/j.cell.2015.04.044 · Cited by 3,356
Phillips, H. S., Kharbanda, S., Chen, R., Forrest, W. F., Soriano, R. H., Wu, T. D., Misra, A., Nigro, J. M., Colman, H., Soroceanu, L., et al. (2006) · Cancer Cell · doi:10.1016/j.ccr.2006.02.019 · Cited by 3,143
An Introduction to the Bootstrap.
Buckland, S. T., Efron, B., & Tibshirani, R. J. (1994) · Biometrics · doi:10.2307/2532810 · Cited by 3,103
Machine learning for neuroimaging with scikit-learn
Abraham, A., Pedregosa, F., Eickenberg, M., Gervais, P., Mueller, A., Kossaifi, J., Gramfort, A., Thirion, B., & Varoquaux, G. (2014) · Frontiers in Neuroinformatics · doi:10.3389/fninf.2014.00014 · Cited by 2,384
Identification of a CpG Island Methylator Phenotype that Defines a Distinct Subgroup of Glioma
Noushmehr, H., Weisenberger, D. J., Diefes, K., Phillips, H. S., Pujara, K., Berman, B. P., Pan, F., Pelloski, C. E., Sulman, E. P., Bhat, K. P., et al. (2010) · Cancer Cell · doi:10.1016/j.ccr.2010.03.017 · Cited by 2,337 · cited 2×
“The fifth subtype, which is rare among patients with primary GBM, was originally defined based on the analysis of DNA methylation patterns, and shown to exhibit a “GBM CpG island methylator phenotype” (G-CIMP) that was associated with significantly better disease outcomes [42].”
Tackling the widespread and critical impact of batch effects in high-throughput data
Leek, J. T., Scharpf, R. B., Bravo, H. C., Simcha, D., Langmead, B., Johnson, W. E., Geman, D., Baggerly, K., & Irizarry, R. A. (2010) · Nature Reviews Genetics · doi:10.1038/nrg2825 · Cited by 2,196 · cited 1×
“The high-dimensional and heterogeneous nature of transcriptomic data often makes it difficult to interpret the output of generic unsupervised algorithms, and technical artifacts can lead to the identification of biologically irrelevant clusters or factors [12] that further complicate the analysis.”
Monti, S., Tamayo, P., Mesirov, J., & Golub, T. (2003) · Machine Learning · doi:10.1023/a:1023949509487 · Cited by 2,116 · cited 1×
“Popular approaches include principal component analysis (PCA) [5], hierarchical clustering [6], k-means clustering, consensus clustering [7], non-negative matrix factorization (reviewed in [8]), mixture models (e.”
Singular value decomposition for genome-wide expression data processing and modeling
Alter, O., Brown, P. O., & Botstein, D. (2000) · Proceedings of the National Academy of Sciences · doi:10.1073/pnas.97.18.10101 · Cited by 1,971 · cited 2×
“To this end, I developed the GO-PCA algorithm, named after its two building blocks, PCA [5], and GO enrichment analysis [23].”
Segal, E., Shapira, M., Regev, A., Pe'er, D., Botstein, D., Koller, D., & Friedman, N. (2003) · Nature Genetics · doi:10.1038/ng1165 · Cited by 1,670 · cited 1×
“Several methods have been designed for the narrow task of identifying regulatory relationships ([15] and ref.”
A framework for oligonucleotide microarray preprocessing
Carvalho, B. S., & Irizarry, R. A. (2010) · Bioinformatics · doi:10.1093/bioinformatics/btq431 · Cited by 1,550 · cited 1×
“Raw data (CEL files) for these samples were processed using the rma function from the oligo R package [51], with the normalization parameter set to TRUE, resulting in the output being quantile-normalized.”
Cython: The Best of Both Worlds
Behnel, S., Bradshaw, R., Citro, C., Dalcin, L., Seljebotn, D. S., & Smith, K. (2011) · Computing in Science & Engineering · doi:10.1109/mcse.2010.118 · Cited by 1,230 · cited 2×
“Given a ranked list of protein-coding genes (where the ranking was defined by the loadings associated with a particular principal component), I tested for GO enrichment using a Cython [50] (http://cython.”
Wintrobe's clinical hematology.
Lee, G. R. (1981) · Medical Entomology and Zoology · Cited by 1,167
Wintrobe's Clinical Hematology
Ketley, N. (1993) · Journal of Clinical Pathology · doi:10.1136/jcp.46.12.1142-c · Cited by 1,080
Densely Interconnected Transcriptional Circuits Control Cell States in Human Hematopoiesis
Novershtern, N., Subramanian, A., Lawton, L. N., Mak, R. H., Haining, W. N., McConkey, M. E., Habib, N., Yosef, N., Chang, C. Y., Shay, T., et al. (2011) · Cell · doi:10.1016/j.cell.2011.01.004 · Cited by 942 · cited 4×
“This data is fully processed, and contains expression levels for 8,968 genes that were expressed in the majority of samples from at least one cell type (see [26] for details).”
InfluentialThe incredible journey: From megakaryocyte development to platelet formation
Machlus, K. R., & Italiano, J. E. (2013) · Journal of Cell Biology · doi:10.1083/jcb.201304054 · Cited by 856
Peres-Neto, P. R., Jackson, D. A., & Somers, K. M. (2005) · Computational Statistics & Data Analysis · doi:10.1016/j.csda.2004.06.015 · Cited by 840
The phagocytes: neutrophils and monocytes
Dale, D. C., Boxer, L., & Liles, W. C. (2008) · Blood · doi:10.1182/blood-2007-12-077917 · Cited by 740 · cited 2×
“pathway” (see S4c Fig) was also specifically expressed in this lineage, likely reflecting the fact that toll-like receptors (TLRs) are important pattern recognition receptors for phagocytes [31].”
Independent filtering increases detection power for high-throughput experiments
Bourgon, R., Gentleman, R., & Huber, W. (2010) · Proceedings of the National Academy of Sciences · doi:10.1073/pnas.0914005107 · Cited by 740
Discovering motifs in ranked lists of DNA sequences
Eden, E., Lipson, D., Yogev, S., & Yakhini, Z. (2007) · PLoS Computational Biology · doi:10.1371/journal.pcbi.0030039 · Cited by 696 · cited 3×
“org) implementation of the minimum hypergeometric (mHG) statistic [23, 25].”
The GOA database: Gene Ontology annotation updates for 2015
Huntley, R. P., Sawford, T., Mutowo-Meullenet, P., Shypitsyna, A., Bonilla, C., Martin, M. J., & O'Donovan, C. (2015) · Nucleic Acids Research · doi:10.1093/nar/gku1113 · Cited by 612 · cited 1×
“The method proposed here relies on PCA, one of the most versatile unsupervised methods, and uses prior knowledge in the form of gene ontology (GO) annotations from the UniProtGOA database [22].”
A mixture model-based approach to the clustering of microarray expression data
McLachlan, G. J., Bean, R. W., & Peel, D. (2002) · Bioinformatics · doi:10.1093/bioinformatics/18.3.413 · Cited by 559
Nonnegative Matrix Factorization: An Analytical and Interpretive Tool in Computational Biology
Devarajan, K. (2008) · PLoS Computational Biology · doi:10.1371/journal.pcbi.1000029 · Cited by 454 · cited 1×
“Popular approaches include principal component analysis (PCA) [5], hierarchical clustering [6], k-means clustering, consensus clustering [7], non-negative matrix factorization (reviewed in [8]), mixture models (e.”
Carbon Dioxide Transport and Carbonic Anhydrase in Blood and Muscle
Geers, C., & Gros, G. (2000) · Physiological Reviews · doi:10.1152/physrev.2000.80.2.681 · Cited by 416 · cited 1×
“Both of these functional categories match unique biological characteristics of erythrocytes, namely their ability to transport carbon dioxide [27], and the degradation of their mitochondria through a type of autophagy termed “mitophagy” [28].”
Statistical significance of variables driving systematic variation in high-dimensional data
Chung, N. C., & Storey, J. D. (2015) · Bioinformatics · doi:10.1093/bioinformatics/btu674 · Cited by 245 · cited 1×
“It has been suggested to assess the association between individual variables (genes) and principal components using a “jackstraw” approach [46].”
Every Cell Is Special: Genome-wide Studies Add a New Dimension to Single-Cell Biology
Junker, J. P., & van Oudenaarden, A. (2014) · Cell · doi:10.1016/j.cell.2014.02.010 · Cited by 219 · cited 1×
“Currently, the development of single-cell methods is promising a dramatic increase in the spatial resolution of transcriptomic data [1] (see e.”
Transcriptional Control of Early T and B Cell Developmental Choices
Rothenberg, E. V. (2014) · Annual Review of Immunology · doi:10.1146/annurev-immunol-032712-100024 · Cited by 215 · cited 1×
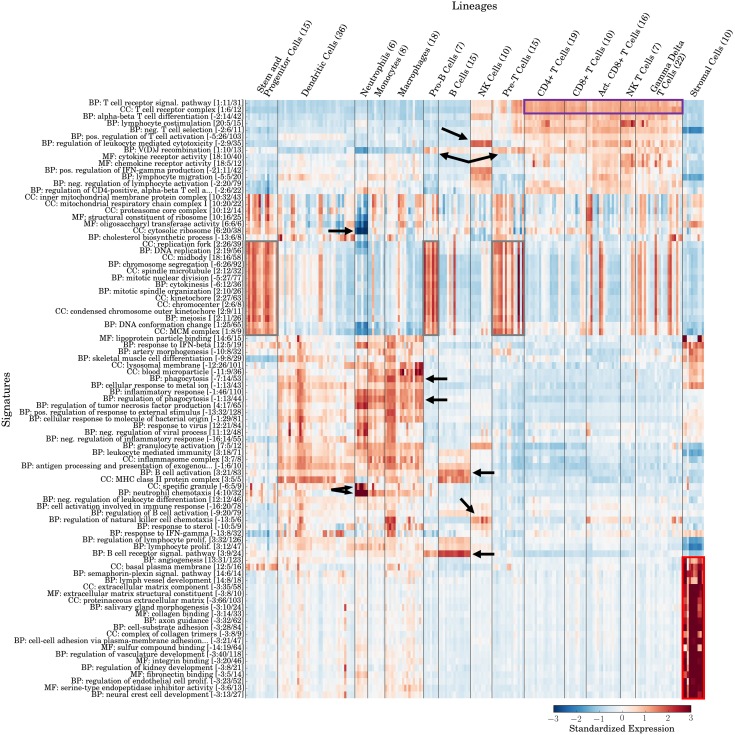
“A case where a signature expression profile defied lineage boundaries was that of “V(D)J recombination” (see S7c Fig), which appeared most strongly expressed in Pro-B cells and Pre-T cells, corresponding to the cell types in which V(D)J recombination and assembly of B and T cell receptors is known to occur [39].”
The Role of Toll-Like Receptors in the Regulation of Neutrophil Migration, Activation, and Apoptosis
Sabroe, I., Dower, S. K., & Whyte, M. K. B. (2005) · Clinical Infectious Diseases · doi:10.1086/431992 · Cited by 212
Identification of transcriptional regulators in the mouse immune system
the Immunological Genome Project Consortium, Jojic, V., Shay, T., Sylvia, K., Zuk, O., Sun, X., Kang, J., Regev, A., & Koller, D. (2013) · Nature Immunology · doi:10.1038/ni.2587 · Cited by 194 · cited 9×
“Following the methodology described in [36], in cases where multiple probesets mapped to the same gene symbol, the probset with highest average expression was used.”
InfluentialSpatiotemporal transcriptomics reveals the evolutionary history of the endoderm germ layer
Hashimshony, T., Feder, M., Levin, M., Hall, B. K., & Yanai, I. (2015) · Nature · doi:10.1038/nature13996 · Cited by 177
Neutrophils and Macrophages: the Main Partners of Phagocyte Cell Systems
Silva, M. T., & Correia-Neves, M. (2012) · Frontiers in Immunology · doi:10.3389/fimmu.2012.00174 · Cited by 153 · cited 1×
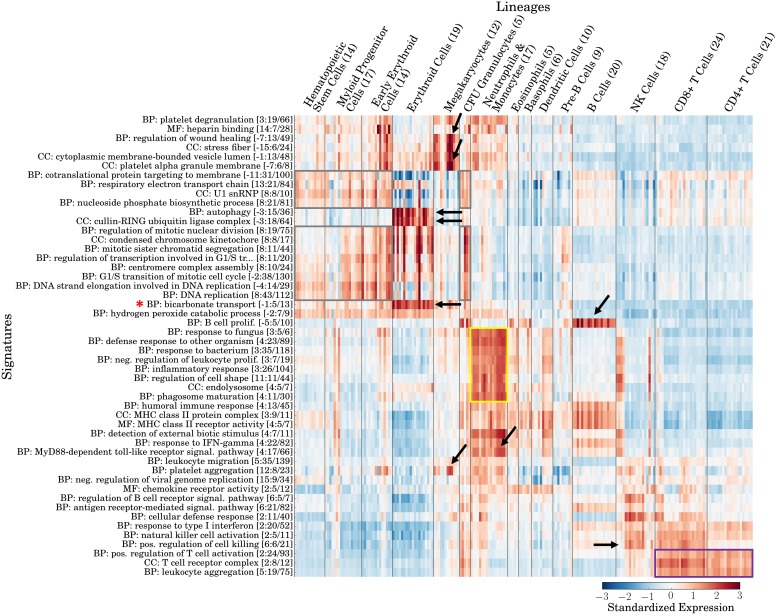
“Likewise, B cells were strongly associated with a “B cell proliferation” signature, whereas the neutrophil / monocyte lineage was associated with multiple signatures (see yellow box in Fig 2) which possibly reflected their related immunological roles in the innate immune system [30, 31].”
Autophagy and the degradation of mitochondria
Goldman, S. J., Taylor, R., Zhang, Y., & Jin, S. (2010) · Mitochondrion · doi:10.1016/j.mito.2010.01.005 · Cited by 145 · cited 1×
“Both of these functional categories match unique biological characteristics of erythrocytes, namely their ability to transport carbon dioxide [27], and the degradation of their mitochondria through a type of autophagy termed “mitophagy” [28].”
Huang, D., & Pan, W. (2006) · Bioinformatics · doi:10.1093/bioinformatics/btl065 · Cited by 129
A Knowledge-Based Clustering Algorithm Driven by Gene Ontology
Cheng, J., Cline, M., Martin, J. C., Finkelstein, D., Awad, T. A., Kulp, D., & Siani-Rose, M. A. (2004) · Journal of Biopharmaceutical Statistics · doi:10.1081/bip-200025659 · Cited by 125 · cited 1×
“For more general purposes, it has been proposed to adjust the distance metric used in hierarchical clustering by a term that quantifies similarity of GO or KEGG annotations between pairs of genes, with a tuning parameter allowing for a flexible trade-off between knowledge-based and data-driven analysis [16, 17].”
Incorporating gene functions as priors in model-based clustering of microarray gene expression data
Pan, W. (2006) · Bioinformatics · doi:10.1093/bioinformatics/btl011 · Cited by 120
Wintrobe's clinical hematology
Greer, J. P., Wintrobe, M. M., & Andrews, N. C. (2004) · Cited by 119
Tseng, G. C. (2007) · Bioinformatics · doi:10.1093/bioinformatics/btm320 · Cited by 117
Differentially expressed, variant U1 snRNAs regulate gene expression in human cells
O'Reilly, D., Dienstbier, M., Cowley, S. A., Vazquez, P., Drożdż, M., Taylor, S., James, W. S., & Murphy, S. (2013) · Genome Research · doi:10.1101/gr.142968.112 · Cited by 101
Red blood cell extrudes nucleus and mitochondria against oxidative stress
Zhang, Z., Cheng, J., Xu, F., Chen, Y., Du, J., Yuan, M., Zhu, F., Xu, X., & Yuan, S. (2011) · IUBMB Life · doi:10.1002/iub.490 · Cited by 101
Incorporating Gene Ontology in Clustering Gene Expression Data
Kustra, R., & Zagdański, A. (2006) · Proceedings - IEEE Symposium on Computer-Based Medical Systems · doi:10.1109/cbms.2006.100 · Cited by 47 · cited 1×
“For more general purposes, it has been proposed to adjust the distance metric used in hierarchical clustering by a term that quantifies similarity of GO or KEGG annotations between pairs of genes, with a tuning parameter allowing for a flexible trade-off between knowledge-based and data-driven analysis [16, 17].”
Robinson, D. G., Wang, J. Y., & Storey, J. D. (2015) · Nucleic Acids Research · doi:10.1093/nar/gkv636 · Cited by 38
Use of prior knowledge for the analysis of high-throughput transcriptomics and metabolomics data
Reshetova, P., Smilde, A. K., van Kampen, A. H. C., & Westerhuis, J. A. (2014) · BMC Systems Biology · doi:10.1186/1752-0509-8-s2-s2 · Cited by 31 · cited 3×
“Methods incorporating prior knowledge address these challenges by focusing on patterns that are more likely to be biologically meaningful, leading to results that are more relevant and interpretable [13].”
InfluentialRobinson, D. G., Wang, J. C. Y., & Storey, J. D. (2014) · bioRxiv (Cold Spring Harbor Laboratory) · doi:10.1101/013342 · Cited by 17
From Cells to Organs:: A Histology Textbook and Atlas
Lommel, A. T. L. V. (2002) · Medical Entomology and Zoology · Cited by 14
Dynamically weighted clustering with noise set
Shen, Y., Sun, W., & Li, K.-C. (2009) · Bioinformatics · doi:10.1093/bioinformatics/btp671 · Cited by 7
The XL-mHG Test For Enrichment: A Technical ReportPreprint
Wagner, F. (2015) · arXiv (Cornell University) · doi:10.48550/arxiv.1507.07905 · Cited by 3
Self-citation
Research works printed but not linked: 1
- Doan T, Melvold R, Viselli S, Valtenbaugh C. Immunology. Lippincott Williams & Wilkins; 2012.
Cited by
Comprehensive Classification of Retinal Bipolar Neurons by Single-Cell Transcriptomics
Shekhar, K., Lapan, S. W., Whitney, I. E., Tran, N. M., Macosko, E. Z., Kowalczyk, M., Adiconis, X., Levin, J. Z., Nemesh, J., Goldman, M., et al. (2016) · Cell · doi:10.1016/j.cell.2016.07.054 · Cited by 1,176
Revealing the vectors of cellular identity with single-cell genomics
Wagner, A., Regev, A., & Yosef, N. (2016) · Nature Biotechnology · doi:10.1038/nbt.3711 · Cited by 632
A Distinct Gene Module for Dysfunction Uncoupled from Activation in Tumor-Infiltrating T Cells
Singer, M., Wang, C., Cong, L., Marjanovic, N. D., Kowalczyk, M. S., Zhang, H., Nyman, J., Sakuishi, K., Kurtulus, S., Gennert, D., et al. (2016) · Cell · doi:10.1016/j.cell.2016.08.052 · Cited by 420
Early emergence of cortical interneuron diversity in the mouse embryo
Mi, D., Li, Z., Lim, L., Li, M., Moissidis, M., Yang, Y., Gao, T., Hu, T. X., Pratt, T., Price, D. J., et al. (2018) · Science · doi:10.1126/science.aar6821 · Cited by 259
Sasagawa, Y., Danno, H., Takada, H., Ebisawa, M., Tanaka, K., Hayashi, T., Kurisaki, A., & Nikaido, I. (2018) · Genome Biology · doi:10.1186/s13059-018-1407-3 · Cited by 135
Metadata
- Authors
- Wagner, F.
- Affiliations
- Duke University (US)
- Corresponding author
- Wagner, Florian
- ORCID
- Wagner, Florian
- Venue
- PLOS ONE
- Publisher
- Public Library of Science (PLoS)
- Published
- 2015-11-17
- Volume
- 10
- Issue
- 11
- Pages
- e0143196
- ISSN
- 1932-6203 (ISSN-L)
- PMC
- PMC4648502
- OpenAlex
- W2174288164
- Cited by
- 35
- References
- 60
- Citations by year
- 2026: 1 · 2025: 2 · 2024: 4 · 2023: 3 · 2022: 4 · 2021: 7 · 2020: 2 · 2019: 2 · 2018: 4 · 2017: 2 · 2016: 3 · 2015: 1
- FWCI
- 1.45
- Type
- journal article
- Language
- en
- Open access
- gold
- doi.org
- Licence
- Locations
- PLoS ONE (publishedVersion, cc-by)
- bioRxiv (Cold Spring Harbor Laboratory) (acceptedVersion, cc-by-nc-nd)
- Europe PMC (PubMed Central) (publishedVersion, cc-by)
- PubMed Central (publishedVersion, cc-by)
- PubMed (publishedVersion)
- RePEc: Research Papers in Economics (submittedVersion)
- DOAJ (DOAJ: Directory of Open Access Journals) (submittedVersion, cc-by-sa)
- Figshare (submittedVersion, cc-by)
- Topics
- Life Sciences › Biochemistry, Genetics and Molecular Biology › Molecular Biology › Gene expression and cancer classification
- Life Sciences › Biochemistry, Genetics and Molecular Biology › Molecular Biology › Bioinformatics and Genomic Networks
- Life Sciences › Biochemistry, Genetics and Molecular Biology › Molecular Biology › Genomics and Phylogenetic Studies
- Keywords
- gene expression signatures, gene ontology enrichment, unsupervised dimensionality reduction, principal component analysis, hematopoietic lineage, glioblastoma subtypes, bootstrapping, hypothesis generation
- MeSH terms
- Algorithms, Animals, Glioblastoma, Hematopoietic Stem Cells, Humans, Neoplasm Staging, Software, Cluster Analysis, Genome, Cell Lineage, Principal Component Analysis, Databases, Genetic, Mice, Molecular Sequence Annotation, Transcriptome
About these checks
Registry, retraction, Cites and statistics results are computed, not judged, with one exception: a printed reference that no index lists is read once by a model before it counts as a citation error. Claims are extracted by a model and kept only when their quote appears verbatim in the text; each cited source is then checked, with a model’s help, for whether it says what the claim relies on. Those verdicts can be wrong — read the claim’s quote and the cited source before relying on one.
Statistics and arithmetic are recomputed, not judged.
Confidence bands are shown only for fields calibrated on our annotated test set. None is calibrated yet, so no band is shown.
What counts as a claim ›How we measure confidence ›How we check this ›
Are you an author, or do you see a problem with this page? Request a review
Data sources
Bibliographic data: Semantic Scholar, OpenAlex, Crossref.
Contains information from the Semantic Scholar Academic Graph Datasets, made available under the ODC Attribution License (ODC-BY 1.0).
Semantic Scholar’s data is described in: Kinney, R., et al. (2023). The Semantic Scholar Open Data Platform. arXiv:2301.10140.
