

The DOI matches its Crossref record, with a small difference in title or year; 42 of the 42 references it cites were found in a registry or an index; none of the 41 sources its claims cite is checked for support yet.
Human walking in the real world: Interactions between terrain type, gait parameters, and energy expenditure
Open accessPublished version of a preprint
Abstract
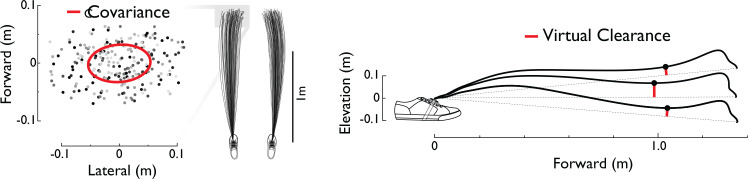
Humans often traverse real-world environments with a variety of surface irregularities and inconsistencies, which can disrupt steady gait and require additional effort. Such effects have, however, scarcely been demonstrated quantitatively, because few laboratory biomechanical measures apply outdoors. Walking can nevertheless be quantified by other means. In particular, the foot’s trajectory in space can be reconstructed from foot-mounted inertial measurement units (IMUs), to yield measures of stride and associated variabilities. But it remains unknown whether such measures are related to metabolic energy expenditure. We therefore quantified the effect of five different outdoor terrains on foot motion (from IMUs) and net metabolic rate (from oxygen consumption) in healthy adults (N = 10; walking at 1.25 m/s). Energy expenditure increased significantly ( P < 0.05) in the order Sidewalk, Dirt, Gravel, Grass, and Woodchips, with Woodchips about 27% costlier than Sidewalk. Terrain type also affected measures, particularly stride variability and virtual foot clearance (swing foot’s lowest height above consecutive footfalls). In combination, such measures can also roughly predict metabolic cost (adjusted R 2 = 0.52, partial least squares regression), and even discriminate between terrain types (10% reclassification error). Body-worn sensors can characterize how uneven terrain affects gait, gait variability, and metabolic cost in the real world.
Overview
AI snapshot
Written from the paper’s full text.
TL;DR
Foot-mounted IMUs and portable respirometry were used to quantify how five outdoor terrains affect gait and metabolic cost in healthy adults walking at about 1.25 m/s. Energy expenditure increased from Sidewalk to Dirt, Gravel, Grass, and Woodchips, with Woodchips about 27% costlier than Sidewalk, and stride measures such as virtual clearance and variability were terrain-dependent and roughly predictive of metabolic cost.
Key findings
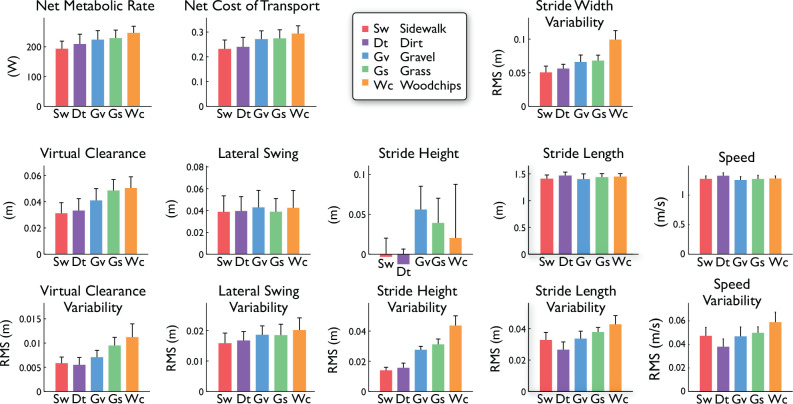
- Net metabolic rate increased significantly across terrains (repeated-measures ANOVA, P = 7.11e-11), from Sidewalk 189.1 ± 29.00 W to Woodchips 240.8 ± 28.91 W; Woodchips was about 27% costlier than Sidewalk. Non-significant pairwise comparisons were Dirt vs. Sidewalk, Gravel vs. Dirt, and Grass vs. Gravel (P ≥ 0.05).
- Terrain affected stride measures, especially virtual clearance: mean changed by up to 58% and RMS variability by up to 63% across terrains.
- Multivariate stride measures predicted metabolic rate better than any single measure: partial least squares regression yielded adjusted R² = 0.52, principal components regression R² = 0.46, and the strongest single univariate regressor, mean virtual clearance, R² = 0.34 (individualized R² = 0.49).
- Linear discriminants classified terrain from stride measures with 10% resubstitution error (5 errors out of 50 observations).
Methods
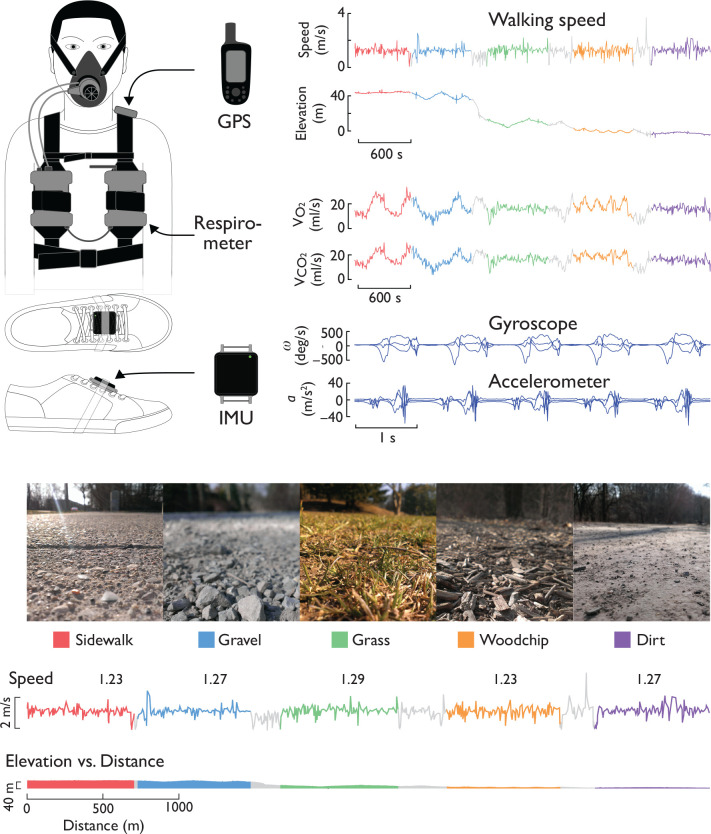
- Ten healthy adults (N = 10; 5 male, 5 female; age 18–48; body mass 64.86 ± 10.10 kg; leg length 0.90 ± 0.07 m) walked outdoors in Nichols Arboretum on five surfaces: Sidewalk, Dirt, Gravel, Grass, and Woodchips, presented in random order for 8 minutes each.
- Speed was loosely regulated at approximately 1.25 m/s via GPS while following an experimenter; metabolic data were collected with portable respirometry and only the last 3 minutes of each trial were used for net metabolic rate after subtracting quiet standing (97.29 ± 27.06 W).
- Foot paths were reconstructed from foot-mounted IMUs; 90 strides per foot were analyzed from forward walking sections, with only left-foot data reported. Analyses included repeated-measures ANOVA, linear regressions, PCA, LDA, PCR, and PLSR, with stride distances normalized by leg length and metabolic power by Mg^1.5 L^0.5.
Limitations
- The paper states that the analysis used a relatively small number of summary measures, that foot-path reconstruction errors exceed laboratory motion capture, and that the method relies on the foot being nearly stationary during stance, which may not occur on softer terrains such as Woodchips, adding uncertainty to stride height and variability.
- The paper also states that reported variability includes terrain, inertial drift, and measurement noise; that kinematic measures cannot capture leg force or power; that inertial data cannot readily discern step width; and that more challenging terrain, speed and elevation variations, and carried loads were not examined.
- Evident from the text: the sample was small (N = 10), only five terrains were studied, walking speed was only loosely controlled, and only left-foot data were used for reported measures.
Model-written summary. Check it against the paper before relying on it.
Integrity signals
Registry
Cites
Statistics
Figures
Verification
Claims the paper makes
40 Own result · 24 Own interpretation · 17 Own method · 11 Not checked yet · 8 No full text of the sources · 3 No basis given
A result the paper reports from its own data — it cites no other source for it, so there is none to check. The quote shows it is in the paper.
In the paper
“This technique yielded adjusted R2 = 0.52 to predict metabolic rate using only two such regressor components.”
§ Human walking in the real world: Interactions between terrain type, gait parameters, and energy expenditure > Results
plaincorrelational- Asserted: passes — The authors put it forward as true.
- Checkable: passes — It can be checked against evidence.
- Load-bearing: passes — The paper’s conclusions depend on it.
- Based: passes — The paper gives a reason why it holds.
The paper states this without a source or data behind it here, so there is nothing to check it against. The quote shows it is in the paper.
In the paper
“The most notable sensitivities were for variability in stride height, stride width, virtual clearance, and lateral swing motion.”
§ Human walking in the real world: Interactions between terrain type, gait parameters, and energy expenditure > Discussion
plaincorrelational- Asserted: passes — The authors put it forward as true.
- Checkable: passes — It can be checked against evidence.
- Load-bearing: passes — The paper’s conclusions depend on it.
- Based: passes — The paper gives a reason why it holds.
A result the paper reports from its own data — it cites no other source for it, so there is none to check. The quote shows it is in the paper.
In the paper
“For goodness of fit, the top four correlates were mean virtual clearance, and RMS variabilities of virtual clearance, stride height, and stride width.”
§ Human walking in the real world: Interactions between terrain type, gait parameters, and energy expenditure > Results
plaincorrelational- Asserted: passes — The authors put it forward as true.
- Checkable: passes — It can be checked against evidence.
- Load-bearing: passes — The paper’s conclusions depend on it.
- Based: passes — The paper gives a reason why it holds.
A result the paper reports from its own data — it cites no other source for it, so there is none to check. The quote shows it is in the paper.
In the paper
“and to lesser degree, lateral swing displacement (mean and variability, summarized in Table 1)”
§ Human walking in the real world: Interactions between terrain type, gait parameters, and energy expenditure > Results
plainn = 10- Asserted: passes — The authors put it forward as true.
- Checkable: passes — It can be checked against evidence.
- Load-bearing: unclear — It is unclear whether the paper’s conclusions depend on it.
- Based: passes — The paper gives a reason why it holds.
A result the paper reports from its own data — it cites no other source for it, so there is none to check. The quote shows it is in the paper.
In the paper
“The only non-significant comparisons were Dirt vs. Sidewalk, Gravel vs. Dirt, and Grass vs. Gravel (P ≥ 0.05).”
§ Human walking in the real world: Interactions between terrain type, gait parameters, and energy expenditure > Results
plainn = 10- Asserted: passes — The authors put it forward as true.
- Checkable: passes — It can be checked against evidence.
- Load-bearing: unclear — It is unclear whether the paper’s conclusions depend on it.
- Based: passes — The paper gives a reason why it holds.
A result the paper reports from its own data — it cites no other source for it, so there is none to check. The quote shows it is in the paper.
In the paper
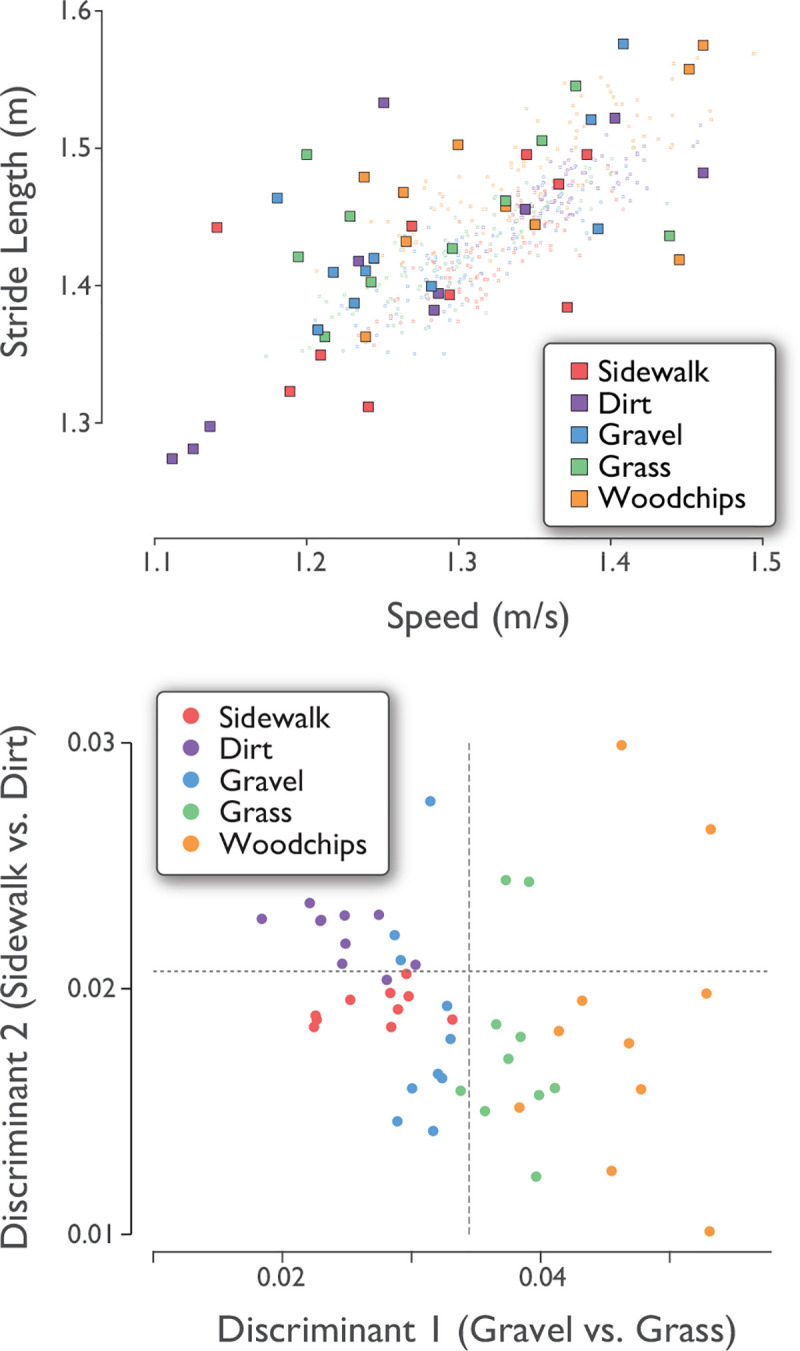
“Linear discriminants were able to classify the data reasonably well (Fig 5), with 10% resubstitution error rate (5 errors out of 50 observations from 5 terrains and 10 subjects).”
§ Human walking in the real world: Interactions between terrain type, gait parameters, and energy expenditure > Results
plainn = 10- Asserted: passes — The authors put it forward as true.
- Checkable: passes — It can be checked against evidence.
- Load-bearing: unclear — It is unclear whether the paper’s conclusions depend on it.
- Based: passes — The paper gives a reason why it holds.
A result the paper reports from its own data — it cites no other source for it, so there is none to check. The quote shows it is in the paper.
In the paper
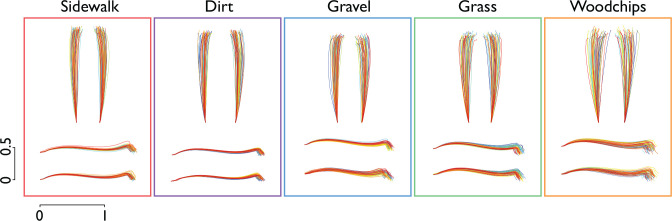
“Participants made only subtle changes to their average gait pattern as a function of terrain.”
§ Human walking in the real world: Interactions between terrain type, gait parameters, and energy expenditure > Discussion
plain- Asserted: passes — The authors put it forward as true.
- Checkable: passes — It can be checked against evidence.
- Load-bearing: passes — The paper’s conclusions depend on it.
- Based: passes — The paper gives a reason why it holds.
A result the paper reports from its own data — it cites no other source for it, so there is none to check. The quote shows it is in the paper.
In the paper
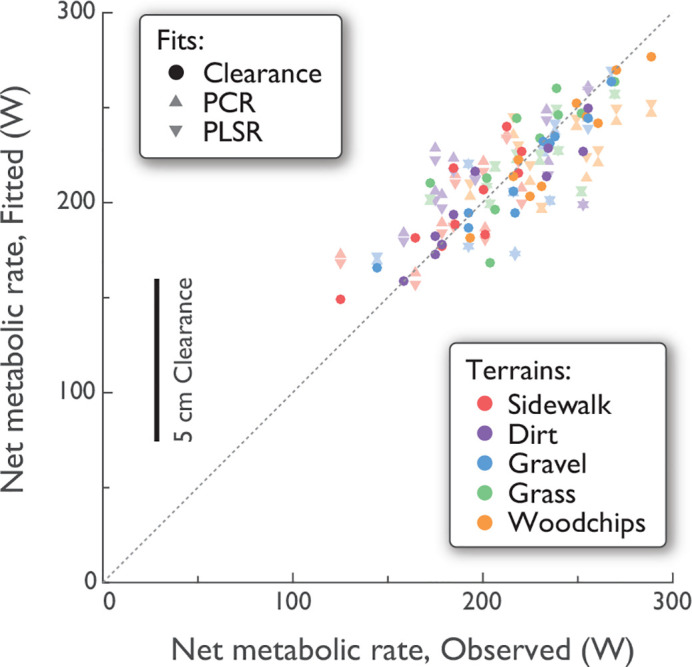
“Metabolic rate was explained reasonably well with all three methods considered (Fig 7).”
§ Human walking in the real world: Interactions between terrain type, gait parameters, and energy expenditure > Results
plaincorrelational- Asserted: passes — The authors put it forward as true.
- Checkable: passes — It can be checked against evidence.
- Load-bearing: passes — The paper’s conclusions depend on it.
- Based: passes — The paper gives a reason why it holds.
A result the paper reports from its own data — it cites no other source for it, so there is none to check. The quote shows it is in the paper.
In the paper
“Any single measure could only predict metabolic rate imperfectly, but there was also considerable interdependency among measures, as revealed by dimensionality reduction techniques.”
§ Human walking in the real world: Interactions between terrain type, gait parameters, and energy expenditure > Discussion
plaincorrelational- Asserted: passes — The authors put it forward as true.
- Checkable: passes — It can be checked against evidence.
- Load-bearing: passes — The paper’s conclusions depend on it.
- Based: passes — The paper gives a reason why it holds.
A result the paper reports from its own data — it cites no other source for it, so there is none to check. The quote shows it is in the paper.
In the paper
“There were also small but significant differences in mean speed and stride length across terrains (Table 1).”
§ Human walking in the real world: Interactions between terrain type, gait parameters, and energy expenditure > Results
plainn = 10- Asserted: passes — The authors put it forward as true.
- Checkable: passes — It can be checked against evidence.
- Load-bearing: unclear — It is unclear whether the paper’s conclusions depend on it.
- Based: passes — The paper gives a reason why it holds.
- It may state two separate claims as one. 36
- Probably not a substantial claim. 26
A result the paper reports from its own data — it cites no other source for it, so there is none to check. The quote shows it is in the paper.
In the paper
“These measures were all strongly significant regressors (at most P = 3.1e-06), although the actual predictive ability was modest, with adjusted R2 ranging 0.29–0.38).”
§ Human walking in the real world: Interactions between terrain type, gait parameters, and energy expenditure > Results
plaincorrelational- Asserted: passes — The authors put it forward as true.
- Checkable: passes — It can be checked against evidence.
- Load-bearing: passes — The paper’s conclusions depend on it.
- Based: passes — The paper gives a reason why it holds.
It may state two separate claims as one.
A result the paper reports from its own data — it cites no other source for it, so there is none to check. The quote shows it is in the paper.
In the paper
“The discriminated data (Fig 6, bottom) show reasonably good discrimination between those same pairs.”
§ Human walking in the real world: Interactions between terrain type, gait parameters, and energy expenditure > Results
plaincorrelationaln = 10- Asserted: passes — The authors put it forward as true.
- Checkable: passes — It can be checked against evidence.
- Load-bearing: unclear — It is unclear whether the paper’s conclusions depend on it.
- Based: passes — The paper gives a reason why it holds.
It may state two separate claims as one.
A result the paper reports from its own data — it cites no other source for it, so there is none to check. The quote shows it is in the paper.
In the paper
“Most notable was virtual clearance of the swing foot, which increased on more challenging terrain (Table 1), and was highly correlated with energy expenditure (Table 2).”
§ Human walking in the real world: Interactions between terrain type, gait parameters, and energy expenditure > Discussion
plaincorrelational- Asserted: passes — The authors put it forward as true.
- Checkable: passes — It can be checked against evidence.
- Load-bearing: passes — The paper’s conclusions depend on it.
- Based: passes — The paper gives a reason why it holds.
It may state two separate claims as one.
A result the paper reports from its own data — it cites no other source for it, so there is none to check. The quote shows it is in the paper.
In the paper
“Some individuals exhibited terrain-dependence in their relationship (Fig 6, top), but with no consistent statistical trend across subjects.”
§ Human walking in the real world: Interactions between terrain type, gait parameters, and energy expenditure > Results
plaincorrelational- Asserted: passes — The authors put it forward as true.
- Checkable: passes — It can be checked against evidence.
- Load-bearing: unclear — It is unclear whether the paper’s conclusions depend on it.
- Based: passes — The paper gives a reason why it holds.
It may state two separate claims as one.
A result the paper reports from its own data — it cites no other source for it, so there is none to check. The quote shows it is in the paper.
In the paper
“Net metabolic rate E˙met varied with terrain type for groupwise (repeated measures ANOVA, P = 7.1e-11) and for most pair-wise comparisons (post hoc paired t-tests, P < 0.05)”
§ Human walking in the real world: Interactions between terrain type, gait parameters, and energy expenditure > Results
plaincorrelationaln = 10- Asserted: passes — The authors put it forward as true.
- Checkable: passes — It can be checked against evidence.
- Load-bearing: passes — The paper’s conclusions depend on it.
- Based: passes — The paper gives a reason why it holds.
It may state two separate claims as one.
A result the paper reports from its own data — it cites no other source for it, so there is none to check. The quote shows it is in the paper.
In the paper
“We found that multiple stride parameters are indeed terrain-dependent and correlated with energy cost.”
§ Human walking in the real world: Interactions between terrain type, gait parameters, and energy expenditure > Discussion
plaincorrelational- Asserted: passes — The authors put it forward as true.
- Checkable: passes — It can be checked against evidence.
- Load-bearing: passes — The paper’s conclusions depend on it.
- Based: passes — The paper gives a reason why it holds.
It may state two separate claims as one.
A result the paper reports from its own data — it cites no other source for it, so there is none to check. The quote shows it is in the paper.
In the paper
“Stride lengths and speeds (filled symbols) were highly correlated with each other, and overlapped for different terrains.”
§ Human walking in the real world: Interactions between terrain type, gait parameters, and energy expenditure > Results
plaincorrelationaln = 10- Asserted: passes — The authors put it forward as true.
- Checkable: passes — It can be checked against evidence.
- Load-bearing: unclear — It is unclear whether the paper’s conclusions depend on it.
- Based: passes — The paper gives a reason why it holds.
It may state two separate claims as one.
A result the paper reports from its own data — it cites no other source for it, so there is none to check. The quote shows it is in the paper.
In the paper
“particularly the measures of virtual clearance (mean changing by up to 58% and variability by up to 63%)”
§ Human walking in the real world: Interactions between terrain type, gait parameters, and energy expenditure > Results
plaincorrelationaln = 10- Asserted: passes — The authors put it forward as true.
- Checkable: passes — It can be checked against evidence.
- Load-bearing: passes — The paper’s conclusions depend on it.
- Based: passes — The paper gives a reason why it holds.
It may state two separate claims as one.
A result the paper reports from its own data — it cites no other source for it, so there is none to check. The quote shows it is in the paper.
In the paper
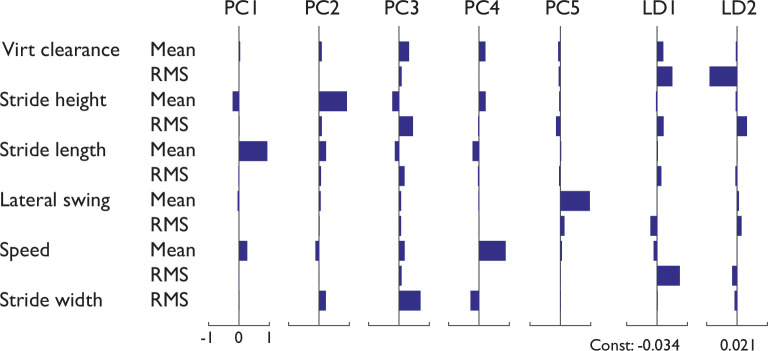
“The second PC accounted for an additional 21.7% (and thus both PCs 87.5%), and was dominated by increased stride length, increased stride height (apparent uphill slope), and increased stride width variability.”
§ Human walking in the real world: Interactions between terrain type, gait parameters, and energy expenditure > Results
plaincorrelational- Asserted: passes — The authors put it forward as true.
- Checkable: passes — It can be checked against evidence.
- Load-bearing: passes — The paper’s conclusions depend on it.
- Based: passes — The paper gives a reason why it holds.
It may state two separate claims as one.
A result the paper reports from its own data — it cites no other source for it, so there is none to check. The quote shows it is in the paper.
In the paper
“The first PC accounted for 65.8% of all terrain-specific variability in the stride measures, and was dominated by increased stride length, increased walking speed, and negative stride height (apparent downhill slope).”
§ Human walking in the real world: Interactions between terrain type, gait parameters, and energy expenditure > Results
plaincorrelational- Asserted: passes — The authors put it forward as true.
- Checkable: passes — It can be checked against evidence.
- Load-bearing: passes — The paper’s conclusions depend on it.
- Based: passes — The paper gives a reason why it holds.
It may state two separate claims as one.
A result the paper reports from its own data — it cites no other source for it, so there is none to check. The quote shows it is in the paper.
In the paper
“Both of these exceed the fit for the strongest single univariate regression (virtual clearance, with R2 = 0.34).”
§ Human walking in the real world: Interactions between terrain type, gait parameters, and energy expenditure > Results
plaincorrelational- Asserted: passes — The authors put it forward as true.
- Checkable: passes — It can be checked against evidence.
- Load-bearing: passes — The paper’s conclusions depend on it.
- Based: passes — The paper gives a reason why it holds.
It may state two separate claims as one.
A result the paper reports from its own data — it cites no other source for it, so there is none to check. The quote shows it is in the paper.
In the paper
“Indeed, co-variation of speed and stride length dominated the first principal component of stride measures (Fig 5), and predicted energy expenditure from the principal components regression (PCR, Fig 7).”
§ Human walking in the real world: Interactions between terrain type, gait parameters, and energy expenditure > Discussion
plaincorrelational- Asserted: passes — The authors put it forward as true.
- Checkable: passes — It can be checked against evidence.
- Load-bearing: passes — The paper’s conclusions depend on it.
- Based: passes — The paper gives a reason why it holds.
It may state two separate claims as one.
A result the paper reports from its own data — it cites no other source for it, so there is none to check. The quote shows it is in the paper.
In the paper
“Nearly every stride measure exhibited significant correlation with energy expenditure, most strongly the RMS variabilities of stride height, virtual clearance, and stride width (Table 2).”
§ Human walking in the real world: Interactions between terrain type, gait parameters, and energy expenditure > Discussion
plaincorrelational- Asserted: passes — The authors put it forward as true.
- Checkable: passes — It can be checked against evidence.
- Load-bearing: passes — The paper’s conclusions depend on it.
- Based: passes — The paper gives a reason why it holds.
It may state two separate claims as one.
A result the paper reports from its own data — it cites no other source for it, so there is none to check. The quote shows it is in the paper.
In the paper
“In addition, all stride variability measures were individually correlated with energy cost (Table 2), although they contributed relatively little to the first two principal components.”
§ Human walking in the real world: Interactions between terrain type, gait parameters, and energy expenditure > Discussion
plaincorrelational- Asserted: passes — The authors put it forward as true.
- Checkable: passes — It can be checked against evidence.
- Load-bearing: unclear — It is unclear whether the paper’s conclusions depend on it.
- Based: passes — The paper gives a reason why it holds.
It may state two separate claims as one.
What the paper did — it cites no source for this, so there is none to check. The quote shows it is in the paper.
In the paper
“Although we attempted to approximately control the average walking speed, there was some variation within each trial.”
§ Human walking in the real world: Interactions between terrain type, gait parameters, and energy expenditure > Results
plain- Asserted: passes — The authors put it forward as true.
- Checkable: passes — It can be checked against evidence.
- Load-bearing: fails — The paper’s conclusions may not depend on it.
- Based: passes — The paper gives a reason why it holds.
Probably not a substantial claim. The paper’s conclusions may not depend on it.
A conclusion the paper draws from its own results — it cites no other source for it, so there is none to check. The quote shows it is in the paper.
In the paper
“Of course, the details of actual surface variations were unknown, and so virtual clearance is merely an indicator of possible adaptations to true ground clearance.”
§ Human walking in the real world: Interactions between terrain type, gait parameters, and energy expenditure > Discussion
hedgedcorrelational- Asserted: passes — The authors put it forward as true.
- Checkable: passes — It can be checked against evidence.
- Load-bearing: fails — The paper’s conclusions may not depend on it.
- Based: passes — The paper gives a reason why it holds.
Probably not a substantial claim. The paper’s conclusions may not depend on it.
- Rests on an assumption: The details of actual surface variations were unknown.
What the paper did — it cites no source for this, so there is none to check. The quote shows it is in the paper.
In the paper
“Stride parameters and energy measures were normalized to account for differences in subject body size and height.”
§ Human walking in the real world: Interactions between terrain type, gait parameters, and energy expenditure > Methods > Experiment
plain- Asserted: passes — The authors put it forward as true.
- Checkable: passes — It can be checked against evidence.
- Load-bearing: passes — The paper’s conclusions depend on it.
- Based: passes — The paper gives a reason why it holds.
Probably not a substantial claim.
None of the sources cited for this claim have been checked yet.
In the paper
“Approximate speed of 1.25 m/s was controlled by following the experimenter, who walked according to GPS speed and attempted to make only gentle speed corrections, to avoid costs for artificial speed fluctuations [24].”
§ Human walking in the real world: Interactions between terrain type, gait parameters, and energy expenditure > Methods > Experiment
What the sources say
- Not checked yetcites [24] N Seethapathi, 2015, The metabolic cost of changing walking speeds is significant, implies lower optimal speeds for shorter distances, and increases daily energy estimates, Biol Lett source
Checked before — its earlier verdict is held back until a new check runs.
plainn = 10- Asserted: passes — The authors put it forward as true.
- Checkable: passes — It can be checked against evidence.
- Load-bearing: passes — The paper’s conclusions depend on it.
- Based: passes — The paper gives a reason why it holds.
Probably not a substantial claim. It may state two separate claims as one.
- Not checked yet
A claim is checked only against the cited paper’s full text, never its abstract, and none is available for its sources.
In the paper
“Overall energy expenditure is also determined by other variables such as carried load, movement speed, and grade or ground slope [3–5], each with readily identifiable effects.”
§ Human walking in the real world: Interactions between terrain type, gait parameters, and energy expenditure > Introduction
What the sources say
- Not checked — no full text of the sourcecites [3] KB Pandolf, 1976, Metabolic energy expenditure and terrain coefficients for walking on snow, Ergonomics source
- Not checked — no full text of the sourcecites [4] KB Pandolf, 1977, Predicting energy expenditure with loads while standing or walking very slowly, J Appl Physiol source
- Not checked — no full text of the sourcecites [5] RG Soule, 1978, Energy expenditure of heavy load carriage, Ergonomics source
plaindirect- Asserted: passes — The authors put it forward as true.
- Checkable: passes — It can be checked against evidence.
- Load-bearing: fails — The paper’s conclusions may not depend on it.
- Based: passes — The paper gives a reason why it holds.
Probably not a substantial claim. The paper’s conclusions may not depend on it. It may state two separate claims as one.
None of the sources cited for this claim have been checked yet.
In the paper
“Walking speed normally fluctuates slightly [29], with correlated fluctuations in stride length [16] consistent with the preferred stride length relationship [30].”
§ Human walking in the real world: Interactions between terrain type, gait parameters, and energy expenditure > Results
What the sources say
- Not checked yetcites [29] SH Collins, 2013, Two independent contributions to step variability during over-ground human walking, PloS One source
Checked before — its earlier verdict is held back until a new check runs.
- Not checked yetcites [16] LV Ojeda, 2015, Influence of contextual task constraints on preferred stride parameters and their variabilities during human walking, Med Eng Phys source
Checked before — its earlier verdict is held back until a new check runs.
- Not checked yetcites [30] DW Grieve, 1968, Gait patterns and the speed of walking, Biomed Eng
plaincorrelational- Asserted: passes — The authors put it forward as true.
- Checkable: passes — It can be checked against evidence.
- Load-bearing: fails — The paper’s conclusions may not depend on it.
- Based: passes — The paper gives a reason why it holds.
Probably not a substantial claim. The paper’s conclusions may not depend on it. It may state two separate claims as one.
- Not checked yet
What the paper did — it cites no source for this, so there is none to check. The quote shows it is in the paper.
In the paper
“Subjects provided written informed consent before the experiment.”
§ Human walking in the real world: Interactions between terrain type, gait parameters, and energy expenditure > Methods > Experiment
plainn = 10- Asserted: passes — The authors put it forward as true.
- Checkable: passes — It can be checked against evidence.
- Load-bearing: fails — The paper’s conclusions may not depend on it.
- Based: passes — The paper gives a reason why it holds.
Probably not a substantial claim. The paper’s conclusions may not depend on it.
None of the sources cited for this claim have been checked yet.
In the paper
“whose signals can be correlated with energy expenditure [e.g., 8–12]”
§ Human walking in the real world: Interactions between terrain type, gait parameters, and energy expenditure > Introduction
What the sources say
- Not checked — no full text of the sourcecites [8] AG Brooks, 2005, Predicting walking METs and energy expenditure from speed or accelerometry, Med Sci Sports Exerc source
- Not checked — no full text of the sourcecites [9] SE Crouter, 2006, A novel method for using accelerometer data to predict energy expenditure, J Appl Physiol Bethesda Md 1985 source
- Not checked yetcites [10] EE Kuffel, 2011, Validity of estimating minute-by-minute energy expenditure of continuous walking bouts by accelerometry, Int J Behav Nutr Phys Act source
Checked before — its earlier verdict is held back until a new check runs.
- Not checked — no full text of the sourcecites [11] HJ Montoye, 1983, Estimation of energy expenditure by a portable accelerometer, Med Sci Sports Exerc source
- Not checked — no full text of the sourcecites [12] C Tudor-Locke, 2002, Utility of pedometers for assessing physical activity: convergent validity, Sports Med Auckl NZ source
plaincorrelational- Asserted: passes — The authors put it forward as true.
- Checkable: passes — It can be checked against evidence.
- Load-bearing: passes — The paper’s conclusions depend on it.
- Based: passes — The paper gives a reason why it holds.
Probably not a substantial claim.
What the paper did — it cites no source for this, so there is none to check. The quote shows it is in the paper.
In the paper
“The study was approved by the University of Michigan Health Sciences Institutional Review Board (HUM00020554).”
§ Human walking in the real world: Interactions between terrain type, gait parameters, and energy expenditure > Methods > Experiment
plain- Asserted: passes — The authors put it forward as true.
- Checkable: passes — It can be checked against evidence.
- Load-bearing: fails — The paper’s conclusions may not depend on it.
- Based: passes — The paper gives a reason why it holds.
Probably not a substantial claim. The paper’s conclusions may not depend on it.
What the paper did — it cites no source for this, so there is none to check. The quote shows it is in the paper.
In the paper
“Subjects walked on each surface, presented in random order, for 8 minutes.”
§ Human walking in the real world: Interactions between terrain type, gait parameters, and energy expenditure > Methods > Experiment
plainn = 10- Asserted: passes — The authors put it forward as true.
- Checkable: passes — It can be checked against evidence.
- Load-bearing: fails — The paper’s conclusions may not depend on it.
- Based: passes — The paper gives a reason why it holds.
Probably not a substantial claim. The paper’s conclusions may not depend on it. It may state two separate claims as one.
What the paper did — it cites no source for this, so there is none to check. The quote shows it is in the paper.
In the paper
“To allow time to reach steady-state, only the last 3 minutes of data from each surface were used for metabolic energy expenditure.”
§ Human walking in the real world: Interactions between terrain type, gait parameters, and energy expenditure > Methods > Experiment
plain- Asserted: passes — The authors put it forward as true.
- Checkable: passes — It can be checked against evidence.
- Load-bearing: passes — The paper’s conclusions depend on it.
- Based: passes — The paper gives a reason why it holds.
Probably not a substantial claim.
A conclusion the paper draws from its own results — it cites no other source for it, so there is none to check. The quote shows it is in the paper.
In the paper
“There were also small changes in stride length and speed with terrain, which may be attributable in part to imperfectly controlled walking speed rather than the terrain itself.”
§ Human walking in the real world: Interactions between terrain type, gait parameters, and energy expenditure > Discussion
hedgedconditional- Asserted: passes — The authors put it forward as true.
- Checkable: passes — It can be checked against evidence.
- Load-bearing: fails — The paper’s conclusions may not depend on it.
- Based: passes — The paper gives a reason why it holds.
Probably not a substantial claim. The paper’s conclusions may not depend on it.
What the paper did — it cites no source for this, so there is none to check. The quote shows it is in the paper.
In the paper
“All of the surfaces were selected to have very little elevation change, in terms of visible undulations, total change (maximum net grade of 0.96% on Gravel), and cross-slope.”
§ Human walking in the real world: Interactions between terrain type, gait parameters, and energy expenditure > Methods
plain- Asserted: passes — The authors put it forward as true.
- Checkable: passes — It can be checked against evidence.
- Load-bearing: passes — The paper’s conclusions depend on it.
- Based: passes — The paper gives a reason why it holds.
Probably not a substantial claim.
In the paper
“Typical values are 1.0 for blacktop surface, 1.2 for light brush, 1.5 for heavy brush, and 2.1 for loose sand [2].”
§ Human walking in the real world: Interactions between terrain type, gait parameters, and energy expenditure > Introduction
What the sources say
- Not checked — no full text of the sourcecites [2] RG Soule, 1972, Terrain coefficients for energy cost prediction, J Appl Physiol source
plaincorrelational- Asserted: passes — The authors put it forward as true.
- Checkable: passes — It can be checked against evidence.
- Load-bearing: fails — The paper’s conclusions may not depend on it.
- Based: passes — The paper gives a reason why it holds.
Probably not a substantial claim. The paper’s conclusions may not depend on it. It may state two separate claims as one.
None of the sources cited for this claim have been checked yet.
In the paper
“Yet another possibility is to use shoe-mounted inertial measurement units (combining accelerometers and gyroscopes) to reconstruct the foot’s path in space and placement on ground [14,15].”
§ Human walking in the real world: Interactions between terrain type, gait parameters, and energy expenditure > Introduction
What the sources say
- Not checked — no full text of the sourcecites [14] L Ojeda, 2007, Non-GPS navigation for security personnel and first responders, J Navig source
- Not checked yetcites [15] JR Rebula, 2013, Measurement of foot placement and its variability with inertial sensors, Gait Posture source
Checked before — its earlier verdict is held back until a new check runs.
plaindirect- Asserted: passes — The authors put it forward as true.
- Checkable: passes — It can be checked against evidence.
- Load-bearing: passes — The paper’s conclusions depend on it.
- Based: passes — The paper gives a reason why it holds.
Probably not a substantial claim. It may state two separate claims as one.
A conclusion the paper draws from its own results — it cites no other source for it, so there is none to check. The quote shows it is in the paper.
In the paper
“Notably, more challenging terrain caused increases in virtual ground clearance and in the variability of most measures, for example of lateral swing motion.”
§ Human walking in the real world: Interactions between terrain type, gait parameters, and energy expenditure > Discussion
plaindirect- Asserted: passes — The authors put it forward as true.
- Checkable: passes — It can be checked against evidence.
- Load-bearing: passes — The paper’s conclusions depend on it.
- Based: passes — The paper gives a reason why it holds.
It may state two separate claims as one.
A conclusion the paper draws from its own results — it cites no other source for it, so there is none to check. The quote shows it is in the paper.
In the paper
“Of course, IMU-based measures are unlikely to replicate the accuracy of a (portable) respirometry system, but IMUs are less obtrusive and easier to wear, especially in real-world conditions, and may still yield data informative of metabolic cost.”
§ Human walking in the real world: Interactions between terrain type, gait parameters, and energy expenditure > Discussion
hedgedcorrelational- Asserted: passes — The authors put it forward as true.
- Checkable: passes — It can be checked against evidence.
- Load-bearing: passes — The paper’s conclusions depend on it.
- Based: passes — The paper gives a reason why it holds.
Probably not a substantial claim. It may state two separate claims as one.
What the paper did — it cites no source for this, so there is none to check. The quote shows it is in the paper.
In the paper
“Walking speed also generally determines stride length [16,29,36], which was not explicitly controlled and differed slightly with terrain.”
§ Human walking in the real world: Interactions between terrain type, gait parameters, and energy expenditure > Discussion
plaincorrelational- Asserted: passes — The authors put it forward as true.
- Checkable: passes — It can be checked against evidence.
- Load-bearing: passes — The paper’s conclusions depend on it.
- Based: passes — The paper gives a reason why it holds.
It may state two separate claims as one.
A conclusion the paper draws from its own results — it cites no other source for it, so there is none to check. The quote shows it is in the paper.
In the paper
“Even though elevation changes were modest on the terrains studied here, a non-zero stride height would generally be expected to indicate how much the body is lifted or lowered against gravity, and therefore drive energy expenditure.”
§ Human walking in the real world: Interactions between terrain type, gait parameters, and energy expenditure > Discussion
hedgedconditional- Asserted: passes — The authors put it forward as true.
- Checkable: passes — It can be checked against evidence.
- Load-bearing: fails — The paper’s conclusions may not depend on it.
- Based: passes — The paper gives a reason why it holds.
Probably not a substantial claim. The paper’s conclusions may not depend on it.
A conclusion the paper draws from its own results — it cites no other source for it, so there is none to check. The quote shows it is in the paper.
In the paper
“Uneven ground appears to disrupt gait to a substantial degree, and would be expected to require substantial active stabilization.”
§ Human walking in the real world: Interactions between terrain type, gait parameters, and energy expenditure > Discussion
hedgedconditional- Asserted: passes — The authors put it forward as true.
- Checkable: passes — It can be checked against evidence.
- Load-bearing: passes — The paper’s conclusions depend on it.
- Based: passes — The paper gives a reason why it holds.
It may state two separate claims as one.
A conclusion the paper draws from its own results — it cites no other source for it, so there is none to check. The quote shows it is in the paper.
In the paper
“These results illustrate the importance of interdependencies among stride parameters, and the complex relationship of cost to gait parameters.”
§ Human walking in the real world: Interactions between terrain type, gait parameters, and energy expenditure > Discussion
boostedcorrelational- Asserted: passes — The authors put it forward as true.
- Checkable: unclear — It is unclear whether it could be checked against evidence.
- Load-bearing: passes — The paper’s conclusions depend on it.
- Based: passes — The paper gives a reason why it holds.
It may state two separate claims as one.
What the paper did — it cites no source for this, so there is none to check. The quote shows it is in the paper.
In the paper
“Our foot path estimation relies on the foot being nearly stationary at some point during stance, which may not occur for every stride on softer terrains such as Woodchips.”
§ Human walking in the real world: Interactions between terrain type, gait parameters, and energy expenditure > Discussion
hedgedconditional- Asserted: passes — The authors put it forward as true.
- Checkable: passes — It can be checked against evidence.
- Load-bearing: passes — The paper’s conclusions depend on it.
- Based: unclear — It is unclear why the paper says it holds.
It may state two separate claims as one.
A conclusion the paper draws from its own results — it cites no other source for it, so there is none to check. The quote shows it is in the paper.
In the paper
“Each location in the world, whatever its classification, may have unique effects on gait, that may nonetheless be quantifiable.”
§ Human walking in the real world: Interactions between terrain type, gait parameters, and energy expenditure > Discussion
hedgedconditional- Asserted: passes — The authors put it forward as true.
- Checkable: fails — It may be too vague to check against evidence.
- Load-bearing: fails — The paper’s conclusions may not depend on it.
- Based: fails — The paper may give no reason why it holds.
Probably not a substantial claim. It may be too vague to check against evidence. The paper’s conclusions may not depend on it. The paper may give no reason why it holds. It may state two separate claims as one.
A conclusion the paper draws from its own results — it cites no other source for it, so there is none to check. The quote shows it is in the paper.
In the paper
“Thus, IMU-derived foot paths are neither absolute nor comprehensive measures.”
§ Human walking in the real world: Interactions between terrain type, gait parameters, and energy expenditure > Discussion
plain- Asserted: passes — The authors put it forward as true.
- Checkable: passes — It can be checked against evidence.
- Load-bearing: passes — The paper’s conclusions depend on it.
- Based: passes — The paper gives a reason why it holds.
It may state two separate claims as one.
A conclusion the paper draws from its own results — it cites no other source for it, so there is none to check. The quote shows it is in the paper.
In the paper
“By itself, stride length was a barely significant correlate of energy cost (Table 2), which could be due in part to an actual effect, and in part to imperfect experimental control of speed.”
§ Human walking in the real world: Interactions between terrain type, gait parameters, and energy expenditure > Discussion
hedgedconditional- Asserted: passes — The authors put it forward as true.
- Checkable: passes — It can be checked against evidence.
- Load-bearing: fails — The paper’s conclusions may not depend on it.
- Based: passes — The paper gives a reason why it holds.
Probably not a substantial claim. The paper’s conclusions may not depend on it. It may state two separate claims as one.
A conclusion the paper draws from its own results — it cites no other source for it, so there is none to check. The quote shows it is in the paper.
In the paper
“In contrast, a few stride measures, such as stride and swing foot variability (Figs 5 and 6) can directly measure a terrain’s effect on gait, and even discriminate among terrains.”
§ Human walking in the real world: Interactions between terrain type, gait parameters, and energy expenditure > Discussion
plaindirect- Asserted: passes — The authors put it forward as true.
- Checkable: passes — It can be checked against evidence.
- Load-bearing: passes — The paper’s conclusions depend on it.
- Based: passes — The paper gives a reason why it holds.
It may state two separate claims as one.
What the paper did — it cites no source for this, so there is none to check. The quote shows it is in the paper.
In the paper
“We based our analysis on a relatively small number of summary measures, but a more intensive approach might be to instead use the actual foot path trajectories directly, including both translation and orientation data.”
§ Human walking in the real world: Interactions between terrain type, gait parameters, and energy expenditure > Discussion
plain- Asserted: passes — The authors put it forward as true.
- Checkable: passes — It can be checked against evidence.
- Load-bearing: fails — The paper’s conclusions may not depend on it.
- Based: passes — The paper gives a reason why it holds.
Probably not a substantial claim. The paper’s conclusions may not depend on it.
A conclusion the paper draws from its own results — it cites no other source for it, so there is none to check. The quote shows it is in the paper.
In the paper
“We find that foot-mounted IMUs appropriately meet the trade-off between data quantity and convenience and practicality for real-world usage.”
§ Human walking in the real world: Interactions between terrain type, gait parameters, and energy expenditure > Discussion
plain- Asserted: passes — The authors put it forward as true.
- Checkable: fails — It may be too vague to check against evidence.
- Load-bearing: passes — The paper’s conclusions depend on it.
- Based: passes — The paper gives a reason why it holds.
Probably not a substantial claim. It may be too vague to check against evidence.
None of the sources cited for this claim have been checked yet.
In the paper
“In addition, inertial data cannot readily discern step width, which also appears to change on uneven terrain [7] and could contribute to energy cost [18].”
§ Human walking in the real world: Interactions between terrain type, gait parameters, and energy expenditure > Discussion
What the sources say
- Not checked — no full text of the sourcecites [7] AS Voloshina, 2013, Biomechanics and energetics of walking on uneven terrain, J Exp Biol source
- Not checked yetcites [18] JM Donelan, 2001, Mechanical and metabolic determinants of the preferred step width in human walking, Proc R Soc Lond B source
Checked before — its earlier verdict is held back until a new check runs.
hedgedconditional- Asserted: passes — The authors put it forward as true.
- Checkable: passes — It can be checked against evidence.
- Load-bearing: fails — The paper’s conclusions may not depend on it.
- Based: passes — The paper gives a reason why it holds.
Probably not a substantial claim. The paper’s conclusions may not depend on it. It may state two separate claims as one.
A conclusion the paper draws from its own results — it cites no other source for it, so there is none to check. The quote shows it is in the paper.
In the paper
“It also exhibits a continuous correlation with energy expenditure, which could potentially have predictive applications.”
§ Human walking in the real world: Interactions between terrain type, gait parameters, and energy expenditure > Discussion
hedgedcorrelational- Asserted: passes — The authors put it forward as true.
- Checkable: passes — It can be checked against evidence.
- Load-bearing: passes — The paper’s conclusions depend on it.
- Based: passes — The paper gives a reason why it holds.
Probably not a substantial claim. It may state two separate claims as one.
A conclusion the paper draws from its own results — it cites no other source for it, so there is none to check. The quote shows it is in the paper.
In the paper
“Although foot motion hardly encompasses all of the gait adaptations for terrain, it is highly sensitive to the type of terrain, and has a discrete ability to categorize or discriminate terrains objectively.”
§ Human walking in the real world: Interactions between terrain type, gait parameters, and energy expenditure > Discussion
plaincorrelational- Asserted: passes — The authors put it forward as true.
- Checkable: passes — It can be checked against evidence.
- Load-bearing: passes — The paper’s conclusions depend on it.
- Based: fails — The paper may give no reason why it holds.
Probably not a substantial claim. The paper may give no reason why it holds. It may state two separate claims as one.
A conclusion the paper draws from its own results — it cites no other source for it, so there is none to check. The quote shows it is in the paper.
In the paper
“Gait measures are unlikely to discriminate better than visual observation, but they do offer continuous quantification of a terrain’s effects.”
§ Human walking in the real world: Interactions between terrain type, gait parameters, and energy expenditure > Discussion
hedged- Asserted: passes — The authors put it forward as true.
- Checkable: passes — It can be checked against evidence.
- Load-bearing: passes — The paper’s conclusions depend on it.
- Based: passes — The paper gives a reason why it holds.
It may state two separate claims as one.
A conclusion the paper draws from its own results — it cites no other source for it, so there is none to check. The quote shows it is in the paper.
In the paper
“Aggregating these various contributions, the overall effect is that uneven ground leads to uneven foot motion and uneven steps.”
§ Human walking in the real world: Interactions between terrain type, gait parameters, and energy expenditure > Discussion
plaindirect- Asserted: passes — The authors put it forward as true.
- Checkable: passes — It can be checked against evidence.
- Load-bearing: passes — The paper’s conclusions depend on it.
- Based: passes — The paper gives a reason why it holds.
It may state two separate claims as one.
What the paper did — it cites no source for this, so there is none to check. The quote shows it is in the paper.
In the paper
“Our interest here was in factors other than speed, which we therefore attempted to control at fixed value across terrains (e.g. 0.5% speed difference between Woodchips and Sidewalk).”
§ Human walking in the real world: Interactions between terrain type, gait parameters, and energy expenditure > Discussion
plain- Asserted: passes — The authors put it forward as true.
- Checkable: passes — It can be checked against evidence.
- Load-bearing: passes — The paper’s conclusions depend on it.
- Based: passes — The paper gives a reason why it holds.
Probably not a substantial claim.
None of the sources cited for this claim have been checked yet.
In the paper
“Variability in stride length and timing [37] and fluctuations in speed [24] have been reported to affect metabolic cost, perhaps due to the effort of varying gait.”
§ Human walking in the real world: Interactions between terrain type, gait parameters, and energy expenditure > Discussion
What the sources say
- Not checked yetcites [37] SM O’Connor, 2012, Energetic cost of walking with increased step variability, Gait Posture source
- Not checked yetcites [24] N Seethapathi, 2015, The metabolic cost of changing walking speeds is significant, implies lower optimal speeds for shorter distances, and increases daily energy estimates, Biol Lett source
Checked before — its earlier verdict is held back until a new check runs.
hedgedconditional- Asserted: passes — The authors put it forward as true.
- Checkable: passes — It can be checked against evidence.
- Load-bearing: fails — The paper’s conclusions may not depend on it.
- Based: passes — The paper gives a reason why it holds.
Probably not a substantial claim. The paper’s conclusions may not depend on it. It may state two separate claims as one.
The paper relies on this without support.
There is presently scant understanding of how terrain affects a person’s actual movements and actions, which are the ultimate determinants of energy expenditure.
“But aside from this overall effect, there is presently scant understanding of how terrain affects a person’s actual movements and actions, which are the ultimate determinants of energy expenditure.”
The paper relies on this without support.
It is challenging to determine the biomechanical adaptations for different terrains.
“It is challenging to determine the biomechanical adaptations for different terrains.”
The paper relies on this without support.
Traditional laboratory measures are difficult to obtain outdoors.
“But such laboratory measures are difficult to obtain outdoors.”
The paper relies on this without support.
The details of actual surface variations were unknown.
“Of course, the details of actual surface variations were unknown”
Claims other papers make about this one
Each is checked against this paper’s own text: does it say what the citing paper says it does?
The source backs part of the claim, not all of it — or backs it for a different population, condition or comparison.
In the citing paper
“Walking outdoors on relatively simple natural surfaces (e.g. grass, gravel, woodchips) can increase walking costs by up to 27% owing to factors such as stride variability and height of swing foot clearance (Kowalsky, Rebula, Ojeda, Adamczyk, & Kuo, 2021)”
From Forest terrains influence walking kinematics among indigenous Tsimane of the Bolivian Amazon (2022) · cites this paper as Kowalsky et al., 2021
Experimental — accuracy not yet measuredThe cited source says what the claim attributes to it.
In the citing paper
“However, the difference would probably be greater than the 24% increase in cost of transport measured by Kowalsky et al. (2021) for participants walking on woodchips vs. a dirt path, because avoiding natural obstacles and maintaining balance in the forest understory would probably require more substantial adjustments to walking kinematics than does walking on woodchips.”
From Forest terrains influence walking kinematics among indigenous Tsimane of the Bolivian Amazon (2022) · cites this paper as Kowalsky et al., 2021
The cited source says what the claim attributes to it.
In the citing paper
“To our knowledge, only Matthis et al. (2018) and Kowalsky et al. (2021) have used IMUs to record walking on complex natural terrains outdoors, and neither report joint kinematics in their study.”
From Forest terrains influence walking kinematics among indigenous Tsimane of the Bolivian Amazon (2022) · cites this paper as Kowalsky et al., 2021
Self-check
Percentages, sums and reported differences re-computed from the paper’s own numbers.
Each contradiction between two passages listed here was confirmed by an independent check.
Rated major: it would touch a result — a value a result rests on, reported and recomputed p-values on opposite sides of the significance level, two passages that conflict with no sign which is right, or a cited work retracted before this paper was published.
In the paper
§ Human walking in the real world: Interactions between terrain type, gait parameters, and energy expenditure > Discussion
“The most notable sensitivities were for variability in stride height, stride width, virtual clearance, and lateral swing motion.”
§ Human walking in the real world: Interactions between terrain type, gait parameters, and energy expenditure > Results
“| (m) | RMS | 0.014±0.002 | 0.016±0.004 | 0.028±0.003 | 0.031±0.003 | 0.044±0.008 | | 2.84e-01 |”
Rated minor: it would not touch a result — a value no result rests on, a p-value that stays on the same side of the significance level, or a conflict that is clerical, resolved elsewhere in the paper, or outside its own findings.
In the paper
§ Human walking in the real world: Interactions between terrain type, gait parameters, and energy expenditure > Results
“For goodness of fit, the top four correlates were mean virtual clearance, and RMS variabilities of virtual clearance, stride height, and stride width. These measures were all strongly significant regressors (at most P = 3.1e-06), although the actual predictive ability was modest, with adjusted R2 ranging 0.29–0.38).”
§ Human walking in the real world: Interactions between terrain type, gait parameters, and energy expenditure > Results
“| Stride width | RMS | 689.3 | ± | 262.6 | 185.1 | 0.14 | 0.35 | † | 3.11e-06 |”
Rated minor: it would not touch a result — a value no result rests on, a p-value that stays on the same side of the significance level, or a conflict that is clerical, resolved elsewhere in the paper, or outside its own findings.
In the paper
§ Human walking in the real world: Interactions between terrain type, gait parameters, and energy expenditure > Discussion
“The most notable sensitivities were for variability in stride height, stride width, virtual clearance, and lateral swing motion.”
§ Human walking in the real world: Interactions between terrain type, gait parameters, and energy expenditure > Results
“| Stride Width | RMS | 0.051±0.009 | 0.056±0.006 | 0.066±0.010 | 0.068±0.008 | 0.099±0.013 | | 4.23e-01 |”
Rated minor: it would not touch a result — a value no result rests on, a p-value that stays on the same side of the significance level, or a conflict that is clerical, resolved elsewhere in the paper, or outside its own findings.
In the paper
§ Human walking in the real world: Interactions between terrain type, gait parameters, and energy expenditure > Results
“the only non-significant measures (P ≥ 0.05) were mean walking speed and lateral swing (mean and variability).”
§ Human walking in the real world: Interactions between terrain type, gait parameters, and energy expenditure > Results
“| Lateral swing | Mean | 89.05 | ± | 494. | 224.6 | -0.01 | 0.00 | * | 0.719 | | | RMS | 2329. | ± | 1729. | 187.4 | 0.06 | 0.07 | †* | 0.00937 |”
Citations
Cites
Biomechanics and motor control of human movement
Winter, D. A. (1990) · Choice Reviews Online · doi:10.5860/choice.28-2135 · Cited by 8,440
Biomechanics and Motor Control of Human Movement
Winter, D. A. (2009) · Wiley eBooks · doi:10.1002/9780470549148 · Cited by 6,112
Principles of geographical information systems
BURROUGH, P. A., & McDonnell, R. A. (1998) · Cited by 4,082
Scaling gait data to body size
Hof, A. L. (1996) · Gait & Posture · doi:10.1016/0966-6362(95)01057-2 · Cited by 1,176
Active control of lateral balance in human walking
Bauby, C. E., & Kuo, A. D. (2000) · Journal of Biomechanics · doi:10.1016/s0021-9290(00)00101-9 · Cited by 851
Self-citationEnergetic Consequences of Walking Like an Inverted Pendulum: Step-to-Step Transitions
Kuo, A. D., Donelan, J. M., & Ruina, A. (2005) · Exercise and Sport Sciences Reviews · doi:10.1097/00003677-200504000-00006 · Cited by 675
Self-citationDonelan, J. M., Kram, R., & Kuo, A. D. (2002) · Journal of Experimental Biology · doi:10.1242/jeb.205.23.3717 · Cited by 670
Self-citationStabilization of Lateral Motion in Passive Dynamic Walking
Kuo, A. D. (1999) · The International Journal of Robotics Research · doi:10.1177/02783649922066655 · Cited by 659
Self-citationUtility of Pedometers for Assessing Physical Activity: Convergent Validity
Tudor-Locke, C., Williams, J. E., Reis, J. P., & Pluto, D. (2002) · Sports Medicine · doi:10.2165/00007256-200232120-00004 · Cited by 649
Derivation of formulae used to calculate energy expenditure in man.
Brockway, J. M. (1987) · PubMed · Cited by 567
Research works printed but not linked: 3
- AR Wu, 2015, Energetic tradeoffs of foot-to-ground clearance during swing phase of walking
- DW Grieve, 1968, Gait patterns and the speed of walking, Biomed Eng, 3, 119
- JC Russ, 2013, Fractal surfaces
Cited by
Sorted by citations
Kirk, C., Küderle, A., Micó-Amigo, M. E., Bonci, T., Paraschiv-Ionescu, A., Ullrich, M., Soltani, A., Gazit, E., Salis, F., Alcock, L., et al. (2024) · Scientific Reports · doi:10.1038/s41598-024-51766-5 · Cited by 86
Challenges and advances in the use of wearable sensors for lower extremity biomechanics
Hafer, J. F., Vitali, R. V., Gurchiek, R. D., Curtze, C., Shull, P. B., & Cain, S. M. (2023) · Journal of Biomechanics · doi:10.1016/j.jbiomech.2023.111714 · Cited by 65
A human lower-limb biomechanics and wearable sensors dataset during cyclic and non-cyclic activities
Scherpereel, K. L., Molinaro, D. D., Inan, O. T., Shepherd, M. K., & Young, A. J. (2023) · Scientific Data · doi:10.1038/s41597-023-02840-6 · Cited by 61
All eyes on you: how researcher presence changes the way you walk
Friesen, K. B., Zhang, Z., Monaghan, P. G., Oliver, G. D., & Roper, J. A. (2020) · Scientific Reports · doi:10.1038/s41598-020-73734-5 · Cited by 58
Embodiment for Robotic Lower-Limb Exoskeletons: A Narrative Review
Hybart, R., & Ferris, D. P. (2022) · IEEE Transactions on Neural Systems and Rehabilitation Engineering · doi:10.1109/tnsre.2022.3229563 · Cited by 49
Metadata
- Authors
- Kowalsky, D. B., Rebula, J. R., Ojeda, L. V., Adamczyk, P. G., & Kuo, A. D.
- Affiliations
- University of Michigan (US)
- ORCID
- Kuo, Arthur D.
- Venue
- PLOS One
- Publisher
- Public Library of Science (PLoS)
- Published
- 2021-01-13
- Volume
- 16
- Issue
- 1
- Pages
- e0228682
- ISSN
- 1932-6203 (ISSN-L)
- PMC
- PMC7806134
- OpenAlex
- W3118943433
- Semantic Scholar
- 660c9f976920ea34525f9f010f69b7ee207ed3aa
- Cited by
- 106
- References
- 42
- Citations by year
- 2026: 21 · 2025: 25 · 2024: 22 · 2023: 16 · 2022: 12 · 2021: 5
- FWCI
- 17.77
- Type
- journal article
- Language
- en
- Open access
- gold
- doi.org
- Licence
- Locations
- PLoS ONE (publishedVersion, cc-by)
- bioRxiv (Cold Spring Harbor Laboratory) (submittedVersion, cc-by-nc)
- Europe PMC (PubMed Central) (publishedVersion, cc-by)
- PubMed Central (publishedVersion, cc-by)
- PubMed (publishedVersion)
- RePEc: Research Papers in Economics (submittedVersion)
- DOAJ (DOAJ: Directory of Open Access Journals) (submittedVersion, cc-by-sa)
- Funders
- Congressionally Directed Medical Research Programs (W81XWH-09-2-0142)
- National Institute on Aging (AG030815)
- Office of Naval Research (ETOWL)
- Topics
- Health Sciences › Health Professions › Physical Therapy, Sports Therapy and Rehabilitation › Balance, Gait, and Falls Prevention
- Physical Sciences › Engineering › Biomedical Engineering › Lower Extremity Biomechanics and Pathologies
- Physical Sciences › Engineering › Biomedical Engineering › Gait Recognition and Analysis
- Keywords
- human walking, outdoor terrain, metabolic cost, gait variability, stride-to-stride variability, foot trajectory, inertial measurement unit, oxygen consumption, uneven terrain, wood chips, gravel, Poaceae, dirt, wearable sensors
- MeSH terms
- Adolescent, Adult, Biomechanical Phenomena, Energy Metabolism, Female, Foot, Gait, Humans, Male, Middle Aged, Oxygen Consumption, Walking, Young Adult
About these checks
Registry, retraction, Cites and statistics results are computed, not judged, with one exception: a printed reference that no index lists is read once by a model before it counts as a citation error. Claims are extracted by a model and kept only when their quote appears verbatim in the text; each cited source is then checked, with a model’s help, for whether it says what the claim relies on. Those verdicts can be wrong — read the claim’s quote and the cited source before relying on one.
A language model drew the claims from the paper on 2026-11-10, under version 3 of the claim definition (model deepseek-v4.1-flash, prompt extract-v3).
A second model labelled each claim on 2026-11-10 (model jev-1.13-20260917, definition revision gold-guideline-v0.2).
Statistics and arithmetic are recomputed, not judged.
Confidence bands are shown only for fields calibrated on our annotated test set. None is calibrated yet, so no band is shown.
What counts as a claim ›How we measure confidence ›How we check this ›
Are you an author, or do you see a problem with this page? Request a review
