

The DOI matches its Crossref record; 13 of the 13 references it cites were found in a registry or an index.
The rodent object-in-context task: A systematic review and meta-analysis of important variables
Abstract
Environmental information plays an important role in remembering events. Information about stable aspects of the environment (here referred to as ‘context’) and the event are combined by the hippocampal system and stored as context-dependent memory. In rodents (such as rats and mice), context-dependent memory is often investigated with the object-in-context task. However, the implementation and interpretation of this task varies considerably across studies. This variation hampers the comparison between studies and—for those who design a new experiment or carry out pilot experiments–the estimation of whether observed behavior is within the expected range. Also, it is currently unclear which of the variables critically influence the outcome of the task. To address these issues, we carried out a preregistered systematic review (PROSPERO CRD42020191340) and provide an up-to-date overview of the animal-, task-, and protocol-related variations in the object-in-context task for rodents. Using a data-driven explorative meta-analysis we next identified critical factors influencing the outcome of this task, such as sex, testbox size and the delay between the learning trials. Based on these observations we provide recommendations on sex, strain, prior arousal, context (size, walls, shape, etc.) and timing (habituation, learning, and memory phase) to create more consensus in the set-up, procedure, and interpretation of the object-in-context task for rodents. This could contribute to a more robust and evidence-based design in future animal experiments.
Overview
The claims and statistics of this paper haven’t been checked yet.
Run the check — free, no account needed. It reads the open-access text and checks the sources it cites.
Integrity signals
Registry
Cites
Statistics
Figures
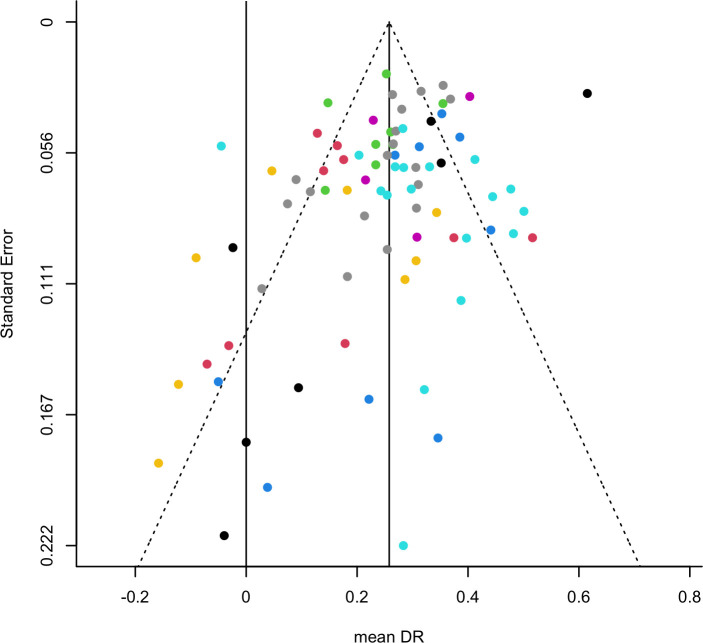
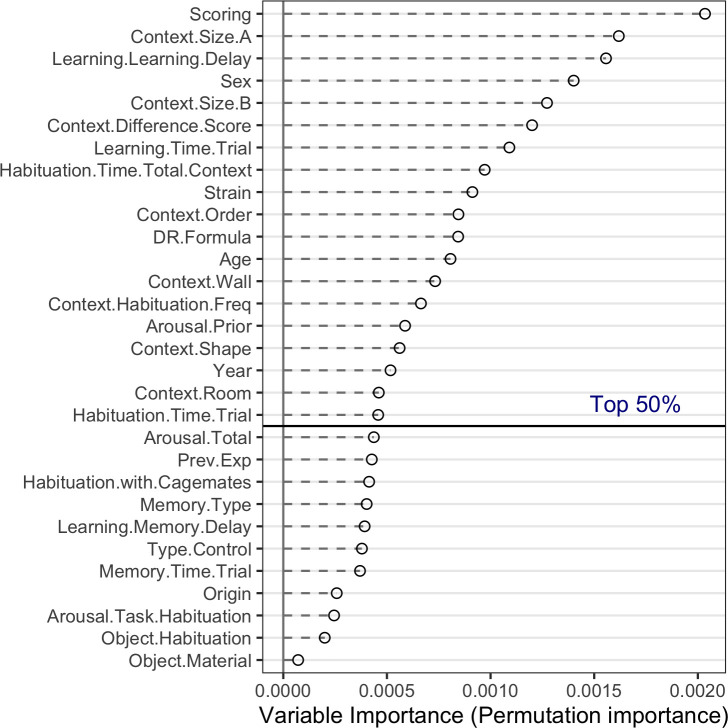
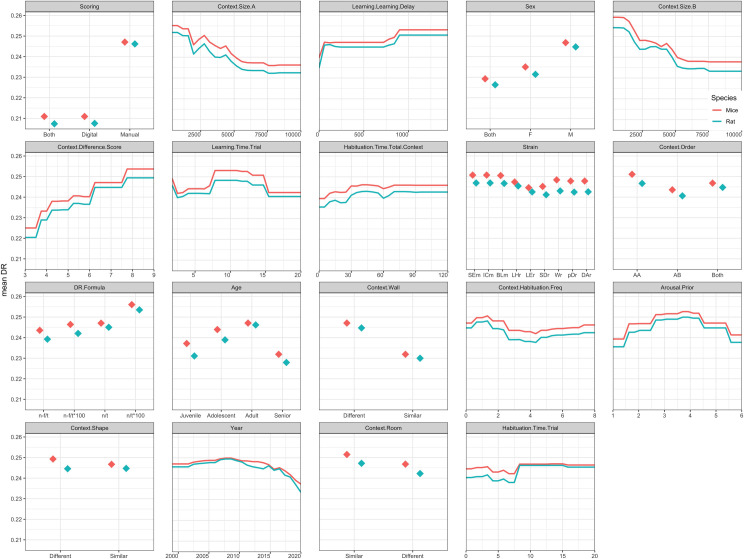
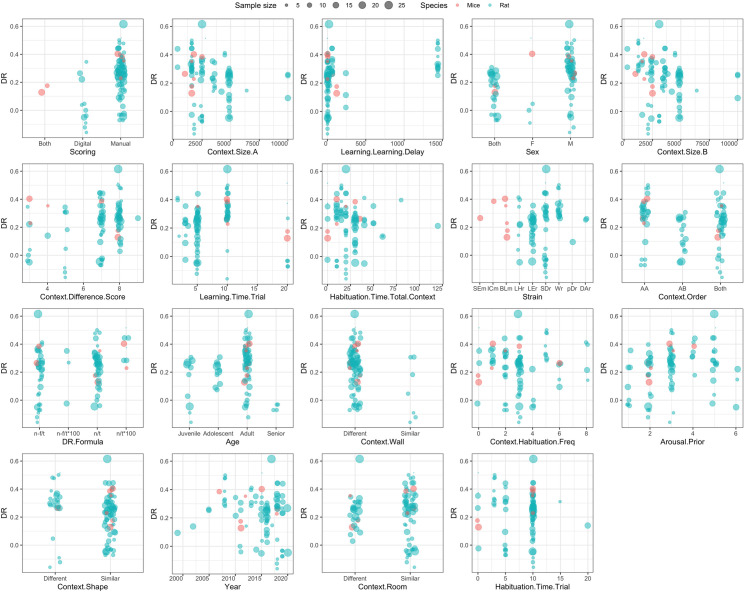
Verification
Claims the paper makes
The claims and statistics of this paper haven’t been checked yet.
Run the check — free, no account needed. It reads the open-access text and checks the sources it cites.
Claims other papers make about this one
Each is checked against this paper’s own text: does it say what the citing paper says it does?
In the citing paper
“while others produce higher Loss scores with low variation between models, indicating a more challenging task [33,47].”
From Large-scale simulation study of active learning models for systematic reviews (2025) · cites this paper as [47]
Self-check
Percentages, sums and reported differences re-computed from the paper’s own numbers.
The self-check needs the paper’s full text.
Citations
Cites
Faul, F., Erdfelder, E., Lang, A.-G., & Buchner, A. (2007) · Behavior Research Methods · doi:10.3758/bf03193146 · Cited by 65,971
The ARRIVE guidelines 2.0: Updated guidelines for reporting animal research
Percie du Sert, N., Hurst, V., Ahluwalia, A., Alam, S., Avey, M. T., Baker, M., Browne, W. J., Clark, A., Cuthill, I. C., Dirnagl, U., et al. (2020) · PLOS Biology · doi:10.1371/journal.pbio.3000410 · Cited by 5,939
Item, context and relational episodic encoding in humans
Davachi, L. (2006) · Current Opinion in Neurobiology · doi:10.1016/j.conb.2006.10.012 · Cited by 1,138
Choosing effect measures and computing estimates of effect
Higgins, J. P., Li, T., & Deeks, J. J. (2019) · Cochrane Handbook for Systematic Reviews of Interventions · doi:10.1002/9781119536604.ch6 · Cited by 977 · cited 1×
“7785 (SD = SE � p n unique animals in meta-analysis [51] = 0.”
BackgroundEnvironmental context-dependent memory: a review and meta-analysis
Smith, S. M., & Vela, E. (2001) · Psychonomic Bulletin & Review · doi:10.3758/bf03196157 · Cited by 900
Kilkenny, C., Parsons, N., Kadyszewski, E., Festing, M. F. W., Cuthill, I. C., Fry, D., Hutton, J., & Altman, D. G. (2009) · PLoS ONE · doi:10.1371/journal.pone.0007824 · Cited by 860
Diamond, D. M., Campbell, A. M., Park, C. R., Halonen, J., & Zoladz, P. R. (2007) · Neural Plasticity · doi:10.1155/2007/60803 · Cited by 762 · cited 1×
“Inverted U-shaped dose-dependency is a common phenomenon in stress-related influences on memory formation [78].”
BackgroundHippocampal damage and exploratory preferences in rats: memory for objects, places, and contexts
Mumby, D. G., Gaskin, S., Glenn, M. J., Schramek, T. E., & Lehmann, H. (2002) · Learning & Memory · doi:10.1101/lm.41302 · Cited by 714
Rao, R. P., Anilkumar, S., McEwen, B. S., & Chattarji, S. (2012) · Biological Psychiatry · doi:10.1016/j.biopsych.2012.04.008 · Cited by 131
The Hippocampus Generalizes across Memories that Share Item and Context Information
Libby, L. A., Reagh, Z. M., Bouffard, N. R., Ragland, J. D., & Ranganath, C. (2019) · Journal of Cognitive Neuroscience · doi:10.1162/jocn_a_01345 · Cited by 42
Research works printed but not linked: 65
- JW Rudy, 2009, Context representations, context functions, and the parahippocampal-hippocampal system., Learn Mem, 16, 573, 10.1101/lm.1494409 · DOI · Paper page
- S Maren, 2013, The contextual brain: implications for fear conditioning, extinction and psychopathology., Nat Publ Gr., 14, 417
- DR Godden, 1975, Context-dependent memory in two natural environments: on land and underwater., Br J Psychol, 66, 325, 10.1111/j.2044-8295.1975.tb01468.x · DOI
- D De Quervain, 2017, Stress, glucocorticoids and memory: implications for treating fear-related disorders., Nat Publ Gr, 18, 7
- S Lissek, 2010, Overgeneralization of Conditioned Fear as a Pathogenic Marker of Panic Disorder., Am J Psychiatry., 167, 47, 10.1176/appi.ajp.2009.09030410 · DOI · Paper page
- M El, 2013, Context Memory in Alzheimer’s Disease
- GP Urcelay, 2014, The functions of contexts in associative learning., Behavioural Processes., 2, 10.1016/j.beproc.2014.02.008 · DOI
- MSC Sep, 2019, Time-dependent effects of psychosocial stress on the contextualization of neutral memories., Psychoneuroendocrinology, 108, 140, 10.1016/j.psyneuen.2019.06.021 · DOI
- D Clewett, 2019, Transcending time in the brain: How event memories are constructed from experience, Hippocampus, 29, 162, 10.1002/hipo.23074 · DOI
- Y Ezzyat, 2014, Similarity Breeds Proximity: Pattern Similarity within and across Contexts Is Related to Later Mnemonic Judgments of Temporal Proximity, Neuron, 81, 1179, 10.1016/j.neuron.2014.01.042 · DOI · Paper page
- D Clewett, 2020, Pupil-linked arousal signals track the temporal organization of events in memory., Nat Commun, 11, 4007, 10.1038/s41467-020-17851-9 · DOI · Paper page
- T Staudigl, 2013, Theta Oscillations at Encoding Mediate the Context-Dependent Nature of Human Episodic Memory, Curr Biol, 23, 1101, 10.1016/j.cub.2013.04.074 · DOI
- VA van Ast, 2014, Cortisol mediates the effects of stress on the contextual dependency of memories., Psychoneuroendocrinology., 41, 97, 10.1016/j.psyneuen.2013.12.007 · DOI
- AP Yonelinas, 2019, A contextual binding theory of episodic memory: systems consolidation reconsidered., Nat Rev Neurosci, 20, 364, 10.1038/s41583-019-0150-4 · DOI
- SL Dix, 1999, Extending the spontaneous preference test of recognition: Evidence of object-location and object-context recognition., Behav Brain Res
- MA Good, 2007, Context- but not familiarity-dependent forms of object recognition are impaired following excitotoxic hippocampal lesions in rats., Behav Neurosci, 121, 218, 10.1037/0735-7044.121.1.218 · DOI
- M La Spina, 2019, Pterostilbene Improves Cognitive Performance in Aged Rats: An in Vivo Study, Cell Physiol Biochem, 52, 232, 10.33594/000000017 · DOI
- R De Rosa, 2005, rescues recognition memory deficits in AD11 anti-NGF transgenic mice, Proc Natl Acad Sci U S A, 102, 3811, 10.1073/pnas.0500195102 · DOI
- EM Rodberg, 2017, Stress Facilitates the Development of Cognitive Dysfunction After Chronic Ethanol Exposure, Alcohol Clin Exp Res, 41, 1574, 10.1111/acer.13444 · DOI
- AG Pillai, 2018, Early life stress determines the effects of glucocorticoids and stress on hippocampal function: Electrophysiological and behavioral evidence respectively, Neuropharmacology, 133, 307, 10.1016/j.neuropharm.2018.02.001 · DOI
- A Ennaceur, 1988, A new one-trial test for neurobiological studies of memory in rats. 1: Behavioral data., Behav Brain Res, 31, 47, 10.1016/0166-4328(88)90157-X · DOI · Paper page
- A. Ennaceur, 2010, One-trial object recognition in rats and mice: methodological and theoretical issues, Behav Brain Res, 215, 244, 10.1016/j.bbr.2009.12.036 · DOI · Paper page
- RBM de Vries, 2015, A protocol format for the preparation, registration and publication of systematic reviews of animal intervention studies., Evidence-based Preclin Med, 2, e00007, 10.1002/ebm2.7 · DOI
- M Leenaars, 2012, A step-by-step guide to systematically identify all relevant animal studies., Lab Anim., 46, 24, 10.1258/la.2011.011087 · DOI
- D Moher, 2009, Preferred Reporting Items for Systematic Reviews and Meta-Analyses: The PRISMA Statement., PLoS Med., 6, e1000097, 10.1371/journal.pmed.1000097 · DOI · Paper page
- M Vellinga, 2020, Measuring context-dependent memory in rodents: a systematic review and meta-analysis of important variables in the object in context-task (CRD42020191340)., PROSPERO.
- JA Huwaldt, 2015, Plot Digitizer., Source Forge
- M Antunes, 2012, The novel object recognition memory: neurobiology, test procedure, and its modifications., Cogn Process, 13, 93, 10.1007/s10339-011-0430-z · DOI · Paper page
- CR Hooijmans, 2014, SYRCLE’s risk of bias tool for animal studies., BMC Med Res Methodol., 14, 43, 10.1186/1471-2288-14-43 · DOI · Paper page
- V Bonapersona, 2019, The behavioral phenotype of early life adversity: A 3-level meta-analysis of rodent studies., Neurosci Biobehav Rev., 102, 299, 10.1016/j.neubiorev.2019.04.021 · DOI
- R Core Team, 2020, R: A language and environment for statistical computing
- H Wickham, 2020, dplyr: A Grammar of Data Manipulation., R package version 1.0.2.
- A Wolen, 2020, osfr: An R Interface to the Open Science Framework., J Open Source Softw, 5, 2071, 10.21105/joss.02071 · DOI
- W. Viechtbauer, 2010, Conducting Meta-Analyses in R with the metafor Package., J Stat Softw., 36, 1, 10.18637/jss.v036.i03 · DOI · Paper page
- H. Wickham, 2016, ggplot2: Elegant Graphics for Data Analysis, 10.1007/978-3-319-24277-4 · DOI
- M Borenstein, 2009, Introduction to Meta-Analysis, 10.1002/9780470743386 · DOI · Paper page
- JPT Higgins, 2003, Measuring inconsistency in meta-analyses, British Medical Journal
- R. Rosenthal, 1979, The file drawer problem and tolerance for null results
- S Duval, 2000, Trim and fill: A simple funnel-plot-based method of testing and adjusting for publication bias in meta-analysis, Biometrics
- M Egger, 1997, Bias in meta-analysis detected by a simple, graphical test, BMJ, 315, 629, 10.1136/bmj.315.7109.629 · DOI · Paper page
- CB Begg, 1994, Operating Characteristics of a Rank Correlation Test for Publication Bias, Biometrics
- W Viechtbauer, 2010, Outlier and influence diagnostics for meta-analysis., Res Synth Methods.
- DW Apley, 2020, Visualizing the effects of predictor variables in black box supervised learning models., J R Stat Soc Ser B Stat Methodol, 82, 1059, 10.1111/rssb.12377 · DOI · Paper page
- J. Cohen, 1969, Statistical power analysis for the behavioural sciences
- RP Kesner, 2018, An analysis of dentate gyrus function (an update)., Behav Brain Res, 354, 84, 10.1016/j.bbr.2017.07.033 · DOI
- C Kilkenny, 2010, Improving Bioscience Research Reporting: The ARRIVE Guidelines for Reporting Animal Research, PLoS Biol, 8, e1000412, 10.1371/journal.pbio.1000412 · DOI · Paper page
- A Antonic, 2013, Stem Cell Transplantation in Traumatic Spinal Cord Injury: A Systematic Review and Meta-Analysis of Animal Studies., PLoS Biol, 11, e1001738, 10.1371/journal.pbio.1001738 · DOI
- A Verbitsky, 2020, Rodent models of post-traumatic stress disorder: behavioral assessment., Transl Psychiatry, 10, 132, 10.1038/s41398-020-0806-x · DOI
- JPA Ioannidis, 2014, Increasing value and reducing waste in research design, conduct, and analysis, Lancet, 383, 166, 10.1016/S0140-6736(13)62227-8 · DOI · Paper page
- R Watzlawick, 2019, Outcome heterogeneity and bias in acute experimental spinal cord injury: A meta-analysis, Neurology, 93, e40, 10.1212/WNL.0000000000007718 · DOI
- ML Head, 2015, The Extent and Consequences of P-Hacking in Science, PLOS Biol, 13, e1002106, 10.1371/journal.pbio.1002106 · DOI · Paper page
- C. Van Lissa, 2017, MetaForest: Exploring heterogeneity in meta-analysis using random forests
- V Bonapersona, 2021, Increasing the statistical power of animal experiments with historical control data, Nat Neurosci
- R Blaser, 2015, Spontaneous object recognition: a promising approach to the comparative study of memory., Front Behav Neurosci, 9, 183, 10.3389/fnbeh.2015.00183 · DOI
- S Binder, 2015, A critical appraisal of the what-where-when episodic-like memory test in rodents: Achievements, caveats and future directions, Prog Neurobiol, 130, 71, 10.1016/j.pneurobio.2015.04.002 · DOI
- MSC Sep, 2020, Individual differences in the encoding of contextual details following acute stress: An explorative study, Eur J Neurosci
- K Imuta, 2018, Children’s learning and memory of an interactive science lesson: Does the context matter?, Dev Psychol., 54, 1029, 10.1037/dev0000487 · DOI
- PS Powell, 2018, Decoding selective attention to context memory: An aging study., Neuroimage, 181, 95, 10.1016/j.neuroimage.2018.06.085 · DOI
- J Strunk, 2017, Age-related changes in neural oscillations supporting context memory retrieval., Cortex, 91, 40, 10.1016/j.cortex.2017.01.020 · DOI
- GW Kirschen, 2019, Young at heart: Insights into hippocampal neurogenesis in the aged brain, Behav Brain Res, 369, 111934, 10.1016/j.bbr.2019.111934 · DOI
- MJ Alam, 2018, Adult neurogenesis conserves hippocampal memory capacity, J Neurosci, 38, 6854, 10.1523/JNEUROSCI.2976-17.2018 · DOI
- JM Andreano, 2009, Sex influences on the neurobiology of learning and memory., Learn Mem., 16, 248, 10.1101/lm.918309 · DOI
- RJ Keeley, 2015, Strain and sex differences in brain and behaviour of adult rats: Learning and memory, anxiety and volumetric estimates., Behav Brain Res., 288, 118, 10.1016/j.bbr.2014.10.039 · DOI · Paper page
- S Yagi, 2019, Sex differences in hippocampal cognition and neurogenesis, Neuropsychopharmacology, 44, 200, 10.1038/s41386-018-0208-4 · DOI
- CWEM Quaedflieg, 2018, Memory dynamics under stress., Memory, 26, 364, 10.1080/09658211.2017.1338299 · DOI
Cited by
Sep, M. S. C., Geuze, E., & Joëls, M. (2023) · Translational Psychiatry · doi:10.1038/s41398-023-02660-7 · Cited by 39
“The analytic strategy is based on earlier work of our group [53, 54] and performed with α = 0.05 in R version 4.0.3 [55], with the use of packages dplyr [56], purr [57], tidyr [58], osfr [59], metafor [60], metaforest [61], caret [62], metacart [63], ggplot2 [64], ggpubr [65], gridExtra [66], Gmisc…”
MethodInfluentialSelf-citationLarge-scale simulation study of active learning models for systematic reviews
Teijema, J. J., de Bruin, J., Bagheri, A., & van de Schoot, R. (2025) · International Journal of Data Science and Analytics · doi:10.1007/s41060-025-00777-0 · Cited by 13
Metadata
- Authors
- Sep, M. S. C., Vellinga, M., Sarabdjitsingh, R. A., & Joëls, M.
- Venue
- PLOS ONE
- Publisher
- Public Library of Science (PLoS)
- Published
- 2021-07-16
- Volume
- 16
- Issue
- 7
- Pages
- e0249102
- ISSN
- 1932-6203
- PMC
- PMC8284613
- Cited by
- 17
- References
- 13
- Language
- en
- Funders
- ZonMw (114024150)
- Nederlandse Organisatie voor Wetenschappelijk Onderzoek (022.003.003)
- ministerie van defensie
- Ministerie van Onderwijs, Cultuur en Wetenschap (024.001.003)
About these checks
Registry, retraction, Cites and statistics results are computed, not judged, with one exception: a printed reference that no index lists is read once by a model before it counts as a citation error. Claims are extracted by a model and kept only when their quote appears verbatim in the text; each cited source is then checked, with a model’s help, for whether it says what the claim relies on. Those verdicts can be wrong — read the claim’s quote and the cited source before relying on one.
Statistics and arithmetic are recomputed, not judged.
Confidence bands are shown only for fields calibrated on our annotated test set. None is calibrated yet, so no band is shown.
What counts as a claim ›How we measure confidence ›How we check this ›
Are you an author, or do you see a problem with this page? Request a review
Data sources
Bibliographic data: Semantic Scholar, OpenAlex, Crossref.
Contains information from the Semantic Scholar Academic Graph Datasets, made available under the ODC Attribution License (ODC-BY 1.0).
Semantic Scholar’s data is described in: Kinney, R., et al. (2023). The Semantic Scholar Open Data Platform. arXiv:2301.10140.
