

The DOI matches its Crossref record; 36 of the 38 references it cites were found in a registry or an index.
Dendritic spines of CA 1 pyramidal cells in the rat hippocampus: serial electron microscopy with reference to their biophysical characteristics
Open accessAbstract
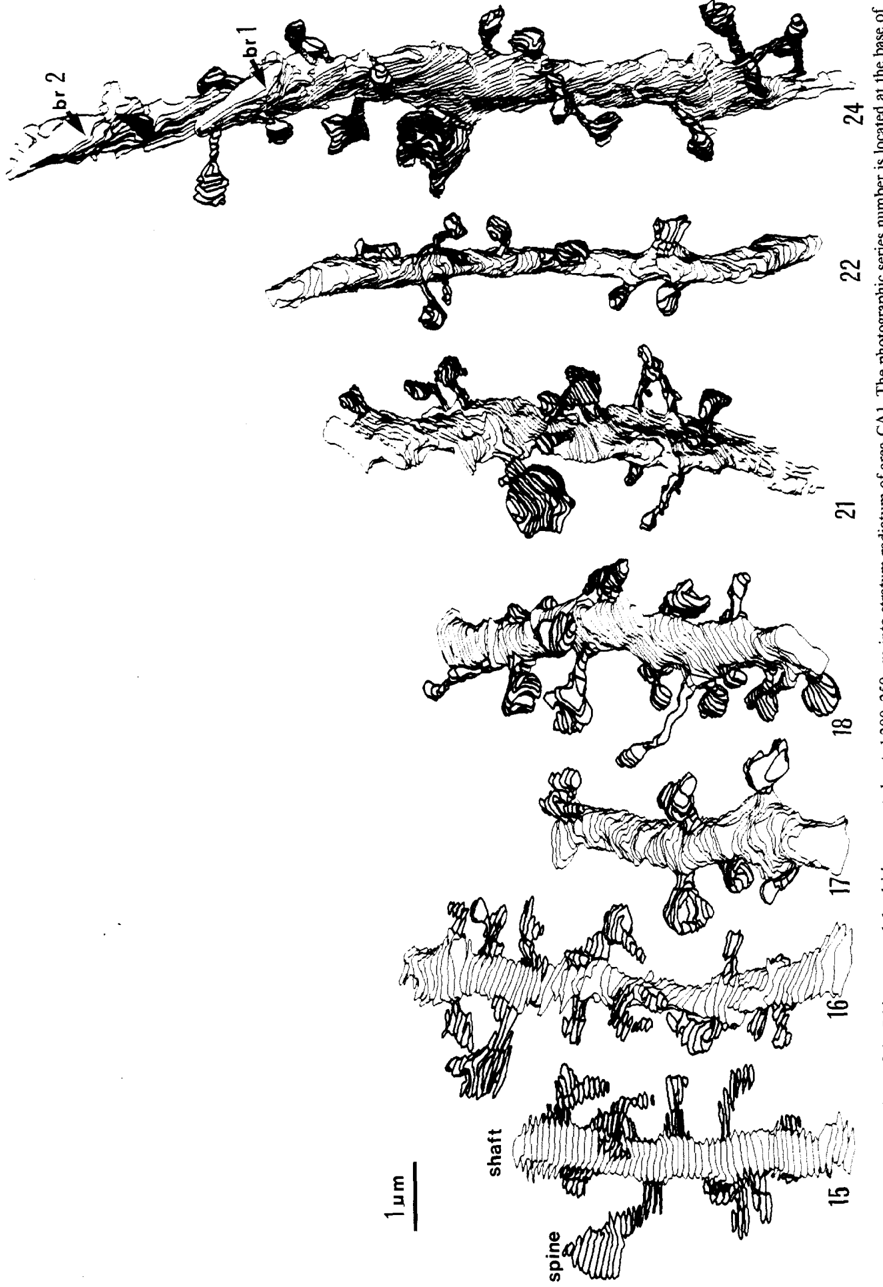
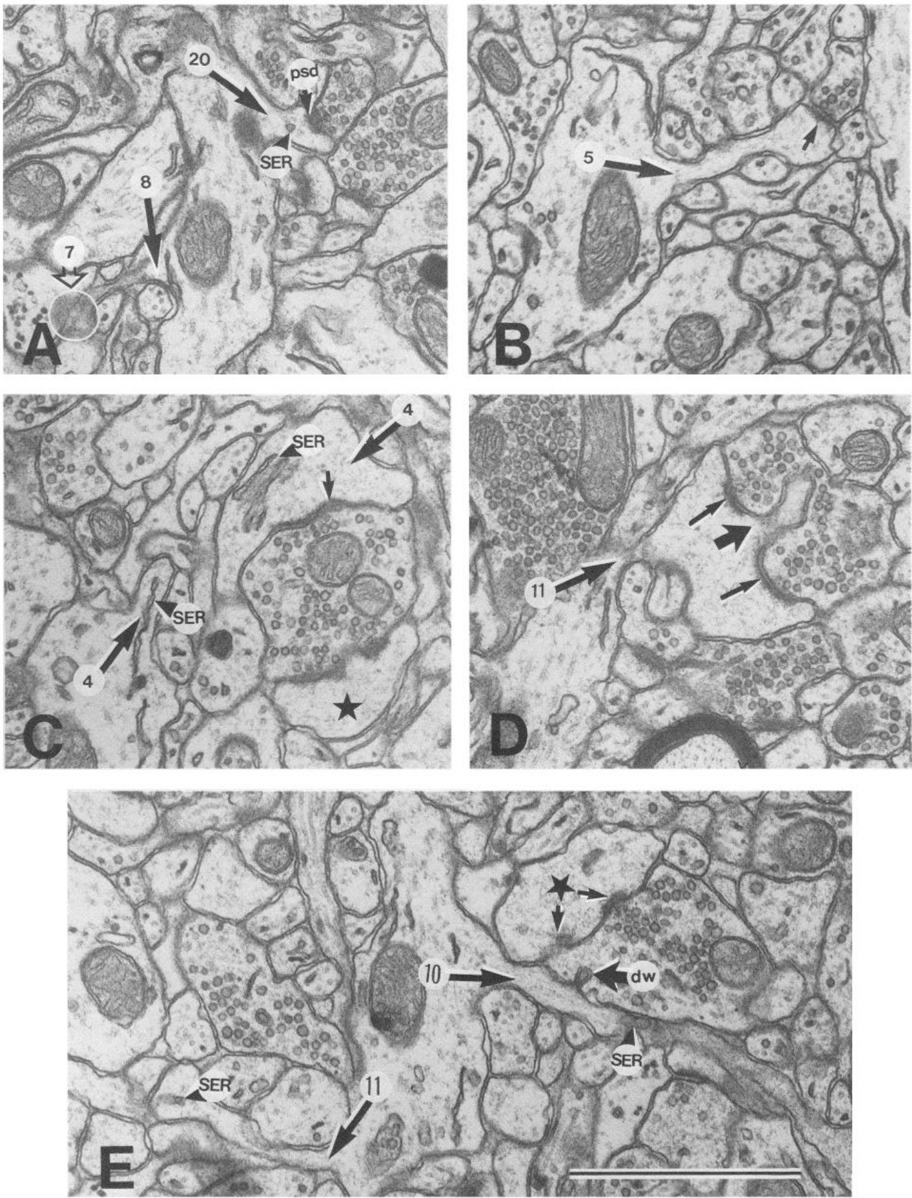
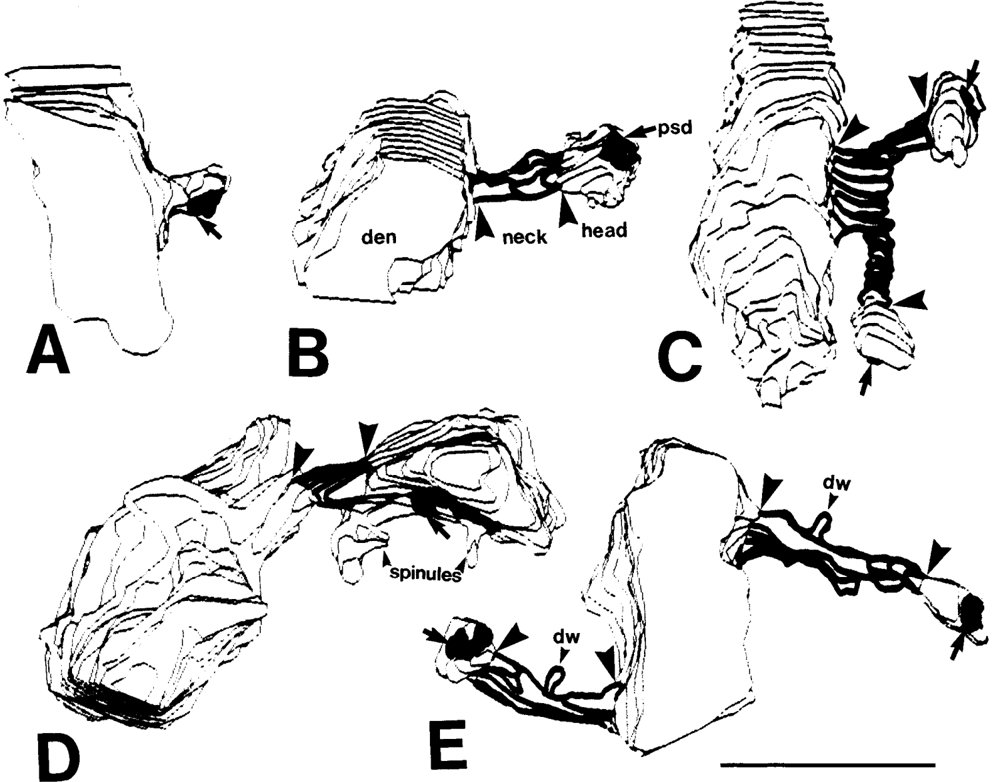
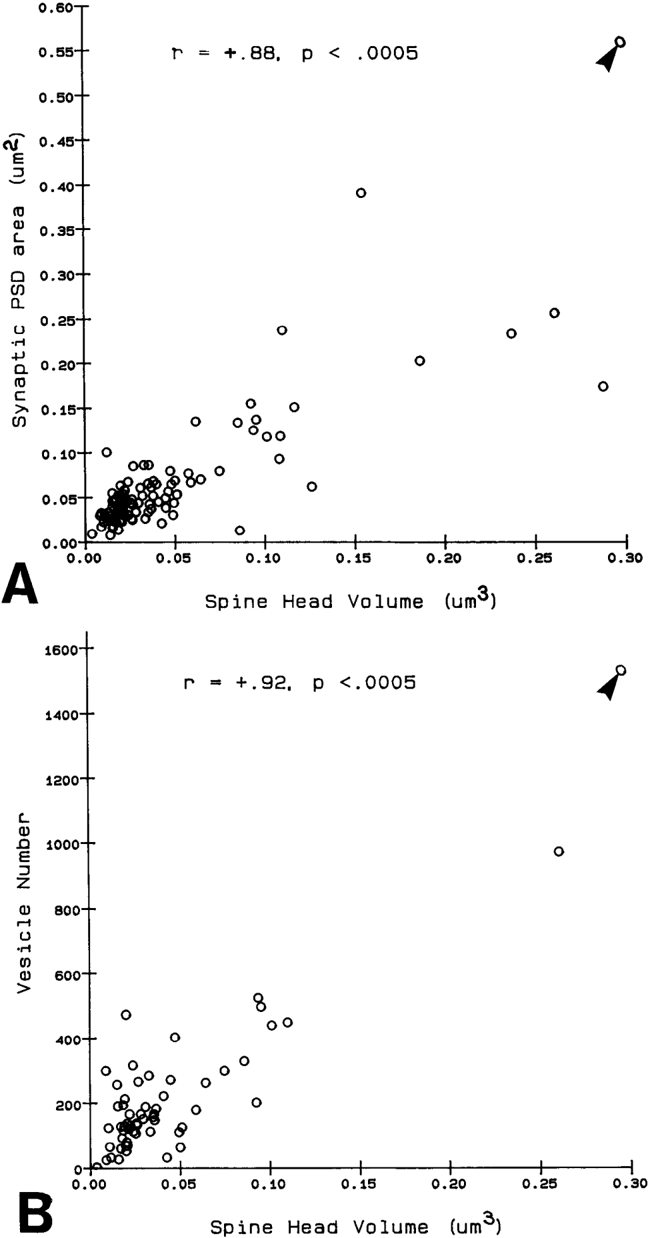
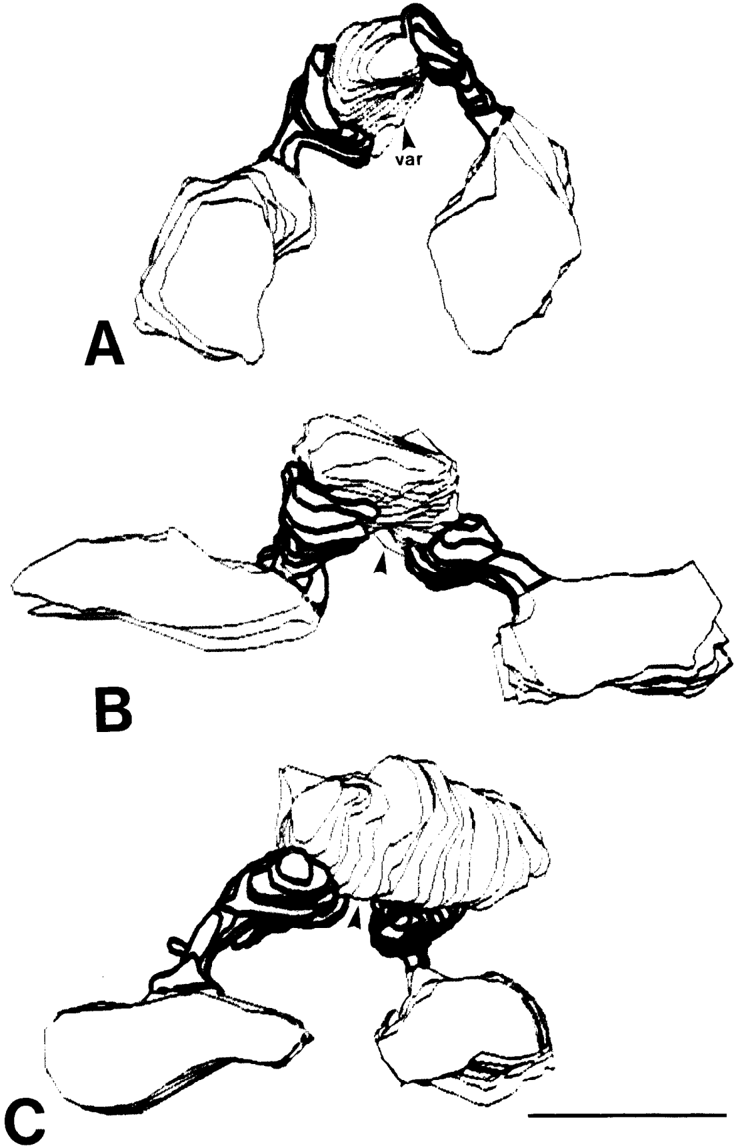
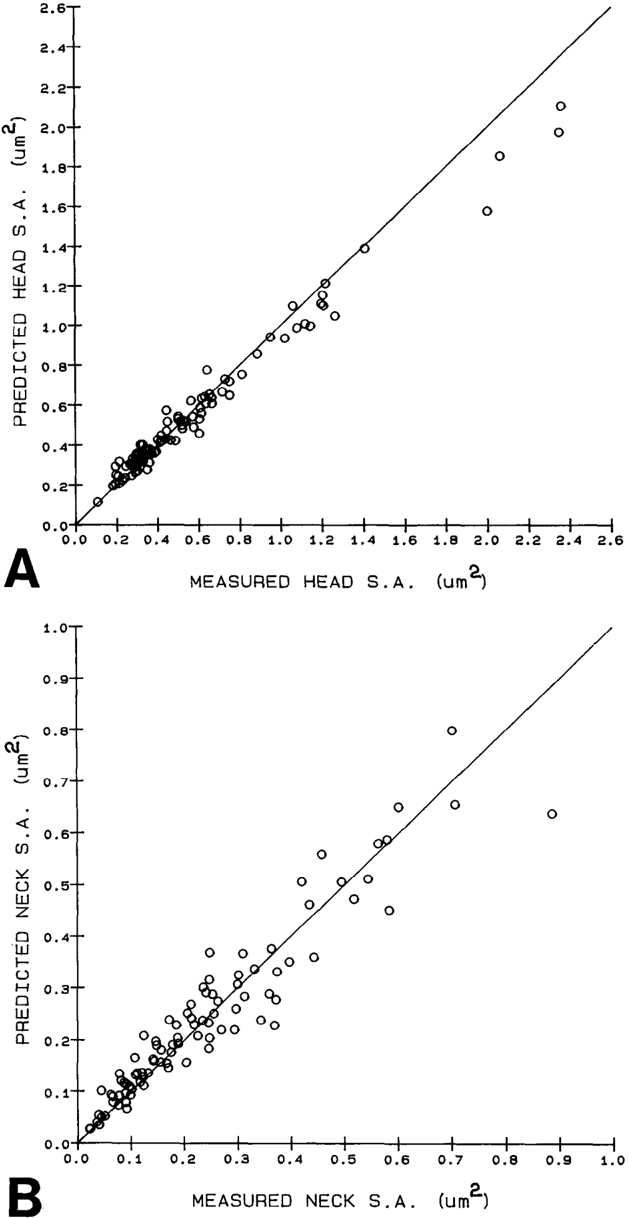
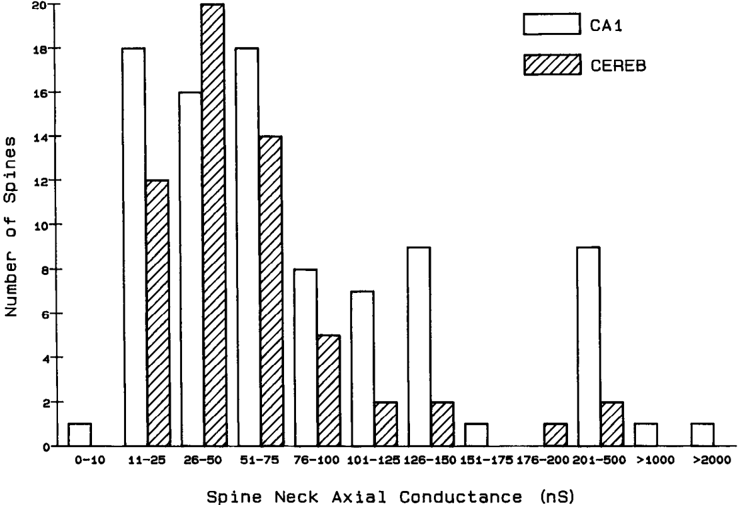
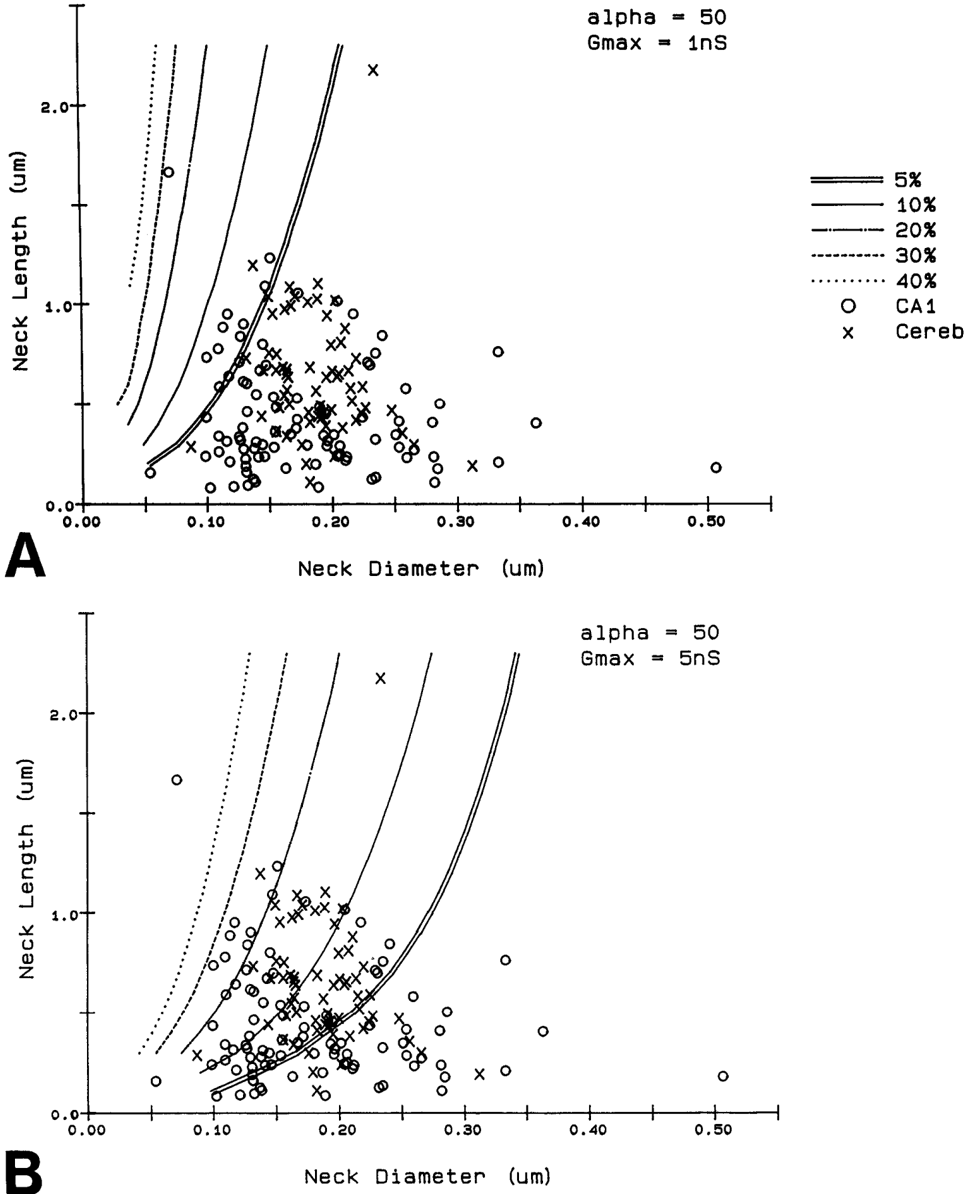
Serial electron microscopy and 3-D reconstructions of dendritic spines from hippocampal area CA 1 dendrites were obtained to evaluate 2 questions about relationships between spine geometry and synaptic efficacy. First, under what biophysical conditions are the spine necks likely to reduce the magnitude of charge transferred from the synapses on the spine heads to the recipient dendrite? Simulation software provided by Charles Wilson (1984) was used to determine that if synaptic conductance is 1 nS or less, only 1% of the hippocampal spine necks are sufficiently thin and long to reduce charge transfer by more than 10%. If synaptic conductance approaches 5 nS, however, 33% of the hippocampal spine necks are sufficiently thin and long to reduce charge transfer by more than 10%. Second, is spine geometry associated with other anatomical indicators of synaptic efficacy, including the area of the postsynaptic density and the number of vesicles in the presynaptic axon? Reconstructed spines were graphically edited into head and neck compartments, and their dimensions were measured, the areas of the postsynaptic densities (PSD) were measured, and all of the vesicles in the presynaptic axonal varicosities were counted. The dimensions of the spine head were well correlated with the area of PSD and the number of vesicles in the presynaptic axonal varicosity. Spine neck diameter and length were not correlated with PSD area, head volume, or the number of vesicles. These results suggest that the dimensions of the spine head, but not the spine neck, reflect differences in synaptic efficacy. We suggest that the constricted necks of hippocampal dendritic spines might reduce diffusion of activated molecules to neighboring synapses, thereby attributing specificity to activated or potentiated synapses.
Overview
The claims and statistics of this paper haven’t been checked yet.
Run the check — free, no account needed. It reads the open-access text and checks the sources it cites.
Integrity signals
Registry
Cites
Statistics
Figures
Verification
Claims the paper makes
The claims and statistics of this paper haven’t been checked yet.
Run the check — free, no account needed. It reads the open-access text and checks the sources it cites.
Claims other papers make about this one
Each is checked against this paper’s own text: does it say what the citing paper says it does?
The source backs part of the claim, not all of it — or backs it for a different population, condition or comparison.
In the citing paper
“This is probably one of the reasons why many ultrastructural studies that utilized high concentrations of potassium ferrocyanide/ferricyanide (1.5–3.0%) provided no data on SS (e.g., Harris and Stevens, 1989; Hayworth et al., 2014; Yakoubi et al., 2019a; Yin et al., 2020; Gour et al., 2021; Phelps et al., 2021; Peddie et al., 2022; Turner et al., 2022).”
From Unambiguous identification of asymmetric and symmetric synapses using volume electron microscopy (2024) · cites this paper as Harris and Stevens, 1989
Experimental — accuracy not yet measuredThe source backs part of the claim, not all of it — or backs it for a different population, condition or comparison.
In the citing paper
“Given that each spine receives only one synaptic input13, our data indicate the highest possible degree of freedom is available in synaptic connections in the dendrites, which has been assumed in the learning models of most neural network theories17.”
From Dendritic spine geometry is critical for AMPA receptor expression in hippocampal CA1 pyramidal neurons (2001) · cites this paper as [13]
Experimental — accuracy not yet measuredThe source backs part of the claim, not all of it — or backs it for a different population, condition or comparison.
In the citing paper
“This observation suggests that the expression of AMPA receptors is controlled independently at a level of the individual spine, consistent with the classical notion that a single spine may behave as an independent chemical compartment to regulate synaptic transmission13, 14.”
From Dendritic spine geometry is critical for AMPA receptor expression in hippocampal CA1 pyramidal neurons (2001) · cites this paper as [13]
Experimental — accuracy not yet measuredThe source backs part of the claim, not all of it — or backs it for a different population, condition or comparison.
In the citing paper
“Regions of glutamate sensitivity tended to be asymmetrically localized to one portion of a spine (Figs. 3h and 4c–j), consistent with the predominant localization of AMPA receptors within PSDs with a diameter of 0.1 to 0.5μm13, 19, 20.”
From Dendritic spine geometry is critical for AMPA receptor expression in hippocampal CA1 pyramidal neurons (2001) · cites this paper as [13]
Experimental — accuracy not yet measuredThe source backs part of the claim, not all of it — or backs it for a different population, condition or comparison.
In the citing paper
“Syn1a-CFP puncta area calculated as a measure of bouton area, which correlated with pHuse area, as expected42.”
From A trans-synaptic nanocolumn aligns neurotransmitter release to receptors (2016) · cites this paper as [42]
Experimental — accuracy not yet measured
The source backs part of the claim, not all of it — or backs it for a different population, condition or comparison.
In the citing paper
“In turn, the size of the postsynaptic density is correlated with the number of presynaptic vesicles, the number of postsynaptic receptors and the ready-releasable pool of transmitter (Harris and Stevens, 1989; Nusser et al., 1998; Schikorski and Stevens, 1999, 2001; Arellano et al., 2007a).”
From The influence of phospho-tau on dendritic spines of cortical pyramidal neurons in patients with Alzheimer’s disease (2013) · cites this paper as Harris and Stevens, 1989
Experimental — accuracy not yet measuredThe source backs part of the claim, not all of it — or backs it for a different population, condition or comparison.
In the citing paper
“Additionally, the volume of the dendritic spine head is related to the size of the postsynaptic density (Harris and Stevens, 1989; Schikorski and Stevens, 1997; Arellano et al., 2007b), the number of presynaptic vesicles, and the number of vesicles adjacent to the presynaptic cleft (Harris and Stevens, 1989).”
From The influence of phospho-tau on dendritic spines of cortical pyramidal neurons in patients with Alzheimer’s disease (2013) · cites this paper as Harris and Stevens, 1989
Experimental — accuracy not yet measuredThe source backs part of the claim, not all of it — or backs it for a different population, condition or comparison.
In the citing paper
“Furthermore, the volume of the head is directly proportional to the strength of synaptic currents (Harris and Stevens, 1989; Schikorski and Stevens, 1997; Arellano et al., 2007a).”
From The influence of phospho-tau on dendritic spines of cortical pyramidal neurons in patients with Alzheimer’s disease (2013) · cites this paper as Harris and Stevens, 1989
Experimental — accuracy not yet measuredThe cited source says what the claim attributes to it.
In the citing paper
“The relationship between spine geometry and expression of functional AMPA receptors demonstrated here provides substantial support to the hypothesis that neuronal fine structures have functional correlates in the brain13, 18, 21.”
From Dendritic spine geometry is critical for AMPA receptor expression in hippocampal CA1 pyramidal neurons (2001) · cites this paper as [13]
The cited source says what the claim attributes to it.
In the citing paper
“These data are consistent with the correlation between AMPA receptor immunoreactivity and the size of PSD19, 20, because the size of PSD is nearly proportional to the spine-head volume13.”
From Dendritic spine geometry is critical for AMPA receptor expression in hippocampal CA1 pyramidal neurons (2001) · cites this paper as [13]
The cited source says what the claim attributes to it.
In the citing paper
“whereas the spine head volume is correlated with the area of the postsynaptic density.”
From The influence of phospho-tau on dendritic spines of cortical pyramidal neurons in patients with Alzheimer’s disease (2013) · cites this paper as Harris and Stevens, 1989
Self-check
Percentages, sums and reported differences re-computed from the paper’s own numbers.
The self-check needs the paper’s full text.
Citations
Cites
The Synaptic Organization of the Brain
(2004) · Oxford University Press eBooks · doi:10.1093/acprof:oso/9780195159561.001.1 · Cited by 3,574
The Synaptic Organization of the Brain
Freemon, F. R. (1980) · JAMA · doi:10.1001/jama.1980.03300440052037 · Cited by 709
Chang, F., & Greenough, W. T. (1984) · Brain Research · doi:10.1016/0006-8993(84)91008-4 · Cited by 523
Lee, K. S., Schottler, F., Oliver, M. E., & LYNCH, G. S. (1980) · Journal of Neurophysiology · doi:10.1152/jn.1980.44.2.247 · Cited by 473
Harris, K., & Stevens, J. (1988) · The Journal of Neuroscience · doi:10.1523/jneurosci.08-12-04455.1988 · Cited by 318
Self-citationDesmond, N. L., & Levy, W. B. (1983) · Brain Research · doi:10.1016/0006-8993(83)91329-x · Cited by 276
Three-Dimensional analysis of dendritic spines
Špaček, J., & Hartmann, M. (1983) · Anatomy and Embryology · doi:10.1007/bf00298517 · Cited by 269
The anatomy of a memory: convergence of results across a diversity of tests
Greenough, W. T., & Bailey, C. H. (1988) · Trends in Neurosciences · doi:10.1016/0166-2236(88)90139-7 · Cited by 266
Crick, F. (1982) · Trends in Neurosciences · doi:10.1016/0166-2236(82)90020-0 · Cited by 254
Van Harreveld, A., & Fifkova, E. (1975) · Experimental Neurology · doi:10.1016/0014-4886(75)90055-2 · Cited by 239
Research works printed but not linked: 6
- Harris, K. M., F. E. Jensen, and B. Tsao (1988) Ultrastructure, de- velopment, and plasticity of synapses in area CA1 of the rat hippo- campus: Extending our vision with serial electron microscopy and three dimensional analyses. Neurol. Neurobiol. (in press).
- Andersen, P., T. Blackstad, G. Hulleberg, J. Line Vaaland, and M. Andersen, P., T. Blackstad, G. Hulleberg, M. Trommald, and J. L. Vaaland (1988b) Dimensions ofdendritic spines ofrat dentate gran- Trommald (1988a) Changes in spine morphology associated with ule cells during long-term potentiation (LTP). Proc. Physiol. Sot. P.C. 50. long-term potentiation in rat dentate granule cells. Proc. Physiol. Sot. s.
- Diamond, J., E. G. Gray, and G. M. Yasargil (1970) The function of dendritic spines: An hypothesis. In Excitatory Synaptic Mechanisms, P. Andersen and J. Jensen, eds., pp. 2 13-222, Universitets Forlaget, Oslo.
- Meek, G. A. (1976) Practical Electron Microscopyfor Biologists, Wiley, New York.
- Rall, W. (1970) Cable properties of dendrites and effects of synaptic location. In Excitatory Synaptic Mechanisms, P. Andersen and J. K. S. Jensen, eds., pp. 175-l 87, Universitets Forlaget, Oslo.
- Rall, W. (1978) Dendritic spines and synaptic potency. In Studies in NeurophysioloRy, A. K. McIntyre and K. Porter, eds., pp. 203-209, Cambridge U.-P., Cambridge.
Cited by
Sorted by citations
Items 901–999 of 999
A STED Microscope for Multimodal Investigation of Dendritic Spine Structure and Function
Quici, F., Dembitskaya, Y., Bancelin, S., Tønnesen, J., & Nägerl, U. V. (2024) · Neuromethods · doi:10.1007/978-1-0716-4011-1_13 · Cited by 1
Motivational dysregulation with melanocortin 4 receptor haploinsufficiency
Steiner, A. M., Roscoe, R. F., Booze, R. M., & Mactutus, C. F. (2024) · NeuroImmune Pharmacology and Therapeutics · doi:10.1515/nipt-2024-0011 · Cited by 1
Chen, R., Lu, X., Xiao, A., & Ma, J. (2025) · Frontiers in Cellular Neuroscience · doi:10.3389/fncel.2024.1520253 · Cited by 4
Visualizing Postsynaptic Density in Excitatory Synapses with Electron Tomography
Sun, R., & Zhou, Q. (2026) · Advances in neurobiology · doi:10.1007/978-3-032-12594-1_10 · Cited by 2
CDKL5 modulates the plasticity of excitatory synapses via liquid–liquid phase separation
Li, M., Zhu, Z., Li, D., Wang, J., Zhang, M., Xu, Q.-W., Zhang, Y., Zhu, Y., Zhu, J., & Xiong, Z. (2026) · Proceedings of the National Academy of Sciences · doi:10.1073/pnas.2511123123 · Cited by 2
Dendritic heterosynaptic plasticity arises from calcium-based input learning
Shafiee, S., Schmitt, S., & Tetzlaff, C. (2026) · Communications Biology · doi:10.1038/s42003-026-09719-3 · Cited by 1
Sleep deprivation alters hippocampal dendritic spines in a contextual fear memory engram
Tennin, M., Matkins, H. T., Rexrode, L., Bollavarapu, R., Asplund, S. D., Pareek, T., Kroeger, D., Pantazopoulos, H., & Gisabella, B. (2026) · Scientific Reports · doi:10.1038/s41598-026-41336-2 · Cited by 2
Synapse Formation in the Mammalian Central Nervous System
Yasuda, M., & Umemori, H. (2009) · Springer eBooks · doi:10.1007/978-0-387-92708-4_4 · Cited by 1
Reconstruction of the molecular interactome of glutamatergic synapses
Proskura, A. L., Vechkapova, S. O., Запара, Т. А., & Ratushnyak, A. S. (2015) · Russian Journal of Genetics Applied Research · doi:10.1134/s2079059715060118 · Cited by 1
Bear, M. F., Connors, B. W., & Paradiso, M. A. (2018) · Springer eBooks · doi:10.1007/978-3-662-57263-4_2 · Cited by 1
Noise Helps Optimization Escape From Saddle Points in the Synaptic Plasticity
Fang, Y. G., Yu, Z., & Chen, F. (2020) · Frontiers in Neuroscience · doi:10.3389/fnins.2020.00343 · Cited by 1
Distribution of cortactin in cerebellar Purkinje cell spines
Szabó, L. E., Marcello, G. M., Süth, M., Sótonyi, P., & Rácz, B. (2021) · Scientific Reports · doi:10.1038/s41598-020-80469-w · Cited by 1
Shapiro, F. (2016) · Advances in anatomy, embryology and cell biology · doi:10.1007/978-3-319-43151-2_2 · Cited by 1
Yang, W., Chen, C., Jiang, X., Zhao, Y., Wang, J., Zhang, Q., Zhang, J., Feng, Y., & Cui, S. (2024) · Cell Biology International · doi:10.1002/cbin.12140 · Cited by 1
Vardalaki, D., Pham, T., Frosch, M. P., Cosgrove, G. R., Carter, B. S., Richardson, R. M., Cash, S. S., & Harnett, M. T. (2025) · Scientific Reports · doi:10.1038/s41598-025-18207-3 · Cited by 2
Monitoring Synaptic Plasticity by Imaging AMPA Receptor Content and Dynamics on Dendritic Spines
Makino, H., & Li, B. (2013) · Methods in molecular biology · doi:10.1007/978-1-62703-444-9_25 · Cited by 1
Synaptogenesis in the Adult CNS – Neocortical Plasticity
Eavri, R., & Nedivi, E. (2013) · Elsevier eBooks · doi:10.1016/b978-0-12-397266-8.00110-1 · Cited by 3
Coarse-Grained Stochastic Model of Myosin-Driven Vesicles into Dendritic Spines
Park, Y., Singh, P., & Fai, T. G. (2022) · SIAM Journal on Applied Mathematics · doi:10.1137/21m1434180 · Cited by 1
Plata, A. L. D., & Robles, E. (2022) · Neuroscience · doi:10.1016/j.neuroscience.2022.06.017 · Cited by 1
McLaurin, K. A., Li, H., Mactutus, C. F., & Booze, R. M. (2023) · NeuroImmune Pharmacology and Therapeutics · doi:10.1515/nipt-2023-0008 · Cited by 1
Modulation of the Cytoskeletal Architecture by Calcium
van Rossum, D. (1998) · Springer eBooks · doi:10.1007/978-1-4899-1901-4_10 · Cited by 1
Humble, J. (2013) · PEARL (University of Plymouth) · doi:10.24382/2202 · Cited by 1
Form and Function: A Neuronal Dialog
Rocha, M., Furtado, D. A., Menezes, J. R. L., & Hedin‐Pereira, C. (2003) · Brain and Mind · doi:10.1023/a:1024156030989 · Cited by 1
Regulation of dendritic spine morphogenesis and synapse formation by copines
Galic, M. (2006) · edoc (University of Basel) · doi:10.5451/unibas-004198769 · Cited by 1
Structure and plasticity potential of neural networks in the cerebral cortex
Fares, T. (2010) · Digital Repository Service (Northeastern University) · doi:10.17760/d20000285 · Cited by 1
Dölen, G. (2008) · Cited by 1
Trogadis, J. E., & Stevens, J. K. (1994) · Elsevier eBooks · doi:10.1016/b978-0-12-668330-1.50017-x · Cited by 1
Self-citationConfocal Imaging of Living Neurons and Organelles
Mills, L. R., Niesen, C. E., & Kerr, R. (1994) · Elsevier eBooks · doi:10.1016/b978-0-12-668330-1.50018-1 · Cited by 1
Astrocytes Keep It Under Wraps: Reconstructing Synapses in the Latent Phase of Epileptogenesis
Klaft, Z., & Dulla, C. G. (2020) · Epiliepsy currents/Epilepsy currents · doi:10.1177/1535759720928377 · Cited by 1
Central Nervous System axonal regeneration by spatially targeted drug combinationsPreprint
Siddiq, M. M., Johnson, N. P., Zorina, Y., Yadaw, A. S., Toro, C. A., Hansen, J., Rabinovich, V., Gregorich, S. M., Xiong, Y., Tolentino, R. E., et al. (2017) · bioRxiv (Cold Spring Harbor Laboratory) · doi:10.1101/157099 · Cited by 1
Proteoglycan Clusters as a Site of Coordinated, Multi-Dendritic PlasticityPreprint
Chelini, G., Durning, P., O'Donovan, S. M., Klengel, T., Balasco, L., Berciu, C., Boyer‐Boiteau, A., Bozzi, Y., McCullumsmith, R. E., Ressler, K. J., et al. (2021) · bioRxiv (Cold Spring Harbor Laboratory) · doi:10.1101/2021.10.04.462691 · Cited by 1
Abundance of Degrees of Freedom
(2008) · Springer eBooks · doi:10.1007/978-3-540-29678-2_19 · Cited by 1
Kirk, L. M., & Harris, K. M. (2016) · Encyclopedia of Life Sciences · doi:10.1002/9780470015902.a0000093.pub3 · Cited by 1
Self-citationFocal Clusters of Peri-Synaptic Matrix Contribute to Activity-Dependent Plasticity and MemoryPreprint
Chelini, G., Mirzapourdelavar, H., Durning, P. T., Baidoe‐Ansah, D., O'Donovan, S. M., Klengel, T., Balasco, L., Berciu, C., Boyer‐Boiteau, A., Smith, R. A., et al. (2023) · SSRN Electronic Journal · doi:10.2139/ssrn.4512954 · Cited by 1
Sohn, J. (2024) · eLife · doi:10.7554/elife.98458.1.sa2 · Cited by 1
Cryo-electron tomographic investigation of native hippocampal glutamatergic synapsesPreprint
Matsui, A., Spangler, C. J., Elferich, J., Shiozaki, M., Jean, N., Zhao, X., Qin, M., Zhong, H., Yu, Z., & Gouaux, E. (2024) · eLife · doi:10.7554/elife.98458.2 · Cited by 2
Data-driven synapse classification reveals a logic of glutamate receptor diversityPreprint
Micheva, K. D., Simhal, A. K., Schardt, J., Smith, S. J., Weinberg, R. J., & Owen, S. F. (2024) · bioRxiv (Cold Spring Harbor Laboratory) · doi:10.1101/2024.12.11.628056 · Cited by 1
Shaft versus spine localization affects the structural plasticity of glutamatergic synapsesPreprint
Fanutza, T., Popp, Y., Brueckner, A. M., Hertrich, N., von Sivers, J., Larkum, M. E., Shoichet, S. A., & Mikhaylova, M. (2025) · bioRxiv (Cold Spring Harbor Laboratory) · doi:10.64898/2025.12.05.692591 · Cited by 4
Synapses, spines, zinc and pathology of Alzheimer's disease.
Familtsev, D. (2013) · ThinkIR: The University of Louisville's Institutional Repository (University of Louisville) · doi:10.18297/etd/420 · Cited by 1
The role of CaMKII binding NMDARs in synaptic plasticity and memory
Dallapiazza, R. F. (2010) · doi:10.17077/etd.ut2qb8ib
Role of mGluR5 and FMRP in mouse primary somatosensory cortex
Wijetunge, L. S. (2009) · OpenGrey (Institut de l'Information Scientifique et Technique)
Dynamic and integrated mechanical movements of a rat brain associated with evoked potentialsPreprint
Goto, K., & Nakaye, T. (2014) · arXiv (Cornell University) · doi:10.48550/arxiv.1404.6932
Scaling of unitary synaptic strength in the context of network dynamics
Liu, G., & Wilson, N. R. (2005) · DSpace@MIT (Massachusetts Institute of Technology)
Short- and long-term neuronal plasticity in hippocampal CA1 region of rat
Huang, F. (2010) · Gothenburg University Publications Electronic Archive (Gothenburg University)
Modifications morphologiques associées à la plasticité synaptique
Toni, N. (2000) · Archive ouverte UNIGE (University of Geneva) · doi:10.13097/archive-ouverte/unige:552
Synaptic Targeting of Neurotransmitter Receptors is Regulated by Neurobeachin
Nair, R. (2011) · eDiss (Georg-August-Universität Göttingen) · doi:10.53846/goediss-511
Egorova, E. A., Vl, D.-B., & Федоренко, Г. М. (1992) · IEEE Symposium on Neuroinformatics and Neurocomputers · doi:10.1109/rnns.1992.268609
Structural plasticity of the mesolimbic system associated with female sexual reward.
Michael, N. A. (2012) · University of Minnesota Digital Conservancy (University of Minnesota)
Statistical theory of synaptic connectivity in the neocortex
Escobar, G. M. (2010) · Digital Repository Service (Northeastern University) · doi:10.17760/d20000284
Optical analysis of synaptic plasticity in rat hippocampus
Zhang, Y. (2008) · edoc (University of Basel) · doi:10.5451/unibas-004414662
Wiegert, J. S., & Oertner, T. G. (2011) · e-Neuroforum · doi:10.1007/s13295-011-0014-5
Meyer, D. (2013) · MPG.PuRe (Max Planck Society) · doi:10.5282/edoc.15551
Imaging activity-dependent structural and functional plasticity of hippocampal CA3-CA1 synapses
Becker, N. (2008) · Electronic Theses of LMU Munich (Ludwig-Maximilians-Universität München) · doi:10.5282/edoc.10129
Morphological Correlates Of Synaptic Plasticity After Long Term Potentiation In The Rat Hippocampus
Harrison, E. (2001) · Open Research Online (The Open University) · doi:10.21954/ou.ro.00004be4
Hocus-Socus: An Error Catastrophe for Complex Hebbian Learning Implies Neocortical ProofreadingPreprint
Cox, K. J. A., & Adams, P. R. (2010) · arXiv (Cornell University) · doi:10.48550/arxiv.1012.0946
A window on the ageing brain : Imaging synapses and their dynamics in vivo
Grillo, F. W. (2013) · doi:10.25560/14407
Abbas, A.-K. (2015) · Gothenburg University Publications Electronic Archive (Gothenburg University)
Role of Reelin in synaptogenesis and synaptic stabilization in the adult brain
Piñol, C. B. (2014) · Dipòsit Digital de la Universitat de Barcelona (Universitat de Barcelona)
Nikandrova, Y. A., Davies, H. A., Stewart, M. G., & Skibo, G. G. (2000) · Neurophysiology · doi:10.1007/bf02506559
Rusakov, D. A., Stewart, M. G., & Коrogod, S. М. (1997) · Neurophysiology · doi:10.1007/bf02463182
Bowden, J. B., Abraham, W. C., & Harris, K. M. (2010) · Otago University Research Archive (University of Otago)
Self-citationVolume Haptics and Dendritic Spine Editing
Corenthy, L. (2015) · doi:10.20868/upm.thesis.38146
Spatiotemporal Kinetics of AMPAR Trafficking in Single Spines
Patterson, M. (2010) · DukeSpace (Duke University)
Jessen, A. L. (2010) · eDiss (Georg-August-Universität Göttingen) · doi:10.53846/goediss-406
Imaging cellular mechanisms of presynaptic structural plasticity
Helling, I. (2009)
SmallerDendriticSpines,WeakerSynapticTransmission, butEnhancedSpatialLearninginMiceLackingShank1
Woodworth, M., & Kidd, F. L. (2008)
Proteases and Neuronal Plasticity
Wright, J., & Harding, J. (2005) · Springer eBooks · doi:10.1007/0-387-23101-3_10
Lee, A., Song, L., Kanold, P. O., Lee, H., Cayabyab, F. S., Chen, Z., Xiong, C., Pancyr, C., Stockwell, J., & Walz, W. (2015)
Integrin1SignalsthroughArgtoRegulatePostnatal DendriticArborization,SynapseDensity,andBehavior
SloanWarren, M., Gourley, S. L., & Simpson, M. (2012)
Neuronal synapse formation regulated by intercellular adhesion molecules-5 (ICAM-5)
Lin, N. (2013) · Työväentutkimus Vuosikirja
Mechanisms regulating the reliability of synaptic transmission
Mackenzie, P. J. (2009) · cIRcle (University of British Columbia) · doi:10.14288/1.0089300
Characterization of the Proline-rich Synapse-associated Protein 1 Knockout Mouse
Shiban, E. (2013) · OPen Access Repositorium der Universität Ulm (OPARU) (Ulm University) · doi:10.18725/oparu-2855
Waveform: A Modeling Study On the Origin of the Extracellular Action Potential
Henze, D. A., Christof Koch, A., & Buzsáki, G. (2006)
Molecular Assembly of Excitatory Synapses
Iwasaki, H., Tanaka, S., & Okabe, S. (2016) · Springer eBooks · doi:10.1007/978-4-431-56050-0_15
Stereology and neuronal connectivity of the rat hippocampus: from 2d images to 3d modeling
Ascoli, G. A., & Ropireddy, D. (2011)
NOVEL APPROACHES TO THE STUDY OF SYNAPTIC PLASTICITY IN THE RAT HIPPOCAMPUS
Podor, B. (2017) · DalSpace (Dalhousie University)
Mishchenko, Y. (2016) · Medical Research Archives · doi:10.18103/mra.v4i4.604
The role of BDNF and Nogo-A signalling in modulating the architecture of mature hippocampal neurons
Kellner, Y. (2014) · Digitale Bibliothek Braunschweig (Verbundzentrale Göttingen (VZG)) · doi:10.24355/dbbs.084-201410291050-0
“Small and many” is the strategy for robust and efficient information transfer in dendritic spinesPreprint
Tottori, T., Fujii, M., & Kuroda, S. (2018) · bioRxiv (Cold Spring Harbor Laboratory) · doi:10.1101/340414
Study of a kinesin adaptor in axonal transport and synapse formation
Dehaghi, T. K. (2019) · eDiss (Georg-August-Universität Göttingen) · doi:10.53846/goediss-7310
Cuentas-Condori, A., Mulcahy, B., He, S., Palumbos, S. D., Zhen, M., & Miller, D. M. (2019) · bioRxiv (Cold Spring Harbor Laboratory) · doi:10.1101/598714
Flexible neural connectivity under constraints on total connection strengthPreprint
Ocker, G. K., & Buice, M. A. (2019) · bioRxiv (Cold Spring Harbor Laboratory) · doi:10.1101/603027
McKenzie, C. (2018) · Institute of Science and Technology Austria · doi:10.15479/at:ista:7132
Physical basis of functioning and evolutionary origins of biological information systems
Sorokoumov, E. D., Proskura, A. L., Запара, Т. А., & Ratushnyak, A. S. (2018) · Nanostructures Mathematical Physics and Modelling · doi:10.31145/2224-8412-2018-18-2-23-44
Asymptotic Analysis of the Narrow Escape Problem in Dendritic Spine Shaped Domain: Three DimensionPreprint
Lee, H., Li, X., & Wang, Y. (2017) · arXiv (Cornell University) · doi:10.48550/arxiv.1702.07301
Tactile discrimination learning in mice
Pacchiarini, N. (2019) · ORCA Online Research @Cardiff (Cardiff University)
Laporte, M. H., Il, K., Caudal, L. C., Zhao, N., Rolland, M., Hernández, J. M., Martineau, M., Chatellard, C., Denarier, É., Mercier, V., et al. (2020) · bioRxiv (Cold Spring Harbor Laboratory) · doi:10.1101/2020.07.20.211854
Morphologically constrained modeling of spinous inhibition in the somato-sensory cortexPreprint
Gemin, O., Serna, P., Assendorp, N., Fossati, M., Rostaing, P., Triller, A., & Charrier, C. (2020) · bioRxiv (Cold Spring Harbor Laboratory) · doi:10.1101/2020.08.06.230722
Metadata
- Authors
- Harris, K., & Stevens, J.
- Affiliations
- Boston Children's Hospital (US)
- Venue
- The Journal of Neuroscience
- Publisher
- Society for Neuroscience
- Published
- 1989-08-01
- Volume
- 9
- Issue
- 8
- Pages
- 2982-2997
- ISSN
- 0270-6474 (ISSN-L)
- 1529-2401
- PMC
- PMC6569708
- OpenAlex
- W2117664079
- Cited by
- 1,073
- References
- 38
- Citations by year
- 2026: 17 · 2025: 26 · 2024: 35 · 2023: 33 · 2022: 31 · 2021: 50 · 2020: 39 · 2019: 43 · 2018: 47 · 2017: 33 · 2016: 40 · 2015: 48 · 2014: 44 · 2013: 50 · 2012: 42
- FWCI
- 5.92
- Type
- journal article
- Language
- en
- Open access
- hybrid
- doi.org
- Licence
- Locations
- Journal of Neuroscience (publishedVersion, cc-by-nc-sa)
- Europe PMC (PubMed Central) (publishedVersion)
- PubMed Central (publishedVersion)
- PubMed (publishedVersion)
- Funders
- Alfred P. Sloan Foundation
- National Institutes of Health (NS21184)
- Medical Research Council
- National Institute of Neurological Disorders and Stroke (NS21184, NS 20820)
- Eunice Kennedy Shriver National Institute of Child Health and Human Development (P30HD018655, P30HD-18655)
- Topics
- Life Sciences › Neuroscience › Cellular and Molecular Neuroscience › Neuroscience and Neuropharmacology Research
- Life Sciences › Neuroscience › Cognitive Neuroscience › Memory and Neural Mechanisms
- Life Sciences › Neuroscience › Cognitive Neuroscience › Neural dynamics and brain function
- Keywords
- dendritic spines, CA1 pyramidal neurons, hippocampus, synaptic efficacy, postsynaptic density, synaptic vesicles, charge transfer, synaptic conductance, dendritic spine morphology, synaptic specificity
- MeSH terms
- Animals, Axons, Biophysics, Dendrites, Electric Conductivity, Endoplasmic Reticulum, Hippocampus, Image Processing, Computer-Assisted, Male, Microscopy, Electron, Models, Neurological, Neurons, Purkinje Cells, Rats, Inbred Strains, Synapses, Rats, Biophysical Phenomena
About these checks
Registry, retraction, Cites and statistics results are computed, not judged, with one exception: a printed reference that no index lists is read once by a model before it counts as a citation error. Claims are extracted by a model and kept only when their quote appears verbatim in the text; each cited source is then checked, with a model’s help, for whether it says what the claim relies on. Those verdicts can be wrong — read the claim’s quote and the cited source before relying on one.
Statistics and arithmetic are recomputed, not judged.
Confidence bands are shown only for fields calibrated on our annotated test set. None is calibrated yet, so no band is shown.
What counts as a claim ›How we measure confidence ›How we check this ›
Are you an author, or do you see a problem with this page? Request a review
