

The DOI matches its Crossref record; 98 of the 98 references it cites were found in a registry or an index; none of the 74 sources its claims cite is checked for support yet.
Trem2 Deletion Reduces Late-Stage Amyloid Plaque Accumulation, Elevates the Aβ42:Aβ40 Ratio, and Exacerbates Axonal Dystrophy and Dendritic Spine Loss in the PS2APP Alzheimer's Mouse Model
Open accessAbstract
TREM2 is an Alzheimer's disease (AD) risk gene expressed in microglia. To study the role of Trem2 in a mouse model of β-amyloidosis, we compared PS2APP transgenic mice versus PS2APP mice lacking Trem2 (PS2APP;Trem2 ko ) at ages ranging from 4 to 22 months. Microgliosis was impaired in PS2APP;Trem2 ko mice, with Trem2 -deficient microglia showing compromised expression of proliferation/Wnt-related genes and marked accumulation of ApoE. Plaque abundance was elevated in PS2APP;Trem2 ko females at 6–7 months; but by 12 or 19–22 months of age, it was notably diminished in female and male PS2APP;Trem2 ko mice, respectively. Across all ages, plaque morphology was more diffuse in PS2APP;Trem2 ko brains, and the Aβ42:Aβ40 ratio was elevated. The amount of soluble, fibrillar Aβ oligomers also increased in PS2APP;Trem2 ko hippocampi. Associated with these changes, axonal dystrophy was exacerbated from 6 to 7 months onward in PS2APP;Trem2 ko mice, notwithstanding the reduced plaque load at later ages. PS2APP;Trem2 ko mice also exhibited more dendritic spine loss around plaque and more neurofilament light chain in CSF. Thus, aggravated neuritic dystrophy is a more consistent outcome of Trem2 deficiency than amyloid plaque load, suggesting that the microglial packing of Aβ into dense plaque is an important neuroprotective activity. SIGNIFICANCE STATEMENT Genetic studies indicate that TREM2 gene mutations confer increased Alzheimer's disease (AD) risk. We studied the effects of Trem2 deletion in the PS2APP mouse AD model, in which overproduction of Aβ peptide leads to amyloid plaque formation and associated neuritic dystrophy. Interestingly, neuritic dystrophies were intensified in the brains of Trem2 -deficient mice, despite these mice displaying reduced plaque accumulation at later ages (12–22 months). Microglial clustering around plaques was impaired, plaques were more diffuse, and the Aβ42:Aβ40 ratio and amount of soluble, fibrillar Aβ oligomers were elevated in Trem2 -deficient brains. These results suggest that the Trem2-dependent compaction of Aβ into dense plaques is a protective microglial activity, limiting the exposure of neurons to toxic Aβ species.
Overview
AI snapshot
Written from the paper’s full text.
TL;DR
In PS2APP mice, Trem2 deletion impairs plaque-associated microgliosis and shifts amyloid pathology toward a more diffuse, Aβ42-enriched form, with reduced late-stage plaque load but worse axonal dystrophy and spine loss. The authors conclude that Trem2-dependent microglial activation is mainly neuroprotective in β-amyloidosis and that neuronal pathology is a better readout than plaque load.
Key findings
- Trem2 deletion impaired microglial responses to plaque: reduced Iba1+ clusters, CD68 staining, CD45high microglia, and methoxy-X04+ amyloid-containing microglia across ages; RNAseq found 144 transcripts reduced and only 7 increased in PS2APP;Trem2ko microglia (≥2-fold, adjusted p ≤ 0.05), including impaired proliferation/Wnt-related genes.
- Plaque effects were age- and sex-dependent: plaque load was increased in 6–7 month PS2APP;Trem2ko females, but reduced in 12 month females and 19–22 month males; plaques were more diffuse in Trem2ko brains at all ages tested, and amber cores were reduced in Trem2het and nearly absent in Trem2ko aged males.
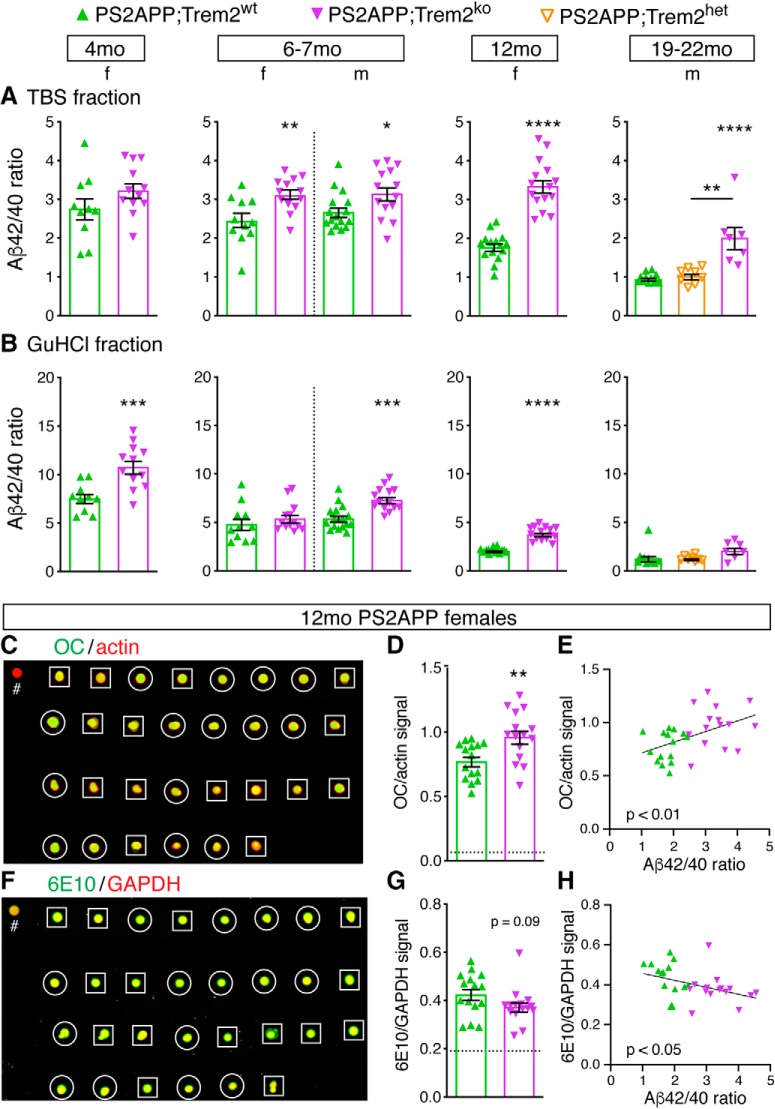
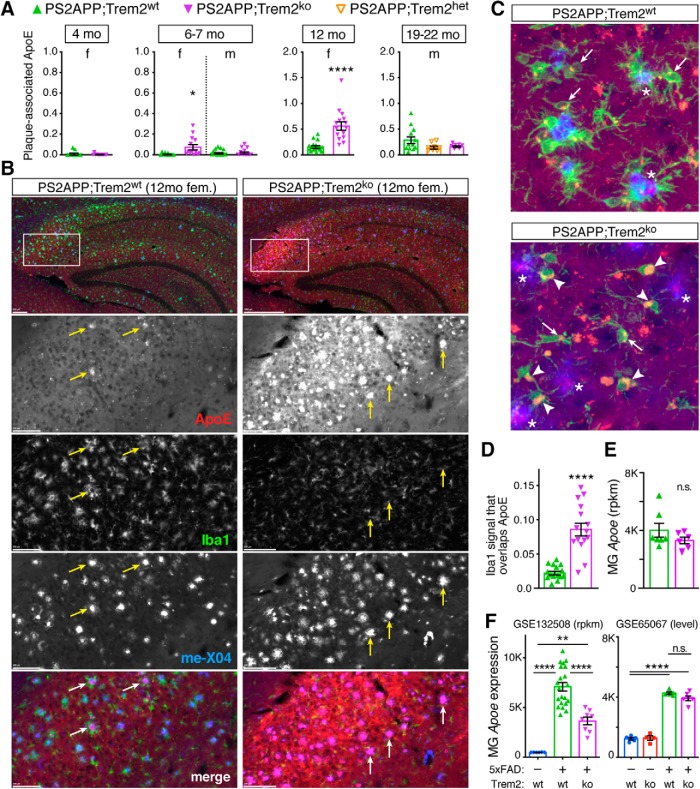
- Aβ42:Aβ40 ratio was elevated in PS2APP;Trem2ko brains in both TBS and GuHCl fractions across ages, with increased soluble fibrillar oligomers by OC dot blot; ApoE accumulated in Trem2ko microglia in 12 month females despite no difference in microglial Apoe mRNA.
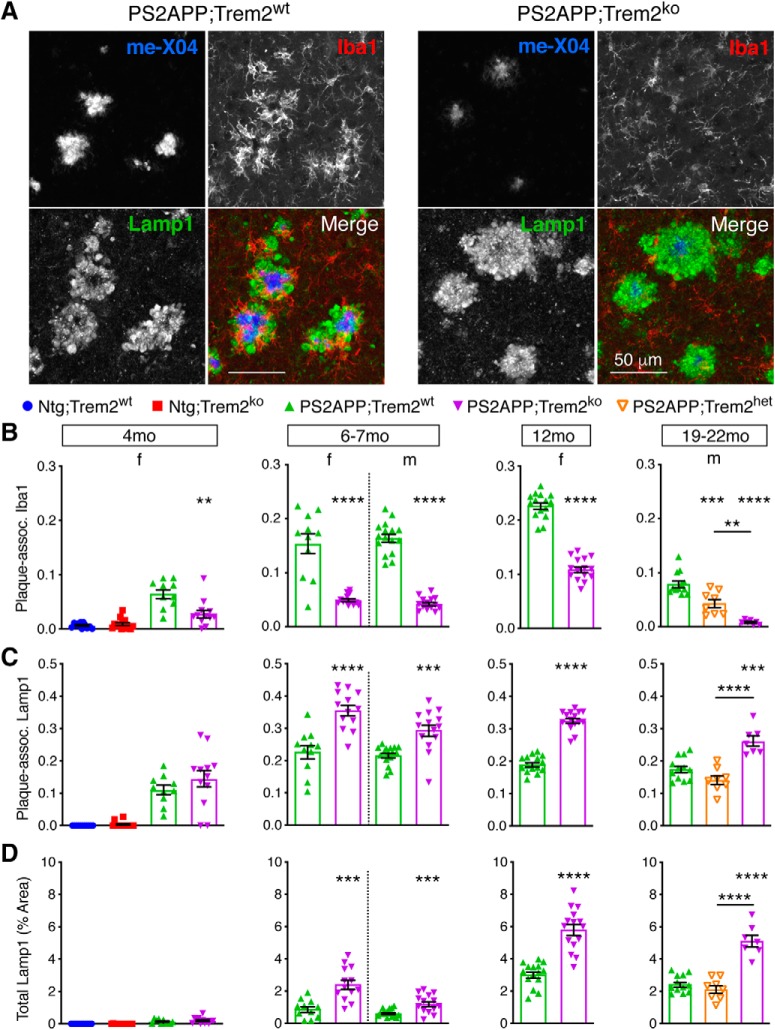
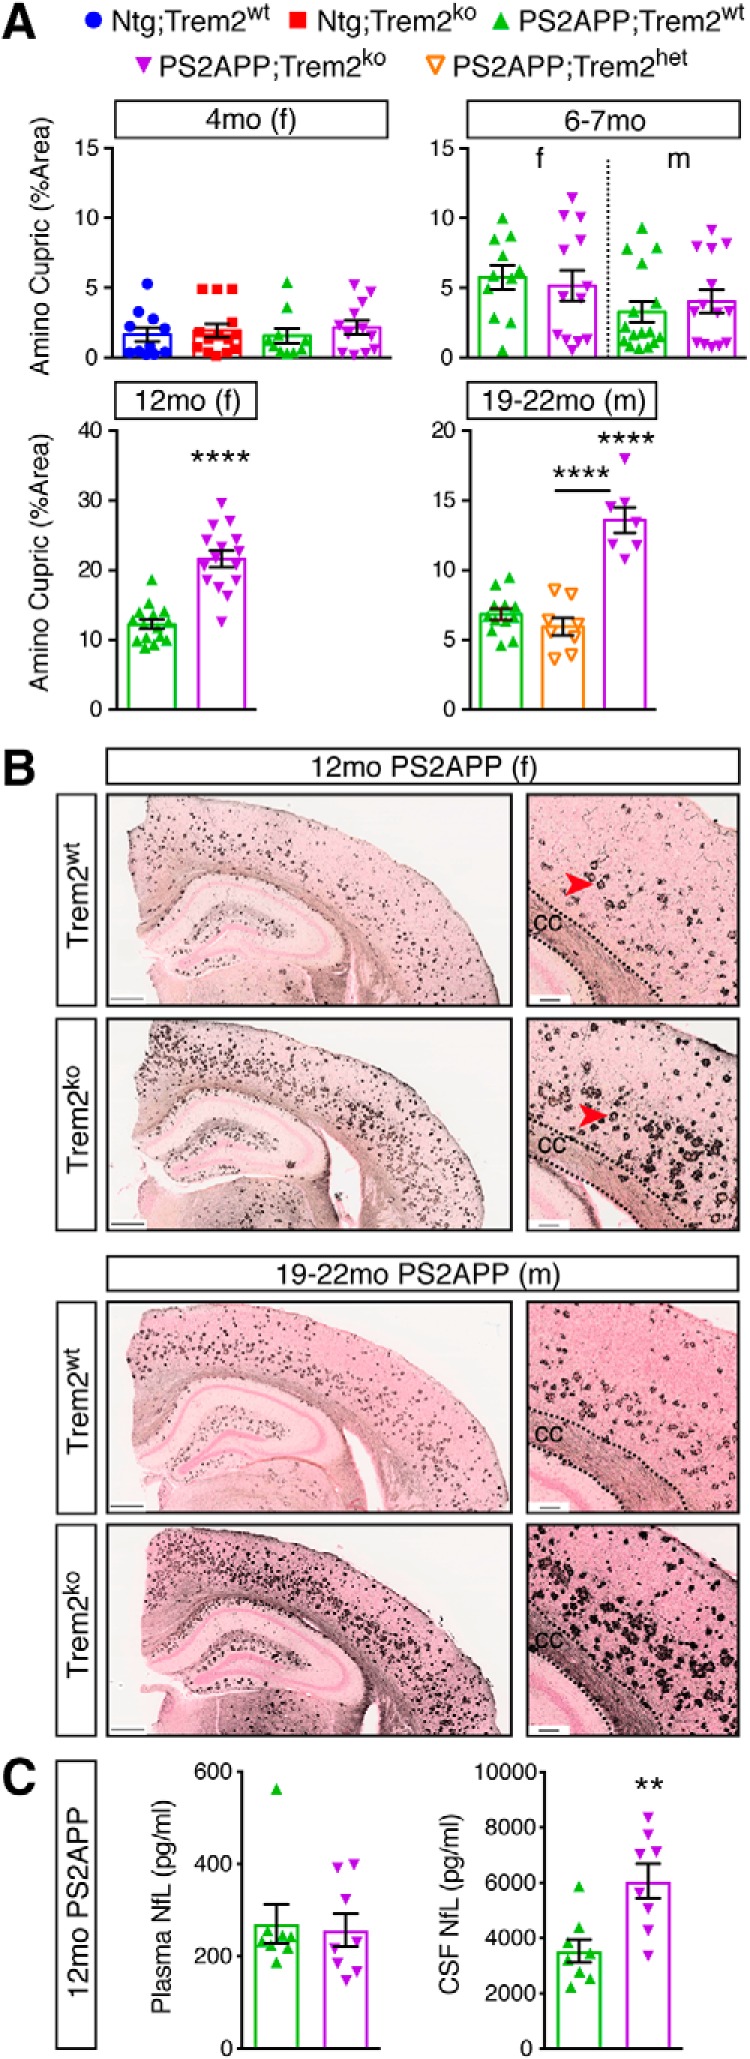
- Neuronal pathology worsened: plaque-associated Lamp1+ axonal dystrophy and total Lamp1+ area increased from 7 months onward in Trem2ko mice; amino cupric silver degeneration was greater at 12 months in females and 19–22 months in males; CSF NfL was significantly higher in Trem2ko mice, while plasma NfL did not differ; plaque-proximal dendritic spine density was lower in Trem2ko than Trem2wt or Trem2het mice, with spine density ~50% reduced near plaque versus distal segments.
Methods
- Compared PS2APP transgenic mice with PS2APP;Trem2ko mice across ages 4 to 22 months, using single-sex cohorts: females at 4, 6–7, and 12 months; males at 6–7 and 19–22 months, plus a 19–22 month male cohort including Trem2het mice.
- Used histology and whole-slide imaging for plaque, Iba1, CD68, Gfap, Lamp1, ApoE, and silver stains; flow cytometry/FACS for brain-resident myeloid cells; RNAseq of sorted microglia; Aβ40/Aβ42 ELISA; nondenaturing dot blots; two-photon imaging of plaque and dendritic spines; and Simoa NfL measurements in CSF/plasma.
- Main analyses included unpaired t tests, one-way ANOVA with Tukey’s multiple-comparisons, differential expression with voom+limma, GO overrepresentation, and gene set scoring.
Limitations
- Stated in the paper: RNAseq was from bulk sorted brain myeloid cells, not single-cell resolution; the CSF/plasma NfL cohort was not littermates and was assembled specifically for NfL measurements after a peer-review recommendation; aged male numbers were depleted, so available Trem2het mice were included to round out that analysis.
- Evident from the text: findings are from a mouse β-amyloidosis model and may not translate directly to human AD; several cohorts were processed as separate batches, and some flow cytometry/methoxy-X04 analyses used very small n (e.g., n = 3 Trem2wt and n = 2 Trem2ko).
- Evident from the text: the study reports histopathological and biochemical outcomes, not cognitive/behavioral measures, so the functional consequences of the observed neuronal pathology are not directly tested.
Model-written summary. Check it against the paper before relying on it.
Integrity signals
Registry
Cites
Statistics
Figures
Verification
Claims the paper makes
53 Own result · 42 Not checked yet · 27 Own interpretation · 12 Own method · 5 No basis given
A result the paper reports from its own data — it cites no other source for it, so there is none to check. The quote shows it is in the paper.
In the paper
“elevated neurofilament-L in the CSF”
§ Trem2 Deletion Reduces Late-Stage Amyloid Plaque Accumulation, Elevates the Aβ42:Aβ40 Ratio, and Exacerbates Axonal Dystrophy and Dendritic Spine Loss in the PS2APP Alzheimer's Mouse Model > Introduction
plain- Asserted: passes — The authors put it forward as true.
- Checkable: passes — It can be checked against evidence.
- Load-bearing: passes — The paper’s conclusions depend on it.
- Based: passes — The paper gives a reason why it holds.
In the paper
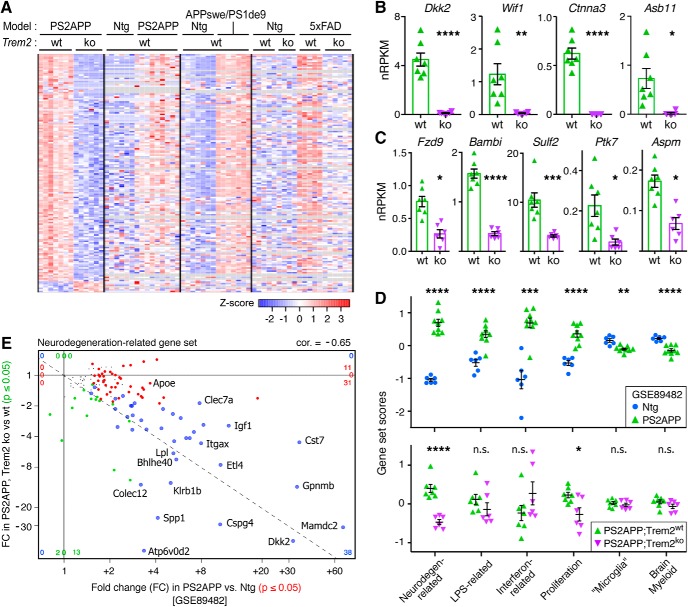
“The dependence of these transcripts on Trem2 for their induction in PS2APP microglia was approximately concordant with published data from sorted microglial populations from the 5xFAD model (Wang et al., 2015) (Fig. 2A).”
§ Trem2 Deletion Reduces Late-Stage Amyloid Plaque Accumulation, Elevates the Aβ42:Aβ40 Ratio, and Exacerbates Axonal Dystrophy and Dendritic Spine Loss in the PS2APP Alzheimer's Mouse Model > Results > Trem2-dependent induction of the proliferation and neurodegeneration-related gene expression modules
What the sources say
- Not checked yetcites Wang et al., 2015
hedgedcorrelational- Asserted: passes — The authors put it forward as true.
- Checkable: passes — It can be checked against evidence.
- Load-bearing: unclear — It is unclear whether the paper’s conclusions depend on it.
- Based: passes — The paper gives a reason why it holds.
A result the paper reports from its own data — it cites no other source for it, so there is none to check. The quote shows it is in the paper.
In the paper
“increased levels of soluble fibrillar oligomeric Aβ”
§ Trem2 Deletion Reduces Late-Stage Amyloid Plaque Accumulation, Elevates the Aβ42:Aβ40 Ratio, and Exacerbates Axonal Dystrophy and Dendritic Spine Loss in the PS2APP Alzheimer's Mouse Model > Introduction
plaincorrelational- Asserted: passes — The authors put it forward as true.
- Checkable: passes — It can be checked against evidence.
- Load-bearing: passes — The paper’s conclusions depend on it.
- Based: passes — The paper gives a reason why it holds.
A result the paper reports from its own data — it cites no other source for it, so there is none to check. The quote shows it is in the paper.
In the paper
“Analysis of confocal z-stack images of cortical tissue from 12 month PS2APP;Trem2ko animals also found a significant reduction in the fraction of Iba1 and methoxy-X04 signals that colocalized with each other (Fig. 1-1).”
§ Trem2 Deletion Reduces Late-Stage Amyloid Plaque Accumulation, Elevates the Aβ42:Aβ40 Ratio, and Exacerbates Axonal Dystrophy and Dendritic Spine Loss in the PS2APP Alzheimer's Mouse Model > Results > Plaque-associated microgliosis is impaired in PS2APP;Trem2ko microglia
plaincorrelational- Asserted: passes — The authors put it forward as true.
- Checkable: passes — It can be checked against evidence.
- Load-bearing: passes — The paper’s conclusions depend on it.
- Based: passes — The paper gives a reason why it holds.
In the paper
“Applying cutoffs of ≥2-fold change and adjusted p value ≤ 0.05, we observed only 7 transcripts with increased abundance in PS2APP;Trem2ko versus PS2APP;Trem2wt microglia (excluding Treml1, an artifact of the KO cassette insertion) (Kang et al., 2018).”
§ Trem2 Deletion Reduces Late-Stage Amyloid Plaque Accumulation, Elevates the Aβ42:Aβ40 Ratio, and Exacerbates Axonal Dystrophy and Dendritic Spine Loss in the PS2APP Alzheimer's Mouse Model > Results > Trem2-dependent induction of the proliferation and neurodegeneration-related gene expression modules
What the sources say
- Not checked yetcites Kang et al., 2018
plain- Asserted: passes — The authors put it forward as true.
- Checkable: passes — It can be checked against evidence.
- Load-bearing: passes — The paper’s conclusions depend on it.
- Based: passes — The paper gives a reason why it holds.
A result the paper reports from its own data — it cites no other source for it, so there is none to check. The quote shows it is in the paper.
In the paper
“neuritic dystrophy histopathology was more marked in PS2APP;Trem2ko mice, even at older ages when total plaque was reduced.”
§ Trem2 Deletion Reduces Late-Stage Amyloid Plaque Accumulation, Elevates the Aβ42:Aβ40 Ratio, and Exacerbates Axonal Dystrophy and Dendritic Spine Loss in the PS2APP Alzheimer's Mouse Model > Introduction
plaincorrelational- Asserted: passes — The authors put it forward as true.
- Checkable: passes — It can be checked against evidence.
- Load-bearing: passes — The paper’s conclusions depend on it.
- Based: passes — The paper gives a reason why it holds.
A result the paper reports from its own data — it cites no other source for it, so there is none to check. The quote shows it is in the paper.
In the paper
“plaque accumulation was reduced at older ages in both female and male Trem2 KO (PS2APP;Trem2ko) mice compared with age-matched Trem2 WT (PS2APP;Trem2wt) mice.”
§ Trem2 Deletion Reduces Late-Stage Amyloid Plaque Accumulation, Elevates the Aβ42:Aβ40 Ratio, and Exacerbates Axonal Dystrophy and Dendritic Spine Loss in the PS2APP Alzheimer's Mouse Model > Introduction
plaindirect- Asserted: passes — The authors put it forward as true.
- Checkable: passes — It can be checked against evidence.
- Load-bearing: passes — The paper’s conclusions depend on it.
- Based: passes — The paper gives a reason why it holds.
In the paper
“We also analyzed recently published microglia RNA-Seq expression profiles from the 5xFAD model (Griciuc et al., 2019) and observed similar Trem2-dependent induction for the nine above-mentioned genes, with the exception of Ptk7 (Fig. 2-2B.”
§ Trem2 Deletion Reduces Late-Stage Amyloid Plaque Accumulation, Elevates the Aβ42:Aβ40 Ratio, and Exacerbates Axonal Dystrophy and Dendritic Spine Loss in the PS2APP Alzheimer's Mouse Model > Results > Trem2-dependent induction of the proliferation and neurodegeneration-related gene expression modules
What the sources say
- Not checked yetcites Griciuc et al., 2019
plaindirect- Asserted: passes — The authors put it forward as true.
- Checkable: passes — It can be checked against evidence.
- Load-bearing: unclear — It is unclear whether the paper’s conclusions depend on it.
- Based: passes — The paper gives a reason why it holds.
A result the paper reports from its own data — it cites no other source for it, so there is none to check. The quote shows it is in the paper.
In the paper
“Supporting this interpretation, the GO knowledge base identified “positive regulation of canonical Wnt signaling pathway” as a biological process overrepresented (fold enrichment = 10.3, FDR = 0.026) among the 144 transcripts with ≥2-fold reduced abundance in PS2APP;Trem2ko microglia (Fig. 2-2A, with six positive factors in Wnt signaling showing reduced expression including Fzd9 (Karasawa et al.,”
§ Trem2 Deletion Reduces Late-Stage Amyloid Plaque Accumulation, Elevates the Aβ42:Aβ40 Ratio, and Exacerbates Axonal Dystrophy and Dendritic Spine Loss in the PS2APP Alzheimer's Mouse Model > Results > Trem2-dependent induction of the proliferation and neurodegeneration-related gene expression modules
plaindirect- Asserted: passes — The authors put it forward as true.
- Checkable: passes — It can be checked against evidence.
- Load-bearing: unclear — It is unclear whether the paper’s conclusions depend on it.
- Based: passes — The paper gives a reason why it holds.
A result the paper reports from its own data — it cites no other source for it, so there is none to check. The quote shows it is in the paper.
In the paper
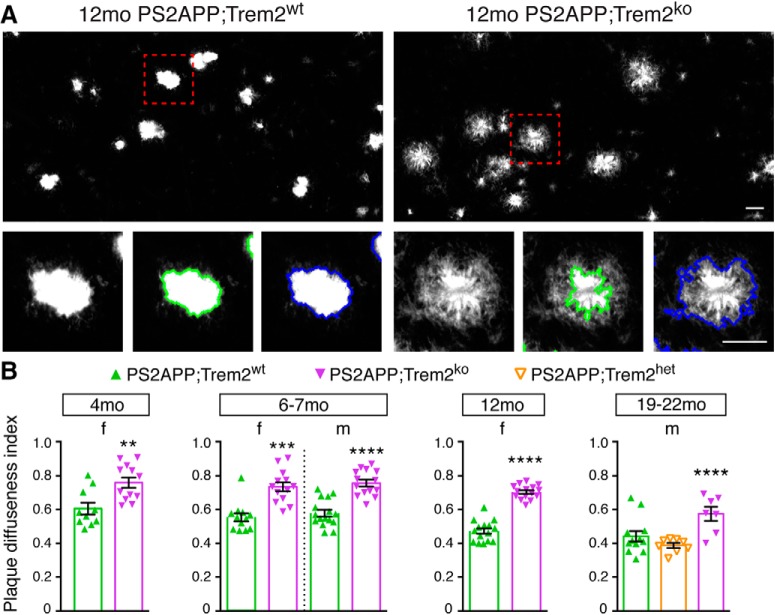
“plaque morphology was more diffuse”
§ Trem2 Deletion Reduces Late-Stage Amyloid Plaque Accumulation, Elevates the Aβ42:Aβ40 Ratio, and Exacerbates Axonal Dystrophy and Dendritic Spine Loss in the PS2APP Alzheimer's Mouse Model > Introduction
plaincorrelational- Asserted: passes — The authors put it forward as true.
- Checkable: passes — It can be checked against evidence.
- Load-bearing: passes — The paper’s conclusions depend on it.
- Based: passes — The paper gives a reason why it holds.
- It may state two separate claims as one. 42
- The quote only partly states this claim. 1
- Probably not a substantial claim. 29
A result the paper reports from its own data — it cites no other source for it, so there is none to check. The quote shows it is in the paper.
In the paper
“Trem2-deficient microglia showing compromised expression of proliferation/Wnt-related genes and marked accumulation of ApoE.”
- Also stated in: § Introduction · plain
“Additional analyses of PS2APP;Trem2ko mice at 12 months of age revealed ApoE-laden microglia”
§ Trem2 Deletion Reduces Late-Stage Amyloid Plaque Accumulation, Elevates the Aβ42:Aβ40 Ratio, and Exacerbates Axonal Dystrophy and Dendritic Spine Loss in the PS2APP Alzheimer's Mouse Model > Abstract
plaincorrelational- Asserted: passes — The authors put it forward as true.
- Checkable: passes — It can be checked against evidence.
- Load-bearing: unclear — It is unclear whether the paper’s conclusions depend on it.
- Based: passes — The paper gives a reason why it holds.
It may state two separate claims as one. The quote only partly states this claim.
- Also stated in: § Introduction · plain
A result the paper reports from its own data — it cites no other source for it, so there is none to check. The quote shows it is in the paper.
In the paper
“Other GO biological processes implicated as being downregulated in PS2APP;Trem2ko microglia included positive regulation of bone resorption (fold enrichment = 24.6, FDR = 0.030), protein kinase B signaling (fold enrichment = 16.2, FDR = 0.047), negative regulation of tumor necrosis factor production (fold enrichment = 14.1, FDR = 0.026), positive regulation of smooth muscle cell migration (fold”
§ Trem2 Deletion Reduces Late-Stage Amyloid Plaque Accumulation, Elevates the Aβ42:Aβ40 Ratio, and Exacerbates Axonal Dystrophy and Dendritic Spine Loss in the PS2APP Alzheimer's Mouse Model > Results > Trem2-dependent induction of the proliferation and neurodegeneration-related gene expression modules
plaincorrelational- Asserted: passes — The authors put it forward as true.
- Checkable: passes — It can be checked against evidence.
- Load-bearing: unclear — It is unclear whether the paper’s conclusions depend on it.
- Based: passes — The paper gives a reason why it holds.
It may state two separate claims as one.
A result the paper reports from its own data — it cites no other source for it, so there is none to check. The quote shows it is in the paper.
In the paper
“In PS2APP compared with nontransgenic microglia, several of these gene sets were upregulated, including the Neurodegeneration-related, Interferon-related, Proliferation, and LPS-related modules, whereas the Microglia and Brain Myeloid modules that typify microglia in their “homeostatic” or “resting” state were modestly but significantly downregulated (Fig. 2D; Fig. 2-3.”
§ Trem2 Deletion Reduces Late-Stage Amyloid Plaque Accumulation, Elevates the Aβ42:Aβ40 Ratio, and Exacerbates Axonal Dystrophy and Dendritic Spine Loss in the PS2APP Alzheimer's Mouse Model > Results > Trem2-dependent induction of the proliferation and neurodegeneration-related gene expression modules
plaincorrelational- Asserted: passes — The authors put it forward as true.
- Checkable: passes — It can be checked against evidence.
- Load-bearing: passes — The paper’s conclusions depend on it.
- Based: passes — The paper gives a reason why it holds.
It may state two separate claims as one.
A result the paper reports from its own data — it cites no other source for it, so there is none to check. The quote shows it is in the paper.
In the paper
“For instance, even though only 5 of 82 genes in the Proliferation module were upregulated strongly enough in PS2APP microglia to reach genome-wide significance (adjusted p ≤ 0.05), the overall expression of the module was clearly enriched compared with microglia from nontransgenic mice (Fig. 2D; Fig. 2-3.”
§ Trem2 Deletion Reduces Late-Stage Amyloid Plaque Accumulation, Elevates the Aβ42:Aβ40 Ratio, and Exacerbates Axonal Dystrophy and Dendritic Spine Loss in the PS2APP Alzheimer's Mouse Model > Results > Trem2-dependent induction of the proliferation and neurodegeneration-related gene expression modules
boostedcorrelational- Asserted: passes — The authors put it forward as true.
- Checkable: passes — It can be checked against evidence.
- Load-bearing: unclear — It is unclear whether the paper’s conclusions depend on it.
- Based: passes — The paper gives a reason why it holds.
It may state two separate claims as one.
A result the paper reports from its own data — it cites no other source for it, so there is none to check. The quote shows it is in the paper.
In the paper
“Again, despite only 2 of 82 genes (Ccna2 and Aspm) showing significant reduction in transcript abundance after correction for genome-wide analysis, the overall induction of the Proliferation module was compromised in PS2APP;Trem2ko microglia (Fig. 2D; Fig. 2-3).”
§ Trem2 Deletion Reduces Late-Stage Amyloid Plaque Accumulation, Elevates the Aβ42:Aβ40 Ratio, and Exacerbates Axonal Dystrophy and Dendritic Spine Loss in the PS2APP Alzheimer's Mouse Model > Results > Trem2-dependent induction of the proliferation and neurodegeneration-related gene expression modules
plaindirect- Asserted: passes — The authors put it forward as true.
- Checkable: passes — It can be checked against evidence.
- Load-bearing: unclear — It is unclear whether the paper’s conclusions depend on it.
- Based: passes — The paper gives a reason why it holds.
It may state two separate claims as one.
A result the paper reports from its own data — it cites no other source for it, so there is none to check. The quote shows it is in the paper.
In the paper
“In contrast to the effects of Trem2 deletion on total plaque burden that varied with age or sex, we observed consistent changes in plaque compaction and composition across ages and sexes.”
§ Trem2 Deletion Reduces Late-Stage Amyloid Plaque Accumulation, Elevates the Aβ42:Aβ40 Ratio, and Exacerbates Axonal Dystrophy and Dendritic Spine Loss in the PS2APP Alzheimer's Mouse Model > Results > Reduced plaque consolidation, elevated neurotoxic Aβ species, and ApoE-laden microglia in Trem2-deficient brains
plain- Asserted: passes — The authors put it forward as true.
- Checkable: passes — It can be checked against evidence.
- Load-bearing: passes — The paper’s conclusions depend on it.
- Based: passes — The paper gives a reason why it holds.
It may state two separate claims as one.
A result the paper reports from its own data — it cites no other source for it, so there is none to check. The quote shows it is in the paper.
In the paper
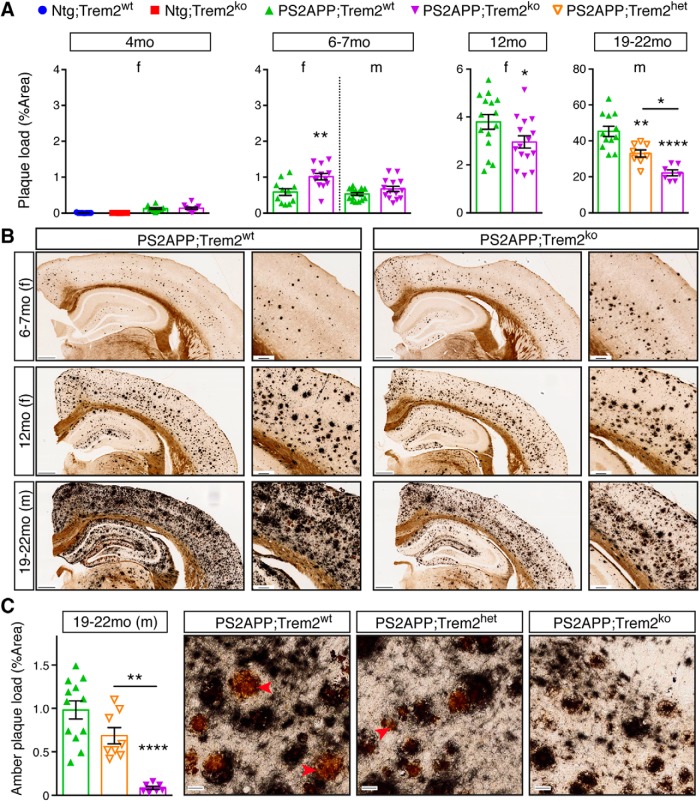
“We expected to see further exacerbation of amyloid plaque load in Trem2-deficient brains at more advanced ages, but, to our surprise, plaque load was reduced in 12 month PS2APP;Trem2ko females and in 19–22 month PS2APP;Trem2ko males compared with PS2APP;Trem2wt mice (Fig. 3A,B).”
§ Trem2 Deletion Reduces Late-Stage Amyloid Plaque Accumulation, Elevates the Aβ42:Aβ40 Ratio, and Exacerbates Axonal Dystrophy and Dendritic Spine Loss in the PS2APP Alzheimer's Mouse Model > Results > Plaque load is reduced in aged PS2APP;Trem2ko mice
plaindirect- Asserted: passes — The authors put it forward as true.
- Checkable: passes — It can be checked against evidence.
- Load-bearing: passes — The paper’s conclusions depend on it.
- Based: passes — The paper gives a reason why it holds.
It may state two separate claims as one.
A result the paper reports from its own data — it cites no other source for it, so there is none to check. The quote shows it is in the paper.
In the paper
“In contrast, when we used the pan-reactive 6E10 Aβ antibody to detect total Aβ species in this fraction, the abundance trended slightly downward in PS2APP;Trem2ko mice and correlated negatively with Aβ42:Aβ40 ratio (Fig. 5F–H).”
§ Trem2 Deletion Reduces Late-Stage Amyloid Plaque Accumulation, Elevates the Aβ42:Aβ40 Ratio, and Exacerbates Axonal Dystrophy and Dendritic Spine Loss in the PS2APP Alzheimer's Mouse Model > Results > Reduced plaque consolidation, elevated neurotoxic Aβ species, and ApoE-laden microglia in Trem2-deficient brains
plaincorrelational- Asserted: passes — The authors put it forward as true.
- Checkable: passes — It can be checked against evidence.
- Load-bearing: unclear — It is unclear whether the paper’s conclusions depend on it.
- Based: passes — The paper gives a reason why it holds.
It may state two separate claims as one.
None of the sources cited for this claim have been checked yet.
In the paper
“Indeed, using the Campbell-Switzer silver stain to label amyloid plaque (Campbell et al., 1987; Switzer, 2000), we observed that plaque burden was increased in 6–7 month PS2APP;Trem2ko females, and trending upward but not reaching significance in 6–7 month PS2APP;Trem2ko males (Fig. 3A,B).”
§ Trem2 Deletion Reduces Late-Stage Amyloid Plaque Accumulation, Elevates the Aβ42:Aβ40 Ratio, and Exacerbates Axonal Dystrophy and Dendritic Spine Loss in the PS2APP Alzheimer's Mouse Model > Results > Plaque load is reduced in aged PS2APP;Trem2ko mice
What the sources say
- Not checked yetcites Campbell et al., 1987
- Not checked yetcites Switzer, 2000
plaindirect- Asserted: passes — The authors put it forward as true.
- Checkable: passes — It can be checked against evidence.
- Load-bearing: unclear — It is unclear whether the paper’s conclusions depend on it.
- Based: passes — The paper gives a reason why it holds.
It may state two separate claims as one.
In the paper
“Unlike the clear requirement of Trem2 for induction of many genes in the Neurodegeneration-related gene set, the downregulation of the Microglia and Brain Myeloid modules that normally occurs during any CNS challenge (Friedman et al., 2018) was not prevented by Trem2 deletion since expression of these modules was similar in PS2APP;Trem2wt and PS2APP;Trem2ko microglia (Fig. 2D; Fig. 2-3).”
§ Trem2 Deletion Reduces Late-Stage Amyloid Plaque Accumulation, Elevates the Aβ42:Aβ40 Ratio, and Exacerbates Axonal Dystrophy and Dendritic Spine Loss in the PS2APP Alzheimer's Mouse Model > Results > Trem2-dependent induction of the proliferation and neurodegeneration-related gene expression modules
What the sources say
- Not checked yetcites Friedman et al., 2018
plain- Asserted: passes — The authors put it forward as true.
- Checkable: passes — It can be checked against evidence.
- Load-bearing: unclear — It is unclear whether the paper’s conclusions depend on it.
- Based: passes — The paper gives a reason why it holds.
It may state two separate claims as one.
A result the paper reports from its own data — it cites no other source for it, so there is none to check. The quote shows it is in the paper.
In the paper
“The elevated Aβ42:Aβ40 ratio in PS2APP;Trem2ko brains resulted more from reduced abundance of Aβ40 than from increased abundance of Aβ42 (Fig. 5-1), although Aβ42 abundance was elevated in the 6–7 month females, coinciding with the increased plaque deposition we observed in that group (Fig. 3A).”
§ Trem2 Deletion Reduces Late-Stage Amyloid Plaque Accumulation, Elevates the Aβ42:Aβ40 Ratio, and Exacerbates Axonal Dystrophy and Dendritic Spine Loss in the PS2APP Alzheimer's Mouse Model > Results > Reduced plaque consolidation, elevated neurotoxic Aβ species, and ApoE-laden microglia in Trem2-deficient brains
plaindirect- Asserted: passes — The authors put it forward as true.
- Checkable: passes — It can be checked against evidence.
- Load-bearing: passes — The paper’s conclusions depend on it.
- Based: passes — The paper gives a reason why it holds.
It may state two separate claims as one.
A result the paper reports from its own data — it cites no other source for it, so there is none to check. The quote shows it is in the paper.
In the paper
“In contrast to the findings of Parhizkar et al. (2019), quantification of plaque-associated ApoE in whole-brain sections found a significant increase in female PS2APP;Trem2ko mice at 6–7 and 12 months of age, but no significant changes in male cohorts at any age tested (Fig. 6A).”
§ Trem2 Deletion Reduces Late-Stage Amyloid Plaque Accumulation, Elevates the Aβ42:Aβ40 Ratio, and Exacerbates Axonal Dystrophy and Dendritic Spine Loss in the PS2APP Alzheimer's Mouse Model > Results > Reduced plaque consolidation, elevated neurotoxic Aβ species, and ApoE-laden microglia in Trem2-deficient brains
plain- Asserted: passes — The authors put it forward as true.
- Checkable: passes — It can be checked against evidence.
- Load-bearing: passes — The paper’s conclusions depend on it.
- Based: passes — The paper gives a reason why it holds.
It may state two separate claims as one.
In the paper
“Using the conformation-specific OC antibody (Tomic et al., 2009), we detected significantly higher levels of soluble fibrillar Aβ oligomers in the soluble fraction from PS2APP;Trem2ko mice (Fig. 5C,D), and we observed a positive correlation between the amount of OC+ fibrillar oligomers in this fraction and the Aβ42:Aβ40 ratio (Fig. 5E).”
§ Trem2 Deletion Reduces Late-Stage Amyloid Plaque Accumulation, Elevates the Aβ42:Aβ40 Ratio, and Exacerbates Axonal Dystrophy and Dendritic Spine Loss in the PS2APP Alzheimer's Mouse Model > Results > Reduced plaque consolidation, elevated neurotoxic Aβ species, and ApoE-laden microglia in Trem2-deficient brains
What the sources say
- Not checked yetcites Tomic et al., 2009
plaincorrelational- Asserted: passes — The authors put it forward as true.
- Checkable: passes — It can be checked against evidence.
- Load-bearing: passes — The paper’s conclusions depend on it.
- Based: passes — The paper gives a reason why it holds.
It may state two separate claims as one.
In the paper
“Of the 134 genes in this set, 80 showed upregulation in PS2APP versus normal microglia (Friedman et al., 2018), and approximately half of these showed impaired induction in PS2APP;Trem2ko microglia (adjusted p values ≤ 0.05) (Fig. 2E).”
§ Trem2 Deletion Reduces Late-Stage Amyloid Plaque Accumulation, Elevates the Aβ42:Aβ40 Ratio, and Exacerbates Axonal Dystrophy and Dendritic Spine Loss in the PS2APP Alzheimer's Mouse Model > Results > Trem2-dependent induction of the proliferation and neurodegeneration-related gene expression modules
What the sources say
- Not checked yetcites Friedman et al., 2018
plaincorrelational- Asserted: passes — The authors put it forward as true.
- Checkable: passes — It can be checked against evidence.
- Load-bearing: passes — The paper’s conclusions depend on it.
- Based: passes — The paper gives a reason why it holds.
It may state two separate claims as one.
In the paper
“In a very recent dataset of bulk microglia RNA-Seq profiles from 5xFAD mice (Griciuc et al., 2019), we did see a twofold decrease in the extent of Apoe induction in Trem2-deficient microglia, but the gene was still highly induced relative to the expression level in microglia from nontransgenic mice (Fig. 6F).”
§ Trem2 Deletion Reduces Late-Stage Amyloid Plaque Accumulation, Elevates the Aβ42:Aβ40 Ratio, and Exacerbates Axonal Dystrophy and Dendritic Spine Loss in the PS2APP Alzheimer's Mouse Model > Results > Reduced plaque consolidation, elevated neurotoxic Aβ species, and ApoE-laden microglia in Trem2-deficient brains
What the sources say
- Not checked yetcites Griciuc et al., 2019
plaindirect- Asserted: passes — The authors put it forward as true.
- Checkable: passes — It can be checked against evidence.
- Load-bearing: unclear — It is unclear whether the paper’s conclusions depend on it.
- Based: passes — The paper gives a reason why it holds.
It may state two separate claims as one.
A result the paper reports from its own data — it cites no other source for it, so there is none to check. The quote shows it is in the paper.
In the paper
“The abundance of Aβ peptides rose markedly with age while the Aβ42:Aβ40 ratio declined, particularly in the GuHCl fraction (Fig. 5).”
§ Trem2 Deletion Reduces Late-Stage Amyloid Plaque Accumulation, Elevates the Aβ42:Aβ40 Ratio, and Exacerbates Axonal Dystrophy and Dendritic Spine Loss in the PS2APP Alzheimer's Mouse Model > Results > Reduced plaque consolidation, elevated neurotoxic Aβ species, and ApoE-laden microglia in Trem2-deficient brains
plaincorrelational- Asserted: passes — The authors put it forward as true.
- Checkable: passes — It can be checked against evidence.
- Load-bearing: unclear — It is unclear whether the paper’s conclusions depend on it.
- Based: passes — The paper gives a reason why it holds.
It may state two separate claims as one.
A result the paper reports from its own data — it cites no other source for it, so there is none to check. The quote shows it is in the paper.
In the paper
“Overall, the staining pattern appeared very similar to the Lamp1 stain, with “bouquets” of argyrophilic structures presumably surrounding plaques throughout the cortex and hippocampus. Staining was also observed in relevant white matter tracts, such as the corpus callosum, perforant path, and fornix, suggesting that degenerating axonal processes are not restricted to dystrophic neurites around”
§ Trem2 Deletion Reduces Late-Stage Amyloid Plaque Accumulation, Elevates the Aβ42:Aβ40 Ratio, and Exacerbates Axonal Dystrophy and Dendritic Spine Loss in the PS2APP Alzheimer's Mouse Model > Results > Axonal dystrophy, dendritic spine loss, and CSF NfL detection are exacerbated in PS2APP;Trem2ko mice
hedged- Asserted: passes — The authors put it forward as true.
- Checkable: passes — It can be checked against evidence.
- Load-bearing: passes — The paper’s conclusions depend on it.
- Based: passes — The paper gives a reason why it holds.
It may state two separate claims as one.
A result the paper reports from its own data — it cites no other source for it, so there is none to check. The quote shows it is in the paper.
In the paper
“These amber cores were reduced in PS2APP;Trem2het and nearly absent in PS2APP;Trem2ko brains, indicating that Trem2-dependent microglial activity is essential for the formation of these particular amyloid structures.”
§ Trem2 Deletion Reduces Late-Stage Amyloid Plaque Accumulation, Elevates the Aβ42:Aβ40 Ratio, and Exacerbates Axonal Dystrophy and Dendritic Spine Loss in the PS2APP Alzheimer's Mouse Model > Results > Plaque load is reduced in aged PS2APP;Trem2ko mice
plaindirect- Asserted: passes — The authors put it forward as true.
- Checkable: passes — It can be checked against evidence.
- Load-bearing: passes — The paper’s conclusions depend on it.
- Based: passes — The paper gives a reason why it holds.
It may state two separate claims as one.
The paper states this without a source or data behind it here, so there is nothing to check it against. The quote shows it is in the paper.
In the paper
“The fact that plaques in Trem2-deficient mice are more injurious to adjacent neurites but show weaker labeling with molecular probes (Thioflavin S, methoxy-X04 and X-34) related to those used in the clinic (11C-PiB, 18F-Florbetapir)”
§ Trem2 Deletion Reduces Late-Stage Amyloid Plaque Accumulation, Elevates the Aβ42:Aβ40 Ratio, and Exacerbates Axonal Dystrophy and Dendritic Spine Loss in the PS2APP Alzheimer's Mouse Model > Discussion
plaincorrelational- Asserted: passes — The authors put it forward as true.
- Checkable: passes — It can be checked against evidence.
- Load-bearing: passes — The paper’s conclusions depend on it.
- Based: passes — The paper gives a reason why it holds.
It may state two separate claims as one.
A result the paper reports from its own data — it cites no other source for it, so there is none to check. The quote shows it is in the paper.
In the paper
“preventing the microglial response to Aβ pathology via Trem2 deletion reversed neither axonal dystrophy nor dendritic spine loss around plaque and indeed made both of these pathologies worse.”
§ Trem2 Deletion Reduces Late-Stage Amyloid Plaque Accumulation, Elevates the Aβ42:Aβ40 Ratio, and Exacerbates Axonal Dystrophy and Dendritic Spine Loss in the PS2APP Alzheimer's Mouse Model > Discussion
plaindirect- Asserted: passes — The authors put it forward as true.
- Checkable: passes — It can be checked against evidence.
- Load-bearing: passes — The paper’s conclusions depend on it.
- Based: passes — The paper gives a reason why it holds.
It may state two separate claims as one.
A result the paper reports from its own data — it cites no other source for it, so there is none to check. The quote shows it is in the paper.
In the paper
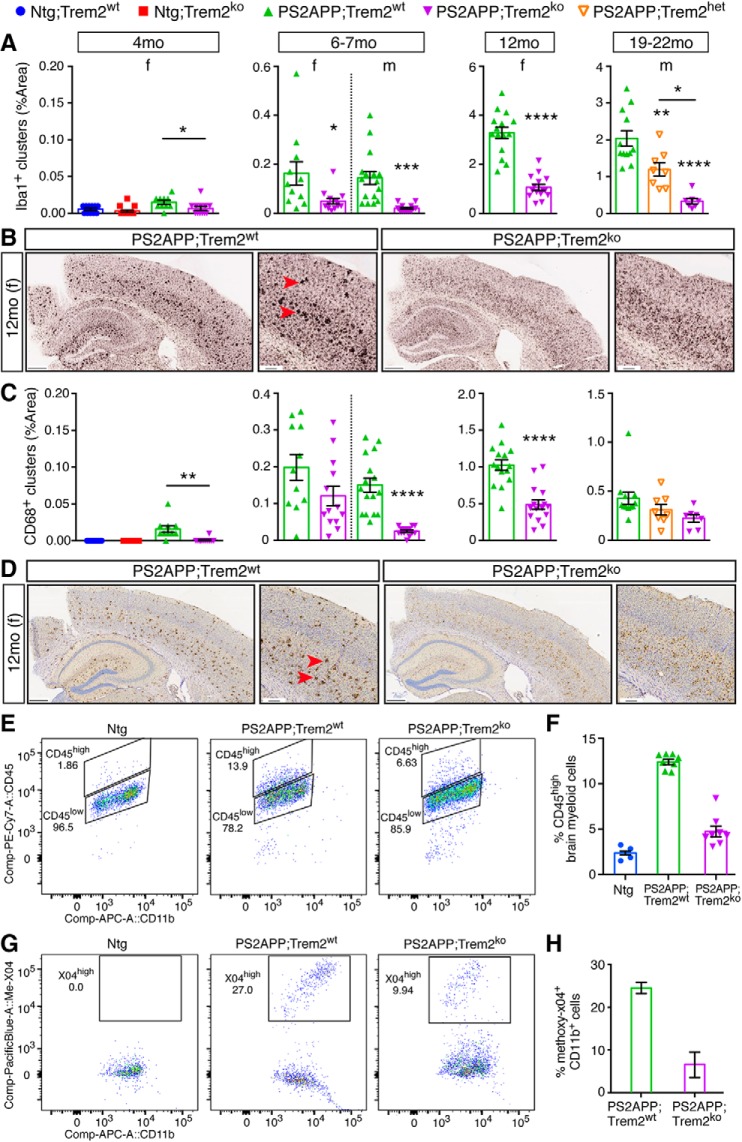
“At all ages examined, and in both sexes, microglial clustering around plaque and other measurements of microglial activation were sharply reduced in PS2APP;Trem2ko mice.”
§ Trem2 Deletion Reduces Late-Stage Amyloid Plaque Accumulation, Elevates the Aβ42:Aβ40 Ratio, and Exacerbates Axonal Dystrophy and Dendritic Spine Loss in the PS2APP Alzheimer's Mouse Model > Discussion
plaindirect- Asserted: passes — The authors put it forward as true.
- Checkable: passes — It can be checked against evidence.
- Load-bearing: passes — The paper’s conclusions depend on it.
- Based: passes — The paper gives a reason why it holds.
It may state two separate claims as one.
The paper states this without a source or data behind it here, so there is nothing to check it against. The quote shows it is in the paper.
In the paper
“From 6–7 months onward, axonal injury was magnified in PS2APP;Trem2ko mice, even at later ages when the abundance of argyrophilic amyloid plaques was diminished.”
§ Trem2 Deletion Reduces Late-Stage Amyloid Plaque Accumulation, Elevates the Aβ42:Aβ40 Ratio, and Exacerbates Axonal Dystrophy and Dendritic Spine Loss in the PS2APP Alzheimer's Mouse Model > Discussion
plaindirect- Asserted: passes — The authors put it forward as true.
- Checkable: passes — It can be checked against evidence.
- Load-bearing: passes — The paper’s conclusions depend on it.
- Based: passes — The paper gives a reason why it holds.
It may state two separate claims as one.
A result the paper reports from its own data — it cites no other source for it, so there is none to check. The quote shows it is in the paper.
In the paper
“We observed both age- and sex-dependent effects of Trem2 deletion on plaque abundance assessed using the Campbell-Switzer silver stain, with slightly more plaque in PS2APP;Trem2ko females at 6–7 months of age but markedly less plaque in both female and male PS2APP;Trem2ko mice at later ages.”
§ Trem2 Deletion Reduces Late-Stage Amyloid Plaque Accumulation, Elevates the Aβ42:Aβ40 Ratio, and Exacerbates Axonal Dystrophy and Dendritic Spine Loss in the PS2APP Alzheimer's Mouse Model > Discussion
plaindirect- Asserted: passes — The authors put it forward as true.
- Checkable: passes — It can be checked against evidence.
- Load-bearing: passes — The paper’s conclusions depend on it.
- Based: passes — The paper gives a reason why it holds.
It may state two separate claims as one.
A result the paper reports from its own data — it cites no other source for it, so there is none to check. The quote shows it is in the paper.
In the paper
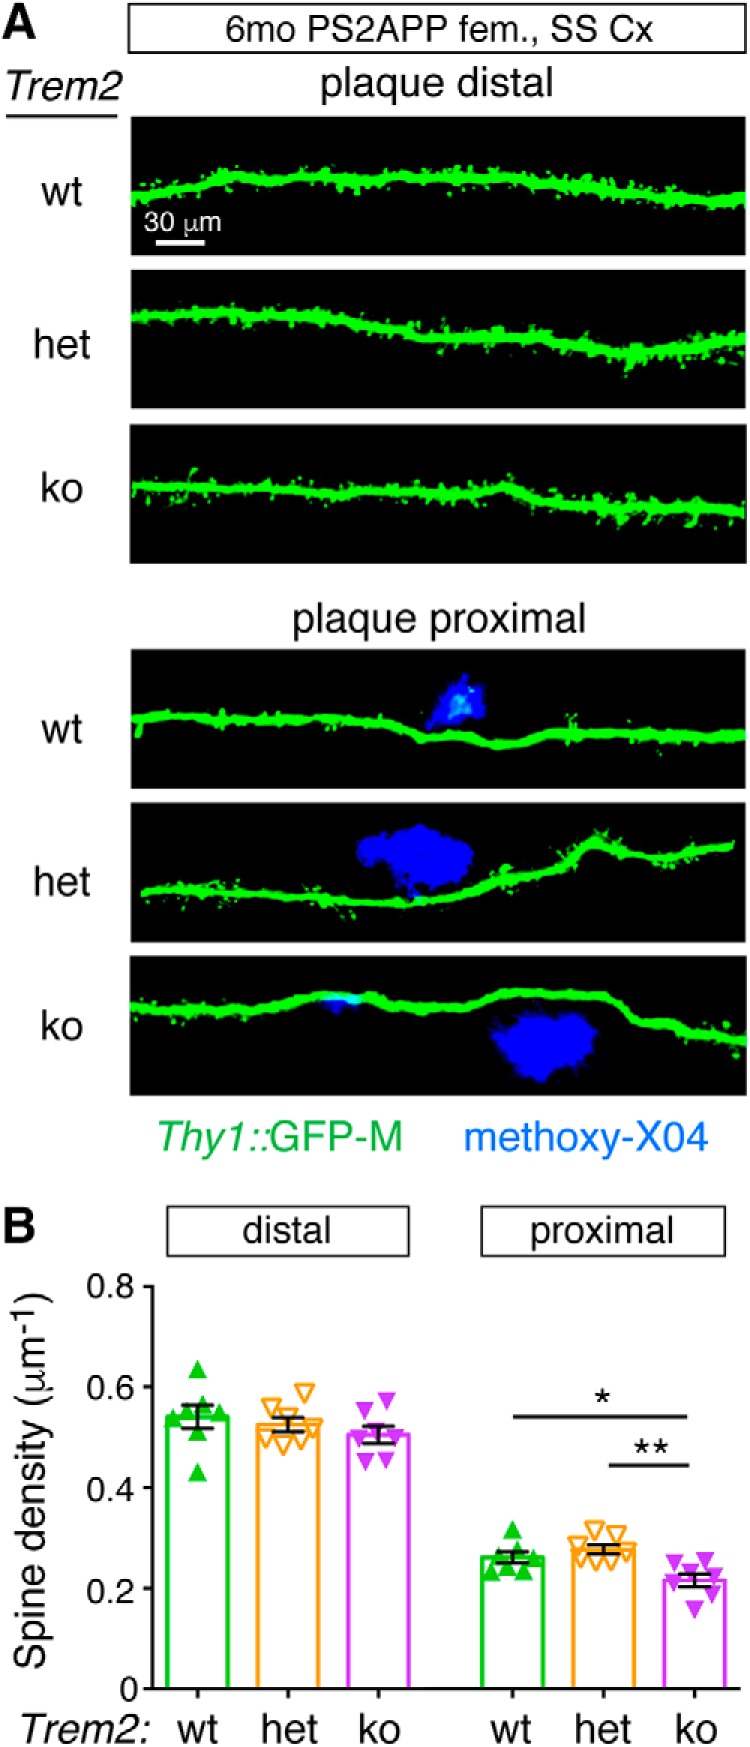
“Spine density loss in the proximity of plaques was not rescued by Trem2 deletion, but was actually further exacerbated in PS2APP;Trem2ko mice compared with PS2APP;Trem2wt or PS2APP;Trem2het groups (Fig. 9).”
- Also stated in: § Axonal dystrophy, dendritic spine loss, and CSF NfL detection are exacerbated in PS2APP;Trem2ko mice · plain
“Spine density near plaque was lower in PS2APP;Trem2ko mice than in PS2APP;Trem2wt or PS2APP;Trem2het mice.”
§ Trem2 Deletion Reduces Late-Stage Amyloid Plaque Accumulation, Elevates the Aβ42:Aβ40 Ratio, and Exacerbates Axonal Dystrophy and Dendritic Spine Loss in the PS2APP Alzheimer's Mouse Model > Results > Axonal dystrophy, dendritic spine loss, and CSF NfL detection are exacerbated in PS2APP;Trem2ko mice
plaindirect- Asserted: passes — The authors put it forward as true.
- Checkable: passes — It can be checked against evidence.
- Load-bearing: passes — The paper’s conclusions depend on it.
- Based: passes — The paper gives a reason why it holds.
It may state two separate claims as one.
- Also stated in: § Axonal dystrophy, dendritic spine loss, and CSF NfL detection are exacerbated in PS2APP;Trem2ko mice · plain
None of the sources cited for this claim have been checked yet.
In the paper
“Trem2 deletion in amyloidosis models has also been reported to either increase or decrease phosphorylation of the endogenous tau protein (Jay et al., 2015; Wang et al., 2016).”
§ Trem2 Deletion Reduces Late-Stage Amyloid Plaque Accumulation, Elevates the Aβ42:Aβ40 Ratio, and Exacerbates Axonal Dystrophy and Dendritic Spine Loss in the PS2APP Alzheimer's Mouse Model > Introduction
What the sources say
- Not checked yetcites Jay et al., 2015
- Not checked yetcites Wang et al., 2016
plainconditional- Asserted: passes — The authors put it forward as true.
- Checkable: passes — It can be checked against evidence.
- Load-bearing: fails — The paper’s conclusions may not depend on it.
- Based: passes — The paper gives a reason why it holds.
Probably not a substantial claim. The paper’s conclusions may not depend on it.
None of the sources cited for this claim have been checked yet.
In the paper
“However, whether Trem2 exerts protective or detrimental functions in mouse models of AD-related neuropathology has been rather unclear (Gratuze et al., 2018; Hansen et al., 2018; Ulland and Colonna, 2018).”
§ Trem2 Deletion Reduces Late-Stage Amyloid Plaque Accumulation, Elevates the Aβ42:Aβ40 Ratio, and Exacerbates Axonal Dystrophy and Dendritic Spine Loss in the PS2APP Alzheimer's Mouse Model > Introduction
What the sources say
- Not checked yetcites Gratuze et al., 2018
- Not checked yetcites Hansen et al., 2018
- Not checked yetcites Ulland and Colonna, 2018
plain- Asserted: passes — The authors put it forward as true.
- Checkable: passes — It can be checked against evidence.
- Load-bearing: passes — The paper’s conclusions depend on it.
- Based: passes — The paper gives a reason why it holds.
Probably not a substantial claim.
None of the sources cited for this claim have been checked yet.
In the paper
“In transgenic models of cerebral β-amyloidosis, plaque load has been reportedly increased, decreased, or unchanged in mice that lack Trem2, depending on the model, age, and brain region being analyzed (Jay et al., 2015, 2017a; Wang et al., 2015, 2016; Yuan et al., 2016; Parhizkar et al., 2019).”
§ Trem2 Deletion Reduces Late-Stage Amyloid Plaque Accumulation, Elevates the Aβ42:Aβ40 Ratio, and Exacerbates Axonal Dystrophy and Dendritic Spine Loss in the PS2APP Alzheimer's Mouse Model > Introduction
What the sources say
- Not checked yetcites Jay et al., 2015, 2017a
- Not checked yetcites Wang et al., 2015, 2016
- Not checked yetcites Yuan et al., 2016
hedgedcorrelational- Asserted: passes — The authors put it forward as true.
- Checkable: passes — It can be checked against evidence.
- Load-bearing: fails — The paper’s conclusions may not depend on it.
- Based: passes — The paper gives a reason why it holds.
Probably not a substantial claim. The paper’s conclusions may not depend on it.
None of the sources cited for this claim have been checked yet.
In the paper
“TREM2 is an Alzheimer's disease (AD) risk gene expressed in microglia.”
§ Trem2 Deletion Reduces Late-Stage Amyloid Plaque Accumulation, Elevates the Aβ42:Aβ40 Ratio, and Exacerbates Axonal Dystrophy and Dendritic Spine Loss in the PS2APP Alzheimer's Mouse Model > Abstract
What the sources say
- Not checked yetcites Guerreiro et al., 2013
- Not checked yetcites Jonsson et al., 2013
plain- Asserted: passes — The authors put it forward as true.
- Checkable: passes — It can be checked against evidence.
- Load-bearing: passes — The paper’s conclusions depend on it.
- Based: passes — The paper gives a reason why it holds.
It may state two separate claims as one.
None of the sources cited for this claim have been checked yet.
In the paper
“Dkk2, Wif1, and Ctnna3 can all negatively regulate Wnt activity (Hsieh et al., 1999; Busby et al., 2004; Gage et al., 2008), whereas Asb11 is important for maintaining progenitor cell activity in multiple cell types (Diks et al., 2006; Tee et al., 2012).”
§ Trem2 Deletion Reduces Late-Stage Amyloid Plaque Accumulation, Elevates the Aβ42:Aβ40 Ratio, and Exacerbates Axonal Dystrophy and Dendritic Spine Loss in the PS2APP Alzheimer's Mouse Model > Results > Trem2-dependent induction of the proliferation and neurodegeneration-related gene expression modules
What the sources say
- Not checked yetcites Diks et al., 2006
- Not checked yetcites Tee et al., 2012
plaindirect- Asserted: passes — The authors put it forward as true.
- Checkable: passes — It can be checked against evidence.
- Load-bearing: fails — The paper’s conclusions may not depend on it.
- Based: passes — The paper gives a reason why it holds.
Probably not a substantial claim. The paper’s conclusions may not depend on it.
In the paper
“We recently defined a number of gene expression modules that can be used to characterize the diverse ways that microglia respond to environmental and genetic perturbations (Friedman et al., 2018).”
§ Trem2 Deletion Reduces Late-Stage Amyloid Plaque Accumulation, Elevates the Aβ42:Aβ40 Ratio, and Exacerbates Axonal Dystrophy and Dendritic Spine Loss in the PS2APP Alzheimer's Mouse Model > Results > Trem2-dependent induction of the proliferation and neurodegeneration-related gene expression modules
What the sources say
- Not checked yetcites Friedman et al., 2018
plaincorrelational- Asserted: passes — The authors put it forward as true.
- Checkable: passes — It can be checked against evidence.
- Load-bearing: passes — The paper’s conclusions depend on it.
- Based: passes — The paper gives a reason why it holds.
Probably not a substantial claim.
What the paper did — it cites no source for this, so there is none to check. The quote shows it is in the paper.
In the paper
“All animal care and handling procedures were reviewed and approved by the Genentech Institutional Animal Care and Use Committee and were conducted in full compliance with regulatory statutes, Institutional Animal Care and Use Committee policies, and National Institutes of Health guidelines.”
§ Trem2 Deletion Reduces Late-Stage Amyloid Plaque Accumulation, Elevates the Aβ42:Aβ40 Ratio, and Exacerbates Axonal Dystrophy and Dendritic Spine Loss in the PS2APP Alzheimer's Mouse Model > Materials and Methods
plain- Asserted: passes — The authors put it forward as true.
- Checkable: passes — It can be checked against evidence.
- Load-bearing: fails — The paper’s conclusions may not depend on it.
- Based: passes — The paper gives a reason why it holds.
Probably not a substantial claim. The paper’s conclusions may not depend on it. It may state two separate claims as one.
What the paper did — it cites no source for this, so there is none to check. The quote shows it is in the paper.
In the paper
“MATLAB (The MathWorks) running on a high-performance computing cluster was used for all whole-slide image analyses performed in a blinded manner.”
§ Trem2 Deletion Reduces Late-Stage Amyloid Plaque Accumulation, Elevates the Aβ42:Aβ40 Ratio, and Exacerbates Axonal Dystrophy and Dendritic Spine Loss in the PS2APP Alzheimer's Mouse Model > Materials and Methods
plain- Asserted: passes — The authors put it forward as true.
- Checkable: passes — It can be checked against evidence.
- Load-bearing: fails — The paper’s conclusions may not depend on it.
- Based: passes — The paper gives a reason why it holds.
Probably not a substantial claim. The paper’s conclusions may not depend on it.
What the paper did — it cites no source for this, so there is none to check. The quote shows it is in the paper.
In the paper
“Images were collected and processed blind to genotypes.”
§ Trem2 Deletion Reduces Late-Stage Amyloid Plaque Accumulation, Elevates the Aβ42:Aβ40 Ratio, and Exacerbates Axonal Dystrophy and Dendritic Spine Loss in the PS2APP Alzheimer's Mouse Model > Materials and Methods
plain- Asserted: passes — The authors put it forward as true.
- Checkable: passes — It can be checked against evidence.
- Load-bearing: passes — The paper’s conclusions depend on it.
- Based: passes — The paper gives a reason why it holds.
Probably not a substantial claim.
What the paper did — it cites no source for this, so there is none to check. The quote shows it is in the paper.
In the paper
“To avoid the presence of peripheral myeloid cells in the flow analysis and FACS collections, Ccr2+ cells (peripheral monocytes/macrophages) and Ly6g+ cells (neutrophils) were excluded.”
§ Trem2 Deletion Reduces Late-Stage Amyloid Plaque Accumulation, Elevates the Aβ42:Aβ40 Ratio, and Exacerbates Axonal Dystrophy and Dendritic Spine Loss in the PS2APP Alzheimer's Mouse Model > Materials and Methods
plaindirect- Asserted: passes — The authors put it forward as true.
- Checkable: passes — It can be checked against evidence.
- Load-bearing: passes — The paper’s conclusions depend on it.
- Based: passes — The paper gives a reason why it holds.
Probably not a substantial claim.
In the paper
“PS2APP mice develop amyloid plaque and attendant gliosis pathologies that increase with age, with female mice accumulating the pathology more rapidly than males (Ozmen et al., 2009).”
§ Trem2 Deletion Reduces Late-Stage Amyloid Plaque Accumulation, Elevates the Aβ42:Aβ40 Ratio, and Exacerbates Axonal Dystrophy and Dendritic Spine Loss in the PS2APP Alzheimer's Mouse Model > Introduction
What the sources say
- Not checked yetcites Ozmen et al., 2009
plaindirect- Asserted: passes — The authors put it forward as true.
- Checkable: passes — It can be checked against evidence.
- Load-bearing: fails — The paper’s conclusions may not depend on it.
- Based: passes — The paper gives a reason why it holds.
Probably not a substantial claim. The paper’s conclusions may not depend on it. It may state two separate claims as one.
What the paper did — it cites no source for this, so there is none to check. The quote shows it is in the paper.
In the paper
“All steps were performed on ice or at 4°C to prevent artifactual microglial activation.”
§ Trem2 Deletion Reduces Late-Stage Amyloid Plaque Accumulation, Elevates the Aβ42:Aβ40 Ratio, and Exacerbates Axonal Dystrophy and Dendritic Spine Loss in the PS2APP Alzheimer's Mouse Model > Materials and Methods
plaindirect- Asserted: passes — The authors put it forward as true.
- Checkable: passes — It can be checked against evidence.
- Load-bearing: fails — The paper’s conclusions may not depend on it.
- Based: passes — The paper gives a reason why it holds.
Probably not a substantial claim. The paper’s conclusions may not depend on it.
A conclusion the paper draws from its own results — it cites no other source for it, so there is none to check. The quote shows it is in the paper.
In the paper
“indicative of reduced extents of microgliosis and astrogliosis, respectively, in PS2APP;Trem2ko mice”
§ Trem2 Deletion Reduces Late-Stage Amyloid Plaque Accumulation, Elevates the Aβ42:Aβ40 Ratio, and Exacerbates Axonal Dystrophy and Dendritic Spine Loss in the PS2APP Alzheimer's Mouse Model > Results > Plaque-associated microgliosis is impaired in PS2APP;Trem2ko microglia
hedgeddirect- Asserted: passes — The authors put it forward as true.
- Checkable: passes — It can be checked against evidence.
- Load-bearing: passes — The paper’s conclusions depend on it.
- Based: passes — The paper gives a reason why it holds.
It may state two separate claims as one.
None of the sources cited for this claim have been checked yet.
In the paper
“The acquisition of the DAM state is Trem2-dependent in mouse models of AD, amyotrophic lateral sclerosis, and demyelinating disease (Poliani et al., 2015; Wang et al., 2015; Keren-Shaul et al., 2017; Krasemann et al., 2017).”
§ Trem2 Deletion Reduces Late-Stage Amyloid Plaque Accumulation, Elevates the Aβ42:Aβ40 Ratio, and Exacerbates Axonal Dystrophy and Dendritic Spine Loss in the PS2APP Alzheimer's Mouse Model > Introduction
What the sources say
- Not checked yetcites Poliani et al., 2015
- Not checked yetcites Wang et al., 2015
- Not checked yetcites Keren-Shaul et al., 2017
plaindirect- Asserted: passes — The authors put it forward as true.
- Checkable: passes — It can be checked against evidence.
- Load-bearing: fails — The paper’s conclusions may not depend on it.
- Based: passes — The paper gives a reason why it holds.
Probably not a substantial claim. The paper’s conclusions may not depend on it.
In the paper
“In the hTau model (Andorfer et al., 2003), Trem2 deletion increased the amounts of tau phosphorylation and aggregation detected (Bemiller et al., 2017).”
§ Trem2 Deletion Reduces Late-Stage Amyloid Plaque Accumulation, Elevates the Aβ42:Aβ40 Ratio, and Exacerbates Axonal Dystrophy and Dendritic Spine Loss in the PS2APP Alzheimer's Mouse Model > Introduction
What the sources say
- Not checked yetcites Bemiller et al., 2017
plaindirect- Asserted: passes — The authors put it forward as true.
- Checkable: passes — It can be checked against evidence.
- Load-bearing: fails — The paper’s conclusions may not depend on it.
- Based: passes — The paper gives a reason why it holds.
Probably not a substantial claim. The paper’s conclusions may not depend on it.
What the paper did — it cites no source for this, so there is none to check. The quote shows it is in the paper.
In the paper
“All images, segmentation overlays, and data were reviewed by a pathologist.”
§ Trem2 Deletion Reduces Late-Stage Amyloid Plaque Accumulation, Elevates the Aβ42:Aβ40 Ratio, and Exacerbates Axonal Dystrophy and Dendritic Spine Loss in the PS2APP Alzheimer's Mouse Model > Materials and Methods
plain- Asserted: passes — The authors put it forward as true.
- Checkable: passes — It can be checked against evidence.
- Load-bearing: fails — The paper’s conclusions may not depend on it.
- Based: passes — The paper gives a reason why it holds.
Probably not a substantial claim. The paper’s conclusions may not depend on it.
None of the sources cited for this claim have been checked yet.
In the paper
“Dkk2, Wif1, and Ctnna3 can all negatively regulate Wnt activity (Hsieh et al., 1999; Busby et al., 2004; Gage et al., 2008), whereas Asb11 is important for maintaining progenitor cell activity in multiple cell types (Diks et al., 2006; Tee et al., 2012).”
§ Trem2 Deletion Reduces Late-Stage Amyloid Plaque Accumulation, Elevates the Aβ42:Aβ40 Ratio, and Exacerbates Axonal Dystrophy and Dendritic Spine Loss in the PS2APP Alzheimer's Mouse Model > Results > Trem2-dependent induction of the proliferation and neurodegeneration-related gene expression modules
What the sources say
- Not checked yetcites Hsieh et al., 1999
- Not checked yetcites Busby et al., 2004
- Not checked yetcites Gage et al., 2008
plaindirect- Asserted: passes — The authors put it forward as true.
- Checkable: passes — It can be checked against evidence.
- Load-bearing: fails — The paper’s conclusions may not depend on it.
- Based: passes — The paper gives a reason why it holds.
Probably not a substantial claim. The paper’s conclusions may not depend on it. It may state two separate claims as one.
What the paper did — it cites no source for this, so there is none to check. The quote shows it is in the paper.
In the paper
“CD45low and CD45high gates were defined using a nontransgenic animal as a control to identify microglia in their normal state (CD45low). The same gates were transposed onto cells from PS2APP animals sorted on the same day in the same machine to ensure accuracy and consistency in determining percentages of CD45low and CD45high populations.”
§ Trem2 Deletion Reduces Late-Stage Amyloid Plaque Accumulation, Elevates the Aβ42:Aβ40 Ratio, and Exacerbates Axonal Dystrophy and Dendritic Spine Loss in the PS2APP Alzheimer's Mouse Model > Materials and Methods
plainSingle case- Asserted: passes — The authors put it forward as true.
- Checkable: passes — It can be checked against evidence.
- Load-bearing: fails — The paper’s conclusions may not depend on it.
- Based: passes — The paper gives a reason why it holds.
Probably not a substantial claim. The paper’s conclusions may not depend on it. It may state two separate claims as one.
What the paper did — it cites no source for this, so there is none to check. The quote shows it is in the paper.
In the paper
“Two sections per animal were stained, with all cohorts stained and analyzed simultaneously.”
§ Trem2 Deletion Reduces Late-Stage Amyloid Plaque Accumulation, Elevates the Aβ42:Aβ40 Ratio, and Exacerbates Axonal Dystrophy and Dendritic Spine Loss in the PS2APP Alzheimer's Mouse Model > Materials and Methods
plain- Asserted: passes — The authors put it forward as true.
- Checkable: passes — It can be checked against evidence.
- Load-bearing: fails — The paper’s conclusions may not depend on it.
- Based: passes — The paper gives a reason why it holds.
Probably not a substantial claim. The paper’s conclusions may not depend on it. It may state two separate claims as one.
A conclusion the paper draws from its own results — it cites no other source for it, so there is none to check. The quote shows it is in the paper.
In the paper
“Collectively, our data indicate that Trem2-dependent microglial proliferation and activation attenuate the toxic effects of Aβ toward neurons (i.e., the DAM state is mainly protective)”
§ Trem2 Deletion Reduces Late-Stage Amyloid Plaque Accumulation, Elevates the Aβ42:Aβ40 Ratio, and Exacerbates Axonal Dystrophy and Dendritic Spine Loss in the PS2APP Alzheimer's Mouse Model > Introduction
hedgeddirect- Asserted: passes — The authors put it forward as true.
- Checkable: passes — It can be checked against evidence.
- Load-bearing: passes — The paper’s conclusions depend on it.
- Based: passes — The paper gives a reason why it holds.
It may state two separate claims as one.
- Rests on an assumption: The effects of Trem2 deletion in PS2APP mice are mediated specifically by microglial Trem2 rather than by other Trem2-expressing myeloid cells or non-myeloid cells.
What the paper did — it cites no source for this, so there is none to check. The quote shows it is in the paper.
In the paper
“Imaging and analysis were performed under blinded conditions.”
§ Trem2 Deletion Reduces Late-Stage Amyloid Plaque Accumulation, Elevates the Aβ42:Aβ40 Ratio, and Exacerbates Axonal Dystrophy and Dendritic Spine Loss in the PS2APP Alzheimer's Mouse Model > Materials and Methods
plain- Asserted: passes — The authors put it forward as true.
- Checkable: passes — It can be checked against evidence.
- Load-bearing: fails — The paper’s conclusions may not depend on it.
- Based: passes — The paper gives a reason why it holds.
Probably not a substantial claim. The paper’s conclusions may not depend on it.
None of the sources cited for this claim have been checked yet.
In the paper
“Transcriptional profiling studies have defined a disease/damage-associated microglial (DAM) activation state that is commonly observed in the brains of neurodegeneration models (Deczkowska et al., 2018; Friedman et al., 2018).”
§ Trem2 Deletion Reduces Late-Stage Amyloid Plaque Accumulation, Elevates the Aβ42:Aβ40 Ratio, and Exacerbates Axonal Dystrophy and Dendritic Spine Loss in the PS2APP Alzheimer's Mouse Model > Introduction
What the sources say
- Not checked yetcites Deczkowska et al., 2018
- Not checked yetcites Friedman et al., 2018
plaincorrelational- Asserted: passes — The authors put it forward as true.
- Checkable: passes — It can be checked against evidence.
- Load-bearing: passes — The paper’s conclusions depend on it.
- Based: passes — The paper gives a reason why it holds.
Probably not a substantial claim.
What the paper did — it cites no source for this, so there is none to check. The quote shows it is in the paper.
In the paper
“Generally, animal pairs, including one PS2APP;Trem2wt and one PS2APP;Trem2ko animal, were processed together from perfusion through sorting.”
§ Trem2 Deletion Reduces Late-Stage Amyloid Plaque Accumulation, Elevates the Aβ42:Aβ40 Ratio, and Exacerbates Axonal Dystrophy and Dendritic Spine Loss in the PS2APP Alzheimer's Mouse Model > Materials and Methods
hedged- Asserted: passes — The authors put it forward as true.
- Checkable: passes — It can be checked against evidence.
- Load-bearing: fails — The paper’s conclusions may not depend on it.
- Based: passes — The paper gives a reason why it holds.
Probably not a substantial claim. The paper’s conclusions may not depend on it.
What the paper did — it cites no source for this, so there is none to check. The quote shows it is in the paper.
In the paper
“The 6–7 month cohort of male and female mice was purposely analyzed separately to determine the effects of Trem2 deficiency in each sex since female mice have accelerated amyloid pathology compared with males, and we did not want an analysis of interactions between sex and Trem2 genotype to be confounded by the age-dependent differences in pathology between males and females.”
§ Trem2 Deletion Reduces Late-Stage Amyloid Plaque Accumulation, Elevates the Aβ42:Aβ40 Ratio, and Exacerbates Axonal Dystrophy and Dendritic Spine Loss in the PS2APP Alzheimer's Mouse Model > Materials and Methods
plain- Asserted: passes — The authors put it forward as true.
- Checkable: passes — It can be checked against evidence.
- Load-bearing: passes — The paper’s conclusions depend on it.
- Based: passes — The paper gives a reason why it holds.
Probably not a substantial claim. It may state two separate claims as one.
In the paper
“In contrast, in the PS19 model (Yoshiyama et al., 2007), Trem2 deletion had a protective effect, preventing tau-driven synaptic loss and atrophy in the hippocampus and entorhinal cortex, respectively (Leyns et al., 2017).”
§ Trem2 Deletion Reduces Late-Stage Amyloid Plaque Accumulation, Elevates the Aβ42:Aβ40 Ratio, and Exacerbates Axonal Dystrophy and Dendritic Spine Loss in the PS2APP Alzheimer's Mouse Model > Introduction
What the sources say
- Not checked yetcites Leyns et al., 2017
plaindirect- Asserted: passes — The authors put it forward as true.
- Checkable: passes — It can be checked against evidence.
- Load-bearing: fails — The paper’s conclusions may not depend on it.
- Based: passes — The paper gives a reason why it holds.
Probably not a substantial claim. The paper’s conclusions may not depend on it.
In the paper
“As a control, we spotted hippocampal TBS homogenate supernatant from a PS2APP;Bace1ko animal (Meilandt et al., 2019), in which soluble APP is still produced by α-cleavage while β-cleavage and thus Aβ production are prevented, and demonstrated that the OC antibody had minimal detection, whereas 6E10 still had substantial signal (compare # symbols in Fig. 5C,F and dotted lines in Fig. 5D,G from a PS”
§ Trem2 Deletion Reduces Late-Stage Amyloid Plaque Accumulation, Elevates the Aβ42:Aβ40 Ratio, and Exacerbates Axonal Dystrophy and Dendritic Spine Loss in the PS2APP Alzheimer's Mouse Model > Results > Reduced plaque consolidation, elevated neurotoxic Aβ species, and ApoE-laden microglia in Trem2-deficient brains
What the sources say
- Not checked yetcites Meilandt et al., 2019
boostedSingle case- Asserted: passes — The authors put it forward as true.
- Checkable: passes — It can be checked against evidence.
- Load-bearing: unclear — It is unclear whether the paper’s conclusions depend on it.
- Based: passes — The paper gives a reason why it holds.
It may state two separate claims as one.
None of the sources cited for this claim have been checked yet.
In the paper
“Together with our observation that total amyloid plaque is reduced in PS2APP;Trem2ko brains at later ages (Fig. 3A), these results suggest that the elevated Aβ42:Aβ40 ratio in Trem2-deficient brains may increase plaque seeding at younger ages (since Aβ42 is more prone to aggregate and deposit than Aβ40) (Klein, 2002) while reducing the incorporation and compaction of Aβ into existing plaques at”
§ Trem2 Deletion Reduces Late-Stage Amyloid Plaque Accumulation, Elevates the Aβ42:Aβ40 Ratio, and Exacerbates Axonal Dystrophy and Dendritic Spine Loss in the PS2APP Alzheimer's Mouse Model > Results > Reduced plaque consolidation, elevated neurotoxic Aβ species, and ApoE-laden microglia in Trem2-deficient brains
What the sources say
- Not checked yetcites Klein, 2002
- Not checked yetcites Condello et al., 2015
hedgedconditional- Asserted: passes — The authors put it forward as true.
- Checkable: passes — It can be checked against evidence.
- Load-bearing: passes — The paper’s conclusions depend on it.
- Based: passes — The paper gives a reason why it holds.
It may state two separate claims as one.
In the paper
“Overall, our results are reminiscent of a recent study of APPPS1 mice, which showed that Trem2 deletion produced increased seeding of amyloid plaques at early ages but slower rates of amyloid plaque accumulation at later ages (Parhizkar et al., 2019).”
§ Trem2 Deletion Reduces Late-Stage Amyloid Plaque Accumulation, Elevates the Aβ42:Aβ40 Ratio, and Exacerbates Axonal Dystrophy and Dendritic Spine Loss in the PS2APP Alzheimer's Mouse Model > Results > Plaque load is reduced in aged PS2APP;Trem2ko mice
What the sources say
- Not checked yetcites Parhizkar et al., 2019
plaindirect- Asserted: passes — The authors put it forward as true.
- Checkable: passes — It can be checked against evidence.
- Load-bearing: fails — The paper’s conclusions may not depend on it.
- Based: passes — The paper gives a reason why it holds.
Probably not a substantial claim. The paper’s conclusions may not depend on it.
A conclusion the paper draws from its own results — it cites no other source for it, so there is none to check. The quote shows it is in the paper.
In the paper
“Together, our evidence indicates that microglial Apoe expression is induced by Aβ-driven neuropathology in a largely Trem2-independent manner, and that Trem2-deficient microglia accumulate disproportionately large amounts of ApoE compared with the smaller ApoE puncta observed in normal PS2APP microglia (Fig. 6C).”
§ Trem2 Deletion Reduces Late-Stage Amyloid Plaque Accumulation, Elevates the Aβ42:Aβ40 Ratio, and Exacerbates Axonal Dystrophy and Dendritic Spine Loss in the PS2APP Alzheimer's Mouse Model > Results > Reduced plaque consolidation, elevated neurotoxic Aβ species, and ApoE-laden microglia in Trem2-deficient brains
hedgeddirect- Asserted: passes — The authors put it forward as true.
- Checkable: passes — It can be checked against evidence.
- Load-bearing: passes — The paper’s conclusions depend on it.
- Based: passes — The paper gives a reason why it holds.
It may state two separate claims as one.
A conclusion the paper draws from its own results — it cites no other source for it, so there is none to check. The quote shows it is in the paper.
In the paper
“Thus, Trem2 may both restrict the initial seeding of plaques and promote sequestration and compaction of Aβ into existing plaques.”
§ Trem2 Deletion Reduces Late-Stage Amyloid Plaque Accumulation, Elevates the Aβ42:Aβ40 Ratio, and Exacerbates Axonal Dystrophy and Dendritic Spine Loss in the PS2APP Alzheimer's Mouse Model > Results > Reduced plaque consolidation, elevated neurotoxic Aβ species, and ApoE-laden microglia in Trem2-deficient brains
hedgedconditional- Asserted: passes — The authors put it forward as true.
- Checkable: passes — It can be checked against evidence.
- Load-bearing: passes — The paper’s conclusions depend on it.
- Based: passes — The paper gives a reason why it holds.
It may state two separate claims as one.
A conclusion the paper draws from its own results — it cites no other source for it, so there is none to check. The quote shows it is in the paper.
In the paper
“The intermediate effect of Trem2 heterozygosity on microglial clustering around plaque (Figs. 1A, 7B) and Campbell-Switzer plaque staining (Fig. 3A), but not on plaque diffuseness (Fig. 4B), Aβ42:Aβ40 ratio (Fig. 5A), or neuritic dystrophy (Figs. 7C,D, 8A), suggested that the form rather than the amount of plaque correlates with neuronal damage, and that sufficient microgliosis occurs in PS2APP;T”
§ Trem2 Deletion Reduces Late-Stage Amyloid Plaque Accumulation, Elevates the Aβ42:Aβ40 Ratio, and Exacerbates Axonal Dystrophy and Dendritic Spine Loss in the PS2APP Alzheimer's Mouse Model > Results > Axonal dystrophy, dendritic spine loss, and CSF NfL detection are exacerbated in PS2APP;Trem2ko mice
hedgeddirect- Asserted: passes — The authors put it forward as true.
- Checkable: passes — It can be checked against evidence.
- Load-bearing: passes — The paper’s conclusions depend on it.
- Based: passes — The paper gives a reason why it holds.
It may state two separate claims as one.
None of the sources cited for this claim have been checked yet.
In the paper
“The elevated Aβ42:Aβ40 ratio and fibrillar Aβ oligomers in PS2APP;Trem2ko brains would seem to be detrimental for neuronal health since Aβ42 oligomers are commonly understood to be the more toxic form of Aβ (Klein, 2002; Haass and Selkoe, 2007).”
§ Trem2 Deletion Reduces Late-Stage Amyloid Plaque Accumulation, Elevates the Aβ42:Aβ40 Ratio, and Exacerbates Axonal Dystrophy and Dendritic Spine Loss in the PS2APP Alzheimer's Mouse Model > Results > Axonal dystrophy, dendritic spine loss, and CSF NfL detection are exacerbated in PS2APP;Trem2ko mice
What the sources say
- Not checked yetcites Klein, 2002
- Not checked yetcites Haass and Selkoe, 2007
boosted- Asserted: passes — The authors put it forward as true.
- Checkable: passes — It can be checked against evidence.
- Load-bearing: passes — The paper’s conclusions depend on it.
- Based: passes — The paper gives a reason why it holds.
Probably not a substantial claim.
In the paper
“Apoe is one of the most highly induced genes in mouse microglia in response to neurodegenerative stimuli (Deczkowska et al., 2018).”
§ Trem2 Deletion Reduces Late-Stage Amyloid Plaque Accumulation, Elevates the Aβ42:Aβ40 Ratio, and Exacerbates Axonal Dystrophy and Dendritic Spine Loss in the PS2APP Alzheimer's Mouse Model > Results > Reduced plaque consolidation, elevated neurotoxic Aβ species, and ApoE-laden microglia in Trem2-deficient brains
What the sources say
- Not checked yetcites Deczkowska et al., 2018
plaindirect- Asserted: passes — The authors put it forward as true.
- Checkable: passes — It can be checked against evidence.
- Load-bearing: fails — The paper’s conclusions may not depend on it.
- Based: passes — The paper gives a reason why it holds.
Probably not a substantial claim. The paper’s conclusions may not depend on it.
None of the sources cited for this claim have been checked yet.
In the paper
“NfL measured in the CSF or plasma has recently emerged as a potential biomarker of neurodegeneration in human patients and in mouse disease models (Bacioglu et al., 2016; Khalil et al., 2018).”
§ Trem2 Deletion Reduces Late-Stage Amyloid Plaque Accumulation, Elevates the Aβ42:Aβ40 Ratio, and Exacerbates Axonal Dystrophy and Dendritic Spine Loss in the PS2APP Alzheimer's Mouse Model > Results > Axonal dystrophy, dendritic spine loss, and CSF NfL detection are exacerbated in PS2APP;Trem2ko mice
What the sources say
- Not checked yetcites Bacioglu et al., 2016
- Not checked yetcites Khalil et al., 2018
hedged- Asserted: passes — The authors put it forward as true.
- Checkable: passes — It can be checked against evidence.
- Load-bearing: fails — The paper’s conclusions may not depend on it.
- Based: passes — The paper gives a reason why it holds.
Probably not a substantial claim. The paper’s conclusions may not depend on it.
What the paper did — it cites no source for this, so there is none to check. The quote shows it is in the paper.
In the paper
“Although we were blinded to Trem2 genotype, there was an obvious difference in plaque appearance between PS2APP;Trem2wt and PS2APP;Trem2ko brains, with X-34+ structures in PS2APP;Trem2ko brains looking more splayed and less compact (Fig. 4A), similar to descriptions of Trem2-dependent plaque alterations in other β-amyloid models (Wang et al., 2016; Yuan et al., 2016).”
§ Trem2 Deletion Reduces Late-Stage Amyloid Plaque Accumulation, Elevates the Aβ42:Aβ40 Ratio, and Exacerbates Axonal Dystrophy and Dendritic Spine Loss in the PS2APP Alzheimer's Mouse Model > Results > Reduced plaque consolidation, elevated neurotoxic Aβ species, and ApoE-laden microglia in Trem2-deficient brains
plain- Asserted: passes — The authors put it forward as true.
- Checkable: passes — It can be checked against evidence.
- Load-bearing: fails — The paper’s conclusions may not depend on it.
- Based: passes — The paper gives a reason why it holds.
Probably not a substantial claim. The paper’s conclusions may not depend on it.
A conclusion the paper draws from its own results — it cites no other source for it, so there is none to check. The quote shows it is in the paper.
In the paper
“Alternatively, the increased abundance of fibrillar Aβ oligomers in the TBS-soluble fraction could result from reduced incorporation into highly condensed plaques in brains with Trem2-deficient microglia.”
§ Trem2 Deletion Reduces Late-Stage Amyloid Plaque Accumulation, Elevates the Aβ42:Aβ40 Ratio, and Exacerbates Axonal Dystrophy and Dendritic Spine Loss in the PS2APP Alzheimer's Mouse Model > Results > Reduced plaque consolidation, elevated neurotoxic Aβ species, and ApoE-laden microglia in Trem2-deficient brains
hedgedconditional- Asserted: passes — The authors put it forward as true.
- Checkable: passes — It can be checked against evidence.
- Load-bearing: fails — The paper’s conclusions may not depend on it.
- Based: passes — The paper gives a reason why it holds.
Probably not a substantial claim. The paper’s conclusions may not depend on it.
None of the sources cited for this claim have been checked yet.
In the paper
“elevated PET signal for ligands of the “neuroinflammation marker” TSPO have predicted better cognitive measures and slower AD progression in mice with β-amyloid pathology and human patients, respectively (Hamelin et al., 2016; Focke et al., 2019).”
§ Trem2 Deletion Reduces Late-Stage Amyloid Plaque Accumulation, Elevates the Aβ42:Aβ40 Ratio, and Exacerbates Axonal Dystrophy and Dendritic Spine Loss in the PS2APP Alzheimer's Mouse Model > Discussion
What the sources say
- Not checked yetcites Hamelin et al., 2016
- Not checked yetcites Focke et al., 2019
plaincorrelational- Asserted: passes — The authors put it forward as true.
- Checkable: passes — It can be checked against evidence.
- Load-bearing: passes — The paper’s conclusions depend on it.
- Based: passes — The paper gives a reason why it holds.
It may state two separate claims as one.
None of the sources cited for this claim have been checked yet.
In the paper
“another feature of neuronal pathology observed in AD tissues and β-amyloid mouse models, reduced synaptic density, particularly near plaque (Spires and Hyman, 2004; Tsai et al., 2004; Spires et al., 2005)”
§ Trem2 Deletion Reduces Late-Stage Amyloid Plaque Accumulation, Elevates the Aβ42:Aβ40 Ratio, and Exacerbates Axonal Dystrophy and Dendritic Spine Loss in the PS2APP Alzheimer's Mouse Model > Results > Axonal dystrophy, dendritic spine loss, and CSF NfL detection are exacerbated in PS2APP;Trem2ko mice
What the sources say
- Not checked yetcites Spires and Hyman, 2004
- Not checked yetcites Tsai et al., 2004
- Not checked yetcites Spires et al., 2005
plaincorrelational- Asserted: passes — The authors put it forward as true.
- Checkable: passes — It can be checked against evidence.
- Load-bearing: passes — The paper’s conclusions depend on it.
- Based: passes — The paper gives a reason why it holds.
Probably not a substantial claim.
In the paper
“Together with a recent similar report (Parhizkar et al., 2019), these results suggest that Trem2-dependent microglial activity may both restrain the formation/seeding of plaques at an early stage of pathology, conceivably through uptake and degradation of soluble Aβ species, but also enhance the sequestration of Aβ into existing plaque structures, particularly at later stages of pathology.”
§ Trem2 Deletion Reduces Late-Stage Amyloid Plaque Accumulation, Elevates the Aβ42:Aβ40 Ratio, and Exacerbates Axonal Dystrophy and Dendritic Spine Loss in the PS2APP Alzheimer's Mouse Model > Discussion
What the sources say
- Not checked yetcites Parhizkar et al., 2019
hedgedconditional- Asserted: passes — The authors put it forward as true.
- Checkable: passes — It can be checked against evidence.
- Load-bearing: passes — The paper’s conclusions depend on it.
- Based: passes — The paper gives a reason why it holds.
It may state two separate claims as one.
None of the sources cited for this claim have been checked yet.
In the paper
“Evidence in humans and mice supports the mechanistic model that β-amyloid pathology accelerates the accumulation of tau pathology or enhances its spreading (Pooler et al., 2015; He et al., 2018; Jack et al., 2018; Jacobs et al., 2018)”
§ Trem2 Deletion Reduces Late-Stage Amyloid Plaque Accumulation, Elevates the Aβ42:Aβ40 Ratio, and Exacerbates Axonal Dystrophy and Dendritic Spine Loss in the PS2APP Alzheimer's Mouse Model > Discussion
What the sources say
- Not checked yetcites Pooler et al., 2015
- Not checked yetcites He et al., 2018
- Not checked yetcites Jack et al., 2018
boosteddirect- Asserted: passes — The authors put it forward as true.
- Checkable: passes — It can be checked against evidence.
- Load-bearing: unclear — It is unclear whether the paper’s conclusions depend on it.
- Based: passes — The paper gives a reason why it holds.
It may state two separate claims as one.
A conclusion the paper draws from its own results — it cites no other source for it, so there is none to check. The quote shows it is in the paper.
In the paper
“The reduction of this plaque accumulation activity in PS2APP;Trem2ko brains may underlie the elevated levels of fibrillar oligomeric Aβ we detected in the soluble fraction, which may in turn be a source of increased neuronal injury in these animals.”
§ Trem2 Deletion Reduces Late-Stage Amyloid Plaque Accumulation, Elevates the Aβ42:Aβ40 Ratio, and Exacerbates Axonal Dystrophy and Dendritic Spine Loss in the PS2APP Alzheimer's Mouse Model > Discussion
hedgedconditional- Asserted: passes — The authors put it forward as true.
- Checkable: passes — It can be checked against evidence.
- Load-bearing: passes — The paper’s conclusions depend on it.
- Based: passes — The paper gives a reason why it holds.
It may state two separate claims as one.
The paper relies on this without support.
The effects of Trem2 deletion in PS2APP mice are mediated specifically by microglial Trem2 rather than by other Trem2-expressing myeloid cells or non-myeloid cells.
“TREM2 is an Alzheimer's disease (AD) risk gene expressed in microglia.”
The paper relies on this without support.
The Trem2tm1(KOMP)Vlcg allele completely abolishes Trem2 function in PS2APP;Trem2ko mice.
“The Trem2tm1(KOMP)Vlcg null allele (C57BL/6N background) was crossed into the PS2APP model (C57BL/6J background).”
The paper relies on this without support.
Amber core amyloid staining represents a mature form of highly condensed plaque.
“At this age, the Campbell-Switzer stain also revealed a distinctive pattern of “amber core” amyloid staining in PS2APP brains (Fig. 3C), thought to represent a mature form of highly condensed plaque.”
The paper relies on this without support.
Cognitive decline correlates better with tau pathology and synapse loss than with brain amyloid detection.
“helps explain why cognitive decline correlates better with tau pathology and synapse loss than with brain amyloid detection.”
Claims other papers make about this one
Each is checked against this paper’s own text: does it say what the citing paper says it does?
The source backs part of the claim, not all of it — or backs it for a different population, condition or comparison.
In the citing paper
“AD progression is better correlated with tau pathology, neuronal degeneration, Aβ spreading and synapse loss, rather than Aβ detection alone [222]”
From Microglia and monocytes in inflammatory CNS disease: integrating phenotype and function (2022) · cites this paper as [222]
Experimental — accuracy not yet measuredThe source backs part of the claim, not all of it — or backs it for a different population, condition or comparison.
In the citing paper
“which may be a result of reduced oligomeric Aβ compaction as described previously in another amyloidogenic mouse model. 62”
From PLCG2 modulates TREM2 expression and signaling in response to Alzheimer's disease pathology (2025) · cites this paper as [62]
Experimental — accuracy not yet measuredThe source backs part of the claim, not all of it — or backs it for a different population, condition or comparison.
In the citing paper
“More recently, this dichotomy has been elegantly demonstrated in multiple models of Trem2 and Tyrobp [49–51, 55–59].”
From Deletion of Abi3/Gngt2 influences age-progressive amyloid β and tau pathologies in distinctive ways (2022) · cites this paper as [57]
Experimental — accuracy not yet measuredThe cited source says what the claim attributes to it.
In the citing paper
“Recent important studies have also shown that impaired/absent Trem2 function attenuates the microglial response to amyloid pathology by regulating microglial number around plaques, regulating microglial activity, and restricting neuritic damage (37,61,84–87,95–99).”
From Trem2 promotes anti-inflammatory responses in microglia and is suppressed under pro-inflammatory conditions (2020) · cites this paper as [98]
The cited source says what the claim attributes to it.
In the citing paper
“A similar interpretation could be developed from the studies of Trem2 deficiency, as differences were dependent on early versus later disease stages.50,51,57,58”
From Microglial INPP5D limits plaque formation and glial reactivity in the PSAPP mouse model of Alzheimer's disease (2023) · cites this paper as [57]
The cited source says what the claim attributes to it.
In the citing paper
“These studies have led to the notion that microglia can have differential effects on AD pathology depending on the disease stage.”
From The effect of Abi3 locus deletion on the progression of Alzheimer’s disease-related pathologies (2023) · cites this paper as [8]
The cited source says what the claim attributes to it.
In the citing paper
“Earlier studies on other microglial AD risk genes reported opposing effects on AD-related pathologies using various animal models at different ages (8–14).”
From The effect of Abi3 locus deletion on the progression of Alzheimer’s disease-related pathologies (2023) · cites this paper as [8]
The cited source says what the claim attributes to it.
In the citing paper
“Functional studies demonstrated that deletion of Trem2 altered amyloid pathology in opposite directions depending on the stage of the disease (20–23), but overexpression of TREM2 reduced the pathology in transgenic mouse models of amyloidosis (24).”
From Deletion of Abi3 gene locus exacerbates neuropathological features of Alzheimer’s disease in a mouse model of Aβ amyloidosis (2021) · cites this paper as [23]
The cited source says what the claim attributes to it.
In the citing paper
“Conflicting results have been reported regarding amyloid plaque deposition and the effect of TREM2 loss [7,8,9,10,11], suggesting that the effect of TREM2 on Ab deposition may be dependent on age, sex, and the model utilized.”
From TREM2-Deficient Microglia Attenuate Tau Spreading In Vivo (2023) · cites this paper as [9]
The cited source says what the claim attributes to it.
In the citing paper
“Indeed, manipulation of expression of Trem2, Tyrobp, Cx3cl1/Cx3cr1, IL1β, and IFN-γ have all been shown to have opposing effects on amyloid and tau pathologies [49–51, 55–65].”
From Deletion of Abi3/Gngt2 influences age-progressive amyloid β and tau pathologies in distinctive ways (2022) · cites this paper as [57]
Citations
Cites
Moderated estimation of fold change and dispersion for RNA-seq data with DESeq2
Love, M. I., Huber, W., & Anders, S. (2014) · Genome Biology · doi:10.1186/s13059-014-0550-8 · Cited by 95,106 · cited 1×
“Normalization was based on the nRPKM method, which is proportional to size factor normalization of DESeq (Love et al., 2014).”
Neuroinflammation in Alzheimer's disease
Heneka, M. T., Carson, M. J., Khoury, J. E., Landreth, G. E., Brosseron, F., Feinstein, D. L., Jacobs, A. H., Wyss-Coray, T., Vitorica, J., Ransohoff, R. M., et al. (2015) · The Lancet Neurology · doi:10.1016/s1474-4422(15)70016-5 · Cited by 6,226 · cited 1×
“Moreover, many have proposed that chronic microglial activation is a key damaging agent that contributes to the neurotoxic environment in AD (Heneka et al., 2015; Park et al., 2018).”
Backgroundvoom: precision weights unlock linear model analysis tools for RNA-seq read counts
Law, C. W., Chen, Y., Shi, W., & Smyth, G. K. (2014) · Genome Biology · doi:10.1186/gb-2014-15-2-r29 · Cited by 6,155 · cited 1×
“Differential expression was performed using voom limma (Law et al., 2014).”
MethodA Unique Microglia Type Associated with Restricting Development of Alzheimer’s Disease
Keren-Shaul, H., Spinrad, A., Weiner, A., Matcovitch-Natan, O., Dvir-Szternfeld, R., Ulland, T. K., David, E., Baruch, K., Lara-Astaiso, D., Toth, B., et al. (2017) · Cell · doi:10.1016/j.cell.2017.05.018 · Cited by 5,493 · cited 12×
“The entirety of these changes is approximately equivalent to the so-called DAM (Keren-Shaul et al., 2017) or MgND (Krasemann et al.”
BackgroundMethodResultInfluentialSoluble protein oligomers in neurodegeneration: lessons from the Alzheimer's amyloid β-peptide
Haass, C., & Selkoe, D. J. (2007) · Nature Reviews Molecular Cell Biology · doi:10.1038/nrm2101 · Cited by 4,744 · cited 2×
“Axonal dystrophy, dendritic spine loss, and CSF NfL detection are exacerbated in PS2APP;Trem2 ko mice The elevated A 42:A 40 ratio and fibrillar A oligomers in PS2APP;Trem2 ko brains would seem to be detrimental for neuronal health since A 42 oligomers are commonly understood to be the more toxic form of A (Klein, 200…”
BackgroundComplement and microglia mediate early synapse loss in Alzheimer mouse models
Hong, S., Beja-Glasser, V. F., Nfonoyim, B. M., Frouin, A., Li, S., Ramakrishnan, S., Merry, K. M., Shi, Q., Rosenthal, A., Barres, B. A., et al. (2016) · Science · doi:10.1126/science.aad8373 · Cited by 3,343 · cited 2×
“…underscored that the Trem2-dependent microglial activation around plaque is protective for neurons and is distinct from microglia-mediated, complement-mediated activities that contribute to synapse loss in -amyloid models (Fonseca et al., 2004; Hong et al., 2016; Shi et al., 2017; Wu et al., 2019).”
BackgroundMi, H., Muruganujan, A., Ebert, D., Huang, X., & Thomas, P. D. (2018) · Nucleic Acids Research · doi:10.1093/nar/gky1038 · Cited by 3,030 · cited 2×
“1 (Mi et al., 2019) at the website (http:// pantherdb.”
MethodInfluentialTREM2 Variants in Alzheimer's Disease
Guerreiro, R., Wojtas, A., Bras, J., Carrasquillo, M., Rogaeva, E., Majounie, E., Cruchaga, C., Sassi, C., Kauwe, J. S. K., Younkin, S., et al. (2013) · New England Journal of Medicine · doi:10.1056/nejmoa1211851 · Cited by 3,020 · cited 2×
“Since the discovery of TREM2 (triggering receptor expressed on myeloid cells 2) variants as genetic risk factors for Alzheimer’s disease (AD) (Guerreiro et al., 2013; Jonsson et al., 2013), TREM2 biology has become a focal point in research efforts to better understand how the innate immune system impacts AD and other…”
BackgroundKrasemann, S., Madore, C., Cialic, R., Baufeld, C., Calcagno, N., El Fatimy, R., Beckers, L., O’Loughlin, E., Xu, Y., Fanek, Z., et al. (2017) · Immunity · doi:10.1016/j.immuni.2017.08.008 · Cited by 2,979 · cited 6×
“Although two groups have reported reductions in microglial Apoe expression in the APPPS1 model when Trem2 is deleted (Krasemann et al., 2017; Parhizkar et al., 2019), this does not appear to be a typical feature of Trem2 deficiency in -amyloidosis models since previous analyses in the 5xFAD model…”
BackgroundMethodResultInfluentialVariant of TREM2 Associated with the Risk of Alzheimer's Disease
Jonsson, T., Stefansson, H., Steinberg, S., Jonsdottir, I., Jonsson, P. V., Snaedal, J., Bjornsson, S., Huttenlocher, J., Levey, A. I., Lah, J. J., et al. (2013) · New England Journal of Medicine · doi:10.1056/nejmoa1211103 · Cited by 2,558 · cited 2×
“Since the discovery of TREM2 (triggering receptor expressed on myeloid cells 2) variants as genetic risk factors for Alzheimer’s disease (AD) (Guerreiro et al., 2013; Jonsson et al., 2013), TREM2 biology has become a focal point in research efforts to better understand how the innate immune system impacts AD and other…”
BackgroundSynapse Loss and Microglial Activation Precede Tangles in a P301S Tauopathy Mouse Model
Yoshiyama, Y., Higuchi, M., Zhang, B., Huang, S.-M., Iwata, N., Saido, T. C., Maeda, J., Suhara, T., Trojanowski, J. Q., & Lee, V. M.-Y. (2007) · Neuron · doi:10.1016/j.neuron.2007.01.010 · Cited by 2,208 · cited 1×
“In contrast, in the PS19 model (Yoshiyama et al., 2007), Trem2 deletion had a protective effect, preventing tau-driven synaptic loss and atrophy in the hippocampus and entorhinal cortex, respectively (Leyns et al., 2017).”
ResultA practical guide to evaluating colocalization in biological microscopy
Dunn, K. W., Kamocka, M. M., & McDonald, J. H. (2011) · American Journal of Physiology-Cell Physiology · doi:10.1152/ajpcell.00462.2010 · Cited by 2,012 · cited 2×
“To determine colocalization of ApoE and Iba1 staining, or methoxy-X04 and Iba1 staining, we calculated the Mander’s colocalization coefficients using the ImageJ plugin JACoP, as described previously (Dunn et al., 2011).”
MethodNeurofilaments as biomarkers in neurological disorders
Khalil, M., Teunissen, C. E., Otto, M., Piehl, F., Sormani, M. P., Gattringer, T., Barro, C., Kappos, L., Comabella, M., Fazekas, F., et al. (2018) · Nature Reviews Neurology · doi:10.1038/s41582-018-0058-z · Cited by 1,988 · cited 1×
“NfL measured in the CSF or plasma has recently emerged as a potential biomarker of neurodegeneration in human patients and in mouse disease models (Bacioglu et al., 2016; Khalil et al., 2018).”
BackgroundMicroglia in Alzheimer’s disease
Hansen, D. V., Hanson, J. E., & Sheng, M. (2018) · Journal of Cell Biology · doi:10.1083/jcb.201709069 · Cited by 1,935
Self-citationTREM2 Lipid Sensing Sustains the Microglial Response in an Alzheimer’s Disease Model
Wang, Y., Cella, M., Mallinson, K., Ulrich, J. D., Young, K. L., Robinette, M. L., Gilfillan, S., Krishnan, G. M., Sudhakar, S., Zinselmeyer, B. H., et al. (2015) · Cell · doi:10.1016/j.cell.2015.01.049 · Cited by 1,736 · cited 10×
“Plaque load is reduced in aged PS2APP;Trem2 ko mice In the 5xFAD mouse model, plaque load was reportedly unchanged in 4 month Trem2 ko mice but increased in 8 month Trem2 ko hippocampus (Wang et al., 2015, 2016; Yuan et al., 2016).”
BackgroundMethodResultInfluentialDisease-Associated Microglia: A Universal Immune Sensor of Neurodegeneration
Deczkowska, A., Keren-Shaul, H., Weiner, A., Colonna, M., Schwartz, M., & Amit, I. (2018) · Cell · doi:10.1016/j.cell.2018.05.003 · Cited by 1,474 · cited 2×
“Apoe is one of the most highly induced genes in mouse microglia in response to neurodegenerative stimuli (Deczkowska et al., 2018).”
BackgroundTREM2 Maintains Microglial Metabolic Fitness in Alzheimer’s Disease
Ulland, T. K., Song, W. M., Huang, S. C.-C., Ulrich, J. D., Sergushichev, A., Beatty, W. L., Loboda, A. A., Zhou, Y., Cairns, N. J., Kambal, A., et al. (2017) · Cell · doi:10.1016/j.cell.2017.07.023 · Cited by 1,263 · cited 2×
“, 2003), AKT and mTOR signaling (Ulland et al., 2017), attenuation of proinflammatory macrophage activation (Turnbull et al.”
BackgroundYeh, F. L., Wang, Y., Tom, I., Gonzalez, L. C., & Sheng, M. (2016) · Neuron · doi:10.1016/j.neuron.2016.06.015 · Cited by 943 · cited 1×
“…fraction of PS2APP;Trem2 ko brains could reflect direct deficits in the Trem2-mediated binding and clearance of oligomeric A 42 by microglia (Yeh et al., 2016; Lessard et al., 2018; Zhao et al., 2018), it could also reflect enhanced clearance of A 40 through other means, such as vascular…”
BackgroundSelf-citationTREM2-mediated early microglial response limits diffusion and toxicity of amyloid plaques
Wang, Y., Ulland, T. K., Ulrich, J. D., Song, W., Tzaferis, J. A., Hole, J. T., Yuan, P., Mahan, T. E., Shi, Y., Gilfillan, S., et al. (2016) · Journal of Experimental Medicine · doi:10.1084/jem.20151948 · Cited by 840 · cited 7×
“Plaque load is reduced in aged PS2APP;Trem2 ko mice In the 5xFAD mouse model, plaque load was reportedly unchanged in 4 month Trem2 ko mice but increased in 8 month Trem2 ko hippocampus (Wang et al., 2015, 2016; Yuan et al., 2016).”
BackgroundResultInfluentialYuan, P., Condello, C., Keene, C. D., Wang, Y., Bird, T. D., Paul, S. M., Luo, W., Colonna, M., Baddeley, D., & Grutzendler, J. (2016) · Neuron · doi:10.1016/j.neuron.2016.05.003 · Cited by 817
TREM2 Is a Receptor for β-Amyloid that Mediates Microglial Function
Zhao, Y., Wu, X., Li, X., Jiang, L.-L., Gui, X., Liu, Y., Sun, Y., Zhu, B., Piña-Crespo, J. C., Zhang, M., et al. (2018) · Neuron · doi:10.1016/j.neuron.2018.01.031 · Cited by 763 · cited 1×
“…fraction of PS2APP;Trem2 ko brains could reflect direct deficits in the Trem2-mediated binding and clearance of oligomeric A 42 by microglia (Yeh et al., 2016; Lessard et al., 2018; Zhao et al., 2018), it could also reflect enhanced clearance of A 40 through other means, such as vascular efflux.”
BackgroundA new secreted protein that binds to Wnt proteins and inhibits their activites
Hsieh, J.-C., Kodjabachian, L., Rebbert, M. L., Rattner, A., Smallwood, P. M., Samos, C. H., Nusse, R., Dawid, I. B., & Nathans, J. (1999) · Nature · doi:10.1038/18899 · Cited by 750 · cited 1×
“Dkk2, Wif1, and Ctnna3 can all negatively regulate Wnt activity (Hsieh et al., 1999; Busby et al., 2004; Gage et al., 2008), whereas Asb11 is important for maintaining progenitor cell activity in multiple cell types (Diks et al., 2006; Tee et al., 2012).”
BackgroundTREM2 — a key player in microglial biology and Alzheimer disease
Ulland, T. K., & Colonna, M. (2018) · Nature Reviews Neurology · doi:10.1038/s41582-018-0072-1 · Cited by 735 · cited 2×
“…compaction of A into dense plaques is a protective microglial activity, limiting the exposure of neurons to toxic A species. tive or detrimental functions in mouse models of AD-related neuropathology has been rather unclear (Gratuze et al., 2018; Hansen et al., 2018; Ulland and Colonna, 2018).”
BackgroundHyperphosphorylation and aggregation of tau in mice expressing normal human tau isoforms
Andorfer, C., Kress, Y., Espinoza, M., De Silva, R., Tucker, K. L., Barde, Y., Duff, K., & Davies, P. (2003) · Journal of Neurochemistry · doi:10.1046/j.1471-4159.2003.01879.x · Cited by 722 · cited 1×
“In the hTau model (Andorfer et al., 2003), Trem2 deletion increased the amounts of tau phosphorylation and aggregation detected (Bemiller et al., 2017).”
BackgroundMicroglia constitute a barrier that prevents neurotoxic protofibrillar Aβ42 hotspots around plaques
Condello, C., Yuan, P., Schain, A., & Grutzendler, J. (2015) · Nature Communications · doi:10.1038/ncomms7176 · Cited by 718 · cited 4×
“3A), these results suggest that the elevated A 42: A 40 ratio in Trem2-deficient brains may increase plaque seeding at younger ages (since A 42 is more prone to aggregate and deposit than A 40) (Klein, 2002) while reducing the incorporation and compaction of A into existing plaques at older ages (since A 40 permeates…”
BackgroundInfluentialSpangenberg, E. E., Lee, R. J., Najafi, A. R., Rice, R. A., Elmore, M. R. P., Blurton-Jones, M., West, B. L., & Green, K. N. (2016) · Brain · doi:10.1093/brain/aww016 · Cited by 695 · cited 1×
“In -amyloid models, the reduction in synapse number requires the presence of microglia since depleting the microglial cell population largely prevents loss of synaptic density (Olmos-Alonso et al., 2016; Spangenberg et al., 2016).”
BackgroundCutting Edge: TREM-2 Attenuates Macrophage Activation
Turnbull, I. R., Gilfillan, S., Cella, M., Aoshi, T., Miller, M., Piccio, L., Hernandez, M., & Colonna, M. (2006) · The Journal of Immunology · doi:10.4049/jimmunol.177.6.3520 · Cited by 688 · cited 2×
“, 2017), attenuation of proinflammatory macrophage activation (Turnbull et al., 2006), chemotaxis (Mazaheri et al.”
BackgroundJay, T. R., Miller, C. M., Cheng, P. J., Graham, L. C., Bemiller, S., Broihier, M. L., Xu, G., Margevicius, D., Karlo, J. C., Sousa, G. L., et al. (2015) · Journal of Experimental Medicine · doi:10.1084/jem.20142322 · Cited by 682 · cited 5×
“Trem2 deletion in amyloidosis models has also been reported to either increase or decrease phosphorylation of the endogenous tau protein (Jay et al., 2015; Wang et al., 2016).”
BackgroundMethodResultInfluentialFriedman, B. A., Srinivasan, K., Ayalon, G., Meilandt, W. J., Lin, H., Huntley, M. A., Cao, Y., Lee, S.-H., Haddick, P. C. G., Ngu, H., et al. (2018) · Cell Reports · doi:10.1016/j.celrep.2017.12.066 · Cited by 662 · cited 5×
“The majority of these transcripts showed upregulation in microglial expression profiles from the PS2APP model (Friedman et al., 2018) and other models of -amyloid pathology (Orre et al., 2014; Wang et al., 2015) compared with nontransgenic mice (Fig.”
BackgroundInfluentialSelf-citationHe, Z., Guo, J. L., McBride, J. D., Narasimhan, S., Kim, H., Changolkar, L., Zhang, B., Gathagan, R. J., Yue, C., Dengler, C., et al. (2018) · Nature Medicine · doi:10.1038/nm.4443 · Cited by 645
A 3D human triculture system modeling neurodegeneration and neuroinflammation in Alzheimer’s disease
Park, J., Wetzel, I., Marriott, I., Dréau, D., D’Avanzo, C., Kim, D. Y., Tanzi, R. E., & Cho, H. (2018) · Nature Neuroscience · doi:10.1038/s41593-018-0175-4 · Cited by 644
Complement C3 deficiency protects against neurodegeneration in aged plaque-rich APP/PS1 mice
Shi, Q., Chowdhury, S., Ma, R., Le, K. X., Hong, S., Caldarone, B. J., Stevens, B., & Lemere, C. A. (2017) · Science Translational Medicine · doi:10.1126/scitranslmed.aaf6295 · Cited by 593 · cited 2×
“…underscored that the Trem2-dependent microglial activation around plaque is protective for neurons and is distinct from microglia-mediated, complement-mediated activities that contribute to synapse loss in -amyloid models (Fonseca et al., 2004; Hong et al., 2016; Shi et al., 2017; Wu et al., 2019).”
BackgroundFibrillar amyloid deposition leads to local synaptic abnormalities and breakage of neuronal branches
Tsai, J., Grutzendler, J., Duff, K., & Gan, W.-B. (2004) · Nature Neuroscience · doi:10.1038/nn1335 · Cited by 561 · cited 1×
“Finally, we looked at whether another feature of neuronal pathology observed in AD tissues and -amyloid mouse models, reduced synaptic density, particularly near plaque (Spires and Hyman, 2004; Tsai et al., 2004; Spires et al., 2005), was altered in Trem2-deficient mice.”
BackgroundLoss of TREM2 function increases amyloid seeding but reduces plaque-associated ApoE
Parhizkar, S., Arzberger, T., Brendel, M., Kleinberger, G., Deussing, M., Focke, C., Nuscher, B., Xiong, M., Ghasemigharagoz, A., Katzmarski, N., et al. (2019) · Nature Neuroscience · doi:10.1038/s41593-018-0296-9 · Cited by 555 · cited 14×
“Parhizkar et al. (2019) also reported that colocalization of ApoE with Iba1 microglia was reduced in Trem2-deficient mice.”
BackgroundMethodResultInfluentialAβ toxicity in Alzheimer’s disease: globular oligomers (ADDLs) as new vaccine and drug targets
Klein, W. L. (2002) · Neurochemistry International · doi:10.1016/s0197-0186(02)00050-5 · Cited by 551
Spires, T. L., Meyer-Luehmann, M., Stern, E. A., McLean, P. J., Skoch, J., Nguyen, P. T., Bacskai, B. J., & Hyman, B. T. (2005) · The Journal of Neuroscience · doi:10.1523/jneurosci.1879-05.2005 · Cited by 550 · cited 1×
“Finally, we looked at whether another feature of neuronal pathology observed in AD tissues and -amyloid mouse models, reduced synaptic density, particularly near plaque (Spires and Hyman, 2004; Tsai et al., 2004; Spires et al., 2005), was altered in Trem2-deficient mice.”
BackgroundOlmos-Alonso, A., Schetters, S. T. T., Sri, S., Askew, K., Mancuso, R., Vargas-Caballero, M., Holscher, C., Perry, V. H., & Gomez-Nicola, D. (2016) · Brain · doi:10.1093/brain/awv379 · Cited by 532 · cited 1×
“In -amyloid models, the reduction in synapse number requires the presence of microglia since depleting the microglial cell population largely prevents loss of synaptic density (Olmos-Alonso et al., 2016; Spangenberg et al., 2016).”
BackgroundMicrobes and Alzheimer’s Disease
Itzhaki, R. F., Lathe, R., Balin, B. J., Ball, M. J., Bearer, E. L., Braak, H., Bullido, M. J., Carter, C., Clerici, M., Cosby, S. L., et al. (2016) · Journal of Alzheimer’s Disease · doi:10.3233/jad-160152 · Cited by 532 · cited 2×
“The weakness of correlation between plaque abundance and cognitive status in humans, along with several unsuccessful clinical trials aimed at preventing cognitive decline by reducing brain A levels, has led some to question the relevance of A in the etiology and progression of AD (Krstic and Knuesel, 2013; Morris et a…”
BackgroundTREM2 sustains microglial expansion during aging and response to demyelination
Poliani, P. L., Wang, Y., Fontana, E., Robinette, M. L., Yamanishi, Y., Gilfillan, S., & Colonna, M. (2015) · Journal of Clinical Investigation · doi:10.1172/jci77983 · Cited by 525 · cited 1×
“The acquisition of the DAM state is Trem2-dependent in mouse models of AD, amyotrophic lateral sclerosis, and demyelinating disease (Poliani et al., 2015; Wang et al., 2015; Keren-Shaul et al., 2017; Krasemann et al., 2017).”
BackgroundInconsistencies and Controversies Surrounding the Amyloid Hypothesis of Alzheimer's Disease
Morris, G. P., Clark, I. A., & Vissel, B. (2014) · Acta Neuropathologica Communications · doi:10.1186/s40478-014-0135-5 · Cited by 522 · cited 2×
“The weakness of correlation between plaque abundance and cognitive status in humans, along with several unsuccessful clinical trials aimed at preventing cognitive decline by reducing brain A levels, has led some to question the relevance of A in the etiology and progression of AD (Krstic and Knuesel, 2013; Morris et a…”
BackgroundHamelin, L., Lagarde, J., Dorothée, G., Leroy, C., Labit, M., Comley, R. A., de Souza, L. C., Corne, H., Dauphinot, L., Bertoux, M., et al. (2016) · Brain · doi:10.1093/brain/aww017 · Cited by 519 · cited 1×
“…primarily beneficial in the context of AD pathology, elevated PET signal for ligands of the “neuroinflammation marker” TSPO have predicted better cognitive measures and slower AD progression in mice with -amyloid pathology and human patients, respectively (Hamelin et al., 2016; Focke et al., 2019).”
BackgroundLeyns, C. E. G., Ulrich, J. D., Finn, M. B., Stewart, F. R., Koscal, L. J., Remolina Serrano, J., Robinson, G. O., Anderson, E., Colonna, M., & Holtzman, D. M. (2017) · Proceedings of the National Academy of Sciences · doi:10.1073/pnas.1710311114 · Cited by 517 · cited 2×
“, 2007), Trem2 deletion had a protective effect, preventing tau-driven synaptic loss and atrophy in the hippocampus and entorhinal cortex, respectively (Leyns et al., 2017).”
BackgroundResultNew insights into the role of TREM2 in Alzheimer’s disease
Gratuze, M., Leyns, C. E. G., & Holtzman, D. M. (2018) · Molecular Neurodegeneration · doi:10.1186/s13024-018-0298-9 · Cited by 489 · cited 2×
“…compaction of A into dense plaques is a protective microglial activity, limiting the exposure of neurons to toxic A species. tive or detrimental functions in mouse models of AD-related neuropathology has been rather unclear (Gratuze et al., 2018; Hansen et al., 2018; Ulland and Colonna, 2018).”
BackgroundWu, T., Dejanovic, B., Gandham, V. D., Gogineni, A., Edmonds, R., Schauer, S., Srinivasan, K., Huntley, M. A., Wang, Y., Wang, T.-M., et al. (2019) · Cell Reports · doi:10.1016/j.celrep.2019.07.060 · Cited by 466 · cited 1×
“…underscored that the Trem2-dependent microglial activation around plaque is protective for neurons and is distinct from microglia-mediated, complement-mediated activities that contribute to synapse loss in -amyloid models (Fonseca et al., 2004; Hong et al., 2016; Shi et al., 2017; Wu et al., 2019).”
BackgroundSelf-citationBouchon, A., Hernández-Munain, C., Cella, M., & Colonna, M. (2001) · The Journal of Experimental Medicine · doi:10.1084/jem.194.8.1111 · Cited by 460 · cited 1×
“…described roles for Trem2 in osteoclast function (Cella et al., 2003; Paloneva et al., 2003), AKT and mTOR signaling (Ulland et al., 2017), attenuation of proinflammatory macrophage activation (Turnbull et al., 2006), chemotaxis (Mazaheri et al., 2017), and DAP12 signaling (Bouchon et al., 2001).”
BackgroundDisease Progression-Dependent Effects of TREM2 Deficiency in a Mouse Model of Alzheimer's Disease
Jay, T. R., Hirsch, A. M., Broihier, M. L., Miller, C. M., Neilson, L. E., Ransohoff, R. M., Lamb, B. T., & Landreth, G. E. (2017) · The Journal of Neuroscience · doi:10.1523/jneurosci.2110-16.2016 · Cited by 457
Longitudinal tau PET in ageing and Alzheimer’s disease
Jack, C. R., Wiste, H. J., Schwarz, C. G., Lowe, V. J., Senjem, M. L., Vemuri, P., Weigand, S. D., Therneau, T. M., Knopman, D. S., Gunter, J. L., et al. (2018) · Brain · doi:10.1093/brain/awy059 · Cited by 452 · cited 1×
“…model that -amyloid pathology accelerates the accumulation of tau pathology or enhances its spreading (Pooler et al., 2015; He et al., 2018; Jack et al., 2018; Jacobs et al., 2018), and a new report indicates that this effect is further magnified in Trem2-deficient mice (Leyns et al.,…”
BackgroundTREM2, microglia, and neurodegenerative diseases
Yeh, F. L., Hansen, D. V., & Sheng, M. (2017) · Trends in Molecular Medicine · doi:10.1016/j.molmed.2017.03.008 · Cited by 440 · cited 2×
“…for Alzheimer’s disease (AD) (Guerreiro et al., 2013; Jonsson et al., 2013), TREM2 biology has become a focal point in research efforts to better understand how the innate immune system impacts AD and other neurodegenerative diseases (Jay et al., 2017b; Ulrich et al., 2017; Yeh et al., 2017).”
BackgroundSelf-citationBacioglu, M., Maia, L. F., Preische, O., Schelle, J., Apel, A., Kaeser, S. A., Schweighauser, M., Eninger, T., Lambert, M., Pilotto, A., et al. (2016) · Neuron · doi:10.1016/j.neuron.2016.05.018 · Cited by 435
GMAP and GSNAP for Genomic Sequence Alignment: Enhancements to Speed, Accuracy, and Functionality
Wu, T. D., Reeder, J., Lawrence, M. F., Becker, G., & Brauer, M. J. (2016) · Methods in molecular biology · doi:10.1007/978-1-4939-3578-9_15 · Cited by 428 · cited 1×
“Remaining reads were aligned to the GRCm38 genome with GSNAP aligner (Wu et al., 2016), and reads overlapping each gene were quantified.”
MethodSelf-citationTREM2 in Neurodegenerative Diseases
Jay, T. R., von Saucken, V. E., & Landreth, G. E. (2017) · Molecular Neurodegeneration · doi:10.1186/s13024-017-0197-5 · Cited by 427 · cited 4×
“…genes was consistent with the notion mentioned above that Wnt-related signaling was impaired and also corroborated reports from other -amyloid models that proliferation markers, such as Ki67 or BrdU, were observed less frequently in Trem2-deficient microglia (Wang et al., 2016; Jay et al., 2017a).”
BackgroundMethodResultInfluentialKlunk, W. E., Bacskai, B. J., Mathis, C. A., Kajdasz, S. T., McLellan, M. E., Frosch, M. P., Debnath, M. L., Holt, D. P., Wang, Y., & Hyman, B. T. (2002) · Journal of Neuropathology & Experimental Neurology · doi:10.1093/jnen/61.9.797 · Cited by 412 · cited 1×
“At 24 h before brain collection, animals received intraperitoneal injections of methoxy-X04 (10 mg/kg) to label amyloid structures (Klunk et al., 2002).”
MethodGowrishankar, S., Yuan, P., Wu, Y., Schrag, M., Paradise, S., Grutzendler, J., De Camilli, P., & Ferguson, S. M. (2015) · Proceedings of the National Academy of Sciences · doi:10.1073/pnas.1510329112 · Cited by 406 · cited 2×
“, 2003) by fluorescent costaining using methoxyX04 to label plaque, anti-Iba1 to label microglia, and anti-Lamp1 to label dystrophic axons (Gowrishankar et al., 2015) (Fig.”
BackgroundIsolation of glia from Alzheimer’s mice reveals inflammation and dysfunction
Orre, M., Kamphuis, W., Osborn, L. M., Jansen, A. H. P., Kooijman, L., Bossers, K., & Hol, E. M. (2014) · Neurobiology of Aging · doi:10.1016/j.neurobiolaging.2014.06.004 · Cited by 394 · cited 2×
“The majority of these transcripts showed upregulation in microglial expression profiles from the PS2APP model (Friedman et al., 2018) and other models of -amyloid pathology (Orre et al., 2014; Wang et al., 2015) compared with nontransgenic mice (Fig.”
BackgroundTREM2 Acts Downstream of CD33 in Modulating Microglial Pathology in Alzheimer's Disease
Griciuc, A., Patel, S., Federico, A. N., Choi, S. H., Innes, B. J., Oram, M. K., Cereghetti, G., McGinty, D., Anselmo, A., Sadreyev, R. I., et al. (2019) · Neuron · doi:10.1016/j.neuron.2019.06.010 · Cited by 378 · cited 8×
“We also observed less induc- tion of the Proliferation module in Trem2 ko microglia expression profiles from the 5xFAD model (Griciuc et al., 2019) (Fig.”
BackgroundMethodResultInfluentialLoss of TREM2 function increases amyloid seeding but reduces plaque-associated ApoE
Parhizkar, S., Arzberger, T., Brendel, M., Kleinberger, G., Deußing, M., Focke, C., Nuscher, B., Xiong, M., Ghasemigharagoz, A., Katzmarski, N., et al. (2019) · doi:10.7892/boris.125653 · Cited by 352
TREM2 deficiency impairs chemotaxis and microglial responses to neuronal injury
Mazaheri, F., Snaidero, N., Kleinberger, G., Madore, C., Daria, A., Werner, G., Krasemann, S., Capell, A., Trümbach, D., Wurst, W., et al. (2017) · The EMBO Reports · doi:10.15252/embr.201743922 · Cited by 351 · cited 2×
“…described roles for Trem2 in osteoclast function (Cella et al., 2003; Paloneva et al., 2003), AKT and mTOR signaling (Ulland et al., 2017), attenuation of proinflammatory macrophage activation (Turnbull et al., 2006), chemotaxis (Mazaheri et al., 2017), and DAP12 signaling (Bouchon et al., 2001).”
BackgroundAbsence of C1q Leads to Less Neuropathology in Transgenic Mouse Models of Alzheimer's Disease
Fonseca, M. I., Zhou, J., Botto, M., & Tenner, A. J. (2004) · The Journal of Neuroscience · doi:10.1523/jneurosci.0901-04.2004 · Cited by 345 · cited 2×
“…underscored that the Trem2-dependent microglial activation around plaque is protective for neurons and is distinct from microglia-mediated, complement-mediated activities that contribute to synapse loss in -amyloid models (Fonseca et al., 2004; Hong et al., 2016; Shi et al., 2017; Wu et al., 2019).”
BackgroundTomic, J. L., Pensalfini, A., Head, E., & Glabe, C. G. (2009) · Neurobiology of Disease · doi:10.1016/j.nbd.2009.05.024 · Cited by 336 · cited 1×
“Using the conformation-specific OC antibody (Tomic et al., 2009), we detected significantly higher levels of soluble fibrillar A oligomers in the soluble fraction from PS2APP;Trem2 ko mice (Fig.”
BackgroundUntangling the brain’s neuroinflammatory and neurodegenerative transcriptional responses
Srinivasan, K., Friedman, B. A., Larson, J. L., Lauffer, B. E., Goldstein, L. D., Appling, L. L., Borneo, J., Poon, C., Ho, T., Cai, F., et al. (2016) · Nature Communications · doi:10.1038/ncomms11295 · Cited by 336 · cited 2×
“Tissues were dissociated and cell suspensions prepared as described previously (Srinivasan et al., 2016).”
MethodSelf-citationTREM2 function impedes tau seeding in neuritic plaques
Leyns, C. E. G., Gratuze, M., Narasimhan, S., Jain, N., Koscal, L. J., Jiang, H., Manis, M., Colonna, M., Lee, V. M. Y., Ulrich, J. D., et al. (2019) · Nature Neuroscience · doi:10.1038/s41593-019-0433-0 · Cited by 332 · cited 2×
“…model that -amyloid pathology accelerates the accumulation of tau pathology or enhances its spreading (Pooler et al., 2015; He et al., 2018; Jack et al., 2018; Jacobs et al., 2018), and a new report indicates that this effect is further magnified in Trem2-deficient mice (Leyns et al., 2019).”
BackgroundKremen2 modulates Dickkopf2 activity during Wnt/lRP6 signaling
Mao, B., & Niehrs, C. (2003) · Gene · doi:10.1016/s0378-1119(02)01106-x · Cited by 325 · cited 2×
“tivator of the pathway (Wu et al., 2000; Mao and Niehrs, 2003; Devotta et al., 2018) and since induction of regulators, including Wif1, can occur downstream of active -catenin as negative feedback (Diep et al.”
BackgroundElucidating the Role of TREM2 in Alzheimer’s Disease
Ulrich, J. D., Ulland, T. K., Colonna, M., & Holtzman, D. M. (2017) · Neuron · doi:10.1016/j.neuron.2017.02.042 · Cited by 325 · cited 2×
“…for Alzheimer’s disease (AD) (Guerreiro et al., 2013; Jonsson et al., 2013), TREM2 biology has become a focal point in research efforts to better understand how the innate immune system impacts AD and other neurodegenerative diseases (Jay et al., 2017b; Ulrich et al., 2017; Yeh et al., 2017).”
BackgroundDAP12/TREM2 deficiency results in impaired osteoclast differentiation and osteoporotic features
Paloneva, J., Mandelin, J., Kiialainen, A., Böhling, T., Prudlo, J., Hakola, P., Haltia, M., Konttinen, Y. T., & Peltonen, L. (2003) · The Journal of Experimental Medicine · doi:10.1084/jem.20030027 · Cited by 318 · cited 2×
“The Trem2-dependent genes identified in these processes may underlie described roles for Trem2 in osteoclast function (Cella et al., 2003; Paloneva et al., 2003), AKT and mTOR signaling (Ulland et al., 2017), attenuation of proinflammatory macrophage activation (Turnbull et al., 2006), chemotaxis…”
BackgroundTREM2 Promotes Microglial Survival by Activating Wnt/β-Catenin Pathway
Zheng, H., Jia, L., Liu, C.-C., Rong, Z., Zhong, L., Yang, L., Chen, X.-F., Fryer, J. D., Wang, X., Zhang, Y.-W., et al. (2017) · The Journal of Neuroscience · doi:10.1523/jneurosci.2459-16.2017 · Cited by 317 · cited 2×
“The reduced expression of Wnt-related signaling components and regulators in PS2APP;Trem2 ko microglia may be consistent with previous reports of coordinated signaling between Trem2 and -catenin pathways within microglia (Zheng et al., 2017; Zulfiqar and Tanriöver, 2017).”
ResultBemiller, S. M., McCray, T. J., Allan, K., Formica, S. V., Xu, G., Wilson, G., Kokiko-Cochran, O. N., Crish, S. D., Lasagna-Reeves, C. A., Ransohoff, R. M., et al. (2017) · Molecular Neurodegeneration · doi:10.1186/s13024-017-0216-6 · Cited by 299 · cited 1×
“In the hTau model (Andorfer et al., 2003), Trem2 deletion increased the amounts of tau phosphorylation and aggregation detected (Bemiller et al., 2017).”
BackgroundJacobs, H. I. L., Hedden, T., Schultz, A. P., Sepulcre, J., Perea, R. D., Amariglio, R. E., Papp, K. V., Rentz, D. M., Sperling, R. A., & Johnson, K. A. (2018) · Nature Neuroscience · doi:10.1038/s41593-018-0070-z · Cited by 270 · cited 2×
“…model that -amyloid pathology accelerates the accumulation of tau pathology or enhances its spreading (Pooler et al., 2015; He et al., 2018; Jack et al., 2018; Jacobs et al., 2018), and a new report indicates that this effect is further magnified in Trem2-deficient mice (Leyns et al., 2019).”
BackgroundImpaired Differentiation of Osteoclasts in TREM-2–deficient Individuals
Cella, M., Buonsanti, C., Strader, C., Kondo, T., Salmaggi, A., & Colonna, M. (2003) · Journal of Experimental Medicine · doi:10.1084/jem.20022220 · Cited by 256 · cited 1×
“The Trem2-dependent genes identified in these processes may underlie described roles for Trem2 in osteoclast function (Cella et al., 2003; Paloneva et al., 2003), AKT and mTOR signaling (Ulland et al., 2017), attenuation of proinflammatory macrophage activation (Turnbull et al., 2006), chemotaxis…”
BackgroundApplication of Silver Degeneration Stains for Neurotoxicity Testing
Switzer, R. C. (2000) · Toxicologic Pathology · doi:10.1177/019262330002800109 · Cited by 242 · cited 3×
“Indeed, using the Campbell-Switzer silver stain to label amyloid plaque (Campbell et al., 1987; Switzer, 2000), we observed that plaque burden was increased in 6 –7 month PS2APP;Trem2 ko females, and trending upward but not reaching significance in 6 –7 month PS2APP;Trem2 ko males (Fig.”
Methodde Olmos, J. S., Beltramino, C. A., & Lorenzo, S. D. O. D. (1994) · Neurotoxicology and Teratology · doi:10.1016/0892-0362(94)90033-7 · Cited by 237 · cited 2×
“Silver stains for amyloid plaque (Campbell-Switzer stain) (Switzer et al., 1993) and neuronal damage/degeneration (amino cupric silver) or “disintegrative degeneration” stain (de Olmos et al., 1994) were also performed at NeuroScience Associates.”
MethodAmyloid accelerates tau propagation and toxicity in a model of early Alzheimer’s disease
Pooler, A. M., Polydoro, M., Maury, E. A., Nicholls, S. B., Reddy, S. M., Wegmann, S., William, C., Saqran, L., Cagsal-Getkin, O., Pitstick, R., et al. (2015) · Acta Neuropathologica Communications · doi:10.1186/s40478-015-0199-x · Cited by 236 · cited 2×
“…in humans and mice supports the mechanistic model that -amyloid pathology accelerates the accumulation of tau pathology or enhances its spreading (Pooler et al., 2015; He et al., 2018; Jack et al., 2018; Jacobs et al., 2018), and a new report indicates that this effect is further magnified in…”
BackgroundYuan, P., Condello, C., Keene, C. D., Wang, Y., Bird, T. D., Paul, S. M., Luo, W., Colonna, M., Baddeley, D., & Grutzendler, J. (2016) · Neuron · doi:10.1016/j.neuron.2016.09.016 · Cited by 219 · cited 6×
“Plaque load is reduced in aged PS2APP;Trem2 ko mice In the 5xFAD mouse model, plaque load was reportedly unchanged in 4 month Trem2 ko mice but increased in 8 month Trem2 ko hippocampus (Wang et al., 2015, 2016; Yuan et al., 2016).”
BackgroundResultInfluentialMutual antagonism between dickkopf1 and dickkopf2 regulates Wnt/β-catenin signalling
Wu, W., Glinka, A., Delius, H., & Niehrs, C. (2000) · Current Biology · doi:10.1016/s0960-9822(00)00868-x · Cited by 183 · cited 2×
“…Trem2 ko microglia, another possibility is that Wnt-related signaling was impaired since Dkk2 is also a context-dependent ac- tivator of the pathway (Wu et al., 2000; Mao and Niehrs, 2003; Devotta et al., 2018) and since induction of regulators, including Wif1, can occur downstream of active…”
BackgroundAnti-apoE immunotherapy inhibits amyloid accumulation in a transgenic mouse model of Aβ amyloidosis
Kim, J., Eltorai, A. E. M., Jiang, H., Liao, F., Verghese, P. B., Kim, J., Stewart, F. R., Basak, J. M., & Holtzman, D. M. (2012) · Journal of Experimental Medicine · doi:10.1084/jem.20121274 · Cited by 160 · cited 1×
“The studies used different ApoE monoclonal antibodies that likely interact with distinct epitopes or configurations of ApoE (Kim et al., 2012) and whose binding may be differentially impacted by variations in staining procedure.”
BackgroundHigh‐affinity interactions and signal transduction between Aβ oligomers and TREM2
Lessard, C. B., Malnik, S. L., Zhou, Y., Ladd, T. B., Cruz, P. E., Ran, Y., Chakrabaty, P., Mahan, T. E., Holtzman, D. M., Ulrich, J. D., et al. (2018) · EMBO Molecular Medicine · doi:10.15252/emmm.201809027 · Cited by 156 · cited 2×
“While the elevated A 42:A 40 ratio we observed in the soluble fraction of PS2APP;Trem2 ko brains could reflect direct deficits in the Trem2-mediated binding and clearance of oligomeric A 42 by microglia (Yeh et al., 2016; Lessard et al., 2018; Zhao et al., 2018), it could also reflect enhanced clearance of A 40 throug…”
BackgroundGage, P. J., Qian, M., Wu, D., & Rosenberg, K. I. (2008) · Developmental Biology · doi:10.1016/j.ydbio.2008.02.030 · Cited by 132 · cited 2×
“Dkk2, Wif1, and Ctnna3 can all negatively regulate Wnt activity (Hsieh et al., 1999; Busby et al., 2004; Gage et al., 2008), whereas Asb11 is important for maintaining progenitor cell activity in multiple cell types (Diks et al.”
BackgroundLai, J.-P., Oseini, A. M., Moser, C. D., Yu, C., Elsawa, S. F., Hu, C., Nakamura, I., Han, T., Aderca, I., Isomoto, H., et al. (2010) · Hepatology · doi:10.1002/hep.23848 · Cited by 124 · cited 2×
“2-2A, available at https:// doi.org/10.1523/JNEUROSCI.1871-19.2019.f2-2), with six positive factors in Wnt signaling showing reduced expression including Fzd9 (Karasawa et al., 2002), Sulf2 (Lai et al., 2010), Bambi (Lin et al., 2008), Ptk7 (Berger et al., 2017), and Aspm (Buchman et al., 2011) along with Dkk2 (Fig.”
BackgroundInfluentialWang, A., Das, P., Switzer, R. C., Golde, T. E., & Jankowsky, J. L. (2011) · The Journal of Neuroscience · doi:10.1523/jneurosci.5077-10.2011 · Cited by 118 · cited 3×
“Immunohistochemical (IHC) stains for Iba1, CD68, and Gfap were performed at NeuroScience Associates as described previously (Wang et al., 2011), and CD68-stained sections were counterstained with Nissl (0.05% thionine/0.08 M acetate buffer, pH 4.5).”
MethodInfluentialNeuronal Structure is Altered by Amyloid Plaques
Spires‐Jones, T. L., & Hyman, B. T. (2004) · Reviews in the Neurosciences · doi:10.1515/revneuro.2004.15.4.267 · Cited by 108 · cited 1×
“Finally, we looked at whether another feature of neuronal pathology observed in AD tissues and -amyloid mouse models, reduced synaptic density, particularly near plaque (Spires and Hyman, 2004; Tsai et al., 2004; Spires et al., 2005), was altered in Trem2-deficient mice.”
BackgroundFrizzled-9 Is Activated by Wnt-2 and Functions in Wnt/β-Catenin Signaling
Karasawa, T., Yokokura, H., Kitajewski, J., & Lombroso, P. J. (2002) · Journal of Biological Chemistry · doi:10.1074/jbc.m205658200 · Cited by 100 · cited 2×
“2-2A, available at https:// doi.org/10.1523/JNEUROSCI.1871-19.2019.f2-2), with six positive factors in Wnt signaling showing reduced expression including Fzd9 (Karasawa et al., 2002), Sulf2 (Lai et al., 2010), Bambi (Lin et al., 2008), Ptk7 (Berger et al., 2017), and Aspm (Buchman et al., 2011) along with Dkk2 (Fig.”
BackgroundInfluentialOzmen, L., Albientz, A., Czech, C., & Jacobsen, H. (2008) · Neurodegenerative Diseases · doi:10.1159/000170884 · Cited by 99 · cited 2×
“By 4 months of age, the first deposits of -amyloid plaque are detected, with age-dependent plaque accumulation occurring faster in females than in males (Ozmen et al., 2009; Kallop et al., 2014).”
BackgroundASPM regulates Wnt signaling pathway activity in the developing brainPreprint
Buchman, J. J., Durak, O., & Tsai, L. (2011) · Genes & Development · doi:10.1101/gad.16830211 · Cited by 97 · cited 3×
“2-2A, available at https:// doi.org/10.1523/JNEUROSCI.1871-19.2019.f2-2), with six positive factors in Wnt signaling showing reduced expression including Fzd9 (Karasawa et al., 2002), Sulf2 (Lai et al., 2010), Bambi (Lin et al., 2008), Ptk7 (Berger et al., 2017), and Aspm (Buchman et al., 2011) along with Dkk2 (Fig.”
BackgroundInfluentialDiep, D. B., Hoen, N., Backman, M., Machoň, O., & Krauss, S. J. K. (2004) · Developmental Brain Research · doi:10.1016/j.devbrainres.2004.09.008 · Cited by 96 · cited 2×
“, 2018) and since induction of regulators, including Wif1, can occur downstream of active -catenin as negative feedback (Diep et al., 2004; Boerboom et al., 2006).”
BackgroundPTK7 Faces the Wnt in Development and Disease
Berger, H., Wodarz, A., & Borchers, A. (2017) · Frontiers in Cell and Developmental Biology · doi:10.3389/fcell.2017.00031 · Cited by 91 · cited 3×
“2-2A, available at https:// doi.org/10.1523/JNEUROSCI.1871-19.2019.f2-2), with six positive factors in Wnt signaling showing reduced expression including Fzd9 (Karasawa et al., 2002), Sulf2 (Lai et al., 2010), Bambi (Lin et al., 2008), Ptk7 (Berger et al., 2017), and Aspm (Buchman et al., 2011) along with Dkk2 (Fig.”
BackgroundInfluentialD'Amore, J. D., Kajdasz, S. T., McLellan, M. E., Bacskai, B. J., Stern, E. A., & Hyman, B. T. (2003) · Journal of Neuropathology & Experimental Neurology · doi:10.1093/jnen/62.2.137 · Cited by 89 · cited 2×
“First, we looked at neuritic dystrophy around plaque (D’Amore et al., 2003) by fluorescent costaining using methoxyX04 to label plaque, anti-Iba1 to label microglia, and anti-Lamp1 to label dystrophic axons (Gowrishankar et al.”
BackgroundLin, Z., Gao, C., Ning, Y., He, X., Wu, W., & Chen, Y. (2008) · Journal of Biological Chemistry · doi:10.1074/jbc.m804039200 · Cited by 77 · cited 3×
“2-2A, available at https:// doi.org/10.1523/JNEUROSCI.1871-19.2019.f2-2), with six positive factors in Wnt signaling showing reduced expression including Fzd9 (Karasawa et al., 2002), Sulf2 (Lai et al., 2010), Bambi (Lin et al., 2008), Ptk7 (Berger et al., 2017), and Aspm (Buchman et al., 2011) along with Dkk2 (Fig.”
BackgroundInfluentialBehavioral and transcriptomic analysis of Trem2-null mice: not all knockout mice are created equal
Kang, S. S., Kurti, A., Baker, K. E., Liu, C.-C., Colonna, M., Ulrich, J. D., Holtzman, D. M., Bu, G., & Fryer, J. D. (2018) · Human Molecular Genetics · doi:10.1093/hmg/ddx366 · Cited by 62 · cited 1×
“Applying cutoffs of 2-fold change and adjusted p value 0.05, we observed only 7 transcripts with increased abundance in PS2APP;Trem2 ko versus PS2APP;Trem2 wt microglia (excluding Treml1, an artifact of the KO cassette insertion) (Kang et al., 2018).”
MethodInfluentialBoerboom, D., White, L. D., Dalle, S., Courty, J., & Richards, J. S. (2006) · Cancer Research · doi:10.1158/0008-5472.can-05-3493 · Cited by 60 · cited 1×
“…was impaired since Dkk2 is also a context-dependent ac- tivator of the pathway (Wu et al., 2000; Mao and Niehrs, 2003; Devotta et al., 2018) and since induction of regulators, including Wif1, can occur downstream of active -catenin as negative feedback (Diep et al., 2004; Boerboom et al., 2006).”
BackgroundKallop, D. Y., Meilandt, W. J., Gogineni, A., Easley-Neal, C., Wu, T., Jubb, A. M., Yaylaoglu, M., Shamloo, M., Tessier-Lavigne, M., Scearce-Levie, K., et al. (2014) · The Journal of Neuroscience · doi:10.1523/jneurosci.4963-13.2014 · Cited by 54 · cited 3×
“Quantification of CD68 or Iba1 staining and enlarged dark cluster areas was performed using morphometric-based methods as previously described (Le Pichon et al., 2013; Kallop et al., 2014).”
BackgroundMethodSelf-citationPichon, C. E. L., Domínguez, S. L., Solanoy, H. O., Ngu, H., Lewin‐Koh, N., Chen, M., Eastham‐Anderson, J., Watts, R. J., & Scearce-Levie, K. A. (2013) · PLoS ONE · doi:10.1371/journal.pone.0062342 · Cited by 52 · cited 1×
“Quantification of CD68 or Iba1 staining and enlarged dark cluster areas was performed using morphometric-based methods as previously described (Le Pichon et al., 2013; Kallop et al., 2014).”
MethodSelf-citationFocke, C., Blume, T., Zott, B., Shi, Y., Deußing, M., Peters, F., Schmidt, C., Kleinberger, G., Lindner, S., Gildehaus, F., et al. (2018) · Journal of Nuclear Medicine · doi:10.2967/jnumed.118.217703 · Cited by 48 · cited 1×
“…primarily beneficial in the context of AD pathology, elevated PET signal for ligands of the “neuroinflammation marker” TSPO have predicted better cognitive measures and slower AD progression in mice with -amyloid pathology and human patients, respectively (Hamelin et al., 2016; Focke et al., 2019).”
BackgroundBusby, V. L., Goossens, S., Nowotny, P., Hamilton, G., Smemo, S., Harold, D. H., Turic, D., Jehu, L., Myers, A., Womick, M., et al. (2004) · NeuroMolecular Medicine · doi:10.1385/nmm:5:2:133 · Cited by 46
Meilandt, W. J., Maloney, J. A., Imperio, J., Lalehzadeh, G., Earr, T., Crowell, S., Bainbridge, T. W., Lu, Y., Ernst, J. A., Fuji, R. N., et al. (2019) · Alzheimer's Research & Therapy · doi:10.1186/s13195-019-0553-5 · Cited by 45 · cited 2×
“As a control, we spotted hippocampal TBS homogenate supernatant from a PS2APP;Bace1 ko animal (Meilandt et al., 2019), in which soluble APP is still produced by -cleavage while -cleavage and thus A production are prevented, and demonstrated that the OC antibody had minimal detection, whereas 6E10…”
MethodSelf-citationKrstic, D., & Knuesel, I. (2013) · Acta Neuropathologica Communications · doi:10.1186/2051-5960-1-62 · Cited by 38 · cited 2×
“The weakness of correlation between plaque abundance and cognitive status in humans, along with several unsuccessful clinical trials aimed at preventing cognitive decline by reducing brain A levels, has led some to question the relevance of A in the etiology and progression of AD (Krstic and Knuesel, 2013; Morris et a…”
BackgroundThe novel gene asb11: a regulator of the size of the neural progenitor compartment
Diks, S. H., Bink, R. J., van de Water, S., Joore, J., van Rooijen, C., Verbeek, F. J., den Hertog, J., Peppelenbosch, M. P., & Živković, D. (2006) · The Journal of Cell Biology · doi:10.1083/jcb.200601081 · Cited by 34 · cited 1×
“, 2008), whereas Asb11 is important for maintaining progenitor cell activity in multiple cell types (Diks et al., 2006; Tee et al., 2012).”
BackgroundDevotta, A., Hong, C., & Saint‐Jeannet, J. (2018) · eLife · doi:10.7554/elife.34404 · Cited by 34 · cited 1×
“…is that Wnt-related signaling was impaired since Dkk2 is also a context-dependent ac- tivator of the pathway (Wu et al., 2000; Mao and Niehrs, 2003; Devotta et al., 2018) and since induction of regulators, including Wif1, can occur downstream of active -catenin as negative feedback (Diep et al.,…”
Backgroundasb11 Is a Regulator of Embryonic and Adult Regenerative Myogenesis
Tee, J.-M., da Silva, M. A. S., Rygiel, A. M., Muncan, V., Bink, R. J., BRINK, G. R. V. D., van Tijn, P., Živković, D., Kodach, L. L., Guardavaccaro, D., et al. (2012) · Stem Cells and Development · doi:10.1089/scd.2012.0123 · Cited by 16 · cited 2×
“, 2008), whereas Asb11 is important for maintaining progenitor cell activity in multiple cell types (Diks et al., 2006; Tee et al., 2012).”
Backgroundβ-Catenin Pathway Is Involved in TREM2-Mediated Microglial Survival
Zulfiqar, S., & Tanriöver, G. (2017) · Journal of Neuroscience · doi:10.1523/jneurosci.1087-17.2017 · Cited by 5 · cited 2×
“The reduced expression of Wnt-related signaling components and regulators in PS2APP;Trem2 ko microglia may be consistent with previous reports of coordinated signaling between Trem2 and -catenin pathways within microglia (Zheng et al., 2017; Zulfiqar and Tanriöver, 2017).”
Result
Research works printed but not linked: 1
- Campbell, 1987, Alzheimer's plaques and tangles: a controlled and enhanced silver staining method, Soc Neuroscience Abstr, 13, 678
Cited by
Sorted by citations
The Physiology, Pathology, and Potential Therapeutic Applications of the TREM2 Signaling Pathway
Deczkowska, A., Weiner, A., & Amit, I. (2020) · Cell · doi:10.1016/j.cell.2020.05.003 · Cited by 648
Microglia regulation of synaptic plasticity and learning and memory
Zhou, M., Cornell, J., Salinas, S., & Huang, H.-Y. (2022) · Neural Regeneration Research · doi:10.4103/1673-5374.322423 · Cited by 548
Dejanovic, B., Wu, T., Tsai, M.-C., Graykowski, D., Gandham, V. D., Rose, C. M., Bakalarski, C. E., Ngu, H., Wang, Y., Pandey, S., et al. (2022) · Nature Aging · doi:10.1038/s43587-022-00281-1 · Cited by 341
Self-citationTrem2 restrains the enhancement of tau accumulation and neurodegeneration by β-amyloid pathology
Lee, S.-H., Meilandt, W. J., Xie, L., Gandham, V. D., Ngu, H., Barck, K. H., Rezzonico, M. G., Imperio, J., Lalehzadeh, G., Huntley, M. A., et al. (2021) · Neuron · doi:10.1016/j.neuron.2021.02.010 · Cited by 300
Self-citationSengupta, U., & Kayed, R. (2022) · Progress in Neurobiology · doi:10.1016/j.pneurobio.2022.102270 · Cited by 318
Metadata
- Authors
- Meilandt, W. J., Ngu, H., Gogineni, A., Lalehzadeh, G., Lee, S.-H., Srinivasan, K., Imperio, J., Wu, T., Weber, M., Kruse, A. J., Stark, K. L., Chan, P., Kwong, M., Modrusan, Z., Friedman, B. A., Elstrott, J., Foreman, O., Easton, A., Sheng, M., & Hansen, D. V.
- Affiliations
- Genentech (US)
- Corresponding author
- Meilandt, William J.
- Hansen, David V.
- ORCID
- Venue
- The Journal of Neuroscience
- Publisher
- Society for Neuroscience
- Published
- 2020-01-24
- Volume
- 40
- Issue
- 9
- Pages
- 1956-1974
- ISSN
- 0270-6474 (ISSN-L)
- 1529-2401
- PMC
- PMC7046459
- OpenAlex
- W3003126983
- Semantic Scholar
- 24b2107485715864dc70c72f73ce957a07b3f7a9
- Cited by
- 210
- References
- 98
- Citations by year
- 2026: 16 · 2025: 30 · 2024: 44 · 2023: 48 · 2022: 33 · 2021: 25 · 2020: 14
- FWCI
- 18.04
- Type
- journal article
- Language
- en
- Open access
- hybrid
- doi.org
- Locations
- Journal of Neuroscience (publishedVersion, cc-by)
- PubMed Central (publishedVersion, cc-by)
- PubMed (publishedVersion)
- DSpace@MIT (Massachusetts Institute of Technology) (submittedVersion, cc-by-nc)
- Topics
- Life Sciences › Neuroscience › Cellular and Molecular Neuroscience › Alzheimer's disease research and treatments
- Life Sciences › Neuroscience › Neurology › Neuroinflammation and Neurodegeneration Mechanisms
- Health Sciences › Medicine › Psychiatry and Mental health › Dementia and Cognitive Impairment Research
- Keywords
- TREM2, Alzheimer's disease, amyloid plaques, amyloid-beta 42/40 ratio, axonal dystrophy, dendritic spine loss, neuritic dystrophy, microglial activation, soluble amyloid-beta oligomers, neurofilament light chain, apolipoprotein E, Wnt signaling, sex differences
- MeSH terms
- Trefoil Factor-1, Alzheimer Disease, Animals, Axons, Female, Male, Membrane Glycoproteins, Mice, Inbred C57BL, Peptide Fragments, Receptors, Immunologic, Amyloid beta-Peptides, Neurites, Amyloid beta-Protein Precursor, Neurofilament Proteins, Microglia, Mice, Knockout, Dendritic Spines, Mice, Plaque, Amyloid
About these checks
Registry, retraction, Cites and statistics results are computed, not judged, with one exception: a printed reference that no index lists is read once by a model before it counts as a citation error. Claims are extracted by a model and kept only when their quote appears verbatim in the text; each cited source is then checked, with a model’s help, for whether it says what the claim relies on. Those verdicts can be wrong — read the claim’s quote and the cited source before relying on one.
A language model drew the claims from the paper on 2026-10-10, under version 3 of the claim definition (model deepseek-v4.1-flash, prompt extract-v3).
A second model labelled each claim on 2026-10-10 (model jev-1.13-20260917, definition revision gold-guideline-v0.2).
Statistics and arithmetic are recomputed, not judged.
Confidence bands are shown only for fields calibrated on our annotated test set. None is calibrated yet, so no band is shown.
What counts as a claim ›How we measure confidence ›How we check this ›
Are you an author, or do you see a problem with this page? Request a review
