

The DOI matches its Crossref record; 17 of the 17 references it cites were found in a registry or an index.
A Parkinson's disease CircRNAs Resource reveals a link between circSLC8A1 and oxidative stress
Abstract
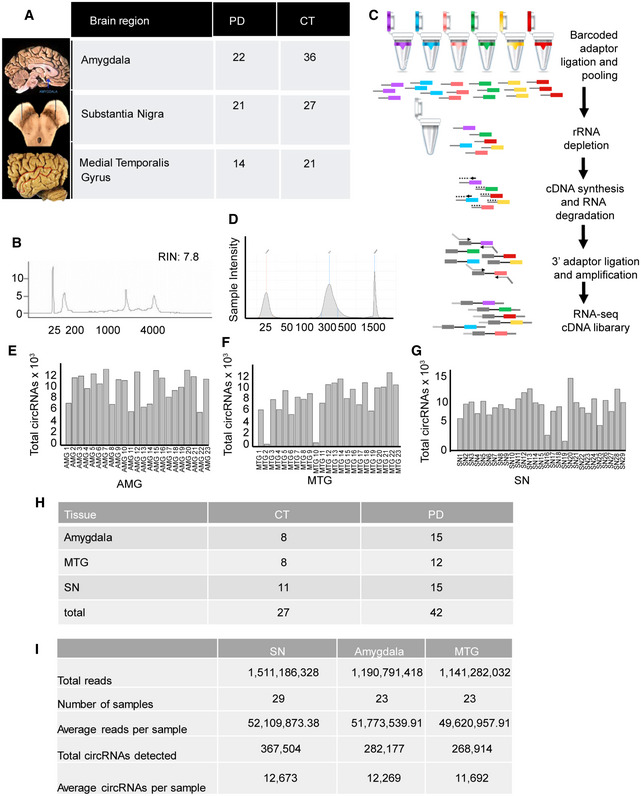
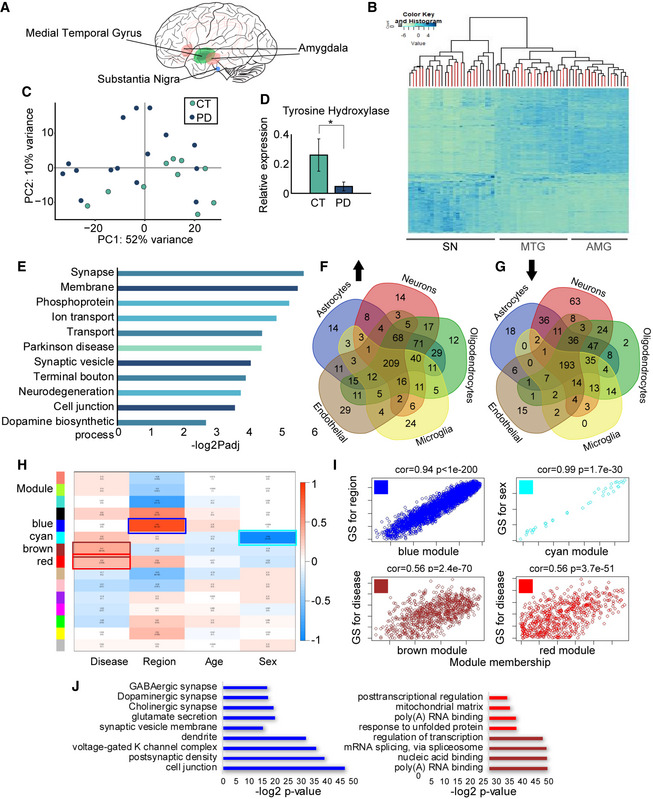
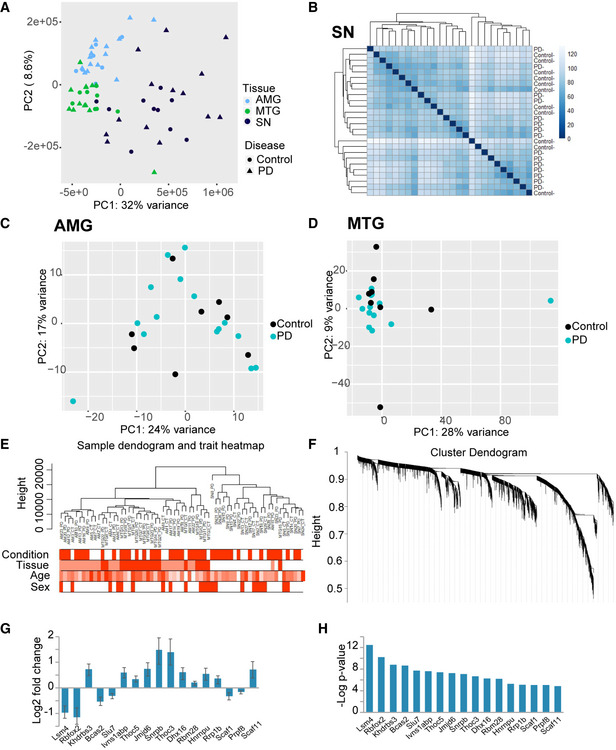
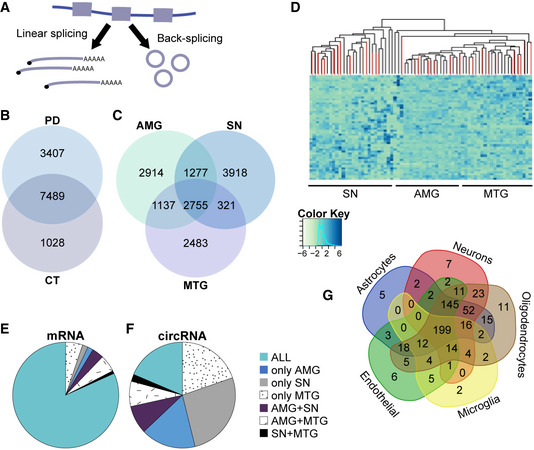
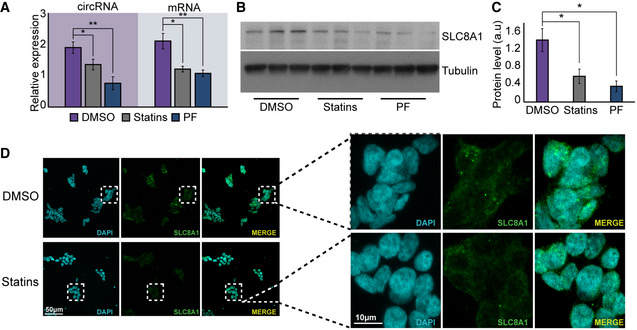
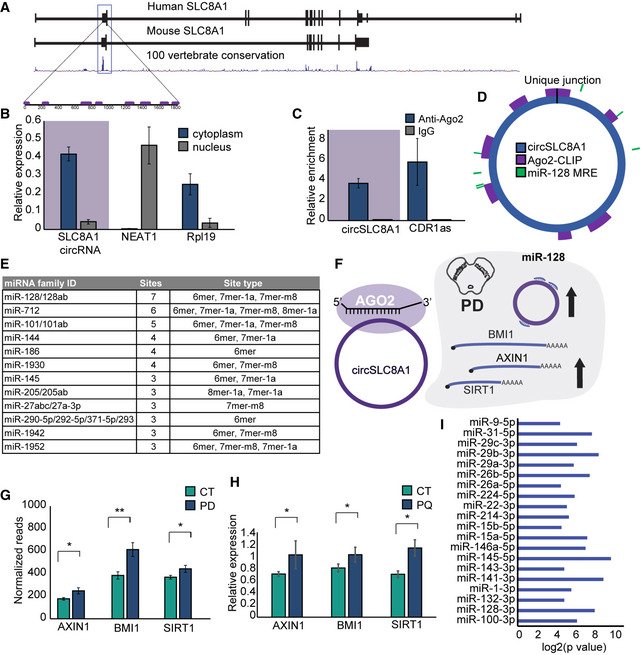
Circular RNAs (circRNAs) are brain‐abundant RNAs of mostly unknown functions. To seek their roles in Parkinson's disease (PD), we generated an RNA sequencing resource of several brain region tissues from dozens of PD and control donors. In the healthy substantia nigra (SN), circRNAs accumulate in an age‐dependent manner, but in the PD SN this correlation is lost and the total number of circRNAs reduced. In contrast, the levels of circRNAs are increased in the other studied brain regions of PD patients. We also found circSLC8A1 to increase in the SN of PD individuals. CircSLC8A1 carries 7 binding sites for miR‐128 and is strongly bound to the microRNA effector protein Ago2. Indeed, RNA targets of miR‐128 are also increased in PD individuals, suggesting that circSLC8A1 regulates miR‐128 function and/or activity. CircSLC8A1 levels also increased in cultured cells exposed to the oxidative stress‐inducing agent paraquat but were decreased in cells treated with the neuroprotective antioxidant regulator drug Simvastatin. Together, our work links circSLC8A1 to oxidative stress‐related Parkinsonism and suggests further exploration of its molecular function in PD.
Overview
The claims and statistics of this paper haven’t been checked yet.
Run the check — free, no account needed. It reads the open-access text and checks the sources it cites.
Integrity signals
Registry
Cites
Statistics
Figures
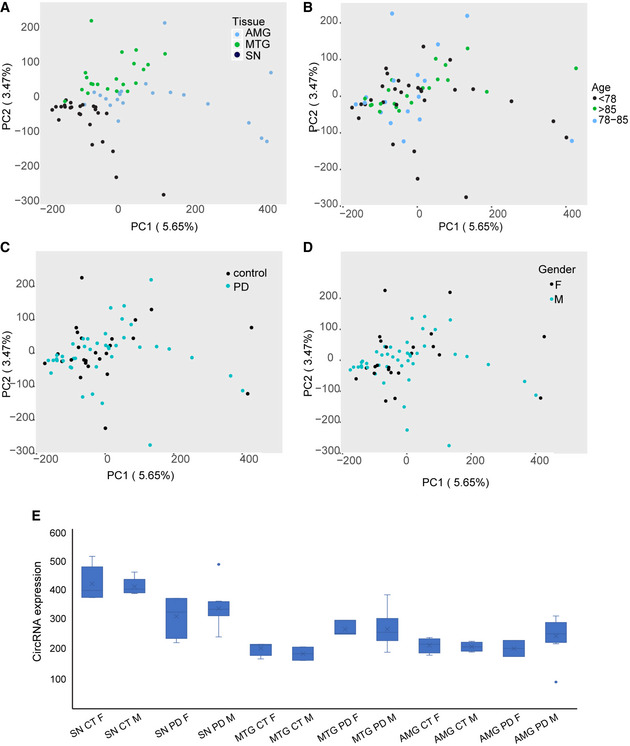
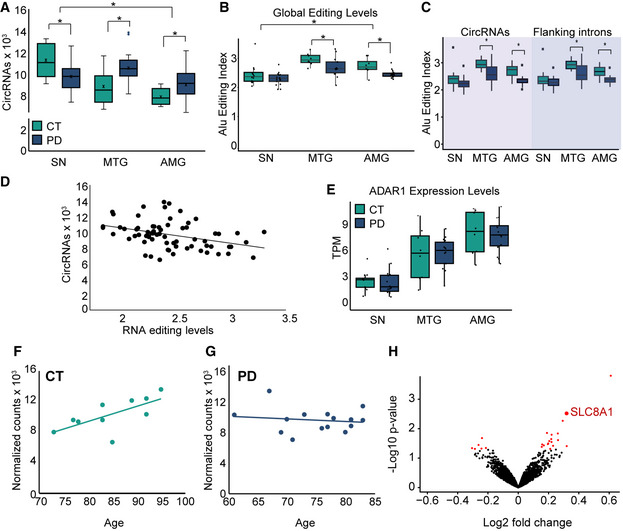
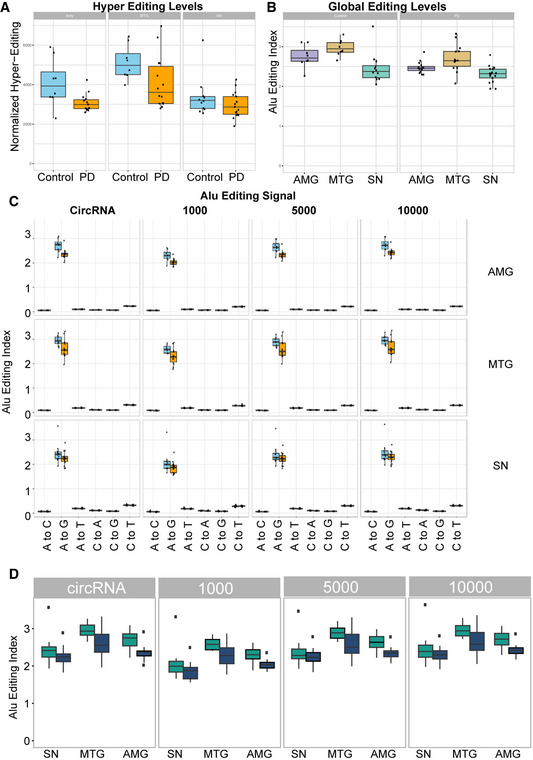
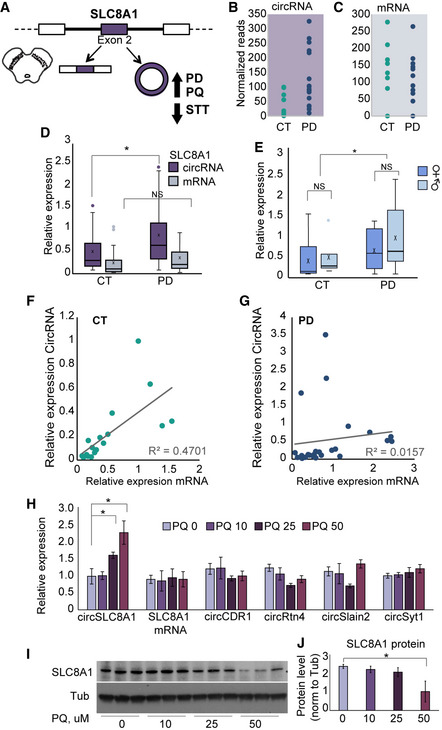
Verification
Claims the paper makes
The claims and statistics of this paper haven’t been checked yet.
Run the check — free, no account needed. It reads the open-access text and checks the sources it cites.
Claims other papers make about this one
Each is checked against this paper’s own text: does it say what the citing paper says it does?
In the citing paper
“Similarly, several circular RNAs have been confirmed to enclose miR-128-3p binding elements, which have functional consequences on neuronal tissue homeostasis.152,153”
From MiR-128-3p – a gray eminence of the human central nervous system (2024) · cites this paper as [152]
Self-check
Percentages, sums and reported differences re-computed from the paper’s own numbers.
The self-check needs the paper’s full text.
Citations
Cites
WGCNA: an R package for weighted correlation network analysis
Langfelder, P., & Horvath, S. (2008) · BMC Bioinformatics · doi:10.1186/1471-2105-9-559 · Cited by 27,252
Circular RNAs are a large class of animal RNAs with regulatory potency
Memczak, S., Jens, M., Elefsinioti, A., Torti, F., Krueger, J., Rybak, A., Maier, L., Mackowiak, S. D., Gregersen, L. H., Munschauer, M., et al. (2013) · Nature · doi:10.1038/nature11928 · Cited by 7,990
Natural RNA circles function as efficient microRNA sponges
Hansen, T. B., Jensen, T. I., Clausen, B. H., Bramsen, J. B., Finsen, B., Damgaard, C. K., & Kjems, J. (2013) · Nature · doi:10.1038/nature11993 · Cited by 7,985
Zhang, Y., Chen, K., Sloan, S. A., Bennett, M. L., Scholze, A. R., O'Keeffe, S., Phatnani, H. P., Guarnieri, P., Caneda, C., Ruderisch, N., et al. (2014) · The Journal of Neuroscience · doi:10.1523/jneurosci.1860-14.2014 · Cited by 4,875
The biogenesis, biology and characterization of circular RNAs
Kristensen, L. S., Andersen, M. S., Stagsted, L. V. W., Ebbesen, K. K., Hansen, T. B., & Kjems, J. (2019) · Nature Reviews Genetics · doi:10.1038/s41576-019-0158-7 · Cited by 4,823
Circular RNAs are abundant, conserved, and associated with ALU repeats
Jeck, W. R., Sorrentino, J. A., Wang, K., Slevin, M. K., Burd, C. E., Liu, J., Marzluff, W. F., & Sharpless, N. E. (2013) · RNA · doi:10.1261/rna.035667.112 · Cited by 4,388
Circular RNAs in the Mammalian Brain Are Highly Abundant, Conserved, and Dynamically Expressed
Rybak-Wolf, A., Stottmeister, C., Glažar, P., Jens, M., Pino, N., Giusti, S., Hanan, M., Behm, M., Bartok, O., Ashwal-Fluss, R., et al. (2015) · Molecular Cell · doi:10.1016/j.molcel.2015.03.027 · Cited by 2,423
Self-citationComplementary Sequence-Mediated Exon Circularization
Zhang, X.-O., Wang, H.-B., Zhang, Y., Lu, X., Chen, L.-L., & Yang, L. (2014) · Cell · doi:10.1016/j.cell.2014.09.001 · Cited by 1,999
Loss of a mammalian circular RNA locus causes miRNA deregulation and affects brain function
Piwecka, M., Glažar, P., Hernandez-Miranda, L. R., Memczak, S., Wolf, S. A., Rybak-Wolf, A., Filipchyk, A., Klironomos, F., Cerda Jara, C. A., Fenske, P., et al. (2017) · Science · doi:10.1126/science.aam8526 · Cited by 1,210
Dopamine oxidation mediates mitochondrial and lysosomal dysfunction in Parkinson’s disease
Burbulla, L. F., Song, P., Mazzulli, J. R., Zampese, E., Wong, Y. C., Jeon, S., Santos, D. P., Blanz, J., Obermaier, C. D., Strojny, C., et al. (2017) · Science · doi:10.1126/science.aam9080 · Cited by 874
Research works printed but not linked: 83
- Agarwal V, Bell GW, Nam JW, Bartel DP (2015) Predicting effective microRNA target sites in mammalian mRNAs. Elife 4: e05005 · DOI · Paper page
- Akhter R (2018) Circular RNA and Alzheimer's disease. Adv Exp Med Biol 1087: 239–243 · DOI
- Aktas T, Avsar Ilik I, Maticzka D, Bhardwaj V, Pessoa Rodrigues C, Mittler G, Manke T, Backofen R, Akhtar A (2017) DHX9 suppresses RNA processing defects originating from the Alu invasion of the human genome. Nature 544: 115–119 · DOI
- Ashwal‐Fluss R, Meyer M, Pamudurti NR, Ivanov A, Bartok O, Hanan M, Evantal N, Memczak S, Rajewsky N, Kadener S (2014) circRNA biogenesis competes with pre‐mRNA splicing. Mol Cell 56: 55–66 · DOI · Paper page
- Barbash S, Simchovitz A, Buchman AS, Bennett DA, Shifman S, Soreq H (2017) Neuronal‐expressed microRNA‐targeted pseudogenes compete with coding genes in the human brain. Transl Psychiatry 7: e1199 · DOI
- Berry C, La Vecchia C, Nicotera P (2010) Paraquat and Parkinson's disease. Cell Death Differ 17: 1115–1125 · DOI
- Braak H, Del Tredici K, Rub U, de Vos RA, Jansen Steur EN, Braak E (2003) Staging of brain pathology related to sporadic Parkinson's disease. Neurobiol Aging 24: 197–211 · DOI · Paper page
- Chatoo W, Abdouh M, David J, Champagne MP, Ferreira J, Rodier F, Bernier G (2009) The polycomb group gene Bmi1 regulates antioxidant defenses in neurons by repressing p53 pro‐oxidant activity. J Neurosci 29: 529–542 · DOI
- Chen YG, Kim MV, Chen X, Batista PJ, Aoyama S, Wilusz JE, Iwasaki A, Chang HY (2017) Sensing self and foreign circular RNAs by intron identity. Mol Cell 67: 228–238.e5 · DOI · Paper page
- Collier TJ, Kanaan NM, Kordower JH (2011) Ageing as a primary risk factor for Parkinson's disease: evidence from studies of non‐human primates. Nat Rev Neurosci 12: 359–366 · DOI
- Conn SJ, Pillman KA, Toubia J, Conn VM, Salmanidis M, Phillips CA, Roslan S, Schreiber AW, Gregory PA, Goodall GJ (2015) The RNA binding protein quaking regulates formation of circRNAs. Cell 160: 1125–1134 · DOI
- Cortes‐Lopez M, Gruner MR, Cooper DA, Gruner HN, Voda AI, van der Linden AM, Miura P (2018) Global accumulation of circRNAs during aging in Caenorhabditis elegans. BMC Genom 19: 8 · DOI
- Dobin A, Davis CA, Schlesinger F, Drenkow J, Zaleski C, Jha S, Batut P, Chaisson M, Gingeras TR (2013) STAR: ultrafast universal RNA‐seq aligner. Bioinformatics 29: 15–21 · DOI · Paper page
- Duda J, Potschke C, Liss B (2016) Converging roles of ion channels, calcium, metabolic stress, and activity pattern of Substantia nigra dopaminergic neurons in health and Parkinson's disease. J Neurochem 139(Suppl. 1): 156–178 · DOI
- Errichelli L, Dini Modigliani S, Laneve P, Colantoni A, Legnini I, Capauto D, Rosa A, De Santis R, Scarfo R, Peruzzi G et al (2017) FUS affects circular RNA expression in murine embryonic stem cell‐derived motor neurons. Nat Commun 8: 14741 · DOI
- Farrer MJ (2006) Genetics of Parkinson disease: paradigm shifts and future prospects. Nat Rev Genet 7: 306–318 · DOI
- Farrer MJ, Haugarvoll K, Ross OA, Stone JT, Milkovic NM, Cobb SA, Whittle AJ, Lincoln SJ, Hulihan MM, Heckman MG et al (2006) Genomewide association, Parkinson disease, and PARK10. Am J Hum Genet 78: 1084–1088; author reply 1092‐4 · DOI
- Fu RH, Liu SP, Huang SJ, Chen HJ, Chen PR, Lin YH, Ho YC, Chang WL, Tsai CH, Shyu WC et al (2013) Aberrant alternative splicing events in Parkinson's disease. Cell Transplant 22: 653–661 · DOI
- Gal‐Mark N, Shallev L, Sweetat S, Barak M, Billy Li J, Levanon EY, Eisenberg E, Behar O (2017) Abnormalities in A‐to‐I RNA editing patterns in CNS injuries correlate with dynamic changes in cell type composition. Sci Rep 7: 43421 · DOI
- Gruner H, Cortes‐Lopez M, Cooper DA, Bauer M, Miura P (2016) CircRNA accumulation in the aging mouse brain. Sci Rep 6: 38907 · DOI
- Guo JU, Agarwal V, Guo H, Bartel DP (2014) Expanded identification and characterization of mammalian circular RNAs. Genome Biol 15: 409 · DOI
- He L, Vasiliou K, Nebert DW (2009) Analysis and update of the human solute carrier (SLC) gene superfamily. Hum Genomics 3: 195–206 · DOI
- Holdt LM, Stahringer A, Sass K, Pichler G, Kulak NA, Wilfert W, Kohlmaier A, Herbst A, Northoff BH, Nicolaou A et al (2016) Circular non‐coding RNA ANRIL modulates ribosomal RNA maturation and atherosclerosis in humans. Nat Commun 7: 12429 · DOI
- da Huang W, Sherman BT, Lempicki RA (2009) Systematic and integrative analysis of large gene lists using DAVID bioinformatics resources. Nat Protoc 4: 44–57 · DOI · Paper page
- Ivanov A, Memczak S, Wyler E, Torti F, Porath HT, Orejuela MR, Piechotta M, Levanon EY, Landthaler M, Dieterich C et al (2015) Analysis of intron sequences reveals hallmarks of circular RNA biogenesis in animals. Cell Rep 10: 170–177 · DOI
- Jeck WR, Sharpless NE (2014) Detecting and characterizing circular RNAs. Nat Biotechnol 32: 453–461 · DOI
- Kalia LV, Lang AE (2015) Parkinson's disease. Lancet 386: 896–912 · DOI · Paper page
- Khananshvili D (2013) The SLC8 gene family of sodium‐calcium exchangers (NCX) ‐ structure, function, and regulation in health and disease. Mol Aspects Med 34: 220–235 · DOI
- Khananshvili D (2014) Sodium‐calcium exchangers (NCX): molecular hallmarks underlying the tissue‐specific and systemic functions. Pflugers Arch 466: 43–60 · DOI
- Kim D, Pertea G, Trapnell C, Pimentel H, Kelley R, Salzberg SL (2013) TopHat2: accurate alignment of transcriptomes in the presence of insertions, deletions and gene fusions. Genome Biol 14: R36 · DOI · Paper page
- Kitao T, Takuma K, Kawasaki T, Inoue Y, Ikehara A, Nashida T, Ago Y, Matsuda T (2010) The Na+/Ca2+ exchanger‐mediated Ca2+ influx triggers nitric oxide‐induced cytotoxicity in cultured astrocytes. Neurochem Int 57: 58–66 · DOI
- Kleaveland B, Shi CY, Stefano J, Bartel DP (2018) A network of noncoding regulatory RNAs acts in the mammalian brain. Cell 174: 350–362.e17 · DOI
- La Cognata V, D'Agata V, Cavalcanti F, Cavallaro S (2015) Splicing: is there an alternative contribution to Parkinson's disease? Neurogenetics 16: 245–263 · DOI
- Lai TS, Davies C, Greenberg CS (2010) Human tissue transglutaminase is inhibited by pharmacologic and chemical acetylation. Protein Sci 19: 229–235 · DOI
- Langmead B, Salzberg SL (2012) Fast gapped‐read alignment with Bowtie 2. Nat Methods 9: 357–359 · DOI · Paper page
- Lau P, Bossers K, Janky R, Salta E, Frigerio CS, Barbash S, Rothman R, Sierksma AS, Thathiah A, Greenberg D et al (2013) Alteration of the microRNA network during the progression of Alzheimer's disease. EMBO Mol Med 5: 1613–1634 · DOI · Paper page
- Legnini I, Di Timoteo G, Rossi F, Morlando M, Briganti F, Sthandier O, Fatica A, Santini T, Andronache A, Wade M et al (2017) Circ‐ZNF609 is a circular RNA that can be translated and functions in myogenesis. Mol Cell 66: 22–37.e9 · DOI · Paper page
- Levanon EY, Eisenberg E, Yelin R, Nemzer S, Hallegger M, Shemesh R, Fligelman ZY, Shoshan A, Pollock SR, Sztybel D et al (2004) Systematic identification of abundant A‐to‐I editing sites in the human transcriptome. Nat Biotechnol 22: 1001–1005 · DOI
- Lewis PA, Cookson MR (2012) Gene expression in the Parkinson's disease brain. Brain Res Bull 88: 302–312 · DOI
- Li M, Xie X, Zhou J, Sheng M, Yin X, Ko EA, Zhou T, Gu W (2017a) Quantifying circular RNA expression from RNA‐seq data using model‐based framework. Bioinformatics 33: 2131–2139 · DOI
- Li X, Liu CX, Xue W, Zhang Y, Jiang S, Yin QF, Wei J, Yao RW, Yang L, Chen LL (2017b) Coordinated circRNA biogenesis and function with NF90/NF110 in viral infection. Mol Cell 67: 214–227.e7 · DOI
- Li X, Yang L, Chen LL (2018) The biogenesis, functions, and challenges of circular RNAs. Mol Cell 71: 428–442 · DOI
- Liang WC, Wong CW, Liang PP, Shi M, Cao Y, Rao ST, Tsui SK, Waye MM, Zhang Q, Fu WM et al (2019) Translation of the circular RNA circbeta‐catenin promotes liver cancer cell growth through activation of the Wnt pathway. Genome Biol 20: 84 · DOI
- Liu EY, Cali CP, Lee EB (2017) RNA metabolism in neurodegenerative disease. Dis Model Mech 10: 509–518 · DOI
- Lorenzini I, Moore S, Sattler R (2018) RNA editing deficiency in neurodegeneration. Adv Neurobiol 20: 63–83 · DOI
- McCarthy DJ, Chen Y, Smyth GK (2012) Differential expression analysis of multifactor RNA‐Seq experiments with respect to biological variation. Nucleic Acids Res 40: 4288–4297 · DOI · Paper page
- Miller DW, Hague SM, Clarimon J, Baptista M, Gwinn‐Hardy K, Cookson MR, Singleton AB (2004) Alpha‐synuclein in blood and brain from familial Parkinson disease with SNCA locus triplication. Neurology 62: 1835–1838 · DOI
- Min SW, Sohn PD, Cho SH, Swanson RA, Gan L (2013) Sirtuins in neurodegenerative diseases: an update on potential mechanisms. Front Aging Neurosci 5: 53
- Moran LB, Duke DC, Deprez M, Dexter DT, Pearce RK, Graeber MB (2006) Whole genome expression profiling of the medial and lateral substantia nigra in Parkinson's disease. Neurogenetics 7: 1–11 · DOI
- Pamudurti NR, Bartok O, Jens M, Ashwal‐Fluss R, Stottmeister C, Ruhe L, Hanan M, Wyler E, Perez‐Hernandez D, Ramberger E et al (2017) Translation of CircRNAs. Mol Cell 66: 9–21.e7 · DOI · Paper page
- Patro R, Mount SM, Kingsford C (2014) Sailfish enables alignment‐free isoform quantification from RNA‐seq reads using lightweight algorithms. Nat Biotechnol 32: 462–464 · DOI · Paper page
- Paz‐Yaacov N, Bazak L, Buchumenski I, Porath HT, Danan‐Gotthold M, Knisbacher BA, Eisenberg E, Levanon EY (2015) Elevated RNA editing activity is a major contributor to transcriptomic diversity in tumors. Cell Rep 13: 267–276 · DOI
- Porath HT, Carmi S, Levanon EY (2014) A genome‐wide map of hyper‐edited RNA reveals numerous new sites. Nat Commun 5: 4726 · DOI
- Quinlan AR, Hall IM (2010) BEDTools: a flexible suite of utilities for comparing genomic features. Bioinformatics 26: 841–842 · DOI · Paper page
- Rabin A, Ashwal‐Fluss R, Shenzis S, Apelblat D, Kadener S (2019) A comprehensive pipeline for accurate annotation and quantification of circRNAs. bioRxiv https://doi.org/10.1101/2019.12.15.876755 [PREPRINT] · DOI
- Robinson MD, McCarthy DJ, Smyth GK (2010) edgeR: a Bioconductor package for differential expression analysis of digital gene expression data. Bioinformatics 26: 139–140 · DOI · Paper page
- Roth SH, Levanon EY, Eisenberg E (2019) Genome‐wide quantification of ADAR adenosine‐to‐inosine RNA editing activity. Nat Methods 16: 1131–1138 · DOI
- Schulze M, Sommer A, Plotz S, Farrell M, Winner B, Grosch J, Winkler J, Riemenschneider MJ (2018) Sporadic Parkinson's disease derived neuronal cells show disease‐specific mRNA and small RNA signatures with abundant deregulation of piRNAs. Acta Neuropathol Commun 6: 58 · DOI
- Shaked I, Meerson A, Wolf Y, Avni R, Greenberg D, Gilboa‐Geffen A, Soreq H (2009) MicroRNA‐132 potentiates cholinergic anti‐inflammatory signaling by targeting acetylcholinesterase. Immunity 31: 965–973 · DOI · Paper page
- Shaltiel G, Hanan M, Wolf Y, Barbash S, Kovalev E, Shoham S, Soreq H (2013) Hippocampal microRNA‐132 mediates stress‐inducible cognitive deficits through its acetylcholinesterase target. Brain Struct Funct 218: 59–72 · DOI
- Shi Z, Chen T, Yao Q, Zheng L, Zhang Z, Wang J, Hu Z, Cui H, Han Y, Han X et al (2017) The circular RNA ciRS‐7 promotes APP and BACE1 degradation in an NF‐kappaB‐dependent manner. FEBS J 284: 1096–1109 · DOI
- Shishkin AA, Giannoukos G, Kucukural A, Ciulla D, Busby M, Surka C, Chen J, Bhattacharyya RP, Rudy RF, Patel MM et al. (2015) Simultaneous generation of many RNA‐seq libraries in a single reaction. Nat Methods 12: 323‐325 · DOI
- Siede D, Rapti K, Gorska AA, Katus HA, Altmuller J, Boeckel JN, Meder B, Maack C, Volkers M, Muller OJ et al (2017) Identification of circular RNAs with host gene‐independent expression in human model systems for cardiac differentiation and disease. J Mol Cell Cardiol 109: 48–56 · DOI
- Simchovitz A, Hanan M, Niederhoffer N, Madrer N, Yayon N, Bennett ER, Greenberg DS, Kadener S, Soreq H (2019) NEAT1 is overexpressed in Parkinson's disease substantia nigra and confers drug‐inducible neuroprotection from oxidative stress. FASEB J 33: 11223–11234 · DOI
- Simchovitz A, Hanan M, Yayon N, Lee S, Bennett ER, Greenberg DS, Kadener S, Soreq H (2020) A lncRNA survey finds increases in neuroprotective LINC‐PINT in Parkinson's disease substantia nigra. Aging Cell 19: e13115 · DOI
- Simunovic F, Yi M, Wang Y, Macey L, Brown LT, Krichevsky AM, Andersen SL, Stephens RM, Benes FM, Sonntag KC (2009) Gene expression profiling of substantia nigra dopamine neurons: further insights into Parkinson's disease pathology. Brain 132: 1795–1809 · DOI
- Singh M (2012) Dysregulated A to I RNA editing and non‐coding RNAs in neurodegeneration. Front Genet 3: 326 · DOI
- Sirabella R, Sisalli MJ, Costa G, Omura K, Ianniello G, Pinna A, Morelli M, Di Renzo GM, Annunziato L, Scorziello A (2018) NCX1 and NCX3 as potential factors contributing to neurodegeneration and neuroinflammation in the A53T transgenic mouse model of Parkinson's Disease. Cell Death Dis 9: 725 · DOI
- Soreq L, Israel Z, Bergman H, Soreq H (2008) Advanced microarray analysis highlights modified neuro‐immune signaling in nucleated blood cells from Parkinson's disease patients. J Neuroimmunol 201–202: 227–236 · DOI
- Soreq L, Bergman H, Israel Z, Soreq H (2012) Exon arrays reveal alternative splicing aberrations in Parkinson's disease leukocytes. Neurodegener Dis 10: 203–206 · DOI
- Soreq L, Guffanti A, Salomonis N, Simchovitz A, Israel Z, Bergman H, Soreq H (2014) Long non‐coding RNA and alternative splicing modulations in Parkinson's leukocytes identified by RNA sequencing. PLoS Comput Biol 10: e1003517 · DOI
- Stagsted LV, Nielsen KM, Daugaard I, Hansen TB (2019) Noncoding AUG circRNAs constitute an abundant and conserved subclass of circles. Life Sci Alliance 2: e201900398 · DOI
- Veno MT, Hansen TB, Veno ST, Clausen BH, Grebing M, Finsen B, Holm IE, Kjems J (2015) Spatio‐temporal regulation of circular RNA expression during porcine embryonic brain development. Genome Biol 16: 245 · DOI
- Westholm JO, Miura P, Olson S, Shenker S, Joseph B, Sanfilippo P, Celniker SE, Graveley BR, Lai EC (2014) Genome‐wide analysis of Drosophila circular RNAs reveals their structural and sequence properties and age‐dependent neural accumulation. Cell Rep 9: 1966–1980 · DOI
- Wu PC, Kao LS (2016) Calcium regulation in mouse mesencephalic neurons‐Differential roles of Na(+)/Ca(2+) exchanger, mitochondria and endoplasmic reticulum. Cell Calcium 59: 299–311 · DOI
- Yan J, Qiao L, Wu J, Fan H, Sun J, Zhang Y (2018) Simvastatin protects dopaminergic neurons against MPP+‐induced oxidative stress and regulates the endogenous anti‐oxidant system through ERK. Cell Physiol Biochem 51: 1957–1968 · DOI
- Yang D, Li T, Wang Y, Tang Y, Cui H, Tang Y, Zhang X, Chen D, Shen N, Le W (2012) miR‐132 regulates the differentiation of dopamine neurons by directly targeting Nurr1 expression. J Cell Sci 125: 1673–1682
- Yang Y, Fan X, Mao M, Song X, Wu P, Zhang Y, Jin Y, Yang Y, Chen LL, Wang Y et al (2017) Extensive translation of circular RNAs driven by N(6)‐methyladenosine. Cell Res 27: 626–641 · DOI · Paper page
- You X, Vlatkovic I, Babic A, Will T, Epstein I, Tushev G, Akbalik G, Wang M, Glock C, Quedenau C et al (2015) Neural circular RNAs are derived from synaptic genes and regulated by development and plasticity. Nat Neurosci 18: 603–610 · DOI · Paper page
- Zhang Y, James M, Middleton FA, Davis RL (2005) Transcriptional analysis of multiple brain regions in Parkinson's disease supports the involvement of specific protein processing, energy metabolism, and signaling pathways, and suggests novel disease mechanisms. Am J Med Genet B Neuropsychiatr Genet 137B: 5–16 · DOI
- Zhang C, Darnell RB (2011) Mapping in vivo protein‐RNA interactions at single‐nucleotide resolution from HITS‐CLIP data. Nat Biotechnol 29: 607–614 · DOI
- Zhang Z, Yang T, Xiao J (2018) Circular RNAs: promising biomarkers for human diseases. EBioMedicine 34: 267–274 · DOI
- Zhou L, Yang L, Li YJ, Mei R, Yu HL, Gong Y, Du MY, Wang F (2018) MicroRNA‐128 protects dopamine neurons from apoptosis and upregulates the expression of excitatory amino acid transporter 4 in parkinson's disease by binding to AXIN1. Cell Physiol Biochem 51: 2275–2289 · DOI · Paper page
Cited by
Sorted by citations
He, S., Huang, L., Shao, C., Nie, T., Xia, L., Cui, B., Lu, F., Zhu, L., Chen, B., & Yang, Q. (2021) · Translational Neurodegeneration · doi:10.1186/s40035-021-00249-y · Cited by 80
MiR-128-3p – a gray eminence of the human central nervous system
Kiel, K., Król, S. K., Bronisz, A., & Godlewski, J. (2024) · Molecular Therapy Nucleic Acids · doi:10.1016/j.omtn.2024.102141 · Cited by 15
Metadata
- Authors
- Hanan, M., Simchovitz, A., Yayon, N., Vaknine, S., Cohen‐Fultheim, R., Karmon, M., Madrer, N., Rohrlich, T. M., Maman, M., Bennett, E. R., Greenberg, D. S., Meshorer, E., Levanon, E. Y., Soreq, H., & Kadener, S.
- Venue
- EMBO Molecular Medicine
- Published
- 2020-07-26
- Volume
- 12
- Issue
- 9
- ISSN
- 1757-4676
- 1757-4684
- PMC
- PMC7507321
- Cited by
- 130
- References
- 17
- Language
- en
- Update notices
- Funders
- Michael J. Fox Foundation for Parkinson's Research (MJFF11183)
- The Netherlands Brain Bank
- Israeli Ministry of Science, Technology and Space (53140)
- Edmond and Lily Safra Center of Brain Sciences
- National Institutes of Health (R01AG057700)
About these checks
Registry, retraction, Cites and statistics results are computed, not judged, with one exception: a printed reference that no index lists is read once by a model before it counts as a citation error. Claims are extracted by a model and kept only when their quote appears verbatim in the text; each cited source is then checked, with a model’s help, for whether it says what the claim relies on. Those verdicts can be wrong — read the claim’s quote and the cited source before relying on one.
Statistics and arithmetic are recomputed, not judged.
Confidence bands are shown only for fields calibrated on our annotated test set. None is calibrated yet, so no band is shown.
What counts as a claim ›How we measure confidence ›How we check this ›
Are you an author, or do you see a problem with this page? Request a review
