

The DOI matches its Crossref record; 55 of the 55 references it cites were found in a registry or an index.
Adult hippocampal neurogenesis inversely correlates with microglia in conditions of voluntary running and aging
Open accessAbstract
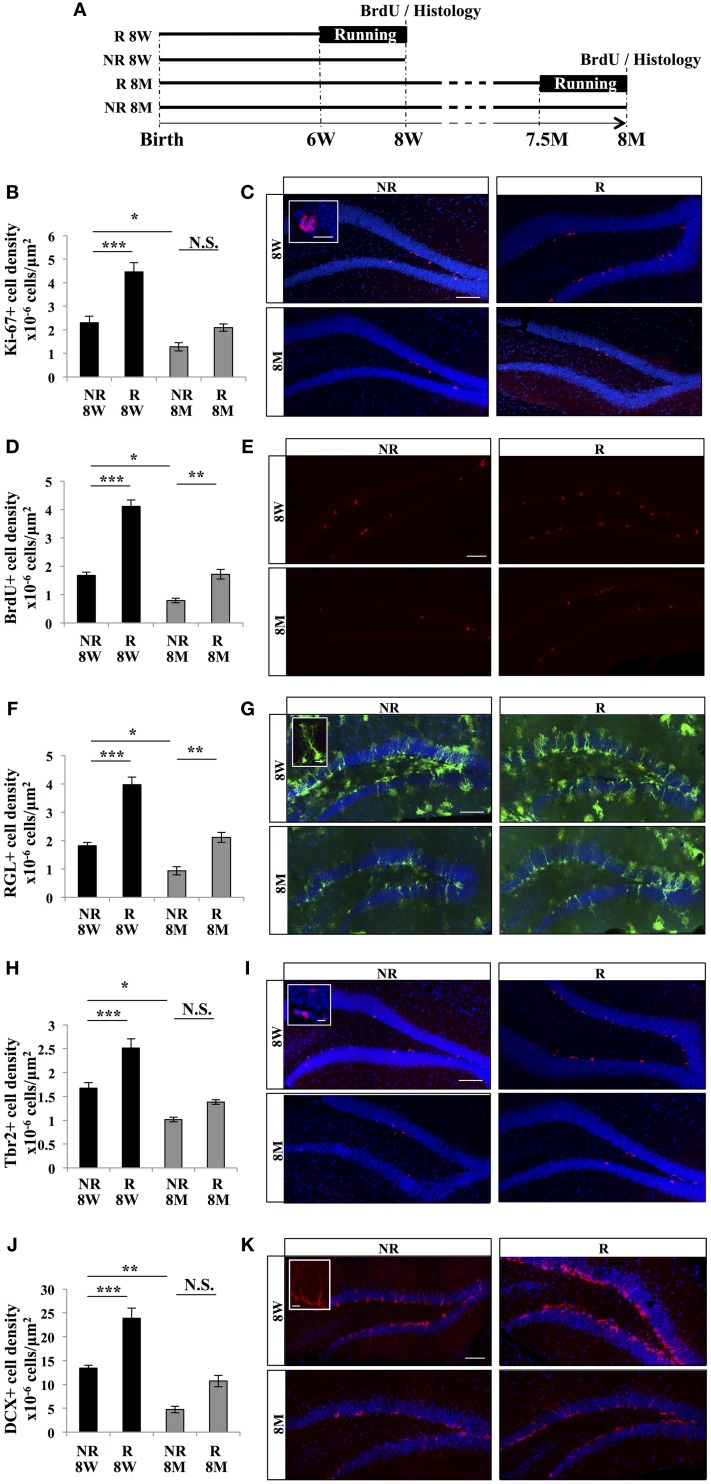
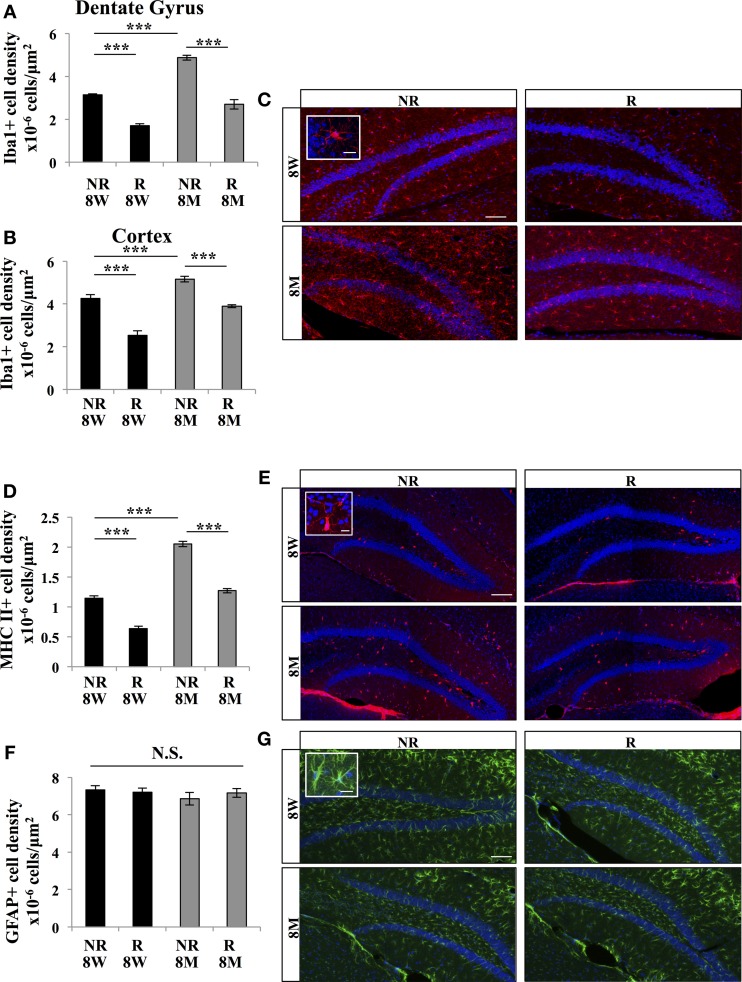
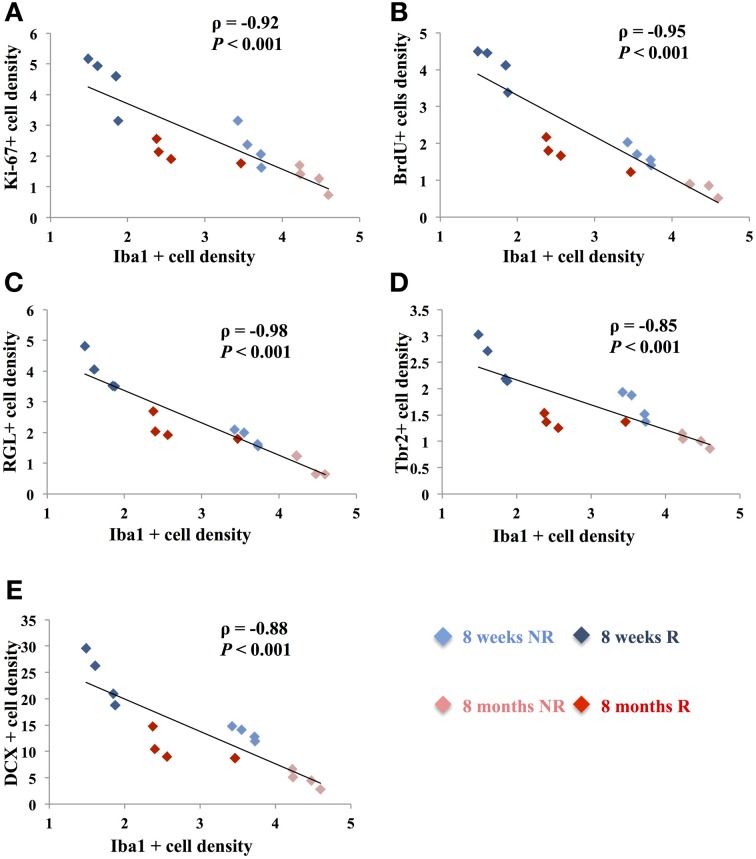
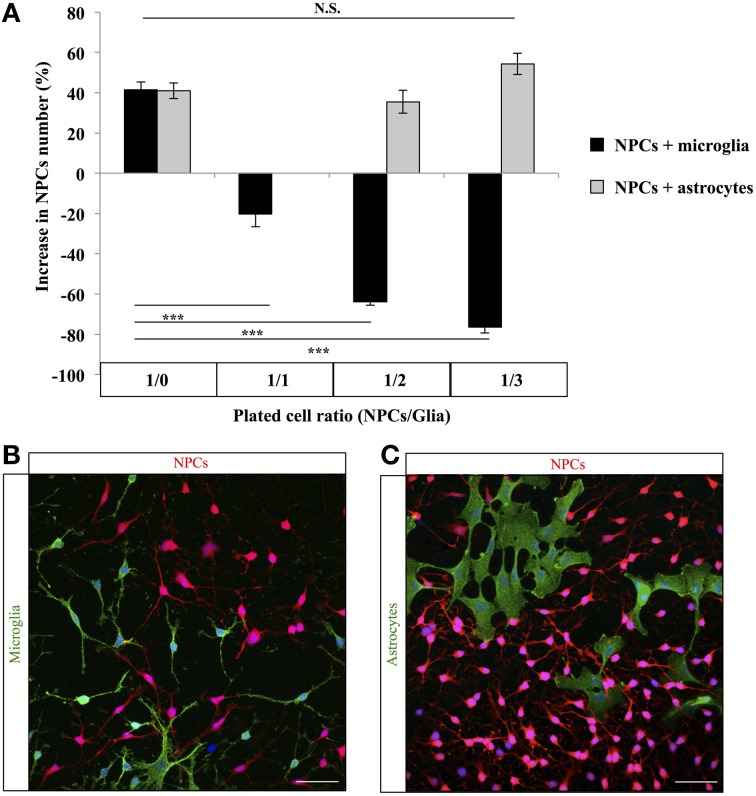
Adult hippocampal neurogenesis results in the formation of new neurons and is a process of brain plasticity involved in learning and memory. The proliferation of adult neural stem or progenitor cells is regulated by several extrinsic factors such as experience, disease or aging and intrinsic factors originating from the neurogenic niche. Microglia is very abundant in the dentate gyrus (DG) and increasing evidence indicates that these cells mediate the inflammation-induced reduction in neurogenesis. However, the role of microglia in neurogenesis in physiological conditions remains poorly understood. In this study, we monitored microglia and the proliferation of adult hippocampal stem/progenitor cells in physiological conditions known to increase or decrease adult neurogenesis, voluntary running and aging respectively. We found that the number of microglia in the DG was strongly inversely correlated with the number of stem/progenitor cells and cell proliferation in the granule cell layer. Accordingly, co-cultures of decreasing neural progenitor/glia ratio showed that microglia but not astroglia reduced the number of progenitor cells. Together, these results suggest that microglia inhibits the proliferation of neural stem/progenitor cells despite the absence of inflammatory stimulus.
Overview
The claims and statistics of this paper haven’t been checked yet.
Run the check — free, no account needed. It reads the open-access text and checks the sources it cites.
Integrity signals
Registry
Cites
Statistics
Figures
Verification
Claims the paper makes
The claims and statistics of this paper haven’t been checked yet.
Run the check — free, no account needed. It reads the open-access text and checks the sources it cites.
Claims other papers make about this one
Each is checked against this paper’s own text: does it say what the citing paper says it does?
The source backs part of the claim, not all of it — or backs it for a different population, condition or comparison.
In the citing paper
“Clinical and animal reports show that aerobic exercise (right) in humans and voluntary running in rodents is associated with enhanced neurogenesis, improved learning and memory, increased hippocampal BDNF, and dampened inflammatory response to immune challenge and microglia proliferation(Barrientos et al, 2011;Colcombe et al, 2003;Gebara et al, 2013).”
From Microglia Priming with Aging and Stress (2017) · cites this paper as Gebara et al, 2013
Experimental — accuracy not yet measuredThe check wasn’t confident either way, so it gives no verdict — never disputed.
In the citing paper
“Clinical and animal reports show that aerobic exercise (right) in humans and voluntary running in rodents is associated with enhanced neurogenesis, improved learning and memory, increased hippocampal BDNF, and dampened inflammatory response to immune challenge and microglia proliferation(Barrientos et al, 2011;Colcombe et al, 2003;Gebara et al, 2013).”
From Microglia Priming with Aging and Stress (2017) · cites this paper as Gebara et al, 2013
Experimental — accuracy not yet measuredIn the citing paper
“On the contrary, aging has also been associated with an increase, rather than a decrease, in microglial population (Gebara et al, 2013;Mouton et al, 2002;Tremblay et al, 2012).”
From Microglia Priming with Aging and Stress (2017) · cites this paper as Gebara et al, 2013
In the citing paper
“Clinical and animal reports show that aerobic exercise (right) in humans and voluntary running in rodents is associated with enhanced neurogenesis, improved learning and memory, increased hippocampal BDNF, and dampened inflammatory response to immune challenge and microglia proliferation (Barrientos et al, 2011;Colcombe et al, 2003;Gebara et al, 2013).”
From Microglia Priming with Aging and Stress (2017) · cites this paper as Gebara et al, 2013
In the citing paper
“Exercise was also shown to prevent age-associated increase in microglia proliferation (Gebara et al, 2013).”
From Microglia Priming with Aging and Stress (2017) · cites this paper as Gebara et al, 2013
In the citing paper
“Clinical and animal reports show that aerobic exercise (right) in humans and voluntary running in rodents is associated with enhanced neurogenesis, improved learning and memory, increased hippocampal BDNF, and dampened inflammatory response to immune challenge and microglia proliferation(Barrientos et al, 2011;Colcombe et al, 2003;Gebara et al, 2013).”
From Microglia Priming with Aging and Stress (2017) · cites this paper as Gebara et al, 2013
In the citing paper
“Clinical and animal reports show that aerobic exercise (right) in humans and voluntary running in rodents is associated with enhanced neurogenesis, improved learning and memory, increased hippocampal BDNF, and dampened inflammatory response to immune challenge and microglia proliferation(Barrientos et al, 2011;Colcombe et al, 2003;Gebara et al, 2013).”
From Microglia Priming with Aging and Stress (2017) · cites this paper as Gebara et al, 2013
In the citing paper
“Clinical and animal reports show that aerobic exercise (right) in humans and voluntary running in rodents is associated with enhanced neurogenesis, improved learning and memory, increased hippocampal BDNF, and dampened inflammatory response to immune challenge and microglia proliferation(Barrientos et al, 2011;Colcombe et al, 2003;Gebara et al, 2013).”
From Microglia Priming with Aging and Stress (2017) · cites this paper as Gebara et al, 2013
In the citing paper
“Clinical and animal reports show that aerobic exercise (right) in humans and voluntary running in rodents is associated with enhanced neurogenesis, improved learning and memory, increased hippocampal BDNF, and dampened inflammatory response to immune challenge and microglia proliferation(Barrientos et al, 2011;Colcombe et al, 2003;Gebara et al, 2013).”
From Microglia Priming with Aging and Stress (2017) · cites this paper as Gebara et al, 2013
In the citing paper
“Clinical and animal reports show that aerobic exercise (right) in humans and voluntary running in rodents is associated with enhanced neurogenesis, improved learning and memory, increased hippocampal BDNF, and dampened inflammatory response to immune challenge and microglia proliferation(Barrientos et al, 2011;Colcombe et al, 2003;Gebara et al, 2013).”
From Microglia Priming with Aging and Stress (2017) · cites this paper as Gebara et al, 2013
In the citing paper
“Clinical and animal reports show that aerobic exercise (right) in humans and voluntary running in rodents is associated with enhanced neurogenesis, improved learning and memory, increased hippocampal BDNF, and dampened inflammatory response to immune challenge and microglia proliferation(Barrientos et al, 2011;Colcombe et al, 2003;Gebara et al, 2013).”
From Microglia Priming with Aging and Stress (2017) · cites this paper as Gebara et al, 2013
Self-check
Percentages, sums and reported differences re-computed from the paper’s own numbers.
The self-check needs the paper’s full text.
Citations
Cites
Neurogenesis in the adult human hippocampus
Eriksson, P. S., Perfilieva, E., Björk-Eriksson, T., Alborn, A.-M., Nordborg, C., Peterson, D. A., & Gage, F. H. (1998) · Nature Medicine · doi:10.1038/3305 · Cited by 6,369
(2023) · doi:10.1126/science · Cited by 6,063
Gage, F. H. (2000) · Science · doi:10.1126/science.287.5457.1433 · Cited by 4,786
Synaptic Pruning by Microglia Is Necessary for Normal Brain Development
Paolicelli, R. C., Bolasco, G., Pagani, F., Maggi, L., Scianni, M., Panzanelli, P., Giustetto, M., Ferreira, T. A., Guiducci, E., Dumas, L., et al. (2011) · Science · doi:10.1126/science.1202529 · Cited by 4,244
Running increases cell proliferation and neurogenesis in the adult mouse dentate gyrus
van Praag, H., Kempermann, G., & Gage, F. H. (1999) · Nature Neuroscience · doi:10.1038/6368 · Cited by 3,880
Kuhn, H., Dickinson-Anson, H., & Gage, F. (1996) · The Journal of Neuroscience · doi:10.1523/jneurosci.16-06-02027.1996 · Cited by 3,139
Mechanisms and Functional Implications of Adult Neurogenesis
Zhao, C., Deng, W., & Gage, F. H. (2008) · Cell · doi:10.1016/j.cell.2008.01.033 · Cited by 3,007
The Glial Nature of Embryonic and Adult Neural Stem Cells
Kriegstein, A., & Alvarez-Buylla, A. (2009) · Annual Review of Neuroscience · doi:10.1146/annurev.neuro.051508.135600 · Cited by 2,475
Inflammatory Blockade Restores Adult Hippocampal Neurogenesis
Monje, M. L., Toda, H., & Palmer, T. D. (2003) · Science · doi:10.1126/science.1088417 · Cited by 2,426
Exercise enhances learning and hippocampal neurogenesis in aged mice
van Praag, H., Shubert, T., Zhao, C., & Gage, F. H. (2005) · The Journal of Neuroscience · doi:10.1523/jneurosci.1731-05.2005 · Cited by 2,078
Cited by
Sorted by citations
Neuroinflammation: The Devil Is in the Details
DiSabato, D. J., Quan, N., & Godbout, J. P. (2016) · Journal of Neurochemistry · doi:10.1111/jnc.13607 · Cited by 1,640
Neurogenesis in the embryonic and adult brain: same regulators, different roles
Urbán, N., & Guillemot, F. (2014) · Frontiers in Cellular Neuroscience · doi:10.3389/fncel.2014.00396 · Cited by 493
Microglia Priming with Aging and Stress
Niraula, A., Sheridan, J. F., & Godbout, J. P. (2017) · Neuropsychopharmacology · doi:10.1038/npp.2016.185 · Cited by 398
Microglia: Architects of the Developing Nervous System
Frost, J. L., & Schafer, D. P. (2016) · Trends in Cell Biology · doi:10.1016/j.tcb.2016.02.006 · Cited by 385
Microglia Function in Central Nervous System Development and Plasticity
Schafer, D. P., & Stevens, B. (2015) · Cold Spring Harbor Perspectives in Biology · doi:10.1101/cshperspect.a020545 · Cited by 353
Microglia Actively remodel adult hippocampal neurogenesis through the phagocytosis secretome
Diaz-Aparicio, I., Paris, I., Sierra-Torre, V., Plaza-Zabala, A., Rodríguez-Iglesias, N., Márquez-Ropero, M., Beccari, S., Huguet, P., Abiega, O., Alberdi, E., et al. (2020) · The Journal of Neuroscience · doi:10.1523/jneurosci.0993-19.2019 · Cited by 333
Neurogenesis and Inflammation after Ischemic Stroke: What is Known and Where We Go from Here
Tobin, M. K., Bonds, J. A., Minshall, R. D., Pelligrino, D. A., Testai, F. D., & Lazarov, O. (2014) · Journal of Cerebral Blood Flow & Metabolism · doi:10.1038/jcbfm.2014.130 · Cited by 310
Kierdorf, K., & Prinz, M. (2017) · Journal of Clinical Investigation · doi:10.1172/jci90602 · Cited by 305
Sierra, A., Beccari, S., Díaz‐Aparicio, I., Encinas, J. M., Comeau, S., & Tremblay, M. (2014) · Neural Plasticity · doi:10.1155/2014/610343 · Cited by 268
Aging and Rejuvenation of Neural Stem Cells and Their Niches
Navarro Negredo, P., Yeo, R. W., & Brunet, A. (2020) · Cell Stem Cell · doi:10.1016/j.stem.2020.07.002 · Cited by 246
Sexually divergent induction of microglial-associated neuroinflammation with hippocampal aging
Mangold, C. A., Wronowski, B., Du, M., Masser, D. R., Hadad, N., Bixler, G. V., Brucklacher, R. M., Ford, M. M., Sonntag, W. E., & Freeman, W. M. (2017) · Journal of Neuroinflammation · doi:10.1186/s12974-017-0920-8 · Cited by 203
Adult neurogenesis: a substrate for experience-dependent change
Opendak, M., & Gould, E. (2015) · Trends in Cognitive Sciences · doi:10.1016/j.tics.2015.01.001 · Cited by 200
Effects of Microglia on Neurogenesis
Sato, K. (2015) · Glia · doi:10.1002/glia.22858 · Cited by 187
The role of microglia in adult hippocampal neurogenesis
Gemma, C., & Bachstetter, A. D. (2013) · Frontiers in Cellular Neuroscience · doi:10.3389/fncel.2013.00229 · Cited by 202
Ryan, S. M., & Nolan, Y. M. (2015) · Neuroscience & Biobehavioral Reviews · doi:10.1016/j.neubiorev.2015.12.004 · Cited by 205
Mattei, D., Djodari-Irani, A., Hadar, R., Pelz, A., de Cossío, L. F., Goetz, T., Matyash, M., Kettenmann, H., Winter, C., & Wolf, S. A. (2014) · Brain Behavior and Immunity · doi:10.1016/j.bbi.2014.01.019 · Cited by 195
Vogel, A. D., Upadhya, R., & Shetty, A. K. (2018) · EBioMedicine · doi:10.1016/j.ebiom.2018.11.026 · Cited by 186
Lipopolysaccharide-induced sepsis induces long-lasting affective changes in the mouse
Anderson, S. T., Commins, S., Moynagh, P. N., & Coogan, A. N. (2014) · Brain Behavior and Immunity · doi:10.1016/j.bbi.2014.07.007 · Cited by 175
Short, A. K., Yeshurun, S., Powell, R., Perreau, V. M., Fox, A., Kim, J. H., Pang, T. Y., & Hannan, A. J. (2017) · Translational Psychiatry · doi:10.1038/tp.2017.82 · Cited by 166
On the Run for Hippocampal PlasticityPreprint
Cooper, C. P., Moon, H. Y., & van Praag, H. (2017) · Cold Spring Harbor Perspectives in Medicine · doi:10.1101/cshperspect.a029736 · Cited by 168
Exosomes as Novel Regulators of Adult Neurogenic Niches
Bátiz, L. F., Castro, M. A., Burgos, P. V., Velásquez, Z. D., Muñoz, R. I., Lafourcade, C., Troncoso-Escudero, P., & Wyneken, Ú. (2016) · Frontiers in Cellular Neuroscience · doi:10.3389/fncel.2015.00501 · Cited by 164
Inflammation and neuronal plasticity: a link between childhood trauma and depression pathogenesis
Cattaneo, A., Macchi, F., Plazzotta, G., Veronica, B., Bocchio-Chiavetto, L., Riva, M. A., & Pariante, C. M. (2015) · Frontiers in Cellular Neuroscience · doi:10.3389/fncel.2015.00040 · Cited by 152
Matsuda, T., Murao, N., Katano, Y., Juliandi, B., Kohyama, J., Akira, S., Kawai, T., & Nakashima, K. (2015) · Nature Communications · doi:10.1038/ncomms7514 · Cited by 145
Heterogeneity of Radial Glia-Like Cells in the Adult Hippocampus
Gebara, E., Bonaguidi, M. A., Beckervordersandforth, R., Sultan, S., Udry, F., Gijs, P.-J., Lie, D. C., Ming, G., Song, H., & Toni, N. (2016) · Stem Cells · doi:10.1002/stem.2266 · Cited by 139
Self-citationMorton, M. C., Neckles, V. N., Seluzicki, C. M., Holmberg, J. C., & Feliciano, D. M. (2018) · Cell Reports · doi:10.1016/j.celrep.2018.03.037 · Cited by 122
Xie, L., Liu, Y., Zhang, N., Li, C., Sandhu, A. F., Williams, G. E., Shen, Y., Li, H., Wu, Q.-F., & Yu, S.-G. (2021) · Frontiers in Neuroscience · doi:10.3389/fnins.2021.689629 · Cited by 119
Mechanisms of Hippocampal Aging and the Potential for Rejuvenation
Fan, X., Wheatley, E., & Villeda, S. (2017) · Annual Review of Neuroscience · doi:10.1146/annurev-neuro-072116-031357 · Cited by 132
Littlefield, A. M., Setti, S., Priester, C., & Kohman, R. (2015) · Journal of Neuroinflammation · doi:10.1186/s12974-015-0362-0 · Cited by 102
Moss, J., Gebara, E., Bushong, E. A., Sánchez-Pascual, I., O’Laoi, R., M’Ghari, I. E., Kocher-Braissant, J., Ellisman, M. H., & Toni, N. (2016) · Proceedings of the National Academy of Sciences · doi:10.1073/pnas.1514652113 · Cited by 122
Self-citationActivity Dependency and Aging in the Regulation of Adult NeurogenesisPreprint
Kempermann, G. (2015) · Cold Spring Harbor Perspectives in Biology · doi:10.1101/cshperspect.a018929 · Cited by 120
Salgado, A. J., Sousa, J. C., Costa, B. M., Pires, A. O., Mateus‐Pinheiro, A., Teixeira, F. G., Pinto, L., & Sousa, N. (2015) · Frontiers in Cellular Neuroscience · doi:10.3389/fncel.2015.00249 · Cited by 115
Liu, L., Zhang, Q., Cai, Y., Sun, D., Xie, H., Wang, L., Yu, D., Li, X., Xiong, X., Xu, H., et al. (2016) · Oncotarget · doi:10.18632/oncotarget.11178 · Cited by 103
Hippocampal adult neurogenesis: Does the immune system matter?
de Miranda, A. S., Zhang, C., Katsumoto, A., & Teixeira, A. L. (2016) · Journal of the Neurological Sciences · doi:10.1016/j.jns.2016.10.052 · Cited by 103
Astrocytes’ Contribution to Adult Neurogenesis in Physiology and Alzheimer’s Disease
Cassé, F., Richetin, K., & Toni, N. (2018) · Frontiers in Cellular Neuroscience · doi:10.3389/fncel.2018.00432 · Cited by 109
Self-citationHoeijmakers, L., Lucassen, P. J., & Kőrösi, A. (2015) · Frontiers in Molecular Neuroscience · doi:10.3389/fnmol.2014.00103 · Cited by 98
Juliandi, B., Tanemura, K., Igarashi, K., Tominaga, T., Furukawa, Y., Otsuka, M., Moriyama, N., Ikegami, D., Abematsu, M., Sanosaka, T., et al. (2015) · Stem Cell Reports · doi:10.1016/j.stemcr.2015.10.012 · Cited by 90
Temporal dynamics of hippocampal neurogenesis in chronic neurodegeneration
Gomez-Nicola, D., Suzzi, S., Vargas-Caballero, M., Fransen, N. L., Al-Malki, H., Cebrian-Silla, A., Garcia-Verdugo, J. M., Riecken, K., Fehse, B., & Perry, V. H. (2014) · Brain · doi:10.1093/brain/awu155 · Cited by 84
Taurine increases hippocampal neurogenesis in aging mice
Gebara, E., Udry, F., Sultan, S., & Toni, N. (2015) · Stem Cell Research · doi:10.1016/j.scr.2015.04.001 · Cited by 82
Self-citationCurrent perspectives on the link between neuroinflammation and neurogenesis
Wang, B. Z., & Jin, K. (2014) · Metabolic Brain Disease · doi:10.1007/s11011-014-9523-6 · Cited by 68
The Participation of Microglia in Neurogenesis: A Review
Pérez-Rodríguez, D. R., Blanco‐Luquin, I., & Mendióroz, M. (2021) · Brain Sciences · doi:10.3390/brainsci11050658 · Cited by 74
Epigenetic regulation of adult neural stem cells: implications for Alzheimer’s disease
Fitzsimons, C. P., van Bodegraven, E. J., Schouten, M., Lardenoije, R., Kompotis, K., Kenis, G., van den Hurk, M., Boks, M. P., Biojone, C., Joca, S. R. L., et al. (2014) · Molecular Neurodegeneration · doi:10.1186/1750-1326-9-25 · Cited by 67
Lifestyle Shapes the Dialogue between Environment, Microglia, and Adult Neurogenesis
Valero, J., Paris, I., & Sierra, A. (2016) · ACS Chemical Neuroscience · doi:10.1021/acschemneuro.6b00009 · Cited by 64
Neural Stem Cell Plasticity: Advantages in Therapy for the Injured Central Nervous System
Ottoboni, L., Merlini, A., & Martino, G. (2017) · Frontiers in Cell and Developmental Biology · doi:10.3389/fcell.2017.00052 · Cited by 56
Ghalandari-Shamami, M., Nourizade, S., Yousefi, B., Vafaei, A. A., Pakdel, R., & Rashidy‐Pour, A. (2019) · Neurochemical Research · doi:10.1007/s11064-019-02727-2 · Cited by 50
Yun, S., Donovan, M. H., Ross, M. N., Richardson, D. R., Reister, R., Farnbauch, L. A., Fischer, S. J., Riethmacher, D., Gershenfeld, H. K., Lagace, D. C., et al. (2016) · PLoS ONE · doi:10.1371/journal.pone.0147256 · Cited by 51
Merkley, C. M., Jian, C., Mosa, A. J., Tan, Y., & Wojtowicz, J. M. (2014) · Frontiers in Neuroscience · doi:10.3389/fnins.2014.00174 · Cited by 49
D-serine increases adult hippocampal neurogenesis
Sultan, S., Gebara, E., Moullec, K., & Toni, N. (2013) · Frontiers in Neuroscience · doi:10.3389/fnins.2013.00155 · Cited by 55
Self-citationTargeting Adult Neurogenesis to Optimize Hippocampal Circuits in Aging
McAvoy, K. M., & Sahay, A. (2017) · Neurotherapeutics · doi:10.1007/s13311-017-0539-6 · Cited by 45
The effect of aged microglia on synaptic impairment and its relevance in neurodegenerative diseases
Triviño, J. J., & von Bernhardi, R. (2021) · Neurochemistry International · doi:10.1016/j.neuint.2021.104982 · Cited by 43
Rejuvenating the Brain With Chronic Exercise Through Adult Neurogenesis
Trinchero, M., Herrero, M., & Schinder, A. F. (2019) · Frontiers in Neuroscience · doi:10.3389/fnins.2019.01000 · Cited by 33
Allergy Enhances Neurogenesis and Modulates Microglial Activation in the Hippocampus
Klein, B., Mrowetz, H., Thalhamer, J., Scheiblhofer, S., Weiss, R., & Aigner, L. (2016) · Frontiers in Cellular Neuroscience · doi:10.3389/fncel.2016.00169 · Cited by 41
Mechanisms underlying the effect of voluntary running on adult hippocampal neurogenesis
Gao, Y., Syed, M., & Zhao, X. (2023) · Hippocampus · doi:10.1002/hipo.23520 · Cited by 37
The Secretome of Microglia Regulate Neural Stem Cell Function
Osman, A. M., Rodhe, J., Shen, X., Dominguez, C. A., Joseph, B., & Blomgren, K. (2017) · Neuroscience · doi:10.1016/j.neuroscience.2017.10.034 · Cited by 33
Anti-aggregant tau mutant promotes neurogenesis
Joseph, M., Anglada‐Huguet, M., Paesler, K., Mandelkow�, E., & Mandelkow, E. (2017) · Molecular Neurodegeneration · doi:10.1186/s13024-017-0230-8 · Cited by 30
D’Andrea, G., Ceccarelli, M., Bernini, R., Clemente, M. E. N., Santi, L., Caruso, C., Micheli, L., & Tirone, F. (2020) · The FASEB Journal · doi:10.1096/fj.201902643r · Cited by 31
Huang, Y., Wu, C., He, X., Wu, D., He, X., Liang, F., Dai, G., Pei, Z., Xu, G., & Lan, Y. (2018) · Frontiers in Cellular Neuroscience · doi:10.3389/fncel.2018.00177 · Cited by 27
Shepherd, A. L., Zhang, T. D., Zeleznikow-Johnston, A., Hannan, A. J., & Burrows, E. L. (2018) · Brain Plasticity · doi:10.3233/bpl-180076 · Cited by 28
The interaction between stress and exercise, and its impact on brain function
Russell, V. A., Zigmond, M. J., Dimatelis, J. J., Daniels, W. M. U., & Mabandla, M. V. (2014) · Metabolic Brain Disease · doi:10.1007/s11011-013-9479-y · Cited by 28
Gut microbiota regulates exercise-induced hormetic modulation of cognitive function
Cintado, E., Muela, P., Rodriguez, L., Alcaide, I., Tezanos, P., Vlčková, K., Valderrama, B., Bastiaanssen, T. F. S., Rodríguez-Muñoz, M., CEBALLOS, M. L. D., et al. (2025) · EBioMedicine · doi:10.1016/j.ebiom.2025.105876 · Cited by 28
Disc1 Variation Leads to Specific Alterations in Adult Neurogenesis
Chandran, J. S., Kazanis, I., Clapcote, S. J., Ogawa, F., Millar, J. K., Porteous, D. J., & ffrench‐Constant, C. (2014) · PLoS ONE · doi:10.1371/journal.pone.0108088 · Cited by 24
Converged avenues: depression and Alzheimer’s disease– shared pathophysiology and novel therapeutics
Bajaj, S., & Mahesh, R. (2024) · Molecular Biology Reports · doi:10.1007/s11033-023-09170-1 · Cited by 25
Garcia‐Agudo, L. F., Steixner-Kumar, A. A., Curto, Y., Barnkothe, N., Hassouna, I. A., Jähne, S., Butt, U. J., Grewe, K., Weber, M. S., Green, K., et al. (2021) · Cell Reports · doi:10.1016/j.celrep.2021.109548 · Cited by 23
Leal‐Galicia, P., Parra, H. R., Rodríguez–Serrano, L. M., & Buenrostro-Jáuregui, M. H. (2019) · Journal of Chemical Neuroanatomy · doi:10.1016/j.jchemneu.2019.101667 · Cited by 24
Osman, N. M. S., Amer, A., & Abdelwahab, S. A. (2015) · Anatomical Science International · doi:10.1007/s12565-015-0297-7 · Cited by 20
Oh, J.-M., Jeong, J. H., Park, S. Y., & Chun, S. (2020) · Biomolecules · doi:10.3390/biom10030484 · Cited by 20
Role of Microglia in Central Nervous System Development and PlasticityPreprint
Schafer, D. P., Stevens, B., Bennett, M. L., & Bennett, F. C. (2024) · Cold Spring Harbor Perspectives in Biology · doi:10.1101/cshperspect.a041810 · Cited by 19
Rastegar-Moghaddam, S. H., Bigham, M., Hosseini, M., Ebrahimzadeh‐Bideskan, A., Malvandi, A. M., & Mohammadipour, A. (2021) · Nutritional Neuroscience · doi:10.1080/1028415x.2021.1918983 · Cited by 17
Nheu, D., Ellen, O., Ye, S., Öztürk, E., Pagnin, M., Kertadjaja, S., Theotokis, P., Grigoriadis, N., McLean, C., & Petratos, S. (2022) · Cells · doi:10.3390/cells11233768 · Cited by 16
Stephenson, K. A., Rae, M. G., & O'Malley, D. (2020) · Cytokine · doi:10.1016/j.cyto.2020.155134 · Cited by 15
The intricate interplay between microglia and adult neurogenesis in Alzheimer’s disease
Früholz, I., & Meyer‐Luehmann, M. (2024) · Frontiers in Cellular Neuroscience · doi:10.3389/fncel.2024.1456253 · Cited by 16
Leiter, O., Bernas, S. N., Seidemann, S., Overall, R. W., Horenburg, C., Kowal, S., Kempermann, G., & Walker, T. L. (2019) · Scientific Reports · doi:10.1038/s41598-019-48360-5 · Cited by 12
Gurung, S., Agbaga, M., & Myers, D. A. (2016) · Behavioural Brain Research · doi:10.1016/j.bbr.2016.05.018 · Cited by 11
Crisci, I., Bonzano, S., Zinter, N., Dallorto, E., Peretto, P. M., Krężel, W., & Marchis, S. D. (2024) · Glia · doi:10.1002/glia.24526 · Cited by 11
Dexmedetomidine attenuates ethanol-induced inhibition of hippocampal neurogenesis in neonatal mice
Lv, K., Yang, C., Xiao, R., Yang, L., Liu, T., Zhang, R., & Fan, X. (2020) · Toxicology and Applied Pharmacology · doi:10.1016/j.taap.2020.114881 · Cited by 10
Hoeijmakers, L., Meerhoff, G. F., de Vries, J. W., Ruigrok, S. R., van Dam, A., LEUVEN, F. V., Kőrösi, A., & Lucassen, P. J. (2017) · Neurobiology of Aging · doi:10.1016/j.neurobiolaging.2017.09.013 · Cited by 7
The impact of mechanically stimulated muscle-derived stromal cells on aged skeletal muscle
Huntsman, H. D., Rendeiro, C., Merritt, J. R., Pincu, Y., Cobert, A., Lisio, M. D., Kolyvas, E. A., Dvoretskiy, S., Dobrucki, I. T., Kemkemer, R., et al. (2017) · Experimental Gerontology · doi:10.1016/j.exger.2017.12.012 · Cited by 8
Mottolese, N., Uguagliati, B., Tassinari, M., Cerchier, C. B., Loi, M., Candini, G., Rimondini, R., Medici, G., Trazzi, S., & Ciani, E. (2023) · Biomolecules · doi:10.3390/biom13091396 · Cited by 6
Wu, C. J., Bendriem, R. M., Freed, W. J., & Lee, C. (2021) · Restorative Neurology and Neuroscience · doi:10.3233/rnn-211161 · Cited by 7
Neurogenesis and neuroinflammation: The role of Wnt proteins
Aniol, V. A., Тишкина, А. О., & Gulyaeva, N. V. (2016) · Neurochemical Journal · doi:10.1134/s1819712415040030 · Cited by 5
Shpaner, M., Tulipani, L. J., Bishop, J. H., & Naylor, M. R. (2017) · Current Behavioral Neuroscience Reports · doi:10.1007/s40473-017-0126-5 · Cited by 5
Aging Microglia and Their Impact in the Nervous System
Rommy von Bernhardi, M., & Eugenín, J. L. (2024) · Advances in neurobiology · doi:10.1007/978-3-031-55529-9_21 · Cited by 4
Ikeda, Y., & Ikeda, M. (2015) · Neuroscience Letters · doi:10.1016/j.neulet.2015.09.017 · Cited by 3
Role of Microglia in Adult Neurogenesis
Ghosh, P., & Ghosh, A. (2016) · Springer eBooks · doi:10.1007/978-981-10-1711-7_13 · Cited by 2
Neuroprotection in Perimenopausal Women
Russu, M. C., & Antonescu, A. C. (2018) · InTech eBooks · doi:10.5772/intechopen.74330 · Cited by 3
Fabianová, K., Raček, A., Popovičová, A., Martončíková, M., & Račeková, E. (2024) · Biotechnic & Histochemistry · doi:10.1080/10520295.2024.2424252 · Cited by 1
Region-Specific Adult Neural Stem Cell Niches of the Mediobasal Hypothalamus and Medulla Oblongata
Furube, E., Fujii, R., Nambu, Y., Hiratsuka, D., Yoshimura, R., & Miyata, S. (2025) · Stem Cell Reviews and Reports · doi:10.1007/s12015-025-10995-5 · Cited by 1
Egoraeva, A. A., Manzhulo, I., Ivashkevich, D., & Tyrtyshnaia, A. A. (2026) · International Journal of Molecular Sciences · doi:10.3390/ijms27010471 · Cited by 1
Yogic Interventions in Clock Dysfunction, Neurodegeneration and Ageing
Jagota, A., Khan, Z. A., Sharma, S. A., & Dalai, M. (2024) · Springer eBooks · doi:10.1007/978-981-97-2855-8_4 · Cited by 1
Tognoni, C. M. (2014) · DukeSpace (Duke University) · Cited by 1
Anderson, S. T. (2014) · Maynooth University ePrints and eTheses Archive (Maynooth University)
Brain repair after irradiation or ischemia : role of neural stem cells and microglia
Osman, A. M. (2015) · Figshare
Matsuda, T., & Nakashima, K. (2015) · Neurogenesis · doi:10.1080/23262133.2015.1081714
Social instability, hippocampal plasticity and resilience
Opendak, M. M. (2015)
Functional Role of Physical Exercise and Omega-3 Fatty Acids on Depression and Mood Disorders
Vecchioli, S. F., & Cutuli, D. (2017) · Contemporary clinical neuroscience · doi:10.1007/978-3-319-52067-4_11
Effect of Reduced Neurogenesis on Microglial Activation
Smith, A. (2020)
Targeting microglial CSF1R in health and disease
Garcia‐Agudo, L. F. (2021) · doi:10.53846/goediss-8805
Brain Derived Neurotrophic Factor (BDNF) as a Mediator of Microglia-Induced Neuroinflammation
Charlton, T. (2022) · Carleton University's Institutional Repository (MacOdrum Library, Carleton University) · doi:10.22215/etd/2022-15264
Korenić, M., Korenić, A., Stamenković, V., Ayşit, N., & Anđjus, P. R. (2025) · Biochemical and Biophysical Research Communications · doi:10.1016/j.bbrc.2025.152232
Metadata
- Authors
- Gebara, E., Sultan, S., Kocher-Braissant, J., & Toni, N.
- Affiliations
- University of Lausanne (CH)
- Corresponding author
- Toni, Nicolas
- Venue
- Frontiers in Neuroscience
- Publisher
- Frontiers Media SA
- Published
- 2013
- Volume
- 7
- Pages
- 145-145
- ISSN
- 1662-453X (ISSN-L)
- PMC
- PMC3747329
- OpenAlex
- W2074643664
- Cited by
- 102
- References
- 55
- Citations by year
- 2026: 3 · 2025: 4 · 2024: 7 · 2023: 2 · 2022: 2 · 2021: 8 · 2020: 7 · 2019: 4 · 2018: 6 · 2017: 13 · 2016: 14 · 2015: 17 · 2014: 13 · 2013: 2
- FWCI
- 5.69
- Type
- journal article
- Language
- en
- Open access
- gold
- doi.org
- Licence
- cc-by
- Locations
- Frontiers in Neuroscience (publishedVersion, cc-by)
- Europe PMC (PubMed Central) (publishedVersion, cc-by)
- PubMed Central (publishedVersion, cc-by)
- PubMed (publishedVersion)
- IRIS (submittedVersion)
- DOAJ (DOAJ: Directory of Open Access Journals) (submittedVersion, cc-by-sa)
- SERVAL (Université de Lausanne) (submittedVersion, other-oa)
- Funders
- National Science Foundation
- Schweizerischer Nationalfonds zur Förderung der Wissenschaftlichen Forschung
- Fondation Leenaards
- Université de Lausanne
- Topics
- Life Sciences › Neuroscience › Developmental Neuroscience › Neurogenesis and neuroplasticity mechanisms
- Life Sciences › Neuroscience › Neurology › Neuroinflammation and Neurodegeneration Mechanisms
- Life Sciences › Neuroscience › Cellular and Molecular Neuroscience › Neuroscience and Neuropharmacology Research
- Keywords
- adult hippocampal neurogenesis, microglia, neural stem/progenitor cells, voluntary running, aging, dentate gyrus, granular layer, cell proliferation, astrocyte-microglia interaction, neurogenic niche, neuroinflammation, neuroplasticity
About these checks
Registry, retraction, Cites and statistics results are computed, not judged, with one exception: a printed reference that no index lists is read once by a model before it counts as a citation error. Claims are extracted by a model and kept only when their quote appears verbatim in the text; each cited source is then checked, with a model’s help, for whether it says what the claim relies on. Those verdicts can be wrong — read the claim’s quote and the cited source before relying on one.
Statistics and arithmetic are recomputed, not judged.
Confidence bands are shown only for fields calibrated on our annotated test set. None is calibrated yet, so no band is shown.
What counts as a claim ›How we measure confidence ›How we check this ›
Are you an author, or do you see a problem with this page? Request a review
