

The DOI matches its Crossref record; 4 of the 4 references it cites were found in a registry or an index.
MiRNA Profiling in Plasma Neural-Derived Small Extracellular Vesicles from Patients with Alzheimer’s Disease
Abstract
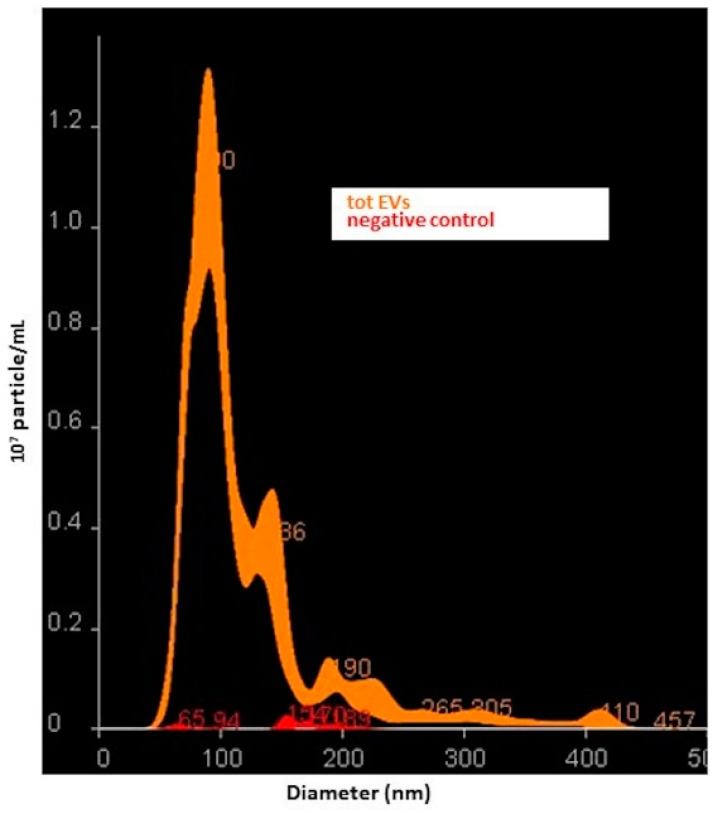
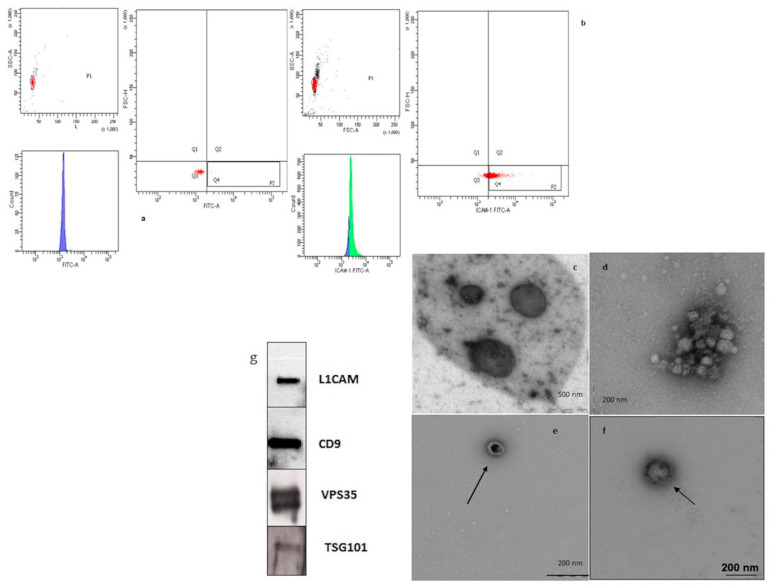
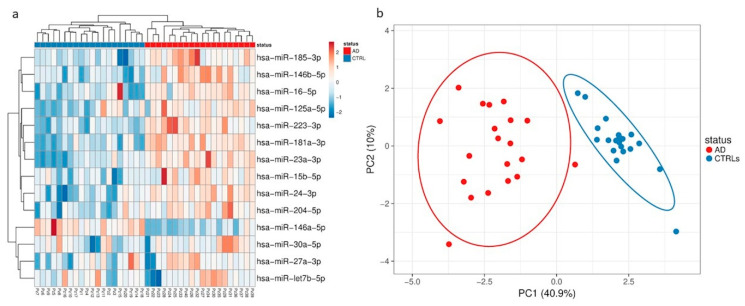
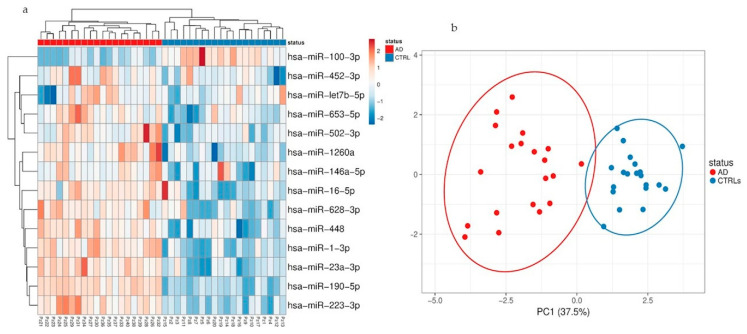
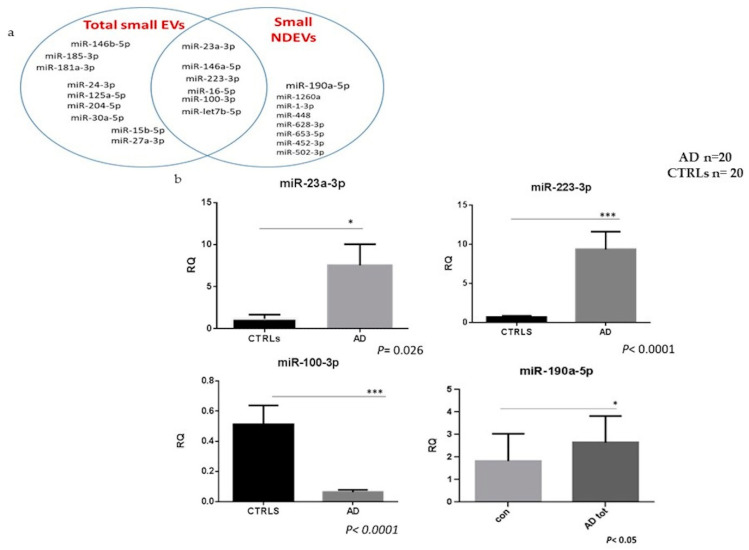
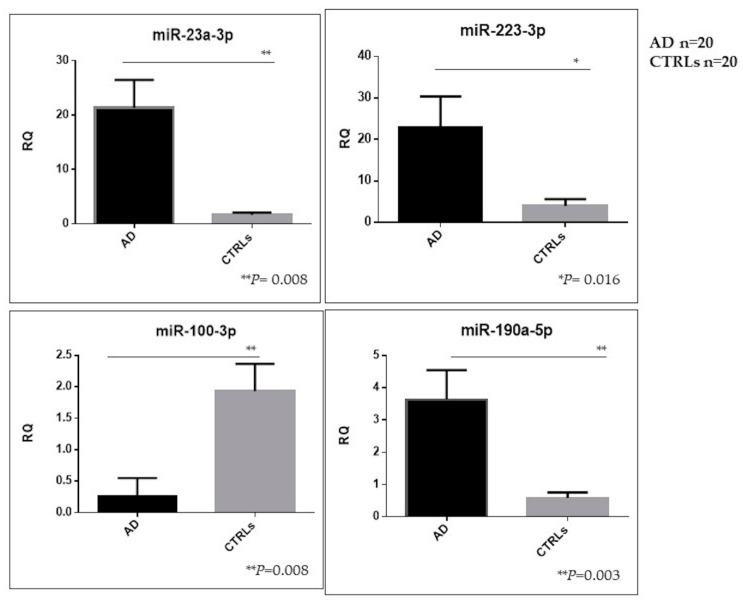
Small extracellular vesicles (EVs) are able to pass from the central nervous system (CNS) into peripheral blood and contain molecule markers of their parental origin. The aim of our study was to isolate and characterize total and neural-derived small EVs (NDEVs) and their micro RNA (miRNA) cargo in Alzheimer’s disease (AD) patients. Small NDEVs were isolated from plasma in a population consisting of 40 AD patients and 40 healthy subjects (CTRLs) using high throughput Advanced TaqMan miRNA OpenArrays®, which enables the simultaneous determination of 754 miRNAs. MiR-23a-3p, miR-223-3p, miR-100-3p and miR-190-5p showed a significant dysregulation in small NDEVs from AD patients as compared with controls (1.16 ± 0.49 versus 7.54 ± 2.5, p = 0.026; 9.32 ± 2.27 versus 0.66 ± 0.18, p <0.0001; 0.069 ± 0.01 versus 0.5 ± 0.1, p < 0.0001 and 2.9 ± 1.2 versus 1.93 ± 0.9, p < 0.05, respectively). A further validation analysis confirmed that miR-23a-3p, miR-223-3p and miR-190a-5p levels in small NDEVs from AD patients were significantly upregulated as compared with controls (p = 0.008; p = 0.016; p = 0.003, respectively) whereas miR-100-3p levels were significantly downregulated (p = 0.008). This is the first study that carries out the comparison between total plasma small EV population and NDEVs, demonstrating the presence of a specific AD NDEV miRNA signature.
Overview
The claims and statistics of this paper haven’t been checked yet.
Run the check — free, no account needed. It reads the open-access text and checks the sources it cites.
Integrity signals
Registry
Cites
Statistics
Figures
Verification
Claims the paper makes
The claims and statistics of this paper haven’t been checked yet.
Run the check — free, no account needed. It reads the open-access text and checks the sources it cites.
Claims other papers make about this one
Each is checked against this paper’s own text: does it say what the citing paper says it does?
In the citing paper
“Many miRNAs of EVs isolated from plasma are dysregulated in AD patients [79,85,86,87,88]”
From MicroRNAs in Extracellular Vesicles of Alzheimer’s Disease (2023) · cites this paper as [88]
Self-check
Percentages, sums and reported differences re-computed from the paper’s own numbers.
The self-check needs the paper’s full text.
Citations
Cites
Théry, C., Witwer, K. W., Aikawa, E., Alcaraz, M. J., Anderson, J. D., Andriantsitohaina, R., Antoniou, A., Arab, T., Archer, F., Atkin‐Smith, G. K., et al. (2018) · Journal of Extracellular Vesicles · doi:10.1080/20013078.2018.1535750 · Cited by 11,099
Fiandaca, M. S., Kapogiannis, D., Mapstone, M., Boxer, A., Eitan, E., Schwartz, J. B., Abner, E. L., Petersen, R. C., Federoff, H. J., Miller, B. L., et al. (2015) · Alzheimer's & Dementia · doi:10.1016/j.jalz.2014.06.008 · Cited by 959
Prada, I., Gabrielli, M., Turola, E., Iorio, A., D’Arrigo, G., Parolisi, R., De Luca, M., Pacifici, M., Bastoni, M., Lombardi, M., et al. (2018) · Acta Neuropathologica · doi:10.1007/s00401-017-1803-x · Cited by 312
Circulating miRNAs as Potential Biomarkers in Alzheimer's Disease
Galimberti, D., Villa, C., Fenoglio, C., Serpente, M., Ghezzi, L., Cioffi, S. M. G., Arighi, A., Fumagalli, G., & Scarpini, E. (2014) · Journal of Alzheimer’s Disease · doi:10.3233/jad-140756 · Cited by 222
Self-citation
Research works printed but not linked: 47
- Bennett, 2015, Epigenomics of Alzheimer’s disease, Transl. Res., 165, 200, 10.1016/j.trsl.2014.05.006 · DOI
- Dubois, 2014, Advancing research diagnostic criteria for Alzheimer’s disease: The IWG-2 criteria, Lancet Neurol., 13, 614, 10.1016/S1474-4422(14)70090-0 · DOI · Paper page
- Gurunathan, S., Kang, M.-H., Jeyaraj, M., Qasim, M., and Kim, J.-H. (2019). Review of the Isolation, Characterization, Biological Function, and Multifarious Therapeutic Approaches of Exosomes. Cells, 8. · DOI
- Herschlik, 2015, Emerging roles of exosomes in normal and pathological conditions: New insights for diagnosis and therapeutic applications, Front. Immunol., 6, 203
- Vella, L.J., Hill, A.F., and Cheng, L. (2016). Focus on Extracellular Vesicles: Exosomes and Their Role in Protein Trafficking and Biomarker Potential in Alzheimer’s and Parkinson’s Disease. Int. J. Mol. Sci., 17. · DOI
- Kapogiannis, 2015, Dysfunctionally phosphorylated type 1 insulin receptor substrate in neural-derived blood exosomes of preclinical Alzheimer’s disease, FASEB J., 29, 589, 10.1096/fj.14-262048 · DOI
- Goetzl, 2015, Altered lysosomal proteins in neural-derived plasma exosomes in preclinical Alzheimer disease, Neurology, 85, 40, 10.1212/WNL.0000000000001702 · DOI · Paper page
- Goetzl, 2015, Low neural exosomal levels of cellular survival factors in Alzheimer’s disease, Ann. Clin. Transl. Neurol., 2, 769, 10.1002/acn3.211 · DOI
- Badhwar, 2020, Biomarker potential of brain-secreted extracellular vesicles in blood in Alzheimer’s disease, Alzheimer’s Dement. Diagn. Assess. Dis. Monit., 12, e12001
- Lugli, G., Cohen, A.M., Bennett, D.A., Shah, R.C., Fields, C.J., Hernandez, A.G., and Smalheiser, N.R. (2015). Plasma Exosomal miRNAs in Persons with and without Alzheimer Disease: Altered Expression and Prospects for Biomarkers. PLoS ONE, 10. · DOI · Paper page
- Schneider, 2018, Downregulation of exosomal miR-204-5p and miR-632 as a biomarker for FTD: A GENFI study, J. Neurol. Neurosurg. Psychiatry, 89, 851, 10.1136/jnnp-2017-317492 · DOI · Paper page
- Wei, 2018, Serum Exosomal miR-223 Serves as a Potential Diagnostic and Prognostic Biomarker for Dementia, Neuroscience, 379, 167, 10.1016/j.neuroscience.2018.03.016 · DOI · Paper page
- Silvestro, S., Bramanti, P., and Mazzon, E. (2019). Role of miRNAs in Alzheimer’s Disease and Possible Fields of Application. Int. J. Mol. Sci., 20. · DOI
- Reddy, 2017, A critical evaluation of neuroprotective and neurodegenerative MicroRNAs in Alzheimer’s disease, Biochem. Biophys. Res. Commun., 483, 1156, 10.1016/j.bbrc.2016.08.067 · DOI · Paper page
- Sierksma, 2018, Deregulation of neuronal miRNAs induced by amyloid-β or TAU pathology, Mol. Neurodegener., 13, 54, 10.1186/s13024-018-0285-1 · DOI · Paper page
- Dehghani, 2018, MicroRNA in Alzheimer’s disease revisited: Implications for major neuropathological mechanisms, Rev. Neurosci., 29, 161, 10.1515/revneuro-2017-0042 · DOI
- 2019, A Systematic Review of MicroRNA Expression as Biomarker of Late-Onset Alzheimer’s Disease, Mol. Neurobiol., 56, 8376, 10.1007/s12035-019-01676-9 · DOI · Paper page
- Turchinovich, 2012, Extracellular miRNAs: The mystery of their origin and function, Trends Biochem. Sci., 37, 460, 10.1016/j.tibs.2012.08.003 · DOI
- Gallo, A., Tandon, M., Alevizos, I., and Illei, G.G. (2012). The majority of microRNAs detectable in serum and saliva is concentrated in exosomes. PLoS ONE, 7. · DOI · Paper page
- Vickers, 2011, MicroRNAs are transported in plasma and delivered to recipient cells by high-density lipoproteins, Nat. Cell Biol., 13, 423, 10.1038/ncb2210 · DOI · Paper page
- Chen, 2017, Potential Roles of Exosomal MicroRNAs as Diagnostic Biomarkers and Therapeutic Application in Alzheimer’s Disease, Neural Plast., 2017, 1
- Shurtleff, 2016, Y-box protein 1 is required to sort microRNAs into exosomes in cells and in a cell-free reaction, Elife, 5, 5003, 10.7554/eLife.19276 · DOI · Paper page
- Agarwal, 2015, Predicting effective microRNA target sites in mammalian mRNAs, Elife, 4, e05005, 10.7554/eLife.05005 · DOI · Paper page
- Vlachos, 2015, DIANA-miRPath v3.0: Deciphering microRNA function with experimental support, Nucleic Acids Res., 43, W460-6, 10.1093/nar/gkv403 · DOI
- Peinado, 2015, FunRich proteomics software analysis, let the fun begin!, Proteomics, 15, 2555, 10.1002/pmic.201500260 · DOI
- Priglinger, 2020, SVF-derived extracellular vesicles carry characteristic miRNAs in lipedema, Sci. Rep., 10, 1, 10.1038/s41598-020-64215-w · DOI
- Metsalu, 2015, ClustVis: A web tool for visualizing clustering of multivariate data using Principal Component Analysis and heatmap, Nucleic Acids Res., 43, W566, 10.1093/nar/gkv468 · DOI
- Andersen, 2004, Normalization of Real-Time Quantitative Reverse Transcription-PCR Data: A Model-Based Variance Estimation Approach to Identify Genes Suited for Normalization, Applied to Bladder and Colon Cancer Data Sets, Cancer Res., 64, 5245, 10.1158/0008-5472.CAN-04-0496 · DOI · Paper page
- Webber, J., and Clayton, A. (2013). How pure are your vesicles?. J. Extracell. Vesicles, 2. · DOI · Paper page
- Mitsuhashi, 2013, Aging enhances release of exosomal cytokine mRNAs by A1-42-stimulated macrophages, FASEB J., 27, 5141, 10.1096/fj.13-238980 · DOI
- Caradec, 2014, Reproducibility and efficiency of serum-derived exosome extraction methods, Clin. Biochem., 47, 1286, 10.1016/j.clinbiochem.2014.06.011 · DOI
- Yamada, 2012, Comparison of methods for isolating exosomes from bovine milk, J. Vet. Med. Sci., 74, 1523, 10.1292/jvms.12-0032 · DOI
- Park, 2020, The profiles of microRNAs from urinary extracellular vesicles (EVs) prepared by various isolation methods and their correlation with serum EV microRNAs, Diabetes Res. Clin. Pract., 160, 108010, 10.1016/j.diabres.2020.108010 · DOI
- Cha, 2019, miR-212 and miR-132 Are Downregulated in Neurally Derived Plasma Exosomes of Alzheimer’s Patients, Front. Neurosci., 13, 1208, 10.3389/fnins.2019.01208 · DOI · Paper page
- Pathan, 2019, Vesiclepedia 2019: A compendium of RNA, proteins, lipids and metabolites in extracellular vesicles, Nucleic Acids Res., 47, D516, 10.1093/nar/gky1029 · DOI
- Liu, 2019, EVmiRNA: A database of miRNA profiling in extracellular vesicles, Nucleic Acids Res., 47, D89, 10.1093/nar/gky985 · DOI
- Goda, 2016, Next-generation sequencing-based small RNA profiling of cerebrospinal fluid exosomes, Neurosci. Lett., 636, 48
- Jia, 2016, Downregulated serum miR-223 servers as biomarker in Alzheimer’s disease, Cell Biochem. Funct., 34, 233, 10.1002/cbf.3184 · DOI · Paper page
- Janas, 2015, Mechanisms of RNA loading into exosomes, FEBS Lett., 589, 1391, 10.1016/j.febslet.2015.04.036 · DOI
- Baixauli, 2014, Sorting it out: Regulation of exosome loading, Semin. Cancer Biol., 28, 3, 10.1016/j.semcancer.2014.04.009 · DOI
- Li, 2018, Exosomal cargo-loading and synthetic exosome-mimics as potential therapeutic tools, Acta Pharmacol. Sin., 39, 542, 10.1038/aps.2017.178 · DOI
- Ye, 2015, MicroRNAs 99b-5p/100-5p Regulated by Endoplasmic Reticulum Stress are Involved in Abeta-Induced Pathologies, Front. Aging Neurosci., 7, 210, 10.3389/fnagi.2015.00210 · DOI
- Zheng, 2012, Non-Coding RNAs Regulating Morphine Function: With Emphasis on the In vivo and In vitro Functions of miR-190, Front. Genet., 3, 113, 10.3389/fgene.2012.00113 · DOI
- Nuzziello, N., and Liguori, M. (2019). The MicroRNA Centrism in the Orchestration of Neuroinflammation in Neurodegenerative Diseases. Cells, 8. · DOI
- Mancuso, 2019, Circulatory miR-223-3p Discriminates Between Parkinson’s and Alzheimer’s Patients, Sci. Rep., 9, 9393, 10.1038/s41598-019-45687-x · DOI
- Cantoni, 2017, Mir-223 regulates the number and function of myeloid-derived suppressor cells in multiple sclerosis and experimental autoimmune encephalomyelitis, Acta Neuropathol., 133, 61, 10.1007/s00401-016-1621-6 · DOI · Paper page
- Ryan, B., Logan, B.J., Abraham, W.C., and Williams, J.M. (2017). MicroRNAs, miR-23a-3p and miR-151-3p, are regulated in dentate gyrus neuropil following induction of long-term potentiation in vivo. PLoS ONE, 12. · DOI · Paper page
Cited by
Sorted by citations
MicroRNAs in Extracellular Vesicles of Alzheimer’s Disease
Li, W., & Zheng, Y. (2023) · Cells · doi:10.3390/cells12101378 · Cited by 43
Wang, X., Yang, H., Liu, C., & Liu, K. (2023) · Frontiers in Molecular Neuroscience · doi:10.3389/fnmol.2023.1194210 · Cited by 36
Monteiro-Reis, S., Carvalho-Maia, C., Bart, G., Vainio, S. J., Pedro, J., Silva, E. R., Sales, G., Henrique, R., & Jerónimo, C. (2021) · International Journal of Molecular Sciences · doi:10.3390/ijms22063267 · Cited by 21
Metadata
- Authors
- Serpente, M., Fenoglio, C., D’Anca, M., Arcaro, M., Sorrentino, F., Visconte, C., Arighi, A., Fumagalli, G. G., Porretti, L., Cattaneo, A., Ciani, M., Zanardini, R., Benussi, L., Ghidoni, R., Scarpini, E., & Galimberti, D.
- Affiliations
- Department of Pathophysiology and Transplantation, Dino Ferrari Center, University of Milan, 20122 Milan, Italy
- Neurodegenerative Diseases Unit, Fondazione IRCCS Ca’ Granda, Ospedale Maggiore Policlinico, 20122 Milan, Italy
- Flow Cytometry Service, Fondazione IRCCS Ca’ Granda Ospedale Maggiore Policlinico, 20122 Milan, Italy
- Department of Transfusion Medicine and Haematology, Fondazione IRCCS Ca’ Granda Ospedale Maggiore Policlinico, 20122 Milan, Italy
- Molecular Markers Laboratory, IRCCS Istituto Centro San Giovanni di Dio Fatebenefratelli, 25125 Brescia, Italy
- ORCID
- Venue
- Cells
- Publisher
- MDPI AG
- Published
- 2020-06-10
- Volume
- 9
- Issue
- 6
- Pages
- 1443
- ISSN
- 2073-4409
- PMC
- PMC7349735
- Cited by
- 116
- References
- 4
- Language
- en
- Funders
- Ministero della Salute (RF-2018-12365333, NET- 2011-02346784)
About these checks
Registry, retraction, Cites and statistics results are computed, not judged, with one exception: a printed reference that no index lists is read once by a model before it counts as a citation error. Claims are extracted by a model and kept only when their quote appears verbatim in the text; each cited source is then checked, with a model’s help, for whether it says what the claim relies on. Those verdicts can be wrong — read the claim’s quote and the cited source before relying on one.
Statistics and arithmetic are recomputed, not judged.
Confidence bands are shown only for fields calibrated on our annotated test set. None is calibrated yet, so no band is shown.
What counts as a claim ›How we measure confidence ›How we check this ›
Are you an author, or do you see a problem with this page? Request a review
How to cite
Cite CoChat for the checks on this page, and the paper for its own findings.
- This page
- CoChat. (2026). Citation check: MiRNA Profiling in Plasma Neural-Derived Small Extracellular Vesicles from Patients with Alzheimer’s Disease. https://app.cochat.ai/papers/10.3390/cells9061443
- The paper
- Serpente, M., Fenoglio, C., D’Anca, M., Arcaro, M., Sorrentino, F., Visconte, C., Arighi, A., Fumagalli, G. G., Porretti, L., Cattaneo, A., Ciani, M., Zanardini, R., Benussi, L., Ghidoni, R., Scarpini, E., & Galimberti, D. (2020). MiRNA Profiling in Plasma Neural-Derived Small Extracellular Vesicles from Patients with Alzheimer’s Disease. Cells. https://doi.org/10.3390/cells9061443
