

The DOI matches its Crossref record; 40 of the 43 references it cites were found in a registry or an index; none of the 106 sources its claims cite is checked for support yet.
Prevalence of Sedentary Behavior in Older Adults: A Systematic Review
Open accessAbstract
Sedentary behavior is a cluster of behaviors adopted in a sitting or lying posture where little energy is being expended. Sedentary behavior is a risk factor for health independent to inactivity. Currently, there are no published systematic reviews on the prevalence of sedentary behavior objectively measured in, or subjectively reported by, older adults. The aim of this systematic review was to collect and analyze published literature relating to reported prevalence of sedentary behavior, written in English, on human adults, where subjects aged 60 years and over were represented in the study. 23 reports covered data from 18 surveys sourced from seven countries. It was noted that sedentary behavior is defined in different ways by each survey. The majority of surveys included used self-report as a measurement of sedentary behavior. Objective measurements were also captured with the use of body worn accelerometers. Whether measurements are subjective or objective, the majority of older adults are sedentary. Almost 60% of older adult’s reported sitting for more than 4 h per day, 65% sit in front of a screen for more than 3 h daily and over 55% report watching more than 2 h of TV. However, when measured objectively in a small survey, it was found that 67% of the older population were sedentary for more than 8.5 h daily.
Overview
AI snapshot
Written from the paper’s full text.
TL;DR
This systematic review synthesizes 23 reports from 18 surveys in seven countries and finds sedentary behavior highly prevalent in older adults, with about 59% reporting >4 h/day sitting and 67% objectively sedentary >8.5 h/day in one small accelerometry study. Measurement heterogeneity and self-report limitations constrain comparability across surveys.
Key findings
- Across seven sitting surveys (N = 372,550 older adults), meta-prevalence was 58.9% sitting >4 h/day, 26.6% >6 h/day, and 5.0% >10 h/day; 78% reported >3 h/day versus 22% <3 h/day.
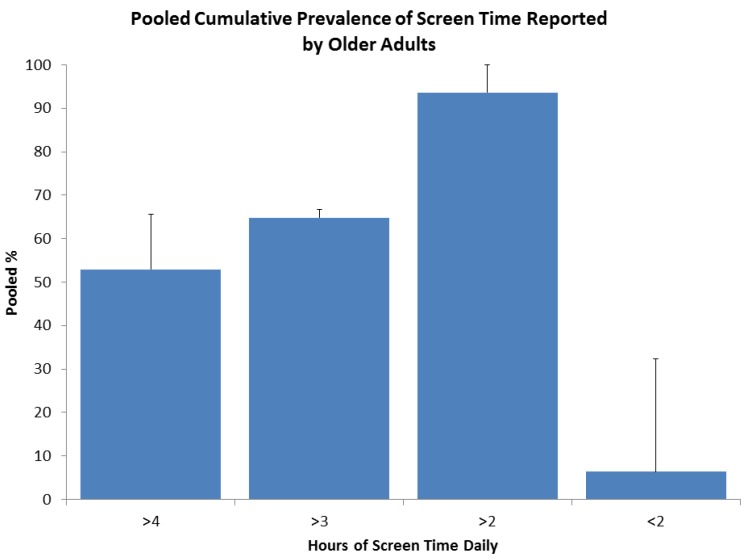
- TV viewing meta-prevalence from nine surveys (N = 275,344) was 56% >2 h/day, 54.2% >3 h/day, and 15.1% >4 h/day; screen-time meta-prevalence from three studies (N = 105,424) was 52.9% >4 h/day and 93.6% >2 h/day.
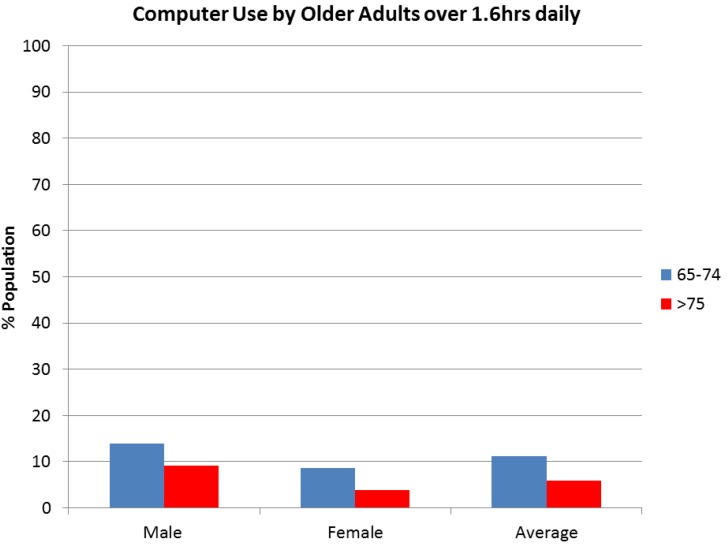
- Computer use was reported by 64.6% of UK older adults, but fewer than 10% of Canadian older adults used a computer for more than 1.6 h daily; use was higher in younger older adults and males.
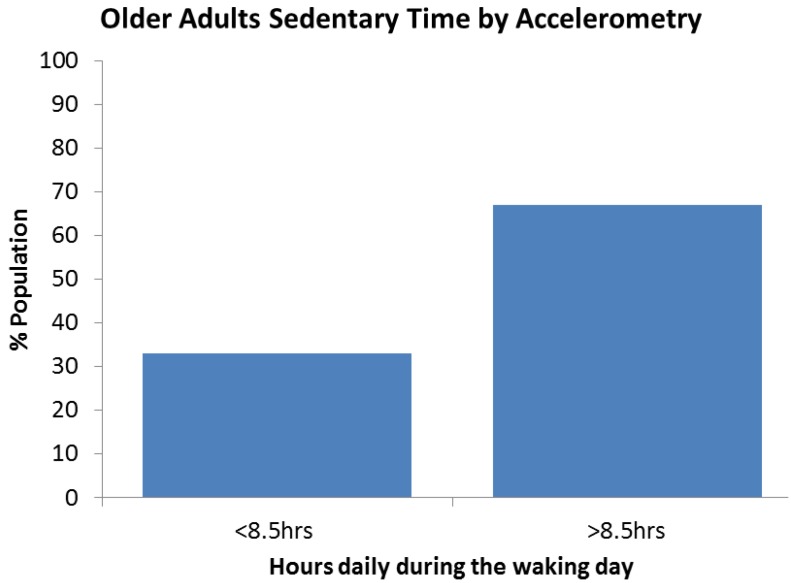
- Objective accelerometry in 649 English older adults found 67% sedentary for more than 8.5 h of the waking day, with only 33% below that threshold; gender differences were small, and sedentary time increased slightly over age 75 except for computer use.
Methods
- Systematic review with electronic searches of AMED, CINAHL, and Medline in August 2013, plus manual journal searches, reference-list checks, and author contact; inclusion required English-language scholarly papers on human adults with participants aged 60+, prevalence of sedentary behavior as a defined outcome, >200 subjects, and at least one day of recording.
- The search returned 2,343 papers; after duplicates, 2,078 were reviewed, with 1,864 excluded by title, 113 by abstract, and 82 by full text, leaving 19 papers; additional data and manual searching yielded 23 reports from 18 surveys in seven countries, covering over 500,000 older adults.
- Data were converted to hours/day where needed, and prevalence data were pooled into meta-prevalence using the inverse variance method for sitting (7/9 surveys), TV viewing (9/10 surveys), and screen time (3 studies); computer use and accelerometry data were not pooled.
Limitations
- The paper states that inverse variance meta-prevalence has limitations for very high and very low prevalence, tending to overestimate weights for such categories, and that pooled studies used different prevalence categories, so weighting may have been underestimated for some larger time categories.
- The paper states that accelerometry data came from a single study of 649 older adults in one country and may not be generalizable; it also notes that the accelerometer measured lack of activity counts as sedentary rather than sitting, potentially including standing time.
- The paper states that self-report measures have poor accuracy and can underestimate relationships, and the text makes evident that sedentary behavior definitions were not standardized until 2012, most surveys used self-report, and specific data on the oldest old were limited.
Model-written summary. Check it against the paper before relying on it.
Integrity signals
Registry
Cites
Statistics
Figures
Verification
Claims the paper makes
47 Not checked yet · 26 Own result · 7 Own interpretation · 4 No basis given · 3 Own method
A result the paper reports from its own data — it cites no other source for it, so there is none to check. The quote shows it is in the paper.
In the paper
“Objective measurements were also captured with the use of body worn accelerometers.”
§ Prevalence of Sedentary Behavior in Older Adults: A Systematic Review > Abstract
plain- Asserted: passes — The authors put it forward as true.
- Checkable: passes — It can be checked against evidence.
- Load-bearing: unclear — It is unclear whether the paper’s conclusions depend on it.
- Based: passes — The paper gives a reason why it holds.
A result the paper reports from its own data — it cites no other source for it, so there is none to check. The quote shows it is in the paper.
In the paper
“over 55% report watching more than 2 h of TV”
§ Prevalence of Sedentary Behavior in Older Adults: A Systematic Review > Abstract
plain- Asserted: passes — The authors put it forward as true.
- Checkable: passes — It can be checked against evidence.
- Load-bearing: unclear — It is unclear whether the paper’s conclusions depend on it.
- Based: passes — The paper gives a reason why it holds.
A result the paper reports from its own data — it cites no other source for it, so there is none to check. The quote shows it is in the paper.
In the paper
“However, when measured objectively in a small survey, it was found that 67% of the older population were sedentary for more than 8.5 h daily.”
§ Prevalence of Sedentary Behavior in Older Adults: A Systematic Review > Abstract
plain- Asserted: passes — The authors put it forward as true.
- Checkable: passes — It can be checked against evidence.
- Load-bearing: unclear — It is unclear whether the paper’s conclusions depend on it.
- Based: passes — The paper gives a reason why it holds.
A result the paper reports from its own data — it cites no other source for it, so there is none to check. The quote shows it is in the paper.
In the paper
“Almost 60% of older adult’s reported sitting for more than 4 h per day”
§ Prevalence of Sedentary Behavior in Older Adults: A Systematic Review > Abstract
plain- Asserted: passes — The authors put it forward as true.
- Checkable: passes — It can be checked against evidence.
- Load-bearing: passes — The paper’s conclusions depend on it.
- Based: passes — The paper gives a reason why it holds.
A result the paper reports from its own data — it cites no other source for it, so there is none to check. The quote shows it is in the paper.
In the paper
“The majority of surveys included used self-report as a measurement of sedentary behavior.”
§ Prevalence of Sedentary Behavior in Older Adults: A Systematic Review > Abstract
plain- Asserted: passes — The authors put it forward as true.
- Checkable: passes — It can be checked against evidence.
- Load-bearing: unclear — It is unclear whether the paper’s conclusions depend on it.
- Based: passes — The paper gives a reason why it holds.
A result the paper reports from its own data — it cites no other source for it, so there is none to check. The quote shows it is in the paper.
In the paper
“65% sit in front of a screen for more than 3 h daily”
§ Prevalence of Sedentary Behavior in Older Adults: A Systematic Review > Abstract
plain- Asserted: passes — The authors put it forward as true.
- Checkable: passes — It can be checked against evidence.
- Load-bearing: unclear — It is unclear whether the paper’s conclusions depend on it.
- Based: passes — The paper gives a reason why it holds.
None of the sources cited for this claim have been checked yet.
In the paper
“It would appear there is little difference in report by gender (1.6 ± 1.6%) [3,17,18].”
§ Prevalence of Sedentary Behavior in Older Adults: A Systematic Review > 3. Results > 3.4. Findings on Prevalence of Sedentary Behavior in Older Adults
What the sources say
- Not checked yetcites [3] Dogra, S., and Stathokostas, L. (2012). Sedentary behavior and physical activity are independent predictors of successful aging in middle-aged and older adults. J. Aging Res. source
- Not checked yetcites [17] Dunstan, 2010, Television viewing time and mortality: The Australian diabetes, obesity and lifestyle study (AusDiab), Circulation source
- Not checked yetcites [18] Banks, 2011, Screen-time, obesity, ageing and disability: Findings from 91,266 participants in the 45 and up study, Public Health Nutr. source
hedged- Asserted: passes — The authors put it forward as true.
- Checkable: passes — It can be checked against evidence.
- Load-bearing: unclear — It is unclear whether the paper’s conclusions depend on it.
- Based: passes — The paper gives a reason why it holds.
A result the paper reports from its own data — it cites no other source for it, so there is none to check. The quote shows it is in the paper.
In the paper
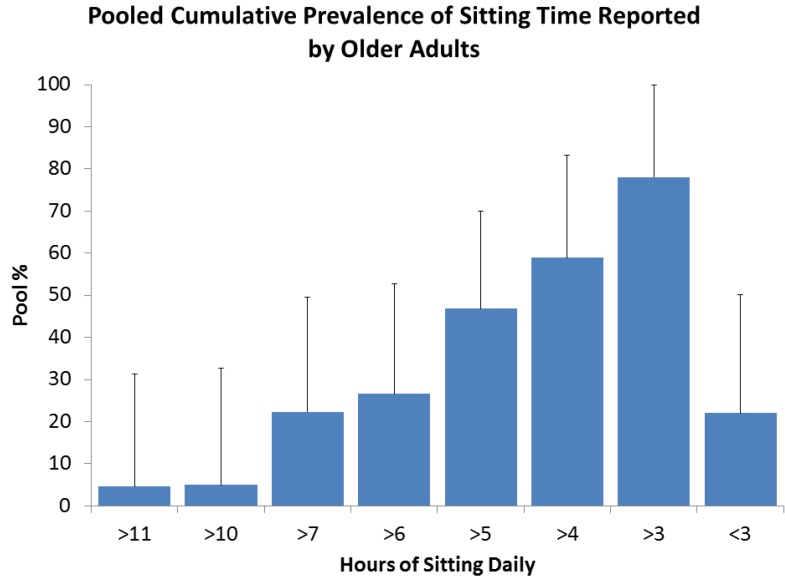
“On average across the studies, 58.9% of older adults reported sitting for over 4 h, 26.6% reported over 6 h and 5.0% reported over 10 h per day.”
§ Prevalence of Sedentary Behavior in Older Adults: A Systematic Review > 3. Results > 3.4. Findings on Prevalence of Sedentary Behavior in Older Adults
plain- Asserted: passes — The authors put it forward as true.
- Checkable: passes — It can be checked against evidence.
- Load-bearing: passes — The paper’s conclusions depend on it.
- Based: passes — The paper gives a reason why it holds.
A result the paper reports from its own data — it cites no other source for it, so there is none to check. The quote shows it is in the paper.
In the paper
“On average across the studies, 58.9% of older adults reported sitting for over 4 h, 26.6% reported over 6 h and 5.0% reported over 10 h per day.”
§ Prevalence of Sedentary Behavior in Older Adults: A Systematic Review > 3. Results > 3.4. Findings on Prevalence of Sedentary Behavior in Older Adults
plain- Asserted: passes — The authors put it forward as true.
- Checkable: passes — It can be checked against evidence.
- Load-bearing: unclear — It is unclear whether the paper’s conclusions depend on it.
- Based: passes — The paper gives a reason why it holds.
None of the sources cited for this claim have been checked yet.
In the paper
“These results were obtained for a total population of 372,550 compiled from seven surveys covering six countries (Australia, Canada, Norway, Spain, UK and USA) [3,17,18,24,25,27,33].”
§ Prevalence of Sedentary Behavior in Older Adults: A Systematic Review > 3. Results > 3.4. Findings on Prevalence of Sedentary Behavior in Older Adults
What the sources say
- Not checked yetcites [3] Dogra, S., and Stathokostas, L. (2012). Sedentary behavior and physical activity are independent predictors of successful aging in middle-aged and older adults. J. Aging Res. source
- Not checked yetcites [17] Dunstan, 2010, Television viewing time and mortality: The Australian diabetes, obesity and lifestyle study (AusDiab), Circulation source
- Not checked yetcites [18] Banks, 2011, Screen-time, obesity, ageing and disability: Findings from 91,266 participants in the 45 and up study, Public Health Nutr. source
- Not checked yetcites [24] Chau, J.Y., Grunseit, A., Midthjell, K., Holmen, J, Holmen, T.L., Bauman, A.E., and van der Ploeg, H.P. (2013). Sedentary behaviour and risk of mortality from all-causes and cardiometabolic diseases in adults: Evidence from the HUNT3 population cohort. Br. J. Sports Med. source
- Not checked yetcites [25] Balboa-Castillo, T., León-Muñoz, L.M., Graciani, A., Rodríguez-Artalejo, F., and Guallar-Castillón, P. (2011). Longitudinal association of physical activity and sedentary behavior during leisure time with health-related quality of life in community-dwelling older adults. Health Qual. Life Outcomes, 9. source
- Not checked yetcites [27] Stamatakis, 2012, Associations between multiple indicators of objectively-measured and self-reported sedentary behaviour and cardiometabolic risk in older adults, Prev. Med. source
- Not checked yetcites [33] Matthews, 2012, Amount of time spent in sedentary behaviors and cause-specific mortality in US adults, Am. J. Clin. Nutr. source
plainn = 372,550- Asserted: passes — The authors put it forward as true.
- Checkable: passes — It can be checked against evidence.
- Load-bearing: passes — The paper’s conclusions depend on it.
- Based: passes — The paper gives a reason why it holds.
- It may state two separate claims as one. 20
- Probably not a substantial claim. 17
A result the paper reports from its own data — it cites no other source for it, so there is none to check. The quote shows it is in the paper.
In the paper
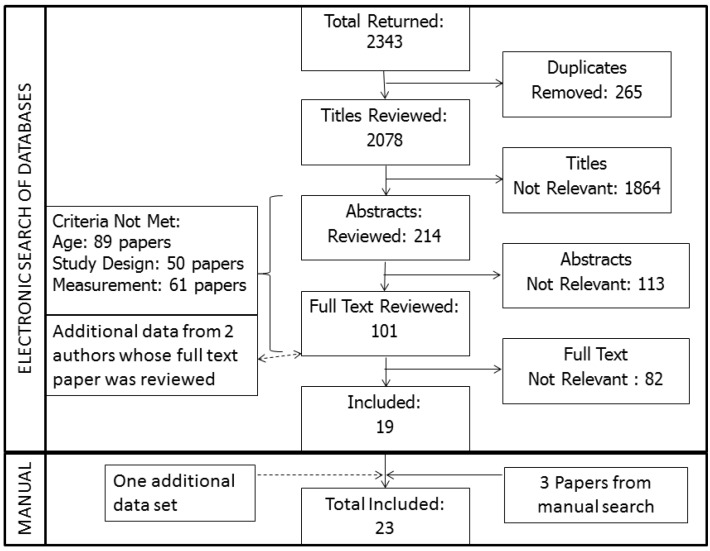
“23 reports covered data from 18 surveys sourced from seven countries.”
- Also stated in: § 3.1. Selection Process Results · plain
“The process of the review resulted in 23 reports of prevalence of sedentary behavior in older adults as illustrated in Figure 1.”
§ Prevalence of Sedentary Behavior in Older Adults: A Systematic Review > Abstract
plain- Asserted: passes — The authors put it forward as true.
- Checkable: passes — It can be checked against evidence.
- Load-bearing: unclear — It is unclear whether the paper’s conclusions depend on it.
- Based: passes — The paper gives a reason why it holds.
It may state two separate claims as one.
- Also stated in: § 3.1. Selection Process Results · plain
A result the paper reports from its own data — it cites no other source for it, so there is none to check. The quote shows it is in the paper.
In the paper
“For TV viewing time data were pooled from 9/10 surveys.”
§ Prevalence of Sedentary Behavior in Older Adults: A Systematic Review > 2. Experimental Section > 2.3. Methods of Data Presentation
plain- Asserted: passes — The authors put it forward as true.
- Checkable: passes — It can be checked against evidence.
- Load-bearing: fails — The paper’s conclusions may not depend on it.
- Based: passes — The paper gives a reason why it holds.
Probably not a substantial claim. The paper’s conclusions may not depend on it.
The paper states this without a source or data behind it here, so there is nothing to check it against. The quote shows it is in the paper.
In the paper
“Some papers included older adults as a group within a larger scale population study; some were specifically designed to describe the behavior of the older population.”
§ Prevalence of Sedentary Behavior in Older Adults: A Systematic Review > 2. Experimental Section > 2.3. Methods of Data Presentation
plain- Asserted: passes — The authors put it forward as true.
- Checkable: passes — It can be checked against evidence.
- Load-bearing: fails — The paper’s conclusions may not depend on it.
- Based: passes — The paper gives a reason why it holds.
Probably not a substantial claim. The paper’s conclusions may not depend on it. It may state two separate claims as one.
A result the paper reports from its own data — it cites no other source for it, so there is none to check. The quote shows it is in the paper.
In the paper
“There is not a consistent definition of older adults in the included papers.”
§ Prevalence of Sedentary Behavior in Older Adults: A Systematic Review > 2. Experimental Section > 2.3. Methods of Data Presentation
plain- Asserted: passes — The authors put it forward as true.
- Checkable: passes — It can be checked against evidence.
- Load-bearing: passes — The paper’s conclusions depend on it.
- Based: passes — The paper gives a reason why it holds.
Probably not a substantial claim.
A result the paper reports from its own data — it cites no other source for it, so there is none to check. The quote shows it is in the paper.
In the paper
“For total sitting time, the data were pooled from 7/9 surveys.”
§ Prevalence of Sedentary Behavior in Older Adults: A Systematic Review > 2. Experimental Section > 2.3. Methods of Data Presentation
plain- Asserted: passes — The authors put it forward as true.
- Checkable: passes — It can be checked against evidence.
- Load-bearing: fails — The paper’s conclusions may not depend on it.
- Based: passes — The paper gives a reason why it holds.
Probably not a substantial claim. The paper’s conclusions may not depend on it.
The paper states this without a source or data behind it here, so there is nothing to check it against. The quote shows it is in the paper.
In the paper
“Over 60 years and over 65 years are the most frequently occurring definitions.”
§ Prevalence of Sedentary Behavior in Older Adults: A Systematic Review > 2. Experimental Section > 2.3. Methods of Data Presentation
plain- Asserted: passes — The authors put it forward as true.
- Checkable: passes — It can be checked against evidence.
- Load-bearing: fails — The paper’s conclusions may not depend on it.
- Based: passes — The paper gives a reason why it holds.
Probably not a substantial claim. The paper’s conclusions may not depend on it.
The paper states this without a source or data behind it here, so there is nothing to check it against. The quote shows it is in the paper.
In the paper
“In this age group there was little difference in results whether the participants’ were asked to report weekday sitting and weekend sitting.”
§ Prevalence of Sedentary Behavior in Older Adults: A Systematic Review > 2. Experimental Section > 2.3. Methods of Data Presentation
plain- Asserted: passes — The authors put it forward as true.
- Checkable: passes — It can be checked against evidence.
- Load-bearing: fails — The paper’s conclusions may not depend on it.
- Based: fails — The paper may give no reason why it holds.
Probably not a substantial claim. The paper’s conclusions may not depend on it. The paper may give no reason why it holds.
The paper states this without a source or data behind it here, so there is nothing to check it against. The quote shows it is in the paper.
In the paper
“It was noted that sedentary behavior is defined in different ways by each survey.”
- Also stated in: § 2.3. Methods of Data Presentation · plain
“Different measurement methods and categorizations were used to define sedentary behavior in the included studies.”
§ Prevalence of Sedentary Behavior in Older Adults: A Systematic Review > Abstract
plain- Asserted: passes — The authors put it forward as true.
- Checkable: passes — It can be checked against evidence.
- Load-bearing: passes — The paper’s conclusions depend on it.
- Based: passes — The paper gives a reason why it holds.
Probably not a substantial claim.
- Also stated in: § 2.3. Methods of Data Presentation · plain
A result the paper reports from its own data — it cites no other source for it, so there is none to check. The quote shows it is in the paper.
In the paper
“Figure 3 Meta-Prevalence of sitting, N = 372,550 older adults, n = 7 from six countries, note time categories of <3 h (22%) and >3 h (78%) is equal to 100%.”
§ Prevalence of Sedentary Behavior in Older Adults: A Systematic Review > 3. Results > 3.4. Findings on Prevalence of Sedentary Behavior in Older Adults
plainn = 372,550- Asserted: passes — The authors put it forward as true.
- Checkable: passes — It can be checked against evidence.
- Load-bearing: passes — The paper’s conclusions depend on it.
- Based: passes — The paper gives a reason why it holds.
It may state two separate claims as one.
A result the paper reports from its own data — it cites no other source for it, so there is none to check. The quote shows it is in the paper.
In the paper
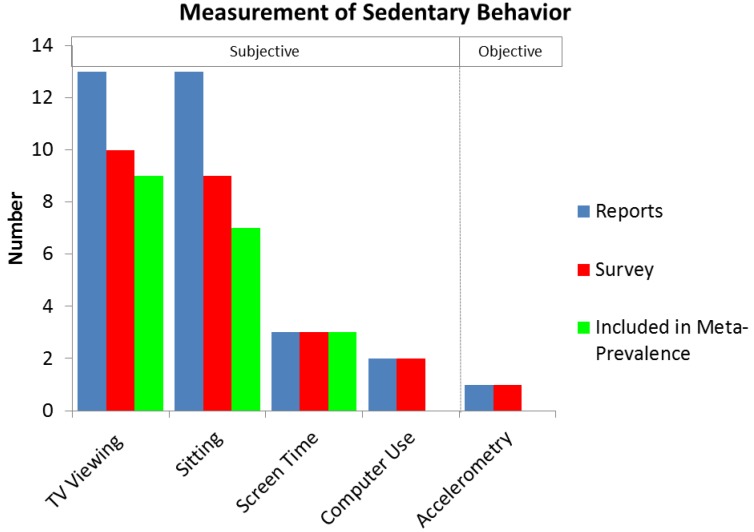
“Two surveys covered two surveys on computer use and one paper covered 1 survey on accelerometry.”
§ Prevalence of Sedentary Behavior in Older Adults: A Systematic Review > 3. Results > 3.2. Information Sources
plain- Asserted: passes — The authors put it forward as true.
- Checkable: passes — It can be checked against evidence.
- Load-bearing: fails — The paper’s conclusions may not depend on it.
- Based: passes — The paper gives a reason why it holds.
Probably not a substantial claim. The paper’s conclusions may not depend on it. It may state two separate claims as one.
A result the paper reports from its own data — it cites no other source for it, so there is none to check. The quote shows it is in the paper.
In the paper
“Screen time data was pooled from 3 studies for meta-prevalence.”
§ Prevalence of Sedentary Behavior in Older Adults: A Systematic Review > 2. Experimental Section > 2.3. Methods of Data Presentation
plain- Asserted: passes — The authors put it forward as true.
- Checkable: passes — It can be checked against evidence.
- Load-bearing: fails — The paper’s conclusions may not depend on it.
- Based: passes — The paper gives a reason why it holds.
Probably not a substantial claim. The paper’s conclusions may not depend on it.
A result the paper reports from its own data — it cites no other source for it, so there is none to check. The quote shows it is in the paper.
In the paper
“The title review excluded 1,864 papers, the abstract review excluded 113 and the full text excluded 82, leaving 19 papers to be included for the study.”
§ Prevalence of Sedentary Behavior in Older Adults: A Systematic Review > 3. Results > 3.1. Selection Process Results
plain- Asserted: passes — The authors put it forward as true.
- Checkable: passes — It can be checked against evidence.
- Load-bearing: fails — The paper’s conclusions may not depend on it.
- Based: passes — The paper gives a reason why it holds.
Probably not a substantial claim. The paper’s conclusions may not depend on it. It may state two separate claims as one.
A result the paper reports from its own data — it cites no other source for it, so there is none to check. The quote shows it is in the paper.
In the paper
“There was not sufficient data to carry out inverse variance on computer use or sedentary time by accelerometry, so they are presented and described as per the papers.”
§ Prevalence of Sedentary Behavior in Older Adults: A Systematic Review > 2. Experimental Section > 2.3. Methods of Data Presentation
plain- Asserted: passes — The authors put it forward as true.
- Checkable: passes — It can be checked against evidence.
- Load-bearing: fails — The paper’s conclusions may not depend on it.
- Based: passes — The paper gives a reason why it holds.
Probably not a substantial claim. The paper’s conclusions may not depend on it.
None of the sources cited for this claim have been checked yet.
In the paper
“On average 61.5% females reported more than 4 h of sitting compared to males at 63.5% [3,17,18].”
§ Prevalence of Sedentary Behavior in Older Adults: A Systematic Review > 3. Results > 3.4. Findings on Prevalence of Sedentary Behavior in Older Adults
What the sources say
- Not checked yetcites [3] Dogra, S., and Stathokostas, L. (2012). Sedentary behavior and physical activity are independent predictors of successful aging in middle-aged and older adults. J. Aging Res. source
- Not checked yetcites [17] Dunstan, 2010, Television viewing time and mortality: The Australian diabetes, obesity and lifestyle study (AusDiab), Circulation source
- Not checked yetcites [18] Banks, 2011, Screen-time, obesity, ageing and disability: Findings from 91,266 participants in the 45 and up study, Public Health Nutr. source
plain- Asserted: passes — The authors put it forward as true.
- Checkable: passes — It can be checked against evidence.
- Load-bearing: unclear — It is unclear whether the paper’s conclusions depend on it.
- Based: passes — The paper gives a reason why it holds.
It may state two separate claims as one.
A result the paper reports from its own data — it cites no other source for it, so there is none to check. The quote shows it is in the paper.
In the paper
“The electronic search returned a total of 2,343 papers (Medline: 732; AMED: 722; CINAHL: 888).”
§ Prevalence of Sedentary Behavior in Older Adults: A Systematic Review > 3. Results > 3.1. Selection Process Results
plain- Asserted: passes — The authors put it forward as true.
- Checkable: passes — It can be checked against evidence.
- Load-bearing: fails — The paper’s conclusions may not depend on it.
- Based: passes — The paper gives a reason why it holds.
Probably not a substantial claim. The paper’s conclusions may not depend on it.
A result the paper reports from its own data — it cites no other source for it, so there is none to check. The quote shows it is in the paper.
In the paper
“With TV viewing 13 papers, covering 10 surveys, nine of which were included in the meta-prevalence.”
§ Prevalence of Sedentary Behavior in Older Adults: A Systematic Review > 3. Results > 3.2. Information Sources
plain- Asserted: passes — The authors put it forward as true.
- Checkable: passes — It can be checked against evidence.
- Load-bearing: unclear — It is unclear whether the paper’s conclusions depend on it.
- Based: passes — The paper gives a reason why it holds.
It may state two separate claims as one.
A result the paper reports from its own data — it cites no other source for it, so there is none to check. The quote shows it is in the paper.
In the paper
“As can be seen from Figure 2, there were 13 papers on sitting, covering nine surveys with seven studies used for the meta-prevalence.”
§ Prevalence of Sedentary Behavior in Older Adults: A Systematic Review > 3. Results > 3.2. Information Sources
plain- Asserted: passes — The authors put it forward as true.
- Checkable: passes — It can be checked against evidence.
- Load-bearing: unclear — It is unclear whether the paper’s conclusions depend on it.
- Based: passes — The paper gives a reason why it holds.
It may state two separate claims as one.
A result the paper reports from its own data — it cites no other source for it, so there is none to check. The quote shows it is in the paper.
In the paper
“After removal of duplicated papers, 2,078 papers were reviewed.”
§ Prevalence of Sedentary Behavior in Older Adults: A Systematic Review > 3. Results > 3.1. Selection Process Results
plain- Asserted: passes — The authors put it forward as true.
- Checkable: passes — It can be checked against evidence.
- Load-bearing: fails — The paper’s conclusions may not depend on it.
- Based: passes — The paper gives a reason why it holds.
Probably not a substantial claim. The paper’s conclusions may not depend on it.
A result the paper reports from its own data — it cites no other source for it, so there is none to check. The quote shows it is in the paper.
In the paper
“Three papers covered three studies, all of which were included in the meta-prevalence for screen time.”
§ Prevalence of Sedentary Behavior in Older Adults: A Systematic Review > 3. Results > 3.2. Information Sources
plain- Asserted: passes — The authors put it forward as true.
- Checkable: passes — It can be checked against evidence.
- Load-bearing: fails — The paper’s conclusions may not depend on it.
- Based: passes — The paper gives a reason why it holds.
Probably not a substantial claim. The paper’s conclusions may not depend on it. It may state two separate claims as one.
In the paper
“This method had been used in several papers and shown to have good reliability as a criterion measure [13].”
§ Prevalence of Sedentary Behavior in Older Adults: A Systematic Review > 2. Experimental Section > 2.3. Methods of Data Presentation
What the sources say
- Not checked yetcites [13] Salmon, 2003, Physical activity and sedentary behavior: A population-based study of barriers, enjoyment, and preference, Health Psychol. source
plain- Asserted: passes — The authors put it forward as true.
- Checkable: passes — It can be checked against evidence.
- Load-bearing: passes — The paper’s conclusions depend on it.
- Based: passes — The paper gives a reason why it holds.
It may state two separate claims as one.
None of the sources cited for this claim have been checked yet.
In the paper
“Recently, an emergence of research in sedentary behavior (SB) has indicated that SB is an independent health risk factor, separate to lack of PA, associated with successful aging, morbidity and mortality [2,3,4].”
- Also stated in: § Abstract · plain
“Sedentary behavior is a risk factor for health independent to inactivity.”
§ Prevalence of Sedentary Behavior in Older Adults: A Systematic Review > 1. Introduction
What the sources say
- Not checked yetcites [2] Katzmarzyk, 2010, Physical activity, sedentary behavior, and health: Paradigm paralysis or paradigm shift?, Diabetes source
- Not checked yetcites [3] Dogra, S., and Stathokostas, L. (2012). Sedentary behavior and physical activity are independent predictors of successful aging in middle-aged and older adults. J. Aging Res. source
- Not checked yetcites [4] Thorp, 2011, Sedentary behaviors and subsequent health outcomes in adults, Am. J. Prev. Med. source
plaincorrelational- Asserted: passes — The authors put it forward as true.
- Checkable: passes — It can be checked against evidence.
- Load-bearing: passes — The paper’s conclusions depend on it.
- Based: passes — The paper gives a reason why it holds.
It may state two separate claims as one.
- Also stated in: § Abstract · plain
What the paper did — it cites no source for this, so there is none to check. The quote shows it is in the paper.
In the paper
“Where conflicting opinions arose with regard to the inclusion decision the paper was included to the next phase for further consideration and excluded when there was agreement on the inclusion of said paper.”
§ Prevalence of Sedentary Behavior in Older Adults: A Systematic Review > 2. Experimental Section > 2.2. Inclusion and Exclusion Criteria
plaindirect- Asserted: passes — The authors put it forward as true.
- Checkable: passes — It can be checked against evidence.
- Load-bearing: fails — The paper’s conclusions may not depend on it.
- Based: passes — The paper gives a reason why it holds.
Probably not a substantial claim. The paper’s conclusions may not depend on it. It may state two separate claims as one.
What the paper did — it cites no source for this, so there is none to check. The quote shows it is in the paper.
In the paper
“The papers were reviewed by three independent researchers using inclusion and exclusion criteria (Table 1).”
§ Prevalence of Sedentary Behavior in Older Adults: A Systematic Review > 2. Experimental Section > 2.2. Inclusion and Exclusion Criteria
plain- Asserted: passes — The authors put it forward as true.
- Checkable: passes — It can be checked against evidence.
- Load-bearing: fails — The paper’s conclusions may not depend on it.
- Based: passes — The paper gives a reason why it holds.
Probably not a substantial claim. The paper’s conclusions may not depend on it.
In the paper
“The accelerometer employed in this case measures lack of counts of activity as sedentary, rather than sitting, thus there could potentially be some standing time included in this sedentary data.”
§ Prevalence of Sedentary Behavior in Older Adults: A Systematic Review > 4. Discussion > 4.3. Measurement of Sedentary Behavior in Surveys
What the sources say
- Not checked yetcites [27] Stamatakis, 2012, Associations between multiple indicators of objectively-measured and self-reported sedentary behaviour and cardiometabolic risk in older adults, Prev. Med. source
hedgedconditional- Asserted: passes — The authors put it forward as true.
- Checkable: passes — It can be checked against evidence.
- Load-bearing: unclear — It is unclear whether the paper’s conclusions depend on it.
- Based: passes — The paper gives a reason why it holds.
It may state two separate claims as one.
In the paper
“The accelerometry data for older adults was based on a study of 649 and a single country, therefore perhaps not generalizable to the population.”
§ Prevalence of Sedentary Behavior in Older Adults: A Systematic Review > 4. Discussion > 4.4. Limitations
What the sources say
- Not checked yetcites [27] Stamatakis, 2012, Associations between multiple indicators of objectively-measured and self-reported sedentary behaviour and cardiometabolic risk in older adults, Prev. Med. source
hedgedconditional- Asserted: passes — The authors put it forward as true.
- Checkable: passes — It can be checked against evidence.
- Load-bearing: unclear — It is unclear whether the paper’s conclusions depend on it.
- Based: passes — The paper gives a reason why it holds.
It may state two separate claims as one.
In the paper
“Younger older adults use computers more than those over 74 years and the activity is more favored by males.”
§ Prevalence of Sedentary Behavior in Older Adults: A Systematic Review > 3. Results > 3.4. Findings on Prevalence of Sedentary Behavior in Older Adults
What the sources say
- Not checked yetcites [21] Shields, 2008, Screen time among Canadian adults: A profile, Health Rep.
plaincorrelationaln = 6,742- Asserted: passes — The authors put it forward as true.
- Checkable: passes — It can be checked against evidence.
- Load-bearing: unclear — It is unclear whether the paper’s conclusions depend on it.
- Based: passes — The paper gives a reason why it holds.
It may state two separate claims as one.
None of the sources cited for this claim have been checked yet.
In the paper
“Those individuals who are less sedentary tend to age more successfully and report better quality of life [3,25].”
§ Prevalence of Sedentary Behavior in Older Adults: A Systematic Review > 4. Discussion > 4.2. Relevance of Sedentary Behavior in Older Adults
What the sources say
- Not checked yetcites [3] Dogra, S., and Stathokostas, L. (2012). Sedentary behavior and physical activity are independent predictors of successful aging in middle-aged and older adults. J. Aging Res. source
- Not checked yetcites [25] Balboa-Castillo, T., León-Muñoz, L.M., Graciani, A., Rodríguez-Artalejo, F., and Guallar-Castillón, P. (2011). Longitudinal association of physical activity and sedentary behavior during leisure time with health-related quality of life in community-dwelling older adults. Health Qual. Life Outcomes, 9. source
hedgedcorrelational- Asserted: passes — The authors put it forward as true.
- Checkable: passes — It can be checked against evidence.
- Load-bearing: unclear — It is unclear whether the paper’s conclusions depend on it.
- Based: passes — The paper gives a reason why it holds.
It may state two separate claims as one.
In the paper
“TV viewing is also associated with other unhealthy habits such as consumption of unhealthy food and drinks or the influence of adverting to encourage these behaviors, therefore may also be a confounding factor with negative health effects of sitting [36].”
§ Prevalence of Sedentary Behavior in Older Adults: A Systematic Review > 4. Discussion > 4.2. Relevance of Sedentary Behavior in Older Adults
What the sources say
- Not checked yetcites [36] Stamatakis, 2012, Sedentary time in relation to cardio-metabolic risk factors: Differential association for self-report vs. accelerometry in working age adults, Int. J. Epidemiol. source
hedgedcorrelational- Asserted: passes — The authors put it forward as true.
- Checkable: passes — It can be checked against evidence.
- Load-bearing: unclear — It is unclear whether the paper’s conclusions depend on it.
- Based: passes — The paper gives a reason why it holds.
It may state two separate claims as one.
None of the sources cited for this claim have been checked yet.
In the paper
“However, association between sitting time and invasive breast cancer risk and risk of renal cell carcinoma has been specifically examined and significant independent association was not shown, although a weak correlation could not be ruled out [31,32].”
§ Prevalence of Sedentary Behavior in Older Adults: A Systematic Review > 4. Discussion > 4.2. Relevance of Sedentary Behavior in Older Adults
What the sources say
- Not checked yetcites [31] George, 2010, Beyond recreational physical activity: Examining occupational and household activity, transportation activity, and sedentary behavior in relation to postmenopausal breast cancer risk, Am. J. Public Health source
- Not checked yetcites [32] George, 2011, A prospective analysis of prolonged sitting time and risk of renal cell carcinoma among 300,000 older adults, Ann. Epidemiol. source
hedged- Asserted: passes — The authors put it forward as true.
- Checkable: passes — It can be checked against evidence.
- Load-bearing: unclear — It is unclear whether the paper’s conclusions depend on it.
- Based: passes — The paper gives a reason why it holds.
It may state two separate claims as one.
What the paper did — it cites no source for this, so there is none to check. The quote shows it is in the paper.
In the paper
“In addition, the studies pooled had different categories of prevalence and while we only considered non overlapping categories it is possible that weighting might have been underestimated for some studies evaluating prevalence of larger categories of time.”
§ Prevalence of Sedentary Behavior in Older Adults: A Systematic Review > 4. Discussion > 4.4. Limitations
hedgedconditional- Asserted: passes — The authors put it forward as true.
- Checkable: passes — It can be checked against evidence.
- Load-bearing: fails — The paper’s conclusions may not depend on it.
- Based: passes — The paper gives a reason why it holds.
Probably not a substantial claim. The paper’s conclusions may not depend on it.
In the paper
“Self-report measures are known to have poor accuracy and lead to an underestimation of the strength of the relationship [37].”
§ Prevalence of Sedentary Behavior in Older Adults: A Systematic Review > 4. Discussion > 4.3. Measurement of Sedentary Behavior in Surveys
What the sources say
- Not checked yetcites [37] Celis-Morales, C.A., Perez-Bravo, F., Ibńez, L., Salas, C., Bailey, M.E.S., and Gill, J.M.R. (2012). Objective vs. self-report physical activity and sedentary time: Effects of measurement method on relationship with risk biomarkers. PLoS One, 7. source
boosteddirect- Asserted: passes — The authors put it forward as true.
- Checkable: passes — It can be checked against evidence.
- Load-bearing: unclear — It is unclear whether the paper’s conclusions depend on it.
- Based: passes — The paper gives a reason why it holds.
It may state two separate claims as one.
A conclusion the paper draws from its own results — it cites no other source for it, so there is none to check. The quote shows it is in the paper.
In the paper
“Both screen time and TV time can be used as proxy measurements of sedentary behavior.”
§ Prevalence of Sedentary Behavior in Older Adults: A Systematic Review > 4. Discussion > 4.1. Summary of Findings
plaincorrelational- Asserted: passes — The authors put it forward as true.
- Checkable: passes — It can be checked against evidence.
- Load-bearing: passes — The paper’s conclusions depend on it.
- Based: passes — The paper gives a reason why it holds.
It may state two separate claims as one.
The paper relies on this without support.
There are no published systematic reviews on the prevalence of sedentary behavior objectively measured in, or subjectively reported by, older adults.
“Currently, there are no published systematic reviews on the prevalence of sedentary behavior objectively measured in, or subjectively reported by, older adults.”
The paper relies on this without support.
TV viewing serves as a proxy for sedentary behavior.
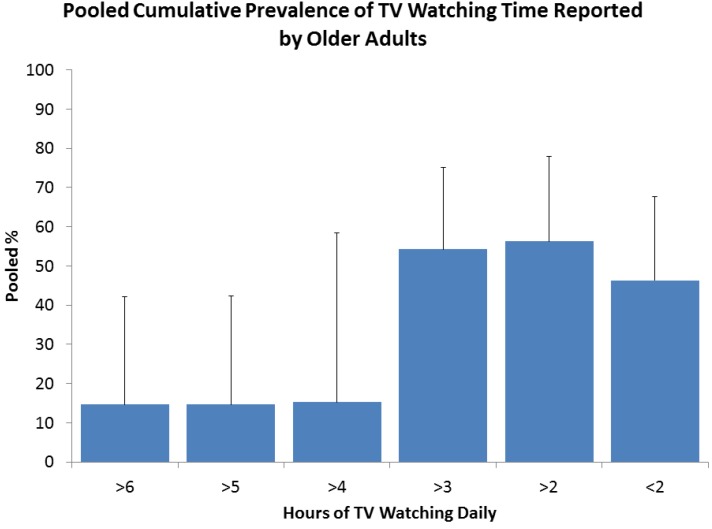
“TV viewing serves as a proxy for sedentary behavior, Figure 4 shows the meta-prevalence of TV viewing reported by older adults.”
Claims other papers make about this one
Each is checked against this paper’s own text: does it say what the citing paper says it does?
In the citing paper
“exercise participation among older adults is low and in a number of older adults may be precluded or limited due to age-related co-morbidities, as well as social and environmental barriers [136–140].”
From Targeting Intramyocellular Lipids to Improve Aging Muscle Function (2025) · cites this paper as [138]
Citations
Cites
The Physical Activity Guidelines for Americans
Piercy, K. L., Troiano, R. P., Ballard, R. M., Carlson, S. A., Fulton, J. E., Galuska, D. A., George, S. M., & Olson, R. D. (2018) · JAMA · doi:10.1001/jama.2018.14854 · Cited by 9,755
Global physical activity levels: surveillance progress, pitfalls, and prospects
Hallal, P. C., Andersen, L. B., Bull, F. C., Guthold, R., Haskell, W., & Ekelund, U. (2012) · The Lancet · doi:10.1016/s0140-6736(12)60646-1 · Cited by 5,711 · cited 1×
“It is well known that physical activity (PA) is an influencing factor for healthy aging and lack of PA has been associated with chronic disease [1].”
BackgroundBarendregt, J. J., Doi, S. A., Lee, Y. Y., Norman, R. E., & Vos, T. (2013) · Journal of Epidemiology and Community Health · doi:10.1136/jech-2013-203104 · Cited by 2,169 · cited 1×
“Studies with low and high prevalence in a category tend to be given an overestimated weight [39].”
BackgroundLetter to the Editor: Standardized use of the terms “sedentary” and “sedentary behaviours”
Networ, S. B. R. (2012) · Applied Physiology, Nutrition, and Metabolism · doi:10.1139/h2012-024 · Cited by 1,873
Sitting time and mortality from all causes, cardiovascular disease, and cancer
KATZMARZYK, P. T., CHURCH, T. S., CRAIG, C. L., & BOUCHARD, C. (2009) · Medicine & Science in Sports & Exercise · doi:10.1249/mss.0b013e3181930355 · Cited by 1,611 · cited 5×
“Katzmarzyk et al. (2009) [14] 3,375 > 60 years/17,013 > 18 years Age and % men not known Data: Daily sitting in 5 time categories.”
BackgroundMethodInfluentialSedentary Behaviors and Subsequent Health Outcomes in Adults
Thorp, A. A., Owen, N., Neuhaus, M., & Dunstan, D. W. (2011) · American Journal of Preventive Medicine · doi:10.1016/j.amepre.2011.05.004 · Cited by 1,455
Evidence-based intervention in physical activity: lessons from around the world
Heath, G. W., Parra, D. C., Sarmiento, O. L., Andersen, L. B., Owen, N., Goenka, S., Montes, F., & Brownson, R. C. (2012) · The Lancet · doi:10.1016/s0140-6736(12)60816-2 · Cited by 1,199 · cited 1×
“Generally, the older adult section of society is underserved in physical activity and sedentary behavior research [6].”
BackgroundSalmon, J., Owen, N., Crawford, D., Bauman, A., & Sallis, J. F. (2003) · Health Psychology · doi:10.1037/0278-6133.22.2.178 · Cited by 915 · cited 1×
“This method had been used in several papers and shown to have good reliability as a criterion measure [13].”
MethodSitting time and all-cause mortality risk in 222,497 Australian adults
van der Ploeg, H. P. (2012) · Archives of Internal Medicine · doi:10.1001/archinternmed.2011.2174 · Cited by 884 · cited 4×
“(2012) [20] 80,547 > 65 years/222,497 > 45 years Age Groups: 65–74 years, >75 years; ♂ 47.”
BackgroundInfluentialDunstan, D. W., Barr, E. L. M., Healy, G. N., Salmon, J., Shaw, J. E., Balkau, B., Magliano, D. J., Cameron, A. J., Zimmet, P. Z., & Owen, N. (2010) · Circulation · doi:10.1161/circulationaha.109.894824 · Cited by 825 · cited 9×
“Two included authors (Dunstan [17] and Banks [18]) provided further data sets to support their paper.”
BackgroundInfluential
Cited by
Sorted by citations
Young, D. R., Hivert, M.-F., Alhassan, S., Camhi, S. M., Ferguson, J. F., Katzmarzyk, P. T., Lewis, C. E., Owen, N., Perry, C. K., Siddique, J., et al. (2016) · Circulation · doi:10.1161/cir.0000000000000440 · Cited by 791
Mercer, K., Giangregorio, L., Schneider, E., Chilana, P., Li, M., & Grindrod, K. (2016) · JMIR mHealth and uHealth · doi:10.2196/mhealth.4225 · Cited by 419
“Physical activity levels often decline with age and over two thirds of adults over the age of 60 sit for more than 8.5 hours of their waking day [1].”
InfluentialMeta‐analysis of the relationship between breaks in sedentary behavior and cardiometabolic health
Chastin, S. F. M., Egerton, T., Leask, C., & Stamatakis, E. (2015) · Obesity · doi:10.1002/oby.21180 · Cited by 363
“National surveys show that on average adults spend 6-10 h sitting each day (2,3).”
BackgroundMethodSelf-citationInterventions with potential to reduce sedentary time in adults: systematic review and meta-analysis
Martin, A., Fitzsimons, C., Jepson, R., Saunders, D. H., van der Ploeg, H. P., Teixeira, P. J., Gray, C. M., & Mutrie, N. (2015) · British Journal of Sports Medicine · doi:10.1136/bjsports-2014-094524 · Cited by 326
“24”
Behavior Change Techniques Present in Wearable Activity Trackers: A Critical Analysis
Mercer, K., Li, M., Giangregorio, L., Burns, C., & Grindrod, K. (2016) · JMIR mHealth and uHealth · doi:10.2196/mhealth.4461 · Cited by 304
“For example, children who watch more than 2 hours of television a day have poorer body composition, physical fitness, self-esteem, prosocial behavior, and academic achievement [7].”
Yerrakalva, D., Yerrakalva, D., Hajna, S., & Griffin, S. J. (2019) · Journal of Medical Internet Research · doi:10.2196/14343 · Cited by 290
Systematic literature review of determinants of sedentary behaviour in older adults: a DEDIPAC study
CHASTIN, S. F. M., Buck, C., Freiberger, E., MURPHY, M. H., Brug, J., Cardon, G., O’Donoghue, G., Pigeot, I., & Oppert, J. (2015) · International Journal of Behavioral Nutrition and Physical Activity · doi:10.1186/s12966-015-0292-3 · Cited by 275
“5 h per day sitting [5].”
Self-citationCopeland, J. L., Ashe, M. C., Biddle, S., Brown, W. J., Buman, M. P., CHASTIN, S. F. M., Gardiner, P. A., Inoue, S., Jefferis, B. J. M. H., Oka, K., et al. (2017) · British Journal of Sports Medicine · doi:10.1136/bjsports-2016-097210 · Cited by 247
Self-citationStockwell, S., Schofield, P., Fisher, A., Firth, J., Jackson, S. E., Stubbs, B., & Smith, L. (2019) · Experimental Gerontology · doi:10.1016/j.exger.2019.02.020 · Cited by 212
“5 h per day sitting when objectively measured (Harvey et al., 2013).”
CHASTIN, S. F. M., Mandrichenko, O., Helbostadt, J. L., & Skelton, D. A. (2014) · Bone · doi:10.1016/j.bone.2014.04.009 · Cited by 197
“5 h a day sitting [23].”
Self-citationLow‐intensity daily walking activity is associated with hippocampal volume in older adults
Varma, V. R., Chuang, Y., Harris, G. C., Tan, E. J., & Carlson, M. C. (2015) · Hippocampus · doi:10.1002/hipo.22397 · Cited by 188
“cal activity is extremely important considering that the majority of older adults are sedentary (Centers for Disease Control and Prevention, 2013; Harvey et al., 2013) and have difficulty initiating and adhering to exercise programs (Resnick and Spellbring, 2000; Schutzer and Graves, 2004).”
BackgroundSarcopenia and Cognitive Decline in Older Adults: Targeting the Muscle–Brain Axis
Arosio, B., Calvani, R., Ferri, E., Coelho-Junior, H. J., Carandina, A., Campanelli, F., Ghiglieri, V., Marzetti, E., & Picca, A. (2023) · Nutrients · doi:10.3390/nu15081853 · Cited by 165
“, CAF) have been observed during long periods of inactivity, for instance in the setting of bed rest and space flight, as well as in the context of sarcopenia [135,136].”
BackgroundWullems, J. A., Verschueren, S., Degens, H., Morse, C. I., & Onambélé-Pearson, G. L. (2016) · Biogerontology · doi:10.1007/s10522-016-9640-1 · Cited by 177
“Time spent TV viewing combined with computer use is termed screen time (Harvey et al. 2013).”
BackgroundInfluentialCHASTIN, S. F. M., Craemer, M. D., Lien, N., Bernaards, C. M., Buck, C., Oppert, J., Nazare, J., Lakerveld, J., O’Donoghue, G., Holdsworth, M., et al. (2016) · International Journal of Behavioral Nutrition and Physical Activity · doi:10.1186/s12966-016-0409-3 · Cited by 166
“The problem of spending too much time in SB has been documented in children of all ages [11–13], adults [14] and older adults [15–17], which clearly shows the need of tackling this emerging public health problem across the life span.”
BackgroundSelf-citationKwan, R. Y. C., Salihu, D., Lee, P. H., Tse, M. Y. M., Cheung, D. S. K., Roopsawang, I., & Choi, K. (2020) · European Review of Aging and Physical Activity · doi:10.1186/s11556-020-00239-5 · Cited by 135
“Unsurprisingly, the prevalence of physical inactivity increases significantly with age, with the proportion of physically inactive older adults being at 67% globally as reported in a systematic review [9].”
BackgroundExploring the context of sedentary behaviour in older adults (what, where, why, when and with whom)
Leask, C. F., Harvey, J., Skelton, D. A., & CHASTIN, S. F. M. (2015) · European Review of Aging and Physical Activity · doi:10.1186/s11556-015-0146-7 · Cited by 130
“[4], however previous work has used self-report methods which may decrease reliability.”
BackgroundMethodSelf-citationZandieh, R., Martínez, J. A., Flacke, J., Jones, P., & van Maarseveen, M. F. A. M. (2016) · International Journal of Environmental Research and Public Health · doi:10.3390/ijerph13121179 · Cited by 140
“However, evidence shows that most older adults, especially those living in high-deprivation areas of cities (areas with high levels of social and economic disadvantages) [4,5], are physically inactive [6,7].”
BackgroundBrothers, A. F., & Diehl, M. K. (2016) · Journal of Aging and Physical Activity · doi:10.1123/japa.2016-0039 · Cited by 119
Anabolic Resistance of Muscle Protein Turnover Comes in Various Shapes and Sizes
Paulussen, K. J. M., McKenna, C. F., Beals, J. W., Wilund, K. R., Salvador, A. F., & Burd, N. A. (2021) · Frontiers in Nutrition · doi:10.3389/fnut.2021.615849 · Cited by 115
“Indeed, sarcopenia is usually coupled with sedentary lifestyle behaviors during the aging process that can be attenuated with increased habitual physical activity (67, 68).”
BackgroundBiomarkers associated with sedentary behaviour in older adults: A systematic review
Wirth, K., Klenk, J., Brefka, S., Dallmeier, D., Kathrin, F., Figuls, M. R. I., Tully, M. A., Giné‐Garriga, M., Caserotti, P., Salvà, A., et al. (2016) · Ageing Research Reviews · doi:10.1016/j.arr.2016.12.002 · Cited by 109
“Addiionally 17 of our 26 studies calculated SB by subjective methods, hich are less accurate than objective methods, since people tend o underestimate their time spend in SB, due to simple uncertainty r social desirability (Harvey et al., 2013).”
BackgroundEnhancing physical function in HIV-infected older adults: A randomized controlled clinical trial.
Shah, K. N., Majeed, Z., Yoruk, Y. B., Yang, H., Hilton, T. N., McMahon, J. M., Hall, W. J., Walck, D., Luque, A. E., & Ryan, R. M. (2016) · Health Psychology · doi:10.1037/hea0000311 · Cited by 100
The Descriptive Epidemiology of Sedentary Behaviour
Bauman, A. E., Petersen, C. B., Blond, K., Rangul, V., & Hardy, L. L. (2017) · Springer series on epidemiology and public health · doi:10.1007/978-3-319-61552-3_4 · Cited by 112
White, I., Smith, L., Aggio, D., Shankar, S., Begum, S., Matei, R., Fox, K. R., Hamer, M., Iliffe, S., Jefferis, B. J. M. H., et al. (2017) · Pilot and Feasibility Studies · doi:10.1186/s40814-017-0139-6 · Cited by 102
Interventions for reducing sedentary behaviour in community-dwelling older adults
CHASTIN, S. F. M., Gardiner, P. A., Harvey, J., Leask, C. F., Jerez‐Roig, J., Rosenberg, D. E., Ashe, M. C., Helbostad, J. L., & Skelton, D. A. (2021) · Cochrane Database of Systematic Reviews · doi:10.1002/14651858.cd012784.pub2 · Cited by 99
Self-citationValidity of objective methods for measuring sedentary behaviour in older adults: a systematic review
Heesch, K. C., Hill, R. L., Aguilar-Farías, N., van Uffelen, J. G. Z., & Pavey, T. (2018) · International Journal of Behavioral Nutrition and Physical Activity · doi:10.1186/s12966-018-0749-2 · Cited by 98
Stubbs, B., Patchay, S., Soundy, A., & Schofield, P. (2014) · Pain Medicine · doi:10.1111/pme.12570 · Cited by 89
Law, L. L., Rol, R. N., Schultz, S. A., Dougherty, R. J., Edwards, D. F., Koscik, R. L., Gallagher, C. L., Carlsson, C. M., Bendlin, B. B., Zetterberg, H., et al. (2018) · Alzheimer s & Dementia Diagnosis Assessment & Disease Monitoring · doi:10.1016/j.dadm.2018.01.001 · Cited by 88
“5 hours a day [17], and those at risk for AD due to family history exhibit higher levels of SB than those without a family history [18].”
BackgroundThe role of nutrition and physical activity in frailty: A review
O’Connell, M., Coppinger, T. C., & McCarthy, A. L. (2019) · Clinical Nutrition ESPEN · doi:10.1016/j.clnesp.2019.11.003 · Cited by 89
Effect of Community Volunteering on Physical Activity
Varma, V. R., Tan, E. J., Gross, A. L., Harris, G., Romani, W. A., Fried, L. P., Rebok, G. W., & Carlson, M. C. (2015) · American Journal of Preventive Medicine · doi:10.1016/j.amepre.2015.06.015 · Cited by 85
Co-creating a tailored public health intervention to reduce older adults’ sedentary behaviour
Leask, C. F., Sandlund, M., Skelton, D. A., & CHASTIN, S. F. M. (2017) · Health Education Journal · doi:10.1177/0017896917707785 · Cited by 83
“Older adults are the most sedentary segment of society (Harvey et al., 2013), and sedentary behaviour is an independent risk factor for successful ageing, regardless of how physically active an individual is (Dogra and Stathokostas, 2012).”
BackgroundSelf-citationOlanrewaju, O., Stockwell, S., Stubbs, B., & Smith, L. (2020) · Aging Clinical and Experimental Research · doi:10.1007/s40520-019-01457-3 · Cited by 84
Ballin, M., Nordström, P., Niklasson, J., & Nordström, A. (2020) · Sports Medicine · doi:10.1007/s40279-020-01356-y · Cited by 84
Do Inequalities in Neighborhood Walkability Drive Disparities in Older Adults’ Outdoor Walking?
Zandieh, R., Flacke, J., Martínez, J. A., Jones, P., & van Maarseveen, M. F. A. M. (2017) · International Journal of Environmental Research and Public Health · doi:10.3390/ijerph14070740 · Cited by 79
“Despite this widespread knowledge, there is prevalence of physical inactivity among majority of older adults [3,5], particularly among older residents of high-deprivation areas (areas with high levels of social and economic disadvantages) of cities [6,7].”
BackgroundLewis, L. K., Rowlands, A. V., Gardiner, P. A., Standage, M., English, C., & Olds, T. (2016) · Maturitas · doi:10.1016/j.maturitas.2015.12.014 · Cited by 80
“opulation [8], with an average sedentary time of 9.”
BackgroundStańczykiewicz, B., Banik, A., Knoll, N., Keller, J., Hohl, D. H., Rosińćzuk, J., & Łuszczyńska, A. (2019) · BMC Public Health · doi:10.1186/s12889-019-6715-3 · Cited by 83
Compernolle, S., Cocker, K. A. D., Cardon, G., Bourdeaudhuij, I. D., & Dyck, D. V. (2019) · The Gerontologist · doi:10.1093/geront/gnz127 · Cited by 73
Device-assessed physical activity and sedentary behavior in a community-based cohort of older adults
Rosenberg, D. E., Walker, R. L., Greenwood-Hickman, M. A., Bellettiere, J., Xiang, Y., Richmire, K., Higgins, M., Wing, D., Larson, E. B., Crane, P. K., et al. (2020) · BMC Public Health · doi:10.1186/s12889-020-09330-z · Cited by 77
Sotos‐Prieto, M., Bhupathiraju, S. N., Falcón, L. M., Gao, X., Tucker, K. L., & Mattei, J. (2015) · Journal of Nutrition · doi:10.3945/jn.114.206391 · Cited by 69
“Television viewing has been shown to be a feasible proxy of sedentary behaviors (54).”
BackgroundNeuromuscular Junction Aging: A Role for Biomarkers and Exercise
Pratt, J., VITO, G. D., Narici, M. V., & Boreham, C. A. (2020) · The Journals of Gerontology Series A · doi:10.1093/gerona/glaa207 · Cited by 75
Residents’ Perception of Informal Green Space—A Case Study of Ichikawa City, Japan
Kim, M., Rupprecht, C. D. D., & Furuya, K. (2018) · Land · doi:10.3390/land7030102 · Cited by 68
Greenwood-Hickman, M. A., Dahlquist, J. M., Cooper, J., Holden, E., McClure, J. B., Mettert, K. D., Perry, S. R., & Rosenberg, D. E. (2021) · Frontiers in Public Health · doi:10.3389/fpubh.2021.679976 · Cited by 70
Mo, Y., Zhou, Y., Chan, H. Y. L., Evans, C., & Maddocks, M. M. (2023) · BMC Geriatrics · doi:10.1186/s12877-023-04489-7 · Cited by 80
“However, this broad question without detailed prompts could be difficult for older adults to recall [74], and tends to misestimate their sedentary time compared to objective measures [75, 76].”
BackgroundWhat Do Older People Do When Sitting and Why? Implications for Decreasing Sedentary Behavior
Palmer, V. J., Gray, C. M., Fitzsimons, C. F., Mutrie, N., Wyke, S., Deary, I. J., Der, G., CHASTIN, S. F. M., Skelton, D. A., Seniors USP Team, et al. (2018) · The Gerontologist · doi:10.1093/geront/gny020 · Cited by 66
Self-citationMarcangeli, V., Youssef, L., Dulac, M., Carvalho, L. P., Hajj‐Boutros, G., Reynaud, O., Guegan, B., Buckinx, F., Gaudreau, P., Morais, J. A., et al. (2022) · Journal of Cachexia Sarcopenia and Muscle · doi:10.1002/jcsm.12955 · Cited by 56
on behalf of the Seniors USP Team, Galé, C. R., Marioni, R. E., Čukić, I., CHASTIN, S. F. M., Dall, P., Dontje, M. L., Skelton, D. A., & Deary, I. J. (2018) · Clinical Epigenetics · doi:10.1186/s13148-017-0438-z · Cited by 58
Self-citationDoes Dog Ownership Affect Physical Activity, Sleep, and Self-Reported Health in Older Adults?
Mičková, E., Machová, K., Daďová, K., & Svobodová, I. (2019) · International Journal of Environmental Research and Public Health · doi:10.3390/ijerph16183355 · Cited by 55
“[39] points out that older adults more frequently report sedentary time in questionnaires between 4 and 5 h, while objectively measured accelerometer data show sedentary time more than 8.”
BackgroundKu, P., Fox, K. R., Liao, Y., Sun, W., & Chen, L. (2016) · Quality of Life Research · doi:10.1007/s11136-016-1309-3 · Cited by 54
Fung, C. H., Vitiello, M. V., Alessi, C., & Kuchel, G. A. (2016) · Journal of the American Geriatrics Society · doi:10.1111/jgs.14493 · Cited by 52
Daily Life Satisfaction in Older Adults as a Function of (In)Activity
Maher, J. P., & Conroy, D. E. (2015) · The Journals of Gerontology Series B · doi:10.1093/geronb/gbv086 · Cited by 56
Interventions for reducing sedentary behaviour in community-dwelling older adults
CHASTIN, S. F. M., Gardiner, P. A., Ashe, M. C., Harvey, J., Leask, C. F., Balogun, S. A., Helbostad, J. L., & Skelton, D. A. (2017) · Cochrane Database of Systematic Reviews · doi:10.1002/14651858.cd012784 · Cited by 51
Self-citationBuckinx, F., Gouspillou, G., Carvalho, L. P., Marcangeli, V., Boutros, G. E. H., Dulac, M., Noirez, P., Morais, J. A., Gaudreau, P., & Aubertin‐Leheudre, M. (2018) · Journal of Clinical Medicine · doi:10.3390/jcm7120561 · Cited by 54
“However, and despite this knowledge, almost 60% of older adults are sedentary [7].”
BackgroundOn behalf of the PREDIMED-Plus investigators, Schröder, H., Cárdenas-Fuentes, G., Martínez‐González, M. Á., Corella, D., Vioqué, J., Romaguera, D., Martínez, J. A., Tinahones, F. J., López‐Miranda, J., et al. (2018) · International Journal of Behavioral Nutrition and Physical Activity · doi:10.1186/s12966-018-0741-x · Cited by 47
Seidu, S., Abdool, M., Almaqhawi, A., Wilkinson, T. J., Kunutsor, S. K., Khunti, K. K., & Yates, T. E. (2023) · European Journal of Epidemiology · doi:10.1007/s10654-022-00961-7 · Cited by 46
“However, it is documented that many individuals do not even meet these minimum levels [59, 60].”
BackgroundCan a smart chair improve the sitting behavior of office workers?
Roossien, C. C., Stegenga, J., Hodselmans, A. P., et al. (2017) · Applied Ergonomics · doi:10.1016/j.apergo.2017.07.012 · Cited by 46
Objectively-Assessed Patterns and Reported Domains of Sedentary Behavior Among Japanese Older Adults
Shibata, A., Oka, K., Ishii, K., Miyawaki, R., Inoue, S., Sugiyama, T., & Owen, N. G. (2018) · Journal of Epidemiology · doi:10.2188/jea.je20180041 · Cited by 45
Dobrowolny, G., Barbiera, A., Sica, G., & Scicchitano, B. M. (2021) · Cells · doi:10.3390/cells10061307 · Cited by 51
Reliability and Validity of 2 Self-Report Measures to Assess Sedentary Behavior in Older Adults
Gennuso, K. P., Matthews, C. E., & Colbert, L. H. (2014) · Journal of Physical Activity and Health · doi:10.1123/jpah.2013-0546 · Cited by 45
Perceptions of Sedentary Behavior Among Socially Engaged Older Adults
Mcewan, T., Tam‐Seto, L., & Dogra, S. (2016) · The Gerontologist · doi:10.1093/geront/gnv689 · Cited by 50
Wu, H.-W., Kumar, P., & Cao, S. (2022) · Journal of Building Engineering · doi:10.1016/j.jobe.2022.104682 · Cited by 44
Herold, F., Theobald, P., Gronwald, T., Rapp, M. A., & Müller, N. G. (2022) · European Review of Aging and Physical Activity · doi:10.1186/s11556-022-00296-y · Cited by 52
“…this context, there is also evidence that the level of physical inactivity increases as a function of age [22, 24, 25] and that older adults spend a relatively large amount of their wakening hours sedentary [26 – 29], whereby for the latter even an increase has been observed in the last years [28].”
BackgroundMcKendry, J., Coletta, G., Nunes, E. A., Lim, C., & Phillips, S. M. (2024) · Experimental Physiology · doi:10.1113/ep091937 · Cited by 47
D’Oliveira, A., Dominski, F. H., de Souza, L. C., Branco, J. H. L., Matte, D. L., da Cruz, W. M., & Andrade, A. (2023) · Environmental Research · doi:10.1016/j.envres.2023.116519 · Cited by 44
Ryan, D. J., Stebbings, G. K., & Onambélé-Pearson, G. L. (2015) · AGE · doi:10.1007/s11357-015-9832-7 · Cited by 46
“(2008a), and Bailey and Locke (2014) should be conducted using aging populations, whose waking hours are predominantly spent performing SB (Harvey et al. 2013), to examine the potential benefits of LIPA breaks.”
BackgroundResultWatts, A. S., Walters, R. W., Hoffman, L., & Templin, J. L. (2016) · PLoS ONE · doi:10.1371/journal.pone.0153898 · Cited by 44
Levinger, P., Sales, M., Polman, R. C. J., Haines, T. P., Dow, B., Biddle, S., Duque, G., & Hill, K. (2018) · Health Promotion Journal of Australia · doi:10.1002/hpja.60 · Cited by 45
Seol, J., Abe, T., Fujii, Y., Joho, K., & Okura, T. (2019) · Nursing and Health Sciences · doi:10.1111/nhs.12647 · Cited by 50
Household physical activity is positively associated with gray matter volume in older adults
Koblinsky, N. D., Meusel, L.-A., Greenwood, C. E., & Anderson, N. D. (2021) · BMC Geriatrics · doi:10.1186/s12877-021-02054-8 · Cited by 44
Lee, S., Son, C., Yeo, S., & Ha, I. (2019) · BMC Public Health · doi:10.1186/s12889-019-7653-9 · Cited by 43
Religion and Screen Hours in a US National SamplePreprint
Gillum, R. F., Dodd, K. D., & Dodd, I. M. E. (2016) · SSRN Electronic Journal · doi:10.2139/ssrn.2825157 · Cited by 41
MyMove: Facilitating Older Adults to Collect In-Situ Activity Labels on a Smartwatch with Speech
Kim, Y., Chou, D., Lee, B., Danilovich, M., Lazar, A., Conroy, D. E., Kacorri, H., & Choe, E. K. (2022) · CHI Conference on Human Factors in Computing Systems · doi:10.1145/3491102.3517457 · Cited by 42
Møller, T., Lillelund, C., Andersen, C., Bloomquist, K., Christensen, K. B., Ejlertsen, B., Nørgaard, L. N., Wiedenbein, L., Oturai, P., Breitenstein, U., et al. (2015) · BMJ Open Sport & Exercise Medicine · doi:10.1136/bmjsem-2015-000021 · Cited by 37
Watts, A. S., Mortby, M. E., & Burns, J. M. (2018) · PLoS ONE · doi:10.1371/journal.pone.0208581 · Cited by 41
The home as enabler of more active lifestyles among older people
Brookfield, K., Fitzsimons, C. F., Scott, I., Mead, G. E., Starr, J. M., Thin, N., Tinker, A., & Thompson, C. W. (2015) · Building Research & Information · doi:10.1080/09613218.2015.1045702 · Cited by 40
Figueiró, T. H., Arins, G. C. B., dos Santos, C. E. S., Cembranel, F., de Medeiros, P. A., d’Orsi, E., & Rech, C. R. (2019) · PLoS ONE · doi:10.1371/journal.pone.0210861 · Cited by 44
Nikitina, S., Didino, D., Báez, M., & Casati, F. (2018) · JMIR mhealth and uhealth · doi:10.2196/mhealth.7531 · Cited by 36
Bouaziz, W., Schmitt, E., Vogel, T., Lefebvre, F., Leprêtre, P.-M., Kaltenbach, G., Geny, B., & Lang, P.-O. (2019) · International Journal of Clinical Practice · doi:10.1111/ijcp.13219 · Cited by 33
Luo, L., Cao, Y., Hu, Y., Wen, S., Tang, K., Ding, L., & Song, N. (2022) · International Journal of Environmental Research and Public Health · doi:10.3390/ijerph192013407 · Cited by 39
“In recent years, a growing number of studies showed that sedentary behaviour was common in older people [21] and increased the risk of morbidity and mortality [22].”
BackgroundChase, J. D., Otmanowski, J. A., Rowland, S. A., & Cooper, P. S. (2020) · Translational Behavioral Medicine · doi:10.1093/tbm/ibz189 · Cited by 34
Heseltine, R., Skelton, D. A., Kendrick, D., Morris, R. W., Griffin, M., Haworth, D., Masud, T., & Iliffe, S. (2015) · BMC Family Practice · doi:10.1186/s12875-015-0284-z · Cited by 37
Self-citationFar, I. K., Ferron, M., Ibarra, F., Báez, M., Tranquillini, S., Casati, F., & Doppio, N. (2015) · PeerJ Computer Science · doi:10.7717/peerj-cs.30 · Cited by 35
Use of activPAL to Measure Physical Activity in Community-Dwelling Older Adults: A Systematic Review
Blackwood, J., Suzuki, R., Webster, N. J., Karczewski, H., Ziccardi, T., & Shah, S. (2022) · Archives of Rehabilitation Research and Clinical Translation · doi:10.1016/j.arrct.2022.100190 · Cited by 42
“Sedentary behavior, independent of PA, has been linked to diabetes, obesity, morbidity, mortality, and cardiovascular disease.(2,4) Despite the higher prevalence of inactivity among older adults, this population is underrepresented in research focused on quantifying PA.”
BackgroundInfluentialKonrad, A., Močnik, R., Titze, S., Nakamura, M., & Tilp, M. (2021) · International Journal of Environmental Research and Public Health · doi:10.3390/ijerph18041936 · Cited by 37
“An average of≥8 h mean sedentary time has been reported in a youth population [14], and also in an elderly population [15].”
BackgroundRonch, C. D., Canuto, A., Volkert, J., Massarenti, S., Weber, K., Dehoust, M. C., Nanni, M. G., Andreas, S., Sehner, S., Schulz, H., et al. (2014) · Mental health and physical activity · doi:10.1016/j.mhpa.2014.11.002 · Cited by 35
Technologies for Promoting Social Participation in Later Life
Báez, M., Nielek, R., Casati, F., & Wierzbicki, A. (2019) · Springer eBooks · doi:10.1007/978-981-13-3693-5_17 · Cited by 34
Compernolle, S., Cardon, G., van der Ploeg, H. P., van Nassau, F., Bourdeaudhuij, I. D., Jelsma, J. G. M., Brondeel, R., & Dyck, D. V. (2020) · JMIR mhealth and uhealth · doi:10.2196/18653 · Cited by 33
“Given the negative health consequences and the high prevalence of sedentary behavior in older adults (ie, 60 years and over) [8], creating interventions specifically focusing on the reduction of sedentary behavior is recommended to promote healthy aging.”
BackgroundPhysical Exercise for Late‐Life Depression: Customizing an Intervention for Primary Care
Zanetidou, S., Murri, M. B., Menchetti, M., Toni, G., Asioli, F., Bagnoli, L., Zocchi, D., Siena, M., Assirelli, B., Luciano, C., et al. (2016) · Journal of the American Geriatrics Society · doi:10.1111/jgs.14525 · Cited by 33
Biswas, A., Oh, P. I., Faulkner, G. E., & Alter, D. A. (2018) · Annals of Physical and Rehabilitation Medicine · doi:10.1016/j.rehab.2017.06.003 · Cited by 33
“3) [15], 80% power, a marginal error of d = 1/4p, and a two-tailed alpha of 0.”
BackgroundOnline Group-Exercises for Older Adults of Different Physical Abilities
Báez, M., Francisco, I., Khaghani, F. I., Ferron, M., & Fabio, C. (2016) · IEEE Conference Proceedings · Cited by 32
Daniele, A., Lucas, S. J. E., & Rendeiro, C. (2022) · Frontiers in Physiology · doi:10.3389/fphys.2022.998380 · Cited by 43
“, 2020), with almost 70% estimated to spend more than 8 h daily on sitting or low energy expenditure activities (Harvey et al., 2013).”
BackgroundJúnior, R. C. F., Fernandes, T. G., Borges, G. F., Guerra, R. O., & de Abreu, D. C. C. (2017) · Archives of Gerontology and Geriatrics · doi:10.1016/j.archger.2017.11.007 · Cited by 30
McGowan, L. J., Powell, R., & French, D. (2019) · Journal of Aging and Physical Activity · doi:10.1123/japa.2018-0274 · Cited by 31
Food Sources and Nutrient Intakes of Filipino Working Adults
Angeles‐Agdeppa, I., & Custodio, M. R. S. (2020) · Nutrients · doi:10.3390/nu12041009 · Cited by 30
“The literature has pointed out the detrimental effects of prolonged physical inactivity on people’s health [42,43].”
BackgroundOnline Group-Exercises for Older Adults of Different Physical Abilities
Báez, M., Ibarra, F., Far, I. K., Ferron, M., & Casati, F. (2016) · International Conference on Collaboration Technologies and Systems (CTS) · doi:10.1109/cts.2016.0098 · Cited by 30
“Thus, and in spite of the growing evidence of the benefits of physical activity, as well as the adverse effects of sedentary behaviour, physical inactivity is still prevalent in older adults [7].”
BackgroundGhosal, R., Varma, V. R., Volfson, D., Urbanek, J. K., Hausdorff, J. M., Watts, A. S., & Zipunnikov, V. (2022) · Scientific Reports · doi:10.1038/s41598-022-15528-5 · Cited by 31
Marques, A., Santos, D. A., Peralta, M., Sardinha, L. B., & Valeiro, M. G. (2018) · Preventive Medicine · doi:10.1016/j.ypmed.2018.01.015 · Cited by 30
Heinrich, K. M., Crawford, D., Langford, C. R., Kehler, A., & Andrews, V. (2019) · Journal of Geriatric Physical Therapy · doi:10.1519/jpt.0000000000000251 · Cited by 32
Sedentary behaviour and bone health in older adults: a systematic review
McMichan, L., Dick, M. J., Skelton, D. A., CHASTIN, S. F. M., Owen, N. G., Dunstan, D. W., Fraser, W. D., TANG, J. C. Y., Greig, C. A., Agyapong‐Badu, S., et al. (2021) · Osteoporosis International · doi:10.1007/s00198-021-05918-2 · Cited by 32
“Older adults (aged 65+ years) can accumulate > 8 h of time spent in SB daily [8, 9], with an average being 9.”
BackgroundSelf-citationCarvalho, J., Borges‐Machado, F., Pizarro, A. I. N., Bohn, L., & Barros, D. G. M. (2021) · Frontiers in Psychology · doi:10.3389/fpsyg.2021.643832 · Cited by 29
Ashdown‐Franks, G., Koyanagi, A., Vancampfort, D., Smith, L., Firth, J., Schuch, F. B., Veronese, N., & Stubbs, B. (2018) · Maturitas · doi:10.1016/j.maturitas.2018.08.005 · Cited by 32
Changes in sedentary behaviours across the retirement transition: a systematic review
MURPHY, M. H. (2015) · Age and Ageing · doi:10.1093/ageing/afv142 · Cited by 28
Metadata
- Authors
- Harvey, J., Chastin, S., & Skelton, D.
- Affiliations
- Glasgow Caledonian University (GB)
- Corresponding author
- Harvey, Juliet
- Venue
- International Journal of Environmental Research and Public Health
- Publisher
- MDPI AG
- Published
- 2013-12-02
- Volume
- 10
- Issue
- 12
- Pages
- 6645-6661
- ISSN
- 1660-4601 (ISSN-L)
- PMC
- PMC3881132
- OpenAlex
- W2006256354
- Cited by
- 418
- References
- 43
- Citations by year
- 2026: 15 · 2025: 35 · 2024: 44 · 2023: 40 · 2022: 42 · 2021: 54 · 2020: 40 · 2019: 41 · 2018: 31 · 2017: 29 · 2016: 24 · 2015: 15 · 2014: 8
- FWCI
- 1.72
- Type
- journal article
- Language
- en
- Open access
- gold
- doi.org
- Licence
- Locations
- International Journal of Environmental Research and Public Health (publishedVersion, cc-by)
- Europe PMC (PubMed Central) (publishedVersion, cc-by)
- PubMed Central (publishedVersion, cc-by)
- PubMed (publishedVersion)
- RePEc: Research Papers in Economics (submittedVersion)
- DOAJ (DOAJ: Directory of Open Access Journals) (submittedVersion)
- ResearchOnline (Glasgow Caledonian University) (submittedVersion, cc-by-nc-sa)
- Topics
- Health Sciences › Medicine › Public Health, Environmental and Occupational Health › Physical Activity and Health
- Physical Sciences › Computer Science › Computer Vision and Pattern Recognition › Context-Aware Activity Recognition Systems
- Health Sciences › Medicine › Public Health, Environmental and Occupational Health › Aging, Health, and Disability
- Keywords
- sedentary behavior, older adults, prevalence, sitting time, screen time, television viewing, accelerometry, self-report, physical inactivity, health risk factors
- MeSH terms
- Aged, Humans, Middle Aged, Risk Factors, Prevalence, Sedentary Behavior, Self Report
About these checks
Registry, retraction, Cites and statistics results are computed, not judged, with one exception: a printed reference that no index lists is read once by a model before it counts as a citation error. Claims are extracted by a model and kept only when their quote appears verbatim in the text; each cited source is then checked, with a model’s help, for whether it says what the claim relies on. Those verdicts can be wrong — read the claim’s quote and the cited source before relying on one.
A language model drew the claims from the paper on 2026-10-09, under version 3 of the claim definition (model deepseek-v4.1-flash, prompt extract-v3).
A second model labelled each claim on 2026-10-09 (model jev-1.13-20260917, definition revision gold-guideline-v0.2).
Statistics and arithmetic are recomputed, not judged.
Confidence bands are shown only for fields calibrated on our annotated test set. None is calibrated yet, so no band is shown.
What counts as a claim ›How we measure confidence ›How we check this ›
Are you an author, or do you see a problem with this page? Request a review
