

Technical Note: Downscaling RCM precipitation to the station scale using statistical transformations—A comparison of methods
Open accessPublished version of a preprint
The DOI matches its Crossref record; 41 of the 41 references it cites were found in a registry or an index.
Abstract
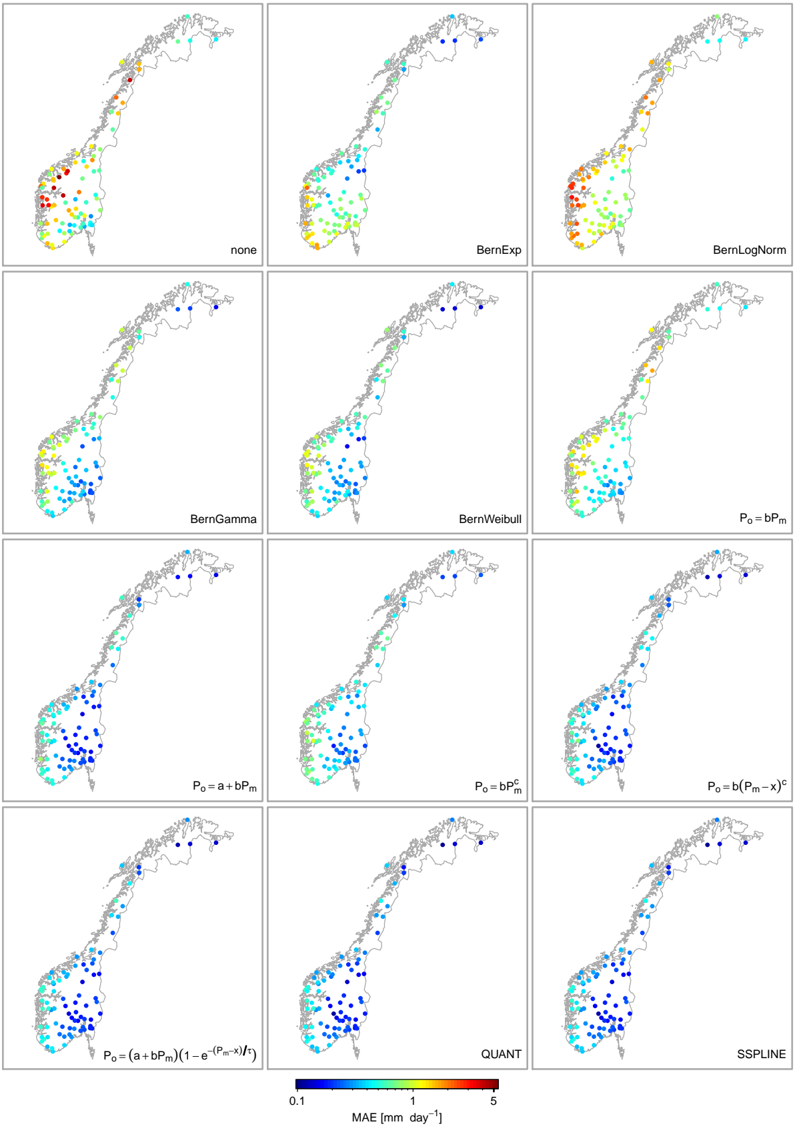
The impact of climate change on water resources is usually assessed at the local scale. However, regional climate models (RCMs) are known to exhibit systematic biases in precipitation. Hence, RCM simulations need to be post-processed in order to produce reliable estimates of local scale climate. Popular post-processing approaches are based on statistical transformations, which attempt to adjust the distribution of modelled data such that it closely resembles the observed climatology. However, the diversity of suggested methods renders the selection of optimal techniques difficult and therefore there is a need for clarification. In this paper, statistical transformations for post-processing RCM output are reviewed and classified into (1) distribution derived transformations, (2) parametric transformations and (3) nonparametric transformations, each differing with respect to their underlying assumptions. A real world application, using observations of 82 precipitation stations in Norway, showed that nonparametric transformations have the highest skill in systematically reducing biases in RCM precipitation.
Overview
The claims and statistics of this paper haven’t been checked yet.
Free: it reads the open-access text and checks the first 5 claims that cite a source we can check. Create a free account to check every claim.
Integrity signals
Registry
Cites
Statistics
Figures



Verification
Claims the paper makes
The claims and statistics of this paper haven’t been checked yet.
Free: it reads the open-access text and checks the first 5 claims that cite a source we can check. Create a free account to check every claim.
Claims other papers make about this one
Each is checked against this paper’s own text: does it say what the citing paper says it does?
The source backs part of the claim, not all of it — or backs it for a different population, condition or comparison.
In the citing paper
“Quantile mapping is the most used bias correction technique due to its ease of handling large amounts of data and its computational efficiency [58,59].”
From Climate Change Impacts on Streamflow in the Krishna River Basin, India: Uncertainty and Multi-Site Analysis (2022) · cites this paper as [58]
Experimental — accuracy not yet measured
Self-check
Percentages, sums and reported differences re-computed from the paper’s own numbers.
The self-check needs the paper’s full text.
Citations
Cites
The Elements of Statistical Learning
Hastie, T., Friedman, J., & Tibshirani, R. (2001) · Springer Series in Statistics · doi:10.1007/978-0-387-21606-5 · Cited by 24,162
Uppala, S. M., KÅllberg, P. W., Simmons, A. J., Andrae, U., Bechtold, V. D. C., Fiorino, M., Gibson, J. K., Haseler, J., Hernandez, A., Kelly, G. A., et al. (2005) · Quarterly Journal of the Royal Meteorological Society · doi:10.1256/qj.04.176 · Cited by 6,804 · cited 1×
“Modelled precipitation was extracted from a HIRHAM RCM simulation with 25 km resolution (Førland et al., 2009, 2011) forced with the ERA40 reanalysis (Uppala et al., 2005) on a model domain covering Norway and the Nordic Arctic.”
MethodTeutschbein, C., & Seibert, J. (2012) · Journal of Hydrology · doi:10.1016/j.jhydrol.2012.05.052 · Cited by 2,214 · cited 13×
“, 2011; Teutschbein and Seibert, 2012), the standard deviation (Engen-Skaugen, 2007; Li et al., 2010; Themeßl et al., 2011; Teutschbein and Seibert, 2012) and the skewness (Li et al.”
BackgroundMethodResultInfluentialHydrologic Implications of Dynamical and Statistical Approaches to Downscaling Climate Model Outputs
Wood, A. W., Leung, L. R., Sridhar, V., & Lettenmaier, D. P. (2004) · Climatic Change · doi:10.1023/b:clim.0000013685.99609.9e · Cited by 1,886 · cited 3×
“(2) using the empirical CDF of observed and modelled values instead of assuming parametric distributions (e.g.Panofsky and Brier, 1968; Wood et al., 2004; Reichle and Koster, 2004; Boé et al., 2007; Themeßl et al., 2011, 2012).”
BackgroundMethodMaraun, D., Wetterhall, F., Ireson, A. M., Chandler, R. E., Kendon, E. J., Widmann, M., Brienen, S., Rust, H. W., Sauter, T., Themeßl, M., et al. (2010) · Reviews of Geophysics · doi:10.1029/2009rg000314 · Cited by 1,805 · cited 3×
“Further, “statistical bias correction” (Piani et al., 2010a,b), “direct error correction methods” (Themeßl et al., 2011) and “model output statistics (MOS)” (Maraun et al., 2010) have been used to refer to the methods under investigation.”
MethodStatistical bias correction for daily precipitation in regional climate models over Europe
Piani, C., Haerter, J. O., & Coppola, E. (2010) · Theoretical and Applied Climatology · doi:10.1007/s00704-009-0134-9 · Cited by 1,154 · cited 9×
“…a set of scores is needed that quantifies the similarity of the observed and the (corrected) modelled empirical CDF. Previously used scores include overall measures, such as the root mean square error (Piani et al., 2010b) or the Kolmogorov-Smirnov two sample statistic (Dosio and Paruolo, 2011).”
BackgroundMethodInfluentialSome applications of statistics to meteorology
Panofsky, H. A., Brier, G. W., & Best, W. H. (1958) · University of Michigan Library Repository · Cited by 1,083
Li, H., Sheffield, J., & Wood, E. F. (2010) · Journal of Geophysical Research: Atmospheres · doi:10.1029/2009jd012882 · Cited by 901 · cited 6×
“Other suggested scores assess specific moments of the distribution including the mean (Engen-Skaugen, 2007; Li et al., 2010; Dosio and Paruolo, 2011; Themeßl et al., 2011; Turco et al., 2011; Teutschbein and Seibert, 2012), the standard deviation (Engen-Skaugen, 2007; Li et al., 2010; Themeßl et…”
BackgroundMethodInfluentialHow Well Do Coupled Models Simulate Today's Climate?
Reichler, T., & Kim, J. (2008) · Bulletin of the American Meteorological Society · doi:10.1175/bams-89-3-303 · Cited by 881
Piani, C., Weedon, G. P., Best, M., Gomes, S. M., Viterbo, P., Hagemann, S., & Haerter, J. O. (2010) · Journal of Hydrology · doi:10.1016/j.jhydrol.2010.10.024 · Cited by 868 · cited 9×
“…a set of scores is needed that quantifies the similarity of the observed and the (corrected) modelled empirical CDF. Previously used scores include overall measures, such as the root mean square error (Piani et al., 2010b) or the Kolmogorov-Smirnov two sample statistic (Dosio and Paruolo, 2011).”
BackgroundMethodInfluential
Cited by
Items 601–700 of 1,001
Tefera, G. W., Dile, Y. T., & Ray, R. L. (2023) · Sustainability · doi:10.3390/su151310513 · Cited by 20
Shrestha, S., Zaramella, M., Callegari, M., Greifeneder, F., & Borga, M. (2023) · Climate · doi:10.3390/cli11070154 · Cited by 18
Perri, D. V., Hurtado, S. I., Bruzzone, O. A., & Easdale, M. H. (2023) · Theoretical and Applied Climatology · doi:10.1007/s00704-023-04730-8 · Cited by 16
“A widely used and simple approach is to do a linear regression (several times fixing the intercept to zero) between the modeled and the observed precipitation (Gudmundsson et al. 2012), which is the special case of having Lead = 0 and Lag = 0 in equation 1.”
Olschewski, P., Dieng, D., Moutahir, H., Böker, B., Haas, E., Kunstmann, H. G., & Laux, P. (2024) · Natural hazards and earth system sciences · doi:10.5194/nhess-24-1099-2024 · Cited by 16
“Within EQM, the cumulative distribution function (CDF) F of the raw model output m within a historical calibration period c is matched to the corresponding CDF of the reference data (e.g. reanalysis) o within c , given as by Gudmundsson et al. (2012) and Tong et al. (2021).”
MethodBaghanam, A. H., Nourani, V., Bejani, M., & Ke, C. (2024) · Journal of Water and Climate Change · doi:10.2166/wcc.2024.592 · Cited by 17
A non-stationary climate-informed weather generator for assessing future flood risks
Dũng, N. V., Vorogushyn, S., Nissen, K. M., Brunner, L., & Merz, B. (2024) · Advances in statistical climatology, meteorology and oceanography · doi:10.5194/ascmo-10-195-2024 · Cited by 25
“To this end, for each of these cases, we generate 100 realizations of daily time series with the nsRWG conditioned on respective circulation patterns and regional daily mean temperature corrected for bias with respect to ERA5 using quantile mapping (R-package qmap by Gudmundsson et al. (2012)).”
Efficient photovoltaic power prediction to achieve carbon neutrality in China
Gao, J., Huang, W., & Qian, Y. (2025) · Energy Conversion and Management · doi:10.1016/j.enconman.2025.119653 · Cited by 16
Alharbi, R. S., Hsu, K., & Sorooshian, S. (2018) · Arabian Journal of Geosciences · doi:10.1007/s12517-018-3860-4 · Cited by 16
Collados‐Lara, A., Pulido‐Velazquez, D., Gómez-Gómez, J.-D.-D., & Pardo‐Igúzquiza, E. (2022) · Natural hazards and earth system sciences · doi:10.5194/nhess-22-599-2022 · Cited by 15
“We used the open-source R package qmap (Gudmundsson et al., 2012).”
MethodInfluentialBasantes-Serrano, R., Rabatel, A., Francou, B., Vincent, C., Soruco, Á., Condom, T., & Ruiz, J. C. (2022) · The Cryosphere · doi:10.5194/tc-16-4659-2022 · Cited by 14
“To define the function, we applied a non-parametric transformation termed QUANT in the R package qmap (Gudmundsson et al., 2012).”
MethodSeasonal forecasting of snow resources at Alpine sites
Terzago, S., Bongiovanni, G., & von Hardenberg, J. (2023) · Hydrology and earth system sciences · doi:10.5194/hess-27-519-2023 · Cited by 20
“First, daily precipitation seasonal forecasts have been adjusted by applying quantile mapping (Gudmundsson et al., 2012; Perez-Zanon et al., 2021) on a monthly basis, using the ERA5 total precipitation data upscaled to 1 as a reference dataset.”
Potential changes in climate indices in Alberta under projected global warming of 1.5–5 °C
Eum, H., Fajard, B., Tang, T., & Gupta, A. (2023) · Journal of Hydrology Regional Studies · doi:10.1016/j.ejrh.2023.101390 · Cited by 23
Akhter, J., Das, L., Meher, J. K., & Deb, A. (2017) · Climate Dynamics · doi:10.1007/s00382-017-3847-y · Cited by 16
Climate change and vine protection : the case of mildews management in Burgundy
Zito, S., Caffarra, A., Richard, Y., Castel, T., & Bois, B. (2018) · E3S Web of Conferences · doi:10.1051/e3sconf/20185001006 · Cited by 7
Vieira, J., Cunha, M. D. C., & Luís, R. (2018) · Water Resources Management · doi:10.1007/s11269-018-2153-8 · Cited by 15
“Gudmundsson et al. (2012) reviewed that a common approach is to use empirical CDF of observed and modelled values instead of assuming parametric distributions in the adjustment of precipitation and temperature projections.”
MethodFuture climate emulations using quantile regressions on large ensembles
Haugen, M. A., Stein, M. L., Sriver, R. L., & Moyer, E. J. (2019) · Advances in statistical climatology, meteorology and oceanography · doi:10.5194/ascmo-5-37-2019 · Cited by 15
“There are two fundamental approaches to combining model output and observations to simulate future climate: bias correction, which adjusts future model output based on the difference between present model output and observations, and delta change, which adjusts present observations based on the difference between pres…”
BackgroundEvaluating quantile-based bias adjustment methods for climate change scenariosPreprint
Lehner, F., Nadeem, I., & Formayer, H. (2021) · doi:10.5194/hess-2021-498 · Cited by 15
“Cannon et al. (2015) and Gudmundsson et al. (2012) also prefer the empirical QM. Themeßl et al. (2012) point out that parametric QM can introduce new biases, because the distribution of a meteorological variable is not fully known and also depends on the region and season.”
BackgroundNaga Sowjanya, P., Keesara, V. R., Mesapam, S., Das, J., & Sridhar, V. (2022) · Climate · doi:10.3390/cli10120190 · Cited by 15
Chakri, A., Abakarim, S., Rodrigues, J. A., Laftouhi, N., Ibouh, H., Zouhri, L., & Zaitseva, E. (2025) · Atmosphere · doi:10.3390/atmos16111234 · Cited by 16
Behaviour of energy piles under climate-change scenarios: a case study in Southern Italy
Adinolfi, M., Rianna, G., Mercogliano, P., Maiorano, R. M. S., & Aversa, S. (2020) · Environmental Geotechnics · doi:10.1680/jenge.19.00093 · Cited by 14
Sharma, A., Mehrotra, R., & Kusumastuti, C. (2023) · Journal of Water and Climate Change · doi:10.2166/wcc.2023.230 · Cited by 15
Ahn, K., de Padua, V. M. N., Kim, J. H., & Yi, J. (2023) · Journal of Hydrology · doi:10.1016/j.jhydrol.2023.130406 · Cited by 15
Rohith, A. N., & Cibin, R. (2024) · Theoretical and Applied Climatology · doi:10.1007/s00704-024-04965-z · Cited by 15
“Several bias correction methods have been used in the past, such as linear scaling, linear, power, and advanced regression transformations (Gudmundsson et al. 2012), empirical and distribution-based quantile mapping (Boé et al. 2007; Enayati et al. 2021), and advanced moments scaling (Anthanahalli…”
Okirya, M., & du Plessis, J. A. (2025) · Hydrology · doi:10.3390/hydrology12050113 · Cited by 14
“This overfitting and poor performance of the PR method has also be noted by previous researchers such as [23,58], which undermines its practical accuracy, making it less reliable despite its favorable statistical metrics.”
Lakhanpal, A., Sehgal, V., Rathinasamy, M., Khosa, R., & Sridhar, V. (2017) · Stochastic Environmental Research and Risk Assessment · doi:10.1007/s00477-017-1444-6 · Cited by 15
Yuan, Q., Thorarinsdottir, T. L., Beldring, S., Wong, W. K., Huang, S., & Xu, C. (2019) · Journal of Applied Meteorology and Climatology · doi:10.1175/jamc-d-19-0086.1 · Cited by 14
Ciupak, M., Ozga-Zieliński, B., Adamowski, J., Deo, R. C., & Kochanek, K. (2019) · Water · doi:10.3390/w11102138 · Cited by 14
“Generally, the correction methods applied to meteorological data fall into four main categories [49]: (i) Methods based upon simple changes in data attributes/values [5]; (ii) parametric transformations [6,50,51]; (iii) non-parametric transformations [11,52]; and (iv) distribution-derived transformations [8,36,53–55].”
BackgroundMethodA new approach to explore climate change impact on rainfall intensity–duration–frequency curves
Soltani, S., Almasi, P., Helfi, R., Modarres, R., Isfahani, P. M., & dehno, M. G. (2020) · Theoretical and Applied Climatology · doi:10.1007/s00704-020-03309-x · Cited by 14
“The time series is modified independently by the standard quantile mappingmethod for each time scale (Gudmundsson et al. 2012).”
BackgroundMethodMulti‐Proxy, Multi‐Season Streamflow Reconstruction With Mass Balance Adjustment
Nguyen, H. T. T., Galelli, S., Xu, C., & Buckley, B. M. (2021) · Water Resources Research · doi:10.1029/2020wr029394 · Cited by 14
Multiscale assessments of hydroclimatic modelling uncertainties under a changing climate
Oyerinde, G. T., Lawin, A. E., & Anthony, T. (2022) · Journal of Water and Climate Change · doi:10.2166/wcc.2022.266 · Cited by 14
“The quantile mapping bias correction (Gudmundsson et al. 2012; Ravazzani et al. 2016; Enayati et al. 2021) was used to improve the CMIP5 temperature and rainfall data.”
MethodMontenegro, M., Campozano, L., Flores, D. U., Maisincho, L., Vincenti, S. S., & Borbor-Cordova, M. J. (2022) · Frontiers in Earth Science · doi:10.3389/feart.2021.794602 · Cited by 18
“Afterward, the simulations by WGCM data were corrected using empirical adjustment of variables by quantiles, using the library QMAP (Gudmundsson et al., 2012).”
MethodInfluentialMundetia, N., Sharma, D., Sharma, A., Dubey, S. K., Mitra, B. K., Dasgupta, R., & Jeong, H. (2023) · Anthropocene · doi:10.1016/j.ancene.2023.100373 · Cited by 15
Spellman, P., Webster, V. L., & Watkins, D. (2018) · Journal of Flood Risk Management · doi:10.1111/jfr3.12342 · Cited by 15
“Large values of ϵ could increase the potential of overcorrecting for a bias at specified rank probability (Gudmundsson et al., 2012).”
BackgroundMethodIntra- and interannual streamflow variations of Wardha watershed under changing climate
., N. S. P., Venkata Reddy, K., & Mesapam, S. (2018) · ISH Journal of Hydraulic Engineering · doi:10.1080/09715010.2018.1473057 · Cited by 14
“Nonparametric quantile mapping using the empirical quantiles bias-correction method proposed by Gudmundsson et al. (2012) has been adopted for precipitation data bias-correction.”
MethodSensitivities of heat-wave mortality projections: Moving towards stochastic model assumptions
Abadie, L. M., & Polanco-Martínez, J. M. (2021) · Environmental Research · doi:10.1016/j.envres.2021.111895 · Cited by 14
Copula‐based downscaling of daily precipitation fields
Lorenz, M., Bliefernicht, J., Haese, B., & Kunstmann, H. G. (2018) · Hydrological Processes · doi:10.1002/hyp.13271 · Cited by 15
Integrating seasonal forecasts into real-time drought management: Júcar River Basin case study
Suárez-Almiñana, S., Andreu, J., Solera, A., & Madrigal, J. (2022) · International Journal of Disaster Risk Reduction · doi:10.1016/j.ijdrr.2021.102777 · Cited by 13
Singhal, A., Cheriyamparambil, A., Samal, N., & Jha, S. (2022) · Journal of Hydrology · doi:10.1016/j.jhydrol.2022.128795 · Cited by 13
Yang, C., Ceglar, A., Menz, C., Martins, J., Fraga, H., & Santos, J. A. (2023) · Agricultural and Forest Meteorology · doi:10.1016/j.agrformet.2023.109342 · Cited by 15
Zhang, M., Guo, Z., Dong, G., & Tan, J. (2023) · Advances in Climate Change Research · doi:10.1016/j.accre.2023.09.001 · Cited by 13
Application of Wavelet Transform for Bias Correction and Predictor Screening of Climate Data
Baghanam, A. H., Nourani, V., Norouzi, E., Vakili, A. T., & Gökçekuş, H. (2023) · Sustainability · doi:10.3390/su152115209 · Cited by 13
Kwak, J., Kim, J., Lee, H., Kim, S., Kim, S., & Kang, M. (2023) · Journal of Hydrology · doi:10.1016/j.jhydrol.2023.130463 · Cited by 13
Mainali, S., & Sharma, S. (2023) · Water · doi:10.3390/w15234063 · Cited by 13
Sarkar, S., & Maity, R. (2024) · International Journal of Climatology · doi:10.1002/joc.8348 · Cited by 14
“Thus, the method becomes free from any parametric assumption, and hence is expected to yield better results (Gudmundsson et al., 2012).”
BackgroundA variance-upscaling quantile mapping method for gridded precipitation bias correction
Ma, J., Wang, G., & Li, H. (2024) · Journal of Hydrology · doi:10.1016/j.jhydrol.2024.130959 · Cited by 16
Abate, B. Z., Alaminie, A. A., Assefa, T. T., Tigabu, T. B., & He, L. R. (2024) · Journal of Hydrology Regional Studies · doi:10.1016/j.ejrh.2024.101756 · Cited by 23
Distribution-based pooling for combination and multi-model bias correction of climate simulations
Vrac, M., Allard, D., Mariethoz, G., Thao, S., & Schmutz, L. (2024) · Earth System Dynamics · doi:10.5194/esd-15-735-2024 · Cited by 13
“It consists of a quantile mapping technique (e.g. Panofsky and Brier, 1968; Haddad and Rosenfeld, 1997; Déqué, 2007; Gudmundsson et al., 2012) allowing accounting Rp Rc Mc Mp”
Nguyen, N. Y., Anh, T. N., Nguyen, H. D., & Dang, D. K. (2024) · Journal of Hydroinformatics · doi:10.2166/hydro.2024.225 · Cited by 13
Temperature extremes Projections over Bangladesh from CMIP6 Multi-model Ensemble
Akter, M. Y., Islam, A. R. M. T., Mallick, J., Alam, M. M., Alam, E., Shahid, S., Biswas, J. C., Alam, G. M. M., Pal, S. C., & Oliver, M. M. H. (2024) · Theoretical and Applied Climatology · doi:10.1007/s00704-024-05173-5 · Cited by 15
“Non parametric transformation approaches were used over parametric ones as they exhibited better skills in reducing biases from GCM model outcomes than parametric ones (Gudmundsson et al. 2012).”
A fuzzy framework for risk analysis of dam-break flood in climate change scenarios
Goel, A., & Srinivas, V. V. (2025) · International Journal of Disaster Risk Reduction · doi:10.1016/j.ijdrr.2025.105322 · Cited by 16
Piniewski, M., Szcześniak, M., & Kardel, I. (2017) · Data · doi:10.3390/data2020014 · Cited by 13
“Selected simulations consisted of combinations of four GCMs with four RCMs and were bias-corrected using the quantile mapping method (R package ‘qmap’ developed by the Norwegian Meteorological Institute, [22]).”
MethodAvilés, Á., Palacios, K., Pacheco, J., Jiménez, S., Zhiña, D., & Delgado-Inga, O. (2020) · Theoretical and Applied Climatology · doi:10.1007/s00704-020-03219-y · Cited by 15
“To downscale the regional climate model (RCM) outputs to a station scale, statistical transformations were used (Gudmundsson et al. 2012).”
MethodModeling climate change impact on the hydropower potential of the Bamboi catchment
Mutsindikwa, T. C., Yira, Y., Bossa, A. Y., Hounkpè, J., Salack, S., Saley, I. A., & Adamou, R. (2020) · Modeling Earth Systems and Environment · doi:10.1007/s40808-020-01052-w · Cited by 13
Hewer, M. J., Beech, N., & Gough, W. A. (2021) · Theoretical and Applied Climatology · doi:10.1007/s00704-021-03581-5 · Cited by 13
“This could be explained by the parametric nature of the SDSM modelling approach (Wilby et al. 2002) compared with the nonparametric quantile mapping approach of PCIC (Gudmundsson et al. 2012; Hunter and Meentemeyer 2005).”
MethodChang, J., Hart, D. R., Munroe, D. M., & Curchitser, E. (2021) · Journal of Geophysical Research Oceans · doi:10.1029/2020jc017140 · Cited by 13
Das, S., Das, J., & Umamahesh, N. V. (2021) · Stochastic Environmental Research and Risk Assessment · doi:10.1007/s00477-021-02073-2 · Cited by 14
Marcos-Garcia, P., Pulido-Velázquez, M., Sanchis-Ibor, C., García-Mollá, M., Ortega-Reig, M., García-Prats, A., & Girard, C. (2023) · Climatic Change · doi:10.1007/s10584-023-03501-8 · Cited by 10
Singh, D., Choi, Y., Dimri, R., Ghahremanloo, M., & Pouyaei, A. (2023) · Asia-Pacific Journal of Atmospheric Sciences · doi:10.1007/s13143-023-00330-8 · Cited by 14
“Various bias correction studies have already been done for GCMs and RCMs output (Choudhary and Dimri 2019; Gudmundsson et al. 2012; Gutjahr and Heinemann 2013; Prasanna 2018; Salvi et al. 2011; Singh et al. 2017; Piani et al. 2010).”
BackgroundFlitcroft, R. L., Lewis, S. L., Arismendi, I., Davis, C. D., Giannico, G., Penaluna, B. E., Santelmann, M. V., Safeeq, M., & Snyder, J. (2019) · Aquatic Conservation Marine and Freshwater Ecosystems · doi:10.1002/aqc.3014 · Cited by 15
Bias-corrected high-resolution temperature and precipitation projections for Canada
Abdelmoaty, H., Rajulapati, C. R., Nerantzaki, S. D., & Papalexiou, S. M. (2025) · Scientific Data · doi:10.1038/s41597-025-04396-z · Cited by 16
Next-Generation Drought Forecasting: Hybrid AI Models for Climate Resilience
Liu, J., Tie, L., Huang, L., Ren, Y., & He, P. (2025) · Remote Sensing · doi:10.3390/rs17203402 · Cited by 19
Pulido‐Velazquez, D., Baena-Ruíz, L., Mayor, B., Zorrilla‐Miras, P., López‐Gunn, E., Gómez-Gómez, J.-D.-D., Portillo, Á. D. L. H., Collados‐Lara, A., Moreno, M. M., García-Aróstegui, J. L., et al. (2023) · The Science of The Total Environment · doi:10.1016/j.scitotenv.2023.161905 · Cited by 15
“Another assumption is that local scenarios can be generated from global/regional projections by using statistical downscaling approaches in accordance with the historical information (Gudmundsson et al., 2012).”
BackgroundClimate change impact on groundwater resources in sandbar aquifers in southern Baltic coast
Gumuła-Kawęcka, A., Jaworska‐Szulc, B., & Jefimow, M. (2024) · Scientific Reports · doi:10.1038/s41598-024-62522-0 · Cited by 12
Semiromi, M. T., & Koch, M. (2024) · Theoretical and Applied Climatology · doi:10.1007/s00704-024-05033-2 · Cited by 17
“The practical formidable problem of QM is to find a good approximation (transfer Different methods have been provided in the literature to find an appropriate h (Gudmundsson et al. 2012).”
Hendrawan, V. S. A., Mawandha, H. G., Sakti, A. D., Karlina, Andika, N., Shahid, S., & Jayadi, R. (2024) · International Journal of Climatology · doi:10.1002/joc.8537 · Cited by 15
“Various statistical approaches are developed to correct the bias in climate change projections based on distribution-derived transformations, parametric transformations and nonparametric transformations (Gudmundsson et al., 2012).”
Huang, B., Liu, Z., Duan, Q., Rajib, A., & Yin, J. (2024) · Environmental Research Letters · doi:10.1088/1748-9326/ad66e6 · Cited by 17
“Among these, Quantile Mapping is particularly favored for its efficiency in enhancing variable distributions (Gudmundsson et al 2012, Vrac et al 2012).”
Méndez-Morales, M., Calvo-Valverde, L.-A., Hidalgo-Madriz, J.-A., & Araya-Obando, J.-A. (2024) · Water · doi:10.3390/w16233473 · Cited by 15
Michel, A., Aschauer, J., Jonas, T., Gubler, S., Kotlarski, S., & Marty, C. (2024) · Geoscientific model development · doi:10.5194/gmd-17-8969-2024 · Cited by 13
Assessment of Future Rainfall Quantile Changes in South Korea Based on a CMIP6 Multi-Model Ensemble
Kim, S., Shin, J., & Heo, J. (2025) · Water · doi:10.3390/w17060894 · Cited by 12
“Non-parametric Quantile Mapping differs from the basic approach by avoiding assumptions about specific probability distributions, instead relying on empirical distributions [47].”
Li, M., Chen, S., Hao, F., Wang, N., Wu, Z., Xu, Y., Zhang, J., Zhang, Y., & Fu, Y. H. (2025) · Hydrology and earth system sciences · doi:10.5194/hess-29-2081-2025 · Cited by 12
“…using linear interpolation Then, the CMFD was employed as the reference to correct the bias in CMIP6 models using the empirical mapping technique (Gudmundsson et al., 2012; Wilcke et al., 2013) Daily empirical cumulative distribution functions for the calibration period were produced using a…”
Modelling of climate change impact on flow conditions in the lowland anastomosing river
Marcinkowski, P., & Mirosław‐Świątek, D. (2020) · PeerJ · doi:10.7717/peerj.9275 · Cited by 13
“All bias-corrected values (quantile mapping method by Norwegian Meteorological Institute (Gudmundsson et al., 2012)) of precipitation and air temperature were available for three time slices: 1971–2000 (historical period), 2021–2050 (near future—NF), and 2071–2100 (far future—FF).”
MethodBias Correction of GCM Data Using Quantile Mapping Technique
Panjwani, S., Kumar, S. N., & Ahuja, L. (2020) · Algorithms for intelligent systems · doi:10.1007/978-981-15-5077-5_55 · Cited by 13
Qiu, L., Im, E., Min, S., Kim, Y.-H., Cha, D., Shin, S.-W., Ahn, J., Chang, E., & Byun, Y. (2023) · Earth System Dynamics · doi:10.5194/esd-14-507-2023 · Cited by 12
Zito, S., Pergaud, J., Richard, Y., Castel, T., Roux, R. L., Atauri, I. G. D. C., Quénol, H., & Bois, B. (2023) · OENO One · doi:10.20870/oeno-one.2023.57.2.7441 · Cited by 12
“In total, data from 19 GCMs (listed in supplementary data) were statistically downscaled and debiased to SAFRAN’s 8 km resolution grid using the quantile mapping method (Gudmundsson et al., 2012).”
MethodReservoir Reliability as Affected by Climate Change and Strategies for Adaptation
Chaves, H. M. L., da Silva, C. C., & Fonseca, M. R. S. (2023) · Water · doi:10.3390/w15132323 · Cited by 12
“The parametric bias-correction equation was [31]:”
MethodPaz, S. M., & Willems, P. (2023) · Journal of Hydrology Regional Studies · doi:10.1016/j.ejrh.2023.101477 · Cited by 13
Biagio, V. D., Martellucci, R., Menna, M., Teruzzi, A., Amadio, C., Mauri, E., & Cossarini, G. (2023) · State of the Planet · doi:10.5194/sp-1-osr7-10-2023 · Cited by 18
Climate change in the Biebrza Basin—Projections and ecohydrological implications
Marcinkowski, P., Piniewski, M., Grygoruk, M., & Mirosław‐Świątek, D. (2024) · Ecohydrology & Hydrobiology · doi:10.1016/j.ecohyd.2024.04.006 · Cited by 12
A Framework for Assessment of Climate Change Impacts on Groundwater System Formations
Subash, Y., Sekhar, M., Tomer, S. K., & Sharma, A. K. (2017) · American Society of Civil Engineers eBooks · doi:10.1061/9780784414767.ch14 · Cited by 12
Tumon, M. S. H., Imran, H. M., Fai, C. M., Zahidi, I., Ahmed, F., Islam, M. S., Islam, M. R., & Hafez, M. (2025) · Results in Engineering · doi:10.1016/j.rineng.2025.108067 · Cited by 11
Impact of Climate Change on Phenology of Two Heat-Resistant Wheat Varieties and Future Adaptations
Ishtiaq, M., Maqbool, M., Muzamil, M., Casini, R., Alataway, A., Dewidar, A., El-Sabrout, A., & Elansary, H. (2022) · Plants · doi:10.3390/plants11091180 · Cited by 11
“, exhibited that wheat varieties with enhanced thermal capacity (heat stress) during grain filling from 34 °C to 36 °C would be beneficial for offsetting the negative effects of climatic warming [25,26].”
BackgroundMethodChanging compound rainfall events in Tasmania
Earl, N., Remenyi, T., King, A. D., Love, P. T., Rollins, D., & Harris, R. M. B. (2022) · International Journal of Climatology · doi:10.1002/joc.7791 · Cited by 11
“In this project we use the “empirical quantiles” statistical transformation described by Gudmundsson et al. (2013), which has been widely used for adjusting modelled rainfall.”
MethodSpatial patterns and temporal dynamics of drought in southern Ethiopia from 1981 to 2100
Mena, M. M., Kenea, T. T., & Yate, T. A. (2023) · International Journal of Climatology · doi:10.1002/joc.8262 · Cited by 11
Impacts of Climate Change on Temperature and Precipitation in Nepal: Projections and Bias Correction
Dhital, H. P., Joshi, M., & Budhathoki, N. (2023) · Journal of sustainability and environmental management · doi:10.3126/josem.v2i4.61020 · Cited by 12
Hammad, Z., & Chung, . (2024) · Theoretical and Applied Climatology · doi:10.1007/s00704-024-04949-z · Cited by 11
“The observed and simulated times series are fitted in a quantile-to-quantile way (1) using the smoothing spline (sspline) method of the non-parametric transformation (Gudmundsson et al. 2012; Kouhestani et al. 2016).”
Bright, R. M., Cattaneo, N., Antón‐Fernández, C., Eisner, S., & Astrup, R. (2024) · Environmental Research Letters · doi:10.1088/1748-9326/ad657e · Cited by 12
“The raw EURO-CORDEX data in their 11 km spatial resolution were first subjected to a one-step downscaling and bias-correction procedure— executed at the daily temporal resolution—based on the quantile mapping method [45].”
Ascenso, G., Ficchì, A., Giuliani, M., Scoccimarro, E., & Castelletti, A. F. (2024) · Weather and Climate Extremes · doi:10.1016/j.wace.2024.100724 · Cited by 15
Wu, M., Ni, F., Deng, Y. H., Jiang, N., Zhu, M., Ren, H., Yue, Z., & Wang, Y. (2024) · Ecological Indicators · doi:10.1016/j.ecolind.2024.112941 · Cited by 14
Woldemariam, Y. A., Woldesenbet, T. A., & Alamirew, T. (2025) · Theoretical and Applied Climatology · doi:10.1007/s00704-025-05356-8 · Cited by 14
“In hydro-climatic impact studies, numerous approaches of bias correction techniques have been employed (e.g., Gudmundsson et al. 2012; Teutschbein and Seibert 2012; Canon 2018).”
Quantile-Based Approach for Improving the Identification of Preferential Groundwater Networks
Schiavo, M. (2025) · Water · doi:10.3390/w17020282 · Cited by 11
Maharjan, K. R., Bhattarai, U., Bhattarai, P. K., & Devkota, L. P. (2025) · Theoretical and Applied Climatology · doi:10.1007/s00704-025-05378-2 · Cited by 12
“The transformation functions (Dosio and Paruolo 2011; Enayati et al. 2021; Gudmundsson 2016; Gudmundsson et al. 2012) used for the study include: Linear: Scale: Power: (3) Exponential tendency to an asymptote: where P o and P m represent the CDFs of the observed and modelled data, respectively.”
Allard, D., Vrac, M., François, B., & Atauri, I. G. D. C. (2025) · Hydrology and earth system sciences · doi:10.5194/hess-29-4711-2025 · Cited by 13
“2 Data, models and bias correction methods”
Yoon (2014) · Journal of the Korean Society of Civil Engineers · doi:10.12652/ksce.2014.34.4.1125 · Cited by 11
Boulard, D., Castel, T., Camberlin, P., Sergent, A.-S., Asse, D., Bréda, N., Badeau, V., Rossi, A., & Pohl, B. (2016) · Agricultural and Forest Meteorology · doi:10.1016/j.agrformet.2016.08.021 · Cited by 13
Reder, A., Rianna, G., Vezzoli, R., & Mercogliano, P. (2016) · Advances in Climate Change Research · doi:10.1016/j.accre.2016.09.002 · Cited by 11
Superensembles of raw and bias‐adjusted regional climate models for Mediterranean region, Turkey
Mesta, B., & Kentel, E. (2021) · International Journal of Climatology · doi:10.1002/joc.7381 · Cited by 13
Hydrologic characterization of the Upper Ayeyarwaddy River Basin and the impact of climate change
Gurung, P., Dhungana, S., Kyaw, A. K., & Bharati, L. (2022) · Journal of Water and Climate Change · doi:10.2166/wcc.2022.407 · Cited by 11
Impact of Extreme Heatwaves on Population Exposure in China Due to Additional Warming
Wang, L., Rohli, R. V., Lin, Q., Jin, S., & Yan, X. (2022) · Sustainability · doi:10.3390/su141811458 · Cited by 12
Sundaram, G., & Radhakrishnan, S. (2022) · KSCE Journal of Civil Engineering · doi:10.1007/s12205-022-0151-0 · Cited by 11
Maxwell, J. T., Harley, G. L., Tucker, C. S., Galuska, T., Ficklin, D. L., Bregy, J. C., Heeter, K. J., Au, T. F., Lockwood, B. R., King, D. J., et al. (2022) · Geophysical Research Letters · doi:10.1029/2022gl100742 · Cited by 12
Metadata
- Authors
- Gudmundsson, L., Bremnes, J. B., Haugen, J. E., & Engen-Skaugen, T.
- Affiliations
- Norwegian Meteorological Institute (NO)
- Venue
- Hydrology and Earth System Sciences
- Publisher
- Copernicus GmbH
- Published
- 2012-09-21
- Volume
- 16
- Issue
- 9
- Pages
- 3383-3390
- ISSN
- 1027-5606 (ISSN-L)
- 1607-7938
- OpenAlex
- W2166535858
- Cited by
- 1,318
- References
- 41
- Citations by year
- 2026: 132 · 2025: 134 · 2024: 124 · 2023: 136 · 2022: 137 · 2021: 172 · 2020: 116 · 2019: 85 · 2018: 76 · 2017: 68 · 2016: 63 · 2015: 35 · 2014: 20 · 2013: 17 · 2012: 3
- FWCI
- 20.14
- Type
- journal article
- Language
- en
- Open access
- gold
- doi.org
- Licence
- Locations
- Hydrology and earth system sciences (publishedVersion, cc-by)
- DOAJ (DOAJ: Directory of Open Access Journals) (submittedVersion)
- Repository for Publications and Research Data (ETH Zurich) (submittedVersion, cc-by)
- ETH Zürich Research Collection (cc-by)
- Topics
- Physical Sciences › Environmental Science › Global and Planetary Change › Climate variability and models
- Physical Sciences › Earth and Planetary Sciences › Atmospheric Science › Precipitation Measurement and Analysis
- Physical Sciences › Environmental Science › Water Science and Technology › Hydrology and Watershed Management Studies
- Keywords
- dynamical downscaling, precipitation bias correction, statistical post-processing, parametric transformation, climate change impacts on water resources
About these checks
Registry, retraction, Cites and statistics results are computed, not judged, with one exception: a printed reference that no index lists is read once by a model before it counts as a citation error. Claims are extracted by a model and kept only when their quote appears verbatim in the text; each cited source is then checked, with a model’s help, for whether it says what the claim relies on. Those verdicts can be wrong — read the claim’s quote and the cited source before relying on one.
Statistics and arithmetic are recomputed, not judged.
Confidence bands are shown only for fields calibrated on our annotated test set. None is calibrated yet, so no band is shown.
What counts as a claim ›How we measure confidence ›How we check this ›
Are you an author, or do you see a problem with this page? Request a review
Data sources
Bibliographic data: Semantic Scholar, OpenAlex, Crossref.
Contains information from the Semantic Scholar Academic Graph Datasets, made available under the ODC Attribution License (ODC-BY 1.0).
Semantic Scholar’s data is described in: Kinney, R., et al. (2023). The Semantic Scholar Open Data Platform. arXiv:2301.10140.
