

Technical Note: Downscaling RCM precipitation to the station scale using statistical transformations—A comparison of methods
Open accessPublished version of a preprint
The DOI matches its Crossref record; 41 of the 41 references it cites were found in a registry or an index.
Abstract
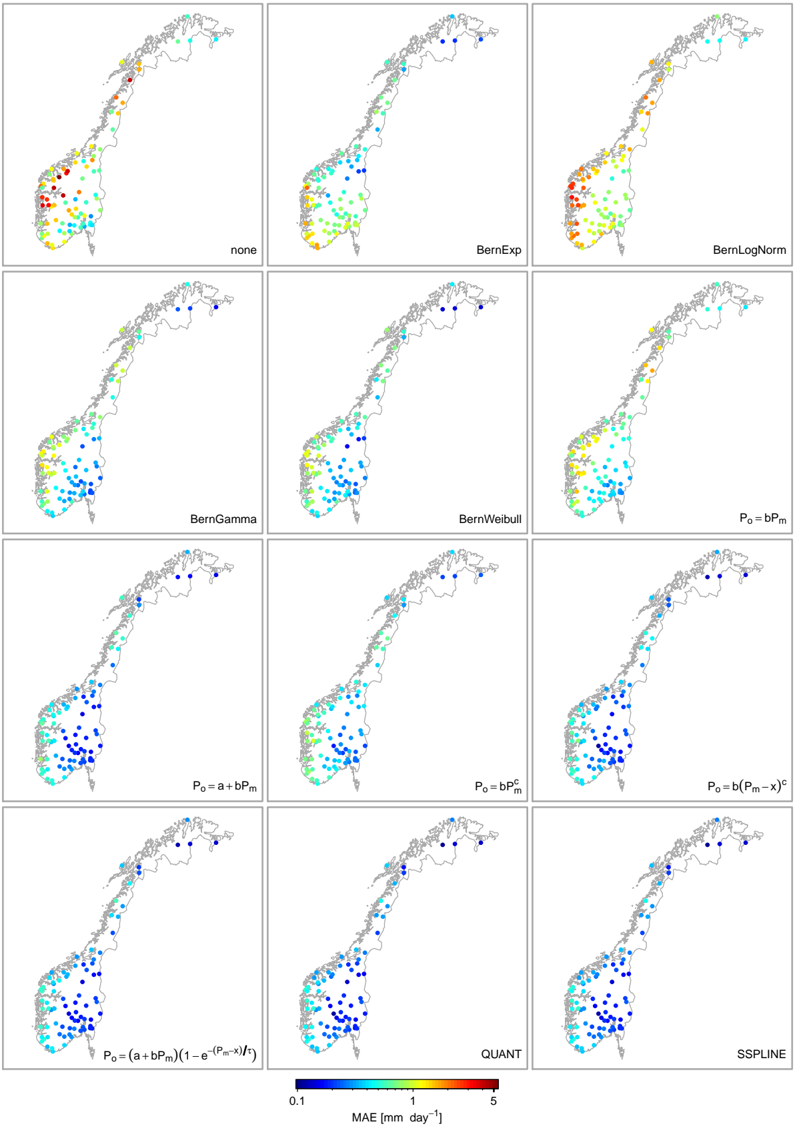
The impact of climate change on water resources is usually assessed at the local scale. However, regional climate models (RCMs) are known to exhibit systematic biases in precipitation. Hence, RCM simulations need to be post-processed in order to produce reliable estimates of local scale climate. Popular post-processing approaches are based on statistical transformations, which attempt to adjust the distribution of modelled data such that it closely resembles the observed climatology. However, the diversity of suggested methods renders the selection of optimal techniques difficult and therefore there is a need for clarification. In this paper, statistical transformations for post-processing RCM output are reviewed and classified into (1) distribution derived transformations, (2) parametric transformations and (3) nonparametric transformations, each differing with respect to their underlying assumptions. A real world application, using observations of 82 precipitation stations in Norway, showed that nonparametric transformations have the highest skill in systematically reducing biases in RCM precipitation.
Overview
The claims and statistics of this paper haven’t been checked yet.
Free: it reads the open-access text and checks the first 5 claims that cite a source we can check. Create a free account to check every claim.
Integrity signals
Registry
Cites
Statistics
Figures



Verification
Claims the paper makes
The claims and statistics of this paper haven’t been checked yet.
Free: it reads the open-access text and checks the first 5 claims that cite a source we can check. Create a free account to check every claim.
Claims other papers make about this one
Each is checked against this paper’s own text: does it say what the citing paper says it does?
The source backs part of the claim, not all of it — or backs it for a different population, condition or comparison.
In the citing paper
“Quantile mapping is the most used bias correction technique due to its ease of handling large amounts of data and its computational efficiency [58,59].”
From Climate Change Impacts on Streamflow in the Krishna River Basin, India: Uncertainty and Multi-Site Analysis (2022) · cites this paper as [58]
Experimental — accuracy not yet measured
Self-check
Percentages, sums and reported differences re-computed from the paper’s own numbers.
The self-check needs the paper’s full text.
Citations
Cites
The Elements of Statistical Learning
Hastie, T., Friedman, J., & Tibshirani, R. (2001) · Springer Series in Statistics · doi:10.1007/978-0-387-21606-5 · Cited by 24,162
Uppala, S. M., KÅllberg, P. W., Simmons, A. J., Andrae, U., Bechtold, V. D. C., Fiorino, M., Gibson, J. K., Haseler, J., Hernandez, A., Kelly, G. A., et al. (2005) · Quarterly Journal of the Royal Meteorological Society · doi:10.1256/qj.04.176 · Cited by 6,804 · cited 1×
“Modelled precipitation was extracted from a HIRHAM RCM simulation with 25 km resolution (Førland et al., 2009, 2011) forced with the ERA40 reanalysis (Uppala et al., 2005) on a model domain covering Norway and the Nordic Arctic.”
MethodTeutschbein, C., & Seibert, J. (2012) · Journal of Hydrology · doi:10.1016/j.jhydrol.2012.05.052 · Cited by 2,214 · cited 13×
“, 2011; Teutschbein and Seibert, 2012), the standard deviation (Engen-Skaugen, 2007; Li et al., 2010; Themeßl et al., 2011; Teutschbein and Seibert, 2012) and the skewness (Li et al.”
BackgroundMethodResultInfluentialHydrologic Implications of Dynamical and Statistical Approaches to Downscaling Climate Model Outputs
Wood, A. W., Leung, L. R., Sridhar, V., & Lettenmaier, D. P. (2004) · Climatic Change · doi:10.1023/b:clim.0000013685.99609.9e · Cited by 1,886 · cited 3×
“(2) using the empirical CDF of observed and modelled values instead of assuming parametric distributions (e.g.Panofsky and Brier, 1968; Wood et al., 2004; Reichle and Koster, 2004; Boé et al., 2007; Themeßl et al., 2011, 2012).”
BackgroundMethodMaraun, D., Wetterhall, F., Ireson, A. M., Chandler, R. E., Kendon, E. J., Widmann, M., Brienen, S., Rust, H. W., Sauter, T., Themeßl, M., et al. (2010) · Reviews of Geophysics · doi:10.1029/2009rg000314 · Cited by 1,805 · cited 3×
“Further, “statistical bias correction” (Piani et al., 2010a,b), “direct error correction methods” (Themeßl et al., 2011) and “model output statistics (MOS)” (Maraun et al., 2010) have been used to refer to the methods under investigation.”
MethodStatistical bias correction for daily precipitation in regional climate models over Europe
Piani, C., Haerter, J. O., & Coppola, E. (2010) · Theoretical and Applied Climatology · doi:10.1007/s00704-009-0134-9 · Cited by 1,154 · cited 9×
“…a set of scores is needed that quantifies the similarity of the observed and the (corrected) modelled empirical CDF. Previously used scores include overall measures, such as the root mean square error (Piani et al., 2010b) or the Kolmogorov-Smirnov two sample statistic (Dosio and Paruolo, 2011).”
BackgroundMethodInfluentialSome applications of statistics to meteorology
Panofsky, H. A., Brier, G. W., & Best, W. H. (1958) · University of Michigan Library Repository · Cited by 1,083
Li, H., Sheffield, J., & Wood, E. F. (2010) · Journal of Geophysical Research: Atmospheres · doi:10.1029/2009jd012882 · Cited by 901 · cited 6×
“Other suggested scores assess specific moments of the distribution including the mean (Engen-Skaugen, 2007; Li et al., 2010; Dosio and Paruolo, 2011; Themeßl et al., 2011; Turco et al., 2011; Teutschbein and Seibert, 2012), the standard deviation (Engen-Skaugen, 2007; Li et al., 2010; Themeßl et…”
BackgroundMethodInfluentialHow Well Do Coupled Models Simulate Today's Climate?
Reichler, T., & Kim, J. (2008) · Bulletin of the American Meteorological Society · doi:10.1175/bams-89-3-303 · Cited by 881
Piani, C., Weedon, G. P., Best, M., Gomes, S. M., Viterbo, P., Hagemann, S., & Haerter, J. O. (2010) · Journal of Hydrology · doi:10.1016/j.jhydrol.2010.10.024 · Cited by 868 · cited 9×
“…a set of scores is needed that quantifies the similarity of the observed and the (corrected) modelled empirical CDF. Previously used scores include overall measures, such as the root mean square error (Piani et al., 2010b) or the Kolmogorov-Smirnov two sample statistic (Dosio and Paruolo, 2011).”
BackgroundMethodInfluential
Cited by
Items 901–1,000 of 1,001
Cook, L. M., Anderson, C., & Samaras, C. (2017) · doi:10.31224/osf.io/kdhb7 · Cited by 5
Future Climate Changes on the Qinghai–Tibetan Plateau Under CMIP6 Global Climate Models
Karim, R., Li, S., Su, T., Ayugi, B. O., Babaousmail, H., & Xiao, S. (2025) · International Journal of Climatology · doi:10.1002/joc.70005 · Cited by 5
Dioha, E. C., Chung, ., Ayugi, B. O., & Babaousmail, H. (2025) · International Journal of Climatology · doi:10.1002/joc.8930 · Cited by 4
“To this end, efforts have been made to improve the quality of GCMs and enhance reliability in projections by employing approaches such as bias corrections (Murphy 1999; Gudmundsson et al. 2012) or employing dynamical or statistical downscaling approaches to improve the performance of GCMs.”
Botero, B. A., Parra, J. C., Benavides, J. M., Olmos-Severiche, C., Vásquez-Salazar, R. D., Quintero, J. C. V., Mateus, S., Díaz-Paz, J. P., Diez-Rendón, L., García, A. F., et al. (2025) · Hydrology · doi:10.3390/hydrology12110281 · Cited by 4
“To adjust the raw outputs to local conditions, daily bias correction was performed using the Empirical Quantile Mapping (EQM) technique [38–41].”
Modeling urban planning contributions to flood resilience under shared socioeconomic pathways
Feng, W., Liu, Y., Zhu, A., Mao, J., Sun, T., Xu, Q., Yang, Y., Su, H., Wu, W., Yang, Q., et al. (2026) · npj Urban Sustainability · doi:10.1038/s42949-026-00353-w · Cited by 8
Ndou, N. N., Nontongana, N., Thamaga, K. H., & Afuye, G. A. (2024) · Water · doi:10.3390/w16213052 · Cited by 4
Assessment of subseasonal streamflow predictions in a tropical basin
Falck, A. S., Tomasella, J., Diniz, F. L. R., & Maggioni, V. (2024) · Journal of Hydrology · doi:10.1016/j.jhydrol.2024.132488 · Cited by 6
Rutkowska, A., Willems, P., Paz, S. M., & Ziernicka‐Wojtaszek, A. (2025) · International Journal of Climatology · doi:10.1002/joc.8822 · Cited by 5
“Among them, the quantile-based perturbation methods have many advantages (Themeßl et al. 2011; Gudmundsson et al. 2012).”
Krishna, A. B., Kaur, P., Kaur, S., Kaur, H., & SANDHU, S. S. (2025) · Theoretical and Applied Climatology · doi:10.1007/s00704-025-05613-w · Cited by 4
“…parameters such as rainfall, heat wave frequency, etc. Advanced BC technique suitable for stochastic parameters, i.e., quantile mapping techniques (Gudmundsson et al. 2012), scaled distribution techniques (normal and gamma mapping distributions) (Switanek et al. 2017), power transformation (PT),…”
Improving wind power forecasting accuracy through bias correction of wind speed predictions
Spiliotis, E., & Theodorou, E. (2025) · Sustainable Energy Technologies and Assessments · doi:10.1016/j.seta.2025.104599 · Cited by 16
Liu, W., Qi, F., Liang, Y., Cui, Y., Xu, L., & Engel, B. A. (2025) · Journal of Environmental Management · doi:10.1016/j.jenvman.2025.127980 · Cited by 5
Seguini, L., Klisch, A., Meroni, M., Vrieling, A., Manfron, G., Atzberger, C., & Rembold, F. (2026) · Earth system science data · doi:10.5194/essd-18-309-2026 · Cited by 4
Bonalos, E. J. N., Albiento, E. E., Babiera, J. E., Roa-Quiaoit, H. A., Ligaray, C. V., Alas, M. A., Aporador, M. J., & Suson, P. D. (2026) · Atmosphere · doi:10.3390/atmos17020121 · Cited by 4
Regional-scale flood impacts on a small mountainous catchment in Thailand under a changing climate
Rojpratak, S., & Supharatid, S. (2023) · Journal of Water and Climate Change · doi:10.2166/wcc.2023.527 · Cited by 4
Phuong, D., Vu, N., & Loi, N. (2024) · Climate Research · doi:10.3354/cr01736 · Cited by 4
Akhter, J., ROY, S. N., & Midya, S. K. (2024) · Journal of Earth System Science · doi:10.1007/s12040-023-02246-3 · Cited by 4
“The empirical quantile mapping approach has been adopted in the present study, where CDFs of observed and modelled precipitation are estimated using empirical percentiles and values in between the percentiles are approximated using linear interpolation (Gudmundsson et al .”
Investigation of model forecast biases and skilful prediction for Assam heavy rainfall 2022
Vishwakarma, V., Pattnaik, S., Kumar, P., Hazra, V., & JENAMANI, R. K. (2024) · Weather and Climate Extremes · doi:10.1016/j.wace.2024.100678 · Cited by 4
Hoghoughinia, K., Saghafian, B., & Aminyavari, S. (2024) · Theoretical and Applied Climatology · doi:10.1007/s00704-024-05134-y · Cited by 4
“The qmap package in RStudio was utilized to perform QM technique (Gudmundsson et al. 2012).”
Talampas, S. I., & Shrestha, S. (2025) · Journal of Water and Climate Change · doi:10.2166/wcc.2025.546 · Cited by 4
Junttila, V., & Kauranne, T. (2018) · Remote Sensing · doi:10.3390/rs10111677 · Cited by 4
“Histogram matching algorithms are commonly used to process satellite data [19,22], and quantile–quantile mapping transformations are used for bias correction of regional climate models [18,23].”
BackgroundMethodProjected extreme climate indices in the java island using cmip5 models
Putra, I. D. G. A., Rosid, M. S., Sopaheluwakan, A., Ulina, Y. C., Harsa, H., Permana, D. S., & CHO, J.-H. (2019) · IOP Conference Series Earth and Environmental Science · doi:10.1088/1755-1315/363/1/012022 · Cited by 4
Wuthiwongtyohtin, S. (2020) · Journal of Water and Climate Change · doi:10.2166/wcc.2020.021 · Cited by 4
Downscaling, Regional Models and Impacts
Visconti, G. (2021) · Springer eBooks · doi:10.1007/978-3-030-74713-8_2 · Cited by 4
Exploring the Effect of Occurrence-Bias-Adjustment Assumptions on Hydrological Impact Modeling
de Velde, J. V., Demuzere, M., Bernard De Baets, C., & Verhoest, N. E. C. (2021) · Water · doi:10.3390/w13111573 · Cited by 4
“This has become especially clear when comparing the influence of these different families on hydrological time series simulation [19,20].”
BackgroundWang, Y., Jiang, R., Xie, J., Zhu, J., Zhao, Y. B., Lu, X., & Li, F. (2022) · Theoretical and Applied Climatology · doi:10.1007/s00704-022-04157-7 · Cited by 4
Renima, M., Zeroual, A., Hamitouche, Y., Assani, A. A., Zeroual, S., Soltani, A. A., Cedrick, M. M., Taïbi, S., Bouabdelli, S., Kabli, S., et al. (2022) · Climate · doi:10.3390/cli10080123 · Cited by 5
Vizina, A., Vyskoč, P., Kožín, R., & Nováková, H. (2023) · Vodohospodářské technicko-ekonomické informace · doi:10.46555/vtei.2022.11.004 · Cited by 4
“Modelované průtoky pro současnost a výhledová období jsou korigována v jednotlivých měsících pomocí kvantilové metody [17].”
Mallik, P., & Ghosh, T. (2023) · International Journal of Biometeorology · doi:10.1007/s00484-023-02521-4 · Cited by 4
“2012) and quantile mapping (QM) approach (Gudmundsson et al. 2012) were utilized.”
MethodImpacts of climate change on streamflow of Qinglong River, China
Liu, X., & Tang, Z. (2023) · Journal of Water and Climate Change · doi:10.2166/wcc.2023.568 · Cited by 4
Bodjrènou, R., Donatien, A. D., Sintondji, L. O., Bossa, A. Y., Amou, M., Sessou, F., Mampo, O. M. G., Comandan, F., & Sohindji, F. S. (2024) · Theoretical and Applied Climatology · doi:10.1007/s00704-024-05078-3 · Cited by 4
“Less so, they aim to describe the future climate, especially on daily, monthly, and annual time scales (Gudmundsson et al. 2012; Zhao et al. 2017).”
Tadić, J. M., & Biraud, S. C. (2020) · Climate · doi:10.3390/cli8020018 · Cited by 4
“In general, Quantile Mapping methods that rely on non‐parametric mapping between quantiles outperform ones that fit a parametric functional relationship (distribution) to the data [27].”
MethodHanggoro, W., Yuanshu, J., Cudemus, L., & Zhihao, J. (2020) · Water · doi:10.3390/w12020381 · Cited by 4
“Since statistical transformations are the application of the probability integral function, it can be defined as Equation (2) if the distribution of the variable of interest is known [27].”
BackgroundMethodResultInfluentialIntercomparison of statistical downscaling models: a case study of a large-scale river basin
Loganathan, P., & Mahindrakar, A. B. (2021) · Climate Research · doi:10.3354/cr01642 · Cited by 4
Climate change assessment for a small island: a Tahiti downscaling experiment
Hopuare, M., Pontaud, M., Céron, J. ‐., Déqué, M., & Ortéga, P. (2015) · Climate Research · doi:10.3354/cr01298 · Cited by 5
“A comparison of methods is provided by Gudmundsson et al. (2012).”
MethodTuning Extreme NEXRAD and CMORPH Precipitation Estimates
Woody, J., Lund, R., & Gebremichael, M. (2014) · Journal of Hydrometeorology · doi:10.1175/jhm-d-13-0146.1 · Cited by 4
An improved statistical bias correction method that also corrects dry climate modelsPreprint
Lehner, F., Nadeem, I., & Formayer, H. (2020) · doi:10.5194/hess-2020-515 · Cited by 4
“Also, Cannon et al. (2015) and Gudmundsson et al. (2012) prefer the empirical QM. Themeßl et al. (2012) point out that parametric QM can introduce new biases, because the distribution of a meteorological variable85 is not fully known and also depends on the region and season.”
BackgroundWater Harvesting, Climate Change, and Variability
Das, J., Goyal, M. K., & Umamahesh, N. V. (2021) · Wiley eBooks · doi:10.1002/9781119478911.ch28 · Cited by 7
Monthly 0.05° winter months snow depth dataset for the Northern Hemisphere from 21 CMIP6 models
Lin, S., Chen, X., Liang, S., Liu, Y., Li, Y. X., & Li, H. (2025) · Scientific Data · doi:10.1038/s41597-025-04925-w · Cited by 5
“This method has the advantage of a small computational load and is favoured by the scientific community for generating regional-scale climate predictions 37,38 .”
Wang, J., Fu, L., Lu, C., Wang, S., Zhu, Y., Xu, Z., & Gui, Z. (2024) · Sustainability · doi:10.3390/su16093518 · Cited by 3
Kırdemir, U., Fıstıkoğlu, O., & Okkan, U. (2025) · Theoretical and Applied Climatology · doi:10.1007/s00704-025-05416-z · Cited by 5
“GCMs have limitations in terms of spatial resolution and modeling capabilities, which means they inherently contain biases (Gudmundsson et al. 2012).”
Paul, A., & Goswami, M. (2025) · International Journal of Climatology · doi:10.1002/joc.8816 · Cited by 3
GBLUP Outperforms Quantile Mapping and Outlier Detection for Enhanced Genomic Prediction
Montesinos-López, O. A., Crossa, J. L., Vitale, P., Gerard, G., Crespo‐Herrera, L., Dreisigacker, S., Pierre, C. S., Posadas, L. G., Agbona, A., Buenrostro‐Mariscal, R., et al. (2025) · International Journal of Molecular Sciences · doi:10.3390/ijms26083620 · Cited by 4
“In climate science, QM adjusts biases in model outputs, enhancing the accuracy of temperature and precipitation projections for reliable climate assessments [13].”
InfluentialChanges in future ice-jam flood severity of a regulated cascade reservoir-river system
Liu, M., Lindenschmidt, K., Lv, H., Chen, T., Zhu, Y., & Lin, Y. C. (2025) · Journal of Hydrology · doi:10.1016/j.jhydrol.2025.133307 · Cited by 4
Climate change scenarios and the increasing severity of thermal extremes in the pampas region
Brendel, A. S., Ferrelli, F., & Píccolo, M. C. (2025) · Environmental Earth Sciences · doi:10.1007/s12665-025-12264-7 · Cited by 5
“The reference period ( For bias correction of daily model data, we employed the Quantile Mapping (QM) method (Gudmundsson et al. 2012; Maraun 2013), which adjusts the entire probability distribution of modeled data to match observations.”
Cantet, P., Renard, B., Fine, J. A., & Arnaud, P. (2025) · Water Resources Research · doi:10.1029/2024wr038562 · Cited by 3
“For future regional climate projections, the GRAFFAS model could be used for statistical disaggregation as proposed in Gagnon et al. (2012), instead of classical statistical downscaling methods (Gudmundsson et al., 2012) which act on the marginal distribution only.”
Solar Radiation Modification impact on precipitation and temperature extremes in Hunan, China
Tang, H., Tan, M. L., Feng, Z., Samat, N., & Zhang, F. (2025) · Journal of Hydrology Regional Studies · doi:10.1016/j.ejrh.2025.102728 · Cited by 4
European tree cover during the Holocene reconstructed from pollen records
Sweeney, L., Harrison, S. P., & Linden, M. V. (2025) · Biogeosciences · doi:10.5194/bg-22-4903-2025 · Cited by 4
Assessing the long-term water footprint of olive grove under changing climate (Apulia, Italy)
Leone, M., Attar, O., Brouziyne, Y., Khalki, E. M. E., Bouchaou, L., & Girolamo, A. M. D. (2025) · Agricultural Water Management · doi:10.1016/j.agwat.2025.109875 · Cited by 3
Galván-Cano, O., Bolaños-González, M. A., Prado-Hernández, J. V., Exebio-García, A. A., López-Pérez, A., & Colín-García, G. (2025) · Water · doi:10.3390/w17213040 · Cited by 3
Ernst, J., Stojanovic, M., & Sorí, R. (2025) · Environments · doi:10.3390/environments12110413 · Cited by 4
“The quantile mapping (QM) approach [42] is used to bias-correct the MMM series of each variable.”
Huang, S., Wong, W. K., Dobler, A., Bakke, S. J., Beldring, S., Haddeland, I., Hygen, H. O., Løvset, T., Mayer, S., Melvold, K., et al. (2026) · Geoscientific model development · doi:10.5194/gmd-19-4567-2026 · Cited by 5
“All modelled precipitation values which are below the derived threshold value are then set to zero for both training and projection periods (Gudmundsson et al., 2012 To reduce the potential impact of over-adjustment (modifying the long-term linear trend) and extrapolation (model-projected values…”
Nguyen‐Duy, T., Ngo‐Duc, T., Choisy, M., Pérez‐Fernández, I., & Sparrow, S. (2025) · Theoretical and Applied Climatology · doi:10.1007/s00704-025-05894-1 · Cited by 3
“In this study, we choose to use the empirical quantile mapping method, which does not assume a specific distribution, since it can produce competitive results compared to other parametric approaches for correcting precipitation (Gudmundsson et al. 2012; Enayati et al. 2021).”
Joshi, B., Singh, V., Chandola, V. K., & Singh, A. (2025) · Theoretical and Applied Climatology · doi:10.1007/s00704-025-05881-6 · Cited by 3
“To address these limitations, bias correction is strongly recommended, particularly for reducing errors in the number of rainy days, with numer - ous studies demonstrating the effectiveness of such methods (Gudmundsson et al. 2012 ; Schmidli et al. 2006).”
Risk-based assessment of climate change–induced hazards in arid, data-scarce coastal zones
Nikoo, M. R., Yousefi, H., Al-Wardy, M., Al-Rawas, G., Nazari, R., Hanai, A. A., & Al-Zeidi, K. (2025) · Ocean & Coastal Management · doi:10.1016/j.ocecoaman.2025.108024 · Cited by 4
Islam, M. T., Shalehin, M., Jahan, N., Islam, M., Ahammed, A., Hossain, M. A., Islam, M. M., Islam, N., & Adham, A. K. M. (2026) · Journal of Water and Climate Change · doi:10.2166/wcc.2026.405 · Cited by 3
Aamery, N. A., Fox, J. F., & Mahoney, D. T. (2021) · Journal of Hydrology · doi:10.1016/j.jhydrol.2021.126760 · Cited by 4
Assessment of Various Rainfall Bias Correction Techniques in Peninsular Malaysia
Satianesan, Y., Tan, W. L., & Ling, L. (2022) · doi:10.2991/978-94-6463-014-5_12 · Cited by 6
Fedele, G., Manco, I., Barbato, G., Verri, G., & Mercogliano, P. (2024) · Frontiers in Climate · doi:10.3389/fclim.2024.1330299 · Cited by 4
Cenobio-Cruz, O., Quintana‐Seguí, P., Boone, A. A., Moigne, P. L., & Garrote, L. (2024) · Journal of Hydrology · doi:10.1016/j.jhydrol.2024.131136 · Cited by 3
Mardochée, D., Adounkpè, J., Hamit, A., & Nour, A. M. (2024) · European Scientific Journal ESJ · doi:10.19044/esj.2024.v20n30p204 · Cited by 4
Hurtado-Pidal, J., Aguayo, M., Link, Ó., Valencia, B. G., & Francés, F. (2024) · Journal of Environmental Management · doi:10.1016/j.jenvman.2024.123500 · Cited by 5
Nasseri, M., Schoups, G., & Taheri, M. (2025) · International Journal of Climatology · doi:10.1002/joc.8723 · Cited by 3
“The proposed framework, known as Q-Q regression, resembles traditional linear regression; however, the input–output pairs Y obs , Y Model are matched based on their probabilities of occurrence, which are determined using a nonparametric empirical distribution method (Gudmundsson et al. 2012).”
InfluentialRegional climate model and extreme event trend analysis in the Nouhao subbasin, Burkina Faso
Noba, W. G., Damiba, L., Doumounia, A., Zongo, I., & Zougmoré, F. (2025) · Theoretical and Applied Climatology · doi:10.1007/s00704-025-05364-8 · Cited by 3
“There are many transformation methods, but according to Gudmundsson et al. (2012), nonparametric transformations have the highest ability to systematically reduce biases in regional climate models (RCMs).”
Future Changes of European Windstorm Losses in EURO-CORDEX Simulations
Alifdini, I., Moemken, J., Ramos, A. M., & Pinto, J. G. (2025) · Tellus A Dynamic Meteorology and Oceanography · doi:10.16993/tellusa.4094 · Cited by 3
How does bias correction impact simulated drought characteristics by Regional Climate Models?
Nguyen, P. N. B., Le, M., Phan‐Van, T., Ngo‐Duc, T., Tran-Bui-Anh, T., Trinh‐Tuan, L., Ngo-Thi-Thanh, H., Pham-Tien, D., Tangang, F., Juneng, L., et al. (2025) · Climatic Change · doi:10.1007/s10584-025-03901-y · Cited by 3
“When applied to the full climate dataset, it results in adjusted data that statistically aligns closer to observations (Enayati et al. 2021; Gudmundsson et al. 2012; Schepen et al. 2018).”
Dry GCMs vs. wet RCMs: precipitation biases over Southern Italy
Izzaddin, A., Langousis, A., Yaseen, M., & Iacobellis, V. (2025) · Stochastic Environmental Research and Risk Assessment · doi:10.1007/s00477-025-03022-z · Cited by 4
“Moreover, these methods may not sufficiently capture long-term changes in precipita - tion patterns, especially in regions with complex topogra - phy (see e.g. Gudmundsson et al. 2012 ).”
Billerbeck, C., da Silva, L. M., Marcellini, S. S., & Júnior, A. V. M. (2021) · Revista Brasileira de Meteorologia · doi:10.1590/0102-77863630068 · Cited by 6
Trumper, M. L., Griffin, D., Montpellier, E. E., & Kipfmueller, K. F. (2022) · Frontiers in Water · doi:10.3389/frwa.2021.801265 · Cited by 3
Salamalikis, V., & Argiriou, A. A. (2022) · Oxygen · doi:10.3390/oxygen2020010 · Cited by 3
“The two-dimensional space of ECHAM5-wiso and GNIP percentiles construct a look-up table, and linear interpolation predicts the values within the percentiles [24],”
BackgroundEURO-CORDEX: A Multi-Model Ensemble Fit for Assessing Future Hydrological Change?
Aitken, G., Visser‐Quinn, A., & Beevers, L. C. (2022) · Frontiers in Water · doi:10.3389/frwa.2022.804146 · Cited by 3
Thasneem, S. A., Chithra, N. R., & Thampi, S. G. (2023) · Theoretical and Applied Climatology · doi:10.1007/s00704-023-04410-7 · Cited by 3
Shi, X., Gao, L., Deng, Y., Zhang, Y., Zhang, X., & Gou, X. (2024) · CATENA · doi:10.1016/j.catena.2024.108027 · Cited by 3
Understanding the flood seasonality in a Himalayan River Basin under changing climate
Singhal, P., Goel, N. K., Bronstert, A., Vormoor, K., Agarwal, A., & Arora, M. (2025) · Theoretical and Applied Climatology · doi:10.1007/s00704-025-05585-x · Cited by 4
“The empirical quantile mapping bias-correction method (EQM) from Gudmundsson et al. (2012) is applied here.”
Lee, T., & Ouarda, T. B. M. J. (2018) · Climatic Change · doi:10.1007/s10584-018-2276-1 · Cited by 3
Projected Change—River Flow and Urban Drainage
Willems, P., & Lloyd‐Hughes, B. (2016) · Regional climate studies · doi:10.1007/978-3-319-39745-0_7 · Cited by 3
Investigation of The Effect of Climate Change on Extreme Precipitation: Tekirdağ Case
Oruç, S. (2020) · Turkish Journal of Water Science and Management · doi:10.31807/tjwsm.746134 · Cited by 3
“More detail about this procedure can be found in (Piani et al., 2010; Gudmundsson et al., 2012; Wuthiwongyothin et. al., 2020).”
BackgroundMethodInfluentialCritical review of adaptation strategies for the restoration of Lake Koronia.
Malamataris, D., Kolokytha, E., Mylopoulos, I., & Loukas, A. G. (2017) · European Water · Cited by 3
Empirical-Statistical Downscaling
Kotamarthi, R., Hayhoe, K., Mearns, L. O., Wuebbles, D. J., Jacobs, J. M., & Jurado, J. (2021) · Cambridge University Press eBooks · doi:10.1017/9781108601269.006 · Cited by 3
Summers, T., Mackie, E., Ueno, R., Simpson, C. H., Hosking, J. S., Suciu, T., Coburn, A., & Shuckburgh, E. F. (2022) · Climate Resilience and Sustainability · doi:10.1002/cli2.35 · Cited by 5
Veijalainen, N., Jakkila, J., Olsson, T., Backman, L., Vehviläinen, B., & Kaurola, J. (2017) · doi:10.5194/hess-2017-602 · Cited by 3
Peng, H., Qin, D., Wang, Z., Zhang, M., Yang, Y.-M., & Yong, Z. (2024) · Journal of Mountain Science · doi:10.1007/s11629-023-8223-2 · Cited by 2
“The Quantile-Mapping (QM) (Fang et al. 2015; Gudmundsson et al. 2012; Qian and Chang et al. 2021; Heo et al. 2019) is a method that corrects biases in simulated data from various models by mapping quantiles using the same cumulative probabilities as a reference dataset (Song et al. 2022; Cannon…”
Chan, S. S., Li, J., & Lee, T.-C. (2024) · Urban Climate · doi:10.1016/j.uclim.2024.101988 · Cited by 2
Dewanti, D., Djuraidah, A., Sartono, B., & Sopaheluwakan, A. (2024) · Journal of Agrometeorology · doi:10.54386/jam.v26i3.2614 · Cited by 5
Does Applying Subsampling in Quantile Mapping Affect the Climate Change Signal?
Reiter, P., & Casper, M. (2024) · Hydrology · doi:10.3390/hydrology11090143 · Cited by 2
Coelho, M. E. M. S., Chaves, H. M. L., & Fonseca, M. R. S. (2025) · Water · doi:10.3390/w17101549 · Cited by 3
“Rainfall bias correction was performed with parametric equations [58].”
Imfeld, N., & Brönnimann, S. (2026) · Earth system science data · doi:10.5194/essd-18-4019-2026 · Cited by 2
Kebede, M. H., Ahmed, A. M., Birhan, D. A., Damot, G. A., & Legesse, S. A. (2025) · Journal of Agriculture and Food Research · doi:10.1016/j.jafr.2025.102375 · Cited by 2
Habibi, I., Achour, H., Benaradj, A., & Bounaceur, F. (2025) · Modeling Earth Systems and Environment · doi:10.1007/s40808-025-02593-8 · Cited by 2
“This method aligns the empirical cumulative distribution functions (ECDFs) of the down-scaled temperature data with those of the lapse rate-adjusted reference datasets, without assuming any specific underly - ing statistical distribution (Gudmundsson et al. 2012).”
Tiwari, H., & Garg, R. D. (2025) · Environmental Earth Sciences · doi:10.1007/s12665-025-12626-1 · Cited by 3
“6 ) or non-parametric regressions such as smoothening splines (Gudmundsson et al., 2012; Ringard et al. 2017).”
Gebreegziabher, G. A., Degefa, S., & Furi, W. (2025) · Discover Atmosphere · doi:10.1007/s44292-025-00051-9 · Cited by 2
“Quantile mapping has also been shown to outperform simpler techniques like delta change or linear scaling in adjusting extreme values and correcting non-stationary biases under climate change conditions [4, 15].”
Assessment of bias correction technique to improve ozone reanalysis dataset over India
Gangwar, T., Dube, A., Abhijith, V., & Verma, S. (2025) · Bulletin of Atmospheric Science and Technology · doi:10.1007/s42865-025-00109-x · Cited by 3
“This technique has become increasingly popular in regional climate model simulations (Gudmundsson et al. 2012; Maraun 2013) and is also applicable in other fields requiring distributional projections for decision-making.”
Cascading impacts of compound drought-heat extremes on global gross primary production
Zhu, X., Zhang, S., Zhang, Q., Lu, D., Tang, M., & Guo, C. (2025) · Climatic Change · doi:10.1007/s10584-025-04052-w · Cited by 3
Li, H., Wang, P., Li, Z., Zhao, W., Yu, F., Chen, P., He, J., & Dai, Y. (2025) · CATENA · doi:10.1016/j.catena.2025.109711 · Cited by 2
Propagation of Climate Model Variability to Coastal Groundwater Simulations Under Climate Change
Lyra, A., Loukas, A. G., Sidiropoulos, P., & Mylopoulos, N. (2025) · doi:10.3390/eesp2025032024 · Cited by 2
“Statistical downscaling and bias-correction methods are applied to regional climate model projections for the estimation future precipitation and temperature on basin scale, which are then used to calculate, e.g., groundwater recharge [8,9].”
Earth observation informed modelling of flash floods
Watson, C. S., Creed, M., Gyawali, J., Shadeed, S. M., Dabbeek, J., Subedi, D. L., & Haiju, R. (2025) · International Journal of Disaster Risk Reduction · doi:10.1016/j.ijdrr.2025.105977 · Cited by 2
Quirmbach, M., Freistühler, E., Papadakis, I., & Pfister, A. (2012) · GERICS Climate Service Center Germany (University of Oldenburg) · Cited by 2
Rianna, G., Reder, A., Villani, V., & Mercogliano, P. (2017) · Springer eBooks · doi:10.1007/978-3-319-53485-5_27 · Cited by 2
Lv, M., Gao, X., Liu, Y., Ju, W., Sun, B., Li, W., & Zhou, X.-S. (2021) · International Journal of Climatology · doi:10.1002/joc.7272 · Cited by 2
High-resolution Projection Dataset of Agroclimatic Indicators over Central Asia
Qiu, Y., Feng, J., Yan, Z., & Wang, J. (2022) · Advances in Atmospheric Sciences · doi:10.1007/s00376-022-2008-3 · Cited by 2
“Numerous studies have found that the QM method can effectively remove model biases, not only for the mean and interannual variability, but also for extreme events (Ashfaq et al., 2010; Piani et al., 2010; Gudmundsson et al., 2012; Teutschbein and Seibert, 2012; Tong et al., 2021).”
MethodFathian, F., Ghadami, M., & Dehghan, Z. (2023) · JWSS - Isfahan University of Technology · doi:10.47176/jwss.26.4.15012 · Cited by 2
Metadata
- Authors
- Gudmundsson, L., Bremnes, J. B., Haugen, J. E., & Engen-Skaugen, T.
- Affiliations
- Norwegian Meteorological Institute (NO)
- Venue
- Hydrology and Earth System Sciences
- Publisher
- Copernicus GmbH
- Published
- 2012-09-21
- Volume
- 16
- Issue
- 9
- Pages
- 3383-3390
- ISSN
- 1027-5606 (ISSN-L)
- 1607-7938
- OpenAlex
- W2166535858
- Cited by
- 1,318
- References
- 41
- Citations by year
- 2026: 132 · 2025: 134 · 2024: 124 · 2023: 136 · 2022: 137 · 2021: 172 · 2020: 116 · 2019: 85 · 2018: 76 · 2017: 68 · 2016: 63 · 2015: 35 · 2014: 20 · 2013: 17 · 2012: 3
- FWCI
- 20.14
- Type
- journal article
- Language
- en
- Open access
- gold
- doi.org
- Licence
- Locations
- Hydrology and earth system sciences (publishedVersion, cc-by)
- DOAJ (DOAJ: Directory of Open Access Journals) (submittedVersion)
- Repository for Publications and Research Data (ETH Zurich) (submittedVersion, cc-by)
- ETH Zürich Research Collection (cc-by)
- Topics
- Physical Sciences › Environmental Science › Global and Planetary Change › Climate variability and models
- Physical Sciences › Earth and Planetary Sciences › Atmospheric Science › Precipitation Measurement and Analysis
- Physical Sciences › Environmental Science › Water Science and Technology › Hydrology and Watershed Management Studies
- Keywords
- dynamical downscaling, precipitation bias correction, statistical post-processing, parametric transformation, climate change impacts on water resources
About these checks
Registry, retraction, Cites and statistics results are computed, not judged, with one exception: a printed reference that no index lists is read once by a model before it counts as a citation error. Claims are extracted by a model and kept only when their quote appears verbatim in the text; each cited source is then checked, with a model’s help, for whether it says what the claim relies on. Those verdicts can be wrong — read the claim’s quote and the cited source before relying on one.
Statistics and arithmetic are recomputed, not judged.
Confidence bands are shown only for fields calibrated on our annotated test set. None is calibrated yet, so no band is shown.
What counts as a claim ›How we measure confidence ›How we check this ›
Are you an author, or do you see a problem with this page? Request a review
Data sources
Bibliographic data: Semantic Scholar, OpenAlex, Crossref.
Contains information from the Semantic Scholar Academic Graph Datasets, made available under the ODC Attribution License (ODC-BY 1.0).
Semantic Scholar’s data is described in: Kinney, R., et al. (2023). The Semantic Scholar Open Data Platform. arXiv:2301.10140.
