

Technical Note: Downscaling RCM precipitation to the station scale using statistical transformations—A comparison of methods
Open accessPublished version of a preprint
The DOI matches its Crossref record; 41 of the 41 references it cites were found in a registry or an index.
Abstract
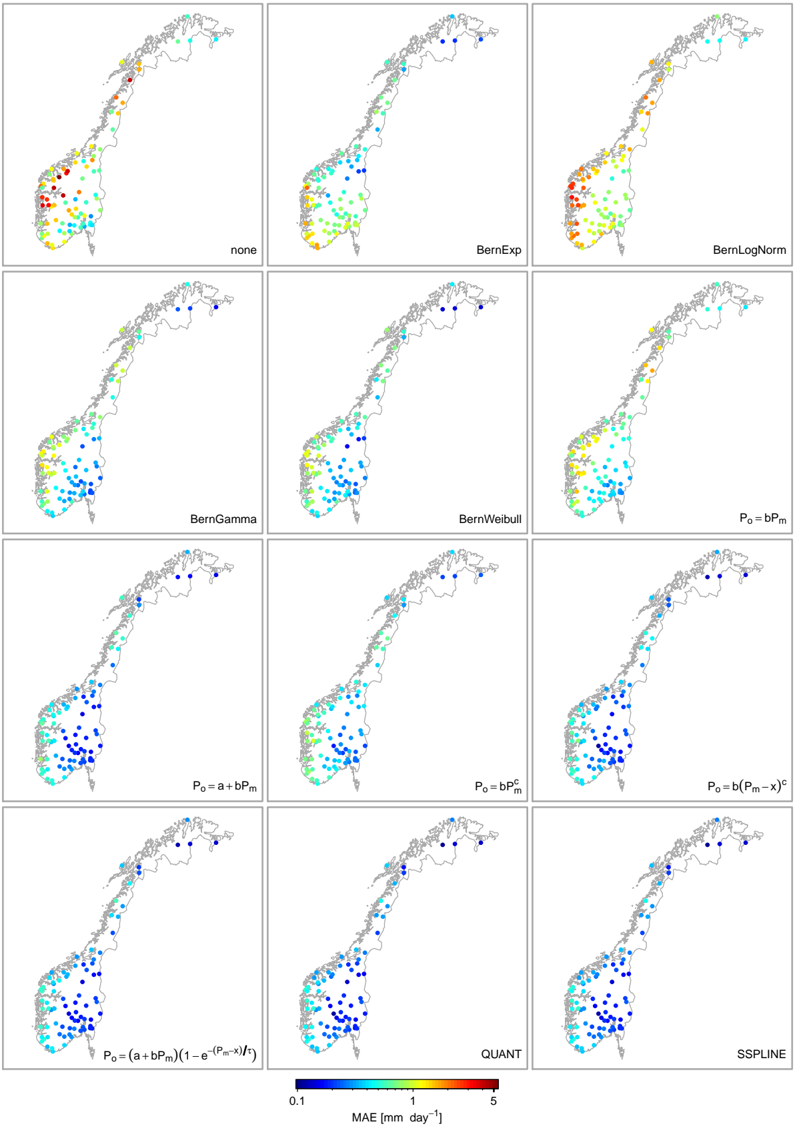
The impact of climate change on water resources is usually assessed at the local scale. However, regional climate models (RCMs) are known to exhibit systematic biases in precipitation. Hence, RCM simulations need to be post-processed in order to produce reliable estimates of local scale climate. Popular post-processing approaches are based on statistical transformations, which attempt to adjust the distribution of modelled data such that it closely resembles the observed climatology. However, the diversity of suggested methods renders the selection of optimal techniques difficult and therefore there is a need for clarification. In this paper, statistical transformations for post-processing RCM output are reviewed and classified into (1) distribution derived transformations, (2) parametric transformations and (3) nonparametric transformations, each differing with respect to their underlying assumptions. A real world application, using observations of 82 precipitation stations in Norway, showed that nonparametric transformations have the highest skill in systematically reducing biases in RCM precipitation.
Overview
The claims and statistics of this paper haven’t been checked yet.
Free: it reads the open-access text and checks the first 5 claims that cite a source we can check. Create a free account to check every claim.
Integrity signals
Registry
Cites
Statistics
Figures



Verification
Claims the paper makes
The claims and statistics of this paper haven’t been checked yet.
Free: it reads the open-access text and checks the first 5 claims that cite a source we can check. Create a free account to check every claim.
Claims other papers make about this one
Each is checked against this paper’s own text: does it say what the citing paper says it does?
The source backs part of the claim, not all of it — or backs it for a different population, condition or comparison.
In the citing paper
“Quantile mapping is the most used bias correction technique due to its ease of handling large amounts of data and its computational efficiency [58,59].”
From Climate Change Impacts on Streamflow in the Krishna River Basin, India: Uncertainty and Multi-Site Analysis (2022) · cites this paper as [58]
Experimental — accuracy not yet measured
Self-check
Percentages, sums and reported differences re-computed from the paper’s own numbers.
The self-check needs the paper’s full text.
Citations
Cites
The Elements of Statistical Learning
Hastie, T., Friedman, J., & Tibshirani, R. (2001) · Springer Series in Statistics · doi:10.1007/978-0-387-21606-5 · Cited by 24,162
Uppala, S. M., KÅllberg, P. W., Simmons, A. J., Andrae, U., Bechtold, V. D. C., Fiorino, M., Gibson, J. K., Haseler, J., Hernandez, A., Kelly, G. A., et al. (2005) · Quarterly Journal of the Royal Meteorological Society · doi:10.1256/qj.04.176 · Cited by 6,804 · cited 1×
“Modelled precipitation was extracted from a HIRHAM RCM simulation with 25 km resolution (Førland et al., 2009, 2011) forced with the ERA40 reanalysis (Uppala et al., 2005) on a model domain covering Norway and the Nordic Arctic.”
MethodTeutschbein, C., & Seibert, J. (2012) · Journal of Hydrology · doi:10.1016/j.jhydrol.2012.05.052 · Cited by 2,214 · cited 13×
“, 2011; Teutschbein and Seibert, 2012), the standard deviation (Engen-Skaugen, 2007; Li et al., 2010; Themeßl et al., 2011; Teutschbein and Seibert, 2012) and the skewness (Li et al.”
BackgroundMethodResultInfluentialHydrologic Implications of Dynamical and Statistical Approaches to Downscaling Climate Model Outputs
Wood, A. W., Leung, L. R., Sridhar, V., & Lettenmaier, D. P. (2004) · Climatic Change · doi:10.1023/b:clim.0000013685.99609.9e · Cited by 1,886 · cited 3×
“(2) using the empirical CDF of observed and modelled values instead of assuming parametric distributions (e.g.Panofsky and Brier, 1968; Wood et al., 2004; Reichle and Koster, 2004; Boé et al., 2007; Themeßl et al., 2011, 2012).”
BackgroundMethodMaraun, D., Wetterhall, F., Ireson, A. M., Chandler, R. E., Kendon, E. J., Widmann, M., Brienen, S., Rust, H. W., Sauter, T., Themeßl, M., et al. (2010) · Reviews of Geophysics · doi:10.1029/2009rg000314 · Cited by 1,805 · cited 3×
“Further, “statistical bias correction” (Piani et al., 2010a,b), “direct error correction methods” (Themeßl et al., 2011) and “model output statistics (MOS)” (Maraun et al., 2010) have been used to refer to the methods under investigation.”
MethodStatistical bias correction for daily precipitation in regional climate models over Europe
Piani, C., Haerter, J. O., & Coppola, E. (2010) · Theoretical and Applied Climatology · doi:10.1007/s00704-009-0134-9 · Cited by 1,154 · cited 9×
“…a set of scores is needed that quantifies the similarity of the observed and the (corrected) modelled empirical CDF. Previously used scores include overall measures, such as the root mean square error (Piani et al., 2010b) or the Kolmogorov-Smirnov two sample statistic (Dosio and Paruolo, 2011).”
BackgroundMethodInfluentialSome applications of statistics to meteorology
Panofsky, H. A., Brier, G. W., & Best, W. H. (1958) · University of Michigan Library Repository · Cited by 1,083
Li, H., Sheffield, J., & Wood, E. F. (2010) · Journal of Geophysical Research: Atmospheres · doi:10.1029/2009jd012882 · Cited by 901 · cited 6×
“Other suggested scores assess specific moments of the distribution including the mean (Engen-Skaugen, 2007; Li et al., 2010; Dosio and Paruolo, 2011; Themeßl et al., 2011; Turco et al., 2011; Teutschbein and Seibert, 2012), the standard deviation (Engen-Skaugen, 2007; Li et al., 2010; Themeßl et…”
BackgroundMethodInfluentialHow Well Do Coupled Models Simulate Today's Climate?
Reichler, T., & Kim, J. (2008) · Bulletin of the American Meteorological Society · doi:10.1175/bams-89-3-303 · Cited by 881
Piani, C., Weedon, G. P., Best, M., Gomes, S. M., Viterbo, P., Hagemann, S., & Haerter, J. O. (2010) · Journal of Hydrology · doi:10.1016/j.jhydrol.2010.10.024 · Cited by 868 · cited 9×
“…a set of scores is needed that quantifies the similarity of the observed and the (corrected) modelled empirical CDF. Previously used scores include overall measures, such as the root mean square error (Piani et al., 2010b) or the Kolmogorov-Smirnov two sample statistic (Dosio and Paruolo, 2011).”
BackgroundMethodInfluential
Cited by
Items 701–800 of 1,001
Cunningham, S. A., Schafer, T. L. J., Wikle, C. K., VonBank, J. A., Ballard, B. M., Cao, L., Bearhop, S., Fox, A. D., Hilton, G. M., Walsh, A., et al. (2022) · Oecologia · doi:10.1007/s00442-022-05300-x · Cited by 12
Future water security under climate change: a perspective of the Grand River Watershed
Kaur, B., Shrestha, N. K., Ghimire, U., Paul, P. K., Rudra, R. P., Goel, P., & Daggupati, P. (2023) · Journal of Water and Climate Change · doi:10.2166/wcc.2023.362 · Cited by 15
Lucash, M. S., Marshall, A. M., Weiss, S. A., McNabb, J. W., Nicolsky, D. J., Flerchinger, G. N., Link, T. E., Vogel, J. G., Scheller, R. M., Abramoff, R., et al. (2023) · Ecological Modelling · doi:10.1016/j.ecolmodel.2023.110367 · Cited by 11
Climate change impact on streamflow and suspended sediment load in the flood-prone river basin
Ranjan, R., & Mishra, A. (2023) · Journal of Water and Climate Change · doi:10.2166/wcc.2023.037 · Cited by 14
Latrech, B., Hermassi, T., Yacoubi, S., Slatni, A., Jarray, F., Pouget, L., & Abdallah, M. A. B. (2024) · Agriculture · doi:10.3390/agriculture14010160 · Cited by 11
Erkol, Z. I., Yeşilyurt, S. N., & Dalkılıç, H. Y. (2024) · Theoretical and Applied Climatology · doi:10.1007/s00704-024-04867-0 · Cited by 12
Assessment of Flood Vulnerability Based on CMIP5 Climate Projections in South Korea
Park, J., Kang, M., & Song, I. (2015) · JAWRA Journal of the American Water Resources Association · doi:10.1111/jawr.12283 · Cited by 11
Imbulana, N., Gunawardana, S. K., Shrestha, S., & Datta, A. (2018) · Current Science · doi:10.18520/cs/v114/i07/1495-1509 · Cited by 11
Ortega-Reig, M., García-Mollá, M., Ibor, C. S., Pulido-Velázquez, M., Girard, C., Marcos, P. S., Ruiz-Rodríguez, M., & García-Prats, A. (2019) · Economía Agraria y Recursos Naturales · doi:10.7201/earn.2018.02.02 · Cited by 11
Arteaga, V. L., & Lima, C. (2020) · International Journal of Climatology · doi:10.1002/joc.6627 · Cited by 12
“In order to correct the systematic bias observed in the CMIP5 simulation data, we applied the empirical quantiles mapping (Gudmundsson et al., 2012) based on the empirical cumulative distribution function (CDF) of observed and modelled values to correct the simulated data.”
MethodRichardson, D., Black, A. S., Monselesan, D. P., Moore, T. S., II, Risbey, J. S., Schepen, A., Squire, D. T., & Tozer, C. R. (2020) · Journal of Hydrometeorology · doi:10.1175/jhm-d-20-0054.1 · Cited by 14
A Two‐Stage Framework for Bias and Reliability Tests of Ensemble Hydroclimatic Forecasts
Zhao, T., Xiong, S., Wang, J., Liu, Z., Tian, Y., Yan, D., Zhang, Y., Chen, X., & Wang, H. E. (2022) · Water Resources Research · doi:10.1029/2022wr032568 · Cited by 12
“10 of 22 The quantile mapping pays attention to the marginal distributions of forecasts and observations (Gudmundsson et al., 2012; Maraun, 2013; Piani et al., 2010):”
BackgroundAndres, N., Lieberherr, G.-D., Sideris, I. V., Jordan, F., & Zappa, M. (2016) · Meteorological Applications · doi:10.1002/met.1569 · Cited by 12
“A possible alternative to the ecdfs could be the use of a parametric distribution (see Gudmundsson et al., 2012).”
BackgroundMethodDaraio, J. A. (2020) · Water · doi:10.3390/w12082312 · Cited by 10
“[34] for details) transforms the simulated data, Pm, using the following.”
MethodGyasi‐Agyei, Y., Obuobie, E., Yu, B., Addi, M., & Yahaya, B. (2023) · Scientific Reports · doi:10.1038/s41598-023-43075-0 · Cited by 10
Wen, Y., Fei, Y., Fan, Y., Yang, A., Wang, B., Gao, P., & Scott, D. J. (2024) · Agricultural and Forest Meteorology · doi:10.1016/j.agrformet.2024.109965 · Cited by 15
Watson, P. L., Hughes, W., Cerrai, D., Zhang, W., Bagtzoglou, A. C., & Anagnostou, E. N. (2024) · IEEE Access · doi:10.1109/access.2024.3396414 · Cited by 11
“More specifically, the qmap library was used to fit parametric transformations of the predicted outage to more closely match the statistical distribution of the actual outages [55].”
MethodAssessing the long-term trend of spring discharge in a climate change hotspot area.
Casati, T., Navarra, A., Filippini, M., & Gargini, A. (2024) · Science of the Total Environment · doi:10.1016/j.scitotenv.2024.177498 · Cited by 9
CMIP6 GCMs Projected Future Koppen‐Geiger Climate Zones on a Global Scale
Song, Y. H., Chung, ., & Ayugi, B. O. (2025) · Earth s Future · doi:10.1029/2023ef004401 · Cited by 11
“…methods and downscaling methods are used to problems caused by bias with observed values, but improving the purely physical process in CMIP GCMs is essential to accurately assess historical climates (Abdelmoaty et al., 2021; Fang et al., 2015; Gudmundsson et al., 2012; Song et al., 2022).”
Sarhadi, A., Rousseau‐Rizzi, R., & Emanuel, K. (2025) · Earth s Future · doi:10.1029/2024ef005078 · Cited by 12
“Note that for the late 20th century period, we applied a bias correction method using quantile mapping to the levels of different types of flooding, based on the corresponding levels from NCEP reanalysis data (Gudmundsson et al., 2012).”
Bhattacharjee, A., Islam, S., Rahman, M., Roy, A., Islam, A. R. M. T., Meraj, G., Ehsan, M. A., & Almazroui, M. (2025) · Earth Systems and Environment · doi:10.1007/s41748-025-00579-1 · Cited by 12
Gomez-Garcia, M., MATSUMURA, A., Ogawada, D., & Takahashi, K. (2019) · Water Resources Research · doi:10.1029/2018wr023053 · Cited by 10
“Owing to a more flexible structure, nonparametric methods are able to reproduce extremes more accurately than parametric ones (Gudmundsson et al., 2012).”
MethodAfzal, M., & Ragab, R. (2020) · Irrigation and Drainage · doi:10.1002/ird.2467 · Cited by 10
“The latter was carried out using the ‘qmap’ package in the R statistical tool (Gudmundsson et al., 2012) using the 1961–1990 observation data as a reference period.”
MethodFrom Climate Model Output to Actionable Climate Information in Norway
Nilsen, I. B., Hanssen‐Bauer, I., Dyrrdal, A. V., Hisdal, H., Lawrence, D., Haddeland, I., & Wong, W. K. (2022) · Frontiers in Climate · doi:10.3389/fclim.2022.866563 · Cited by 10
“Empirical quantile mapping method (Gudmundsson et al., 2012) was selected because this is a method that does not assume a theoretical distribution and that corrects each variable individually.”
MethodKhatun, A., Sahoo, B., & Chatterjee, C. (2022) · Hydrological Sciences Journal · doi:10.1080/02626667.2022.2109972 · Cited by 10
Wang, X., Yang, J., Xiong, J., Shen, G., Yong, Z., Sun, H., He, W. J., Luo, S., & Cui, X. (2022) · Remote Sensing · doi:10.3390/rs14236172 · Cited by 10
Watson, A., Vystavna, Y., Kralisch, S., Helmschrot, J., van Rooyen, J., & Miller, J. (2023) · Hydrological Processes · doi:10.1002/hyp.14819 · Cited by 13
“…signatures are the most important and drive the hydrological response, such as for the Western Cape (van Rooyen et al., 2021; Watson, Eilers, & Miller, 2020), but various quantile mapping approaches (Gudmundsson et al., 2012) are available and can be used under different climatic conditions.”
BackgroundStreamflow Reconstructions Using Tree-Ring-Based Paleo Proxies for the Sava River Basin (Slovenia)
Tootle, G., Oubeidillah, A. A., Elliott, E., Formetta, G., & Bezak, N. (2023) · Hydrology · doi:10.3390/hydrology10070138 · Cited by 10
Nolin, A. F., Girardin, M. P., Adamowski, J., Barzegar, R., Boucher, M., Tardif, J. C., & Bergeron, Y. (2023) · Journal of Hydrology Regional Studies · doi:10.1016/j.ejrh.2023.101462 · Cited by 14
Han, X., & Frangopol, D. M. (2023) · ASCE-ASME Journal of Risk and Uncertainty in Engineering Systems Part A Civil Engineering · doi:10.1061/ajrua6.rueng-1059 · Cited by 10
Impact of Future Climate Scenarios and Bias Correction Methods on the Achibueno River Basin
Moya, H., Althoff, I., Celis-Diez, J. L., Pedreros, C. H., & Reggiani, P. (2024) · Water · doi:10.3390/w16081138 · Cited by 10
Jiménez, S., Avilés, Á., Galán, L., Flores, A., Matovelle, C., & Vintimilla, C. (2019) · Advances in intelligent systems and computing · doi:10.1007/978-3-030-35740-5_13 · Cited by 12
Climate Change Adaptation to Extreme Rainfall Events on a Local Scale in Namyangju, South Korea
Lee, T., Son, C., Kim, M.-E., Lee, S. E., & Yoon, S. (2020) · Journal of Hydrologic Engineering · doi:10.1061/(asce)he.1943-5584.0001906 · Cited by 10
Vigna, I., Bigi, V., Pezzoli, A., & Besana, A. (2020) · Sustainability · doi:10.3390/su12072896 · Cited by 10
“Moreover, the Quantile Mapping correction method performs very well concerning the reproduction of the precipitation annual cycle and of the wet and dry periods length [62].”
MethodInfluentialMirosław‐Świątek, D., Marcinkowski, P., Kochanek, K., & Wassen, M. J. (2020) · PeerJ · doi:10.7717/peerj.9778 · Cited by 11
Cota-Durán, A., Petatán‐Ramírez, D., Ojeda-Ruíz, M. Á., & Marín-Monroy, E. A. (2021) · Applied Sciences · doi:10.3390/app11125506 · Cited by 12
Mallik, P., & Ghosh, T. (2021) · Regional Environmental Change · doi:10.1007/s10113-021-01844-5 · Cited by 10
“To eliminate the systematic errors (biases) arising in the GCMs due to limited spatial resolution, we performed bias correction using the quantile mapping (QM) approach (Gudmundsson et al. 2012).”
MethodLuetkemeier, R., Stein, L., Drees, L., Müller‐Thomy, H., & Liehr, S. (2018) · Water · doi:10.3390/w10040499 · Cited by 14
Thasneem, S. A., Thampi, S. G., & Chithra, N. R. (2023) · Environmental Research · doi:10.1016/j.envres.2023.115301 · Cited by 11
Gan, F., Diao, X., Tan, K., Li, X., Cao, G., Zhong, X., & Gao, Y. (2023) · Journal of Hydrology · doi:10.1016/j.jhydrol.2023.129890 · Cited by 9
Quantifying the influence of climate change on streamflow of Rietspruit sub-basin, South Africa
Banda, V. D., Dzwairo, B. R., Singh, S. K., & Kanyerere, T. (2024) · Journal of Water and Climate Change · doi:10.2166/wcc.2024.690 · Cited by 11
Saretto, F., Roy, B., Coelho, R. E., Reder, A., Fedele, G., Oakes, R., Brandimarte, L., & Lourenço, T. C. (2024) · Atmosphere · doi:10.3390/atmos15050606 · Cited by 15
“These relationships were retrieved using the Empirical Quantile Mapping approach [51,52].”
MethodRainfall projections under different climate scenarios over the Kaduna River Basin, Nigeria
Okafor, G. C., Ogbu, K. N., Agyekum, J., Limantol, A. M., & Larbi, I. (2024) · Discover Environment · doi:10.1007/s44274-024-00127-0 · Cited by 10
Botto, V., Tiranti, D., Barbarino, S., & Ronchi, C. (2025) · Frontiers in Earth Science · doi:10.3389/feart.2024.1536277 · Cited by 9
Abdelwahab, O. M. M., Ricci, G. F., Gentile, F., & Girolamo, A. M. D. (2025) · Frontiers in Water · doi:10.3389/frwa.2025.1486644 · Cited by 11
Bodjrènou, M., Peng, K., Afféwé, J., Hounkpè, J., Donnou, H. E. V., Adounkpè, J., & Akpo, A. (2025) · Hydrology · doi:10.3390/hydrology12040071 · Cited by 9
Kim, S., Shin, J., Lee, G., Park, J., & Sung, K. (2025) · Water · doi:10.3390/w17111702 · Cited by 9
Cui, C., Pan, T., Brookes, J. D., Zhang, Q., Qin, B., Zhang, Y., & Zhu, G. (2025) · Journal of Hydrology · doi:10.1016/j.jhydrol.2025.133716 · Cited by 9
Vrac, M., Loukos, H., Noël, T., & Defrance, D. (2025) · Climate · doi:10.3390/cli13070137 · Cited by 9
Impact of bias adjustment strategy on ensemble projections of hydrological extremes
Astagneau, P. C., Wood, R. R., Vrac, M., Kotlarski, S., Ayar, P. V., François, B., & Brunner, M. I. (2025) · Hydrology and earth system sciences · doi:10.5194/hess-29-5695-2025 · Cited by 12
Evaluating methods for reconstructing large gaps in historic snow depth time series
Aschauer, J., & Marty, C. (2021) · Geoscientific instrumentation, methods and data systems · doi:10.5194/gi-10-297-2021 · Cited by 10
Berezowski, T. E., & Partington, D. (2023) · Water Resources Research · doi:10.1029/2023wr035836 · Cited by 12
“The historical and future climate data biases were corrected using the quantile mapping (Gudmundsson et al., 2012) method.”
MethodStrużewska, J., Kaminski, J. W., & Jefimow, M. (2023) · Applied Sciences · doi:10.3390/app14010009 · Cited by 11
Resilient agriculture: water management for climate change adaptation in Lower Saxony
Cotera, R. V., Egerer, S., Nam, C., Lierhammer, L., Moors, L., & Costa, M. M. (2024) · Journal of Water and Climate Change · doi:10.2166/wcc.2024.455 · Cited by 11
Das, L., & Akhter, J. (2019) · International Journal of Climatology · doi:10.1002/joc.6022 · Cited by 9
“In this study, we have used empirical quantile mapping approach where CDFs of observed and modelled precipitation have been estimated using empirical percentiles and values in between the percentiles are approximated using linear interpolation (Gudmundsson et al., 2012).”
MethodSingh, J., Sahany, S., & Robock, A. D. (2020) · Climatic Change · doi:10.1007/s10584-020-02786-3 · Cited by 9
“We have applied a widely used bias correction method known as Quantile Mapping (QM); e.g., (Gudmundsson et al. 2012) on Hist, RCP4.”
MethodBhatla, R., Sarkar, D., Verma, S., Sinha, P. C., Ghosh, S., & Mall, R. K. (2020) · Theoretical and Applied Climatology · doi:10.1007/s00704-020-03393-z · Cited by 9
Gonzalez-Arceo, A., de Musitu, M. Z.-M., Ulazia, A., del Rio, M., & López‐García, Ó. (2020) · Applied Sciences · doi:10.3390/app10249017 · Cited by 9
“The QM calibrations were made using the qmap package [40], and the random forest classification was made using the randomForest package [41].”
MethodA Paleo Perspective of Alabama and Florida (USA) Interstate Streamflow
Vines, M., Tootle, G., Terry, L. G., Elliott, E., Corbin, J., Harley, G. L., Kam, J., Sadeghi, S., & Therrell, M. D. (2021) · Water · doi:10.3390/w13050657 · Cited by 9
A novel bias correction method for extreme rainfall events based on L‐moments
Rohith, A. N., & Parambath, S. K. (2021) · International Journal of Climatology · doi:10.1002/joc.7242 · Cited by 10
“Various authors proposed different statistical BC methods (Gudmundsson et al., 2012; Chen et al., 2013; Fang et al., 2015; Turco et al., 2017) to use in multiple intended applications.”
BackgroundMethodProjected climate change impacts on tropical life zones in Costa Rica
Birkel, C., Dehaspe, J., Chavarría-Palma, A., Venegas‐Cordero, N., Capell, R., & Durán‐Quesada, A. M. (2021) · Progress in Physical Geography Earth and Environment · doi:10.1177/03091333211047046 · Cited by 11
“…and temperature reference grids for the period 1971–2000 on a target 1 km2 resolution, we used quantile-quantile mapping (qqmap package in R, Gudmundsson et al., 2012) to bias-correct the 50 km ECVensemble mean for the evaluation period 2001– 2018 and the future period 2019–2040 (see…”
MethodProjections of Future Drought by CMIP5 Multimodel Ensembles in Central Asia
Ta, Z., Li, K., Yu, Y., & Yang, M. (2022) · Atmosphere · doi:10.3390/atmos13020232 · Cited by 9
“The nonparametric method has a better effect on bias correction than the parametric method, because it uses the actual distribution of the observed and simulated data [25].”
MethodShrestha, S. G., & Pradhanang, S. M. (2022) · Theoretical and Applied Climatology · doi:10.1007/s00704-022-04073-w · Cited by 9
Changes in storm surges based on a bias-adjusted reconstruction dataset from 1900 to 2010
Feng, J., Li, D., Dang, W., & Zhao, L. (2022) · Journal of Hydrology · doi:10.1016/j.jhydrol.2022.128759 · Cited by 10
Projection and Analysis of Floods in the Upper Heihe River Basin under Climate Change
Ye, Y., Li, Z., Li, Z., & Li, Z. (2023) · Atmosphere · doi:10.3390/atmos14071083 · Cited by 9
Matthews, T., Hodgkins, R., Guðmundsson, S., Pálsson, F., & Björnsson, H. (2014) · International Journal of Climatology · doi:10.1002/joc.4191 · Cited by 12
“Although this practice is common (Boé et al., 2007; Rye et al., 2010; Gudmundsson et al., 2012; Themeßl et al., 2012), it is questionable if temporal trends mean that these minimum/maximum corrections need to be applied often.”
BackgroundMethodEvaluation of Agro-Climatic Index Using Multi-Model Ensemble Downscaled Climate Prediction of CMIP5
Chung, U., Cho, J., & Lee, E. (2015) · Korean Journal of Agricultural and Forest Meteorology · doi:10.5532/kjafm.2015.17.2.108 · Cited by 9
“분위사상법의 경우, 모수적 분위사상법(parametric) 및 비모수적(nonparametric) 분위사상법 중 선택하여 사용할 수 있으 나(Gudmundsson et al., 2012) 본 연구에서는 비모 수적 분위사상법을 사용하였다(조재필, 2013).”
Long-Term Variation of Runoff Coefficient during Dry and Wet Seasons Due to Climate Change
Ha, D. T. T., Ghafouri‐Azar, M., & Bae, D. (2019) · Water · doi:10.3390/w11112411 · Cited by 9
“Bias‐correction methods include the adjustment of mean, variance, and higher moments of a distribution by parametric [44] and non‐parametric techniques [45].”
MethodZhu, L., Yi, H., Su, H., Guikema, S. D., & Liu, B. (2023) · Journal of Environmental Management · doi:10.1016/j.jenvman.2023.119162 · Cited by 10
Evaluating climate change scenarios in the white volta basin: A statistical bias-correction approach
Mensah, J. K., Akpoti, K., Antwi-Ofosu, E., Kabo-bah, A. T., Siabi, E. K., Asare, A., Bakuri, R. W., & Yidana, S. M. (2024) · Physics and Chemistry of the Earth Parts A/B/C · doi:10.1016/j.pce.2024.103584 · Cited by 9
Abdaki, M., Alobaydy, O., Al-Samman, S., & Ahmed, H. (2024) · Modeling Earth Systems and Environment · doi:10.1007/s40808-024-02078-0 · Cited by 8
“This alignment ensures that the percentiles of the simulated data series correspond closely to those of the observed data based on the CDFs, thereby enhancing the distribution of the simulated data series to better match the observed data (Gudmundsson et al. 2012).”
Evaluating input data sources for isotope‐enabled rainfall‐runoff models
Watson, A., Birkel, C., Arciniega‐Esparza, S., de Waal, J. H., Miller, J., Vystavna, Y., van Rooyen, J., Welham, A., Bong, H., Yoshimura, K., et al. (2024) · Hydrological Processes · doi:10.1002/hyp.15276 · Cited by 9
“Similar to non-isotope climate model correction with for example, quantile mapping (Gudmundsson et al., 2012), the IsoGSM and IsoRSM model outputs may need to be corrected for biases before use in hydrological models (e.g., Delavau et al., 2017).”
Marcinkowski, P., Eini, M. R., Venegas‐Cordero, N., Jefimow, M., & Piniewski, M. (2024) · International Journal of Climatology · doi:10.1002/joc.8674 · Cited by 8
“The study employed a non-parametric quantile mapping method, as introduced by Gudmundsson et al. (2012) utilising robust empirical quantiles (RQUANT).”
Lepore, D., Bucchignani, E., Montesarchio, M., Allocca, V., Coda, S., Cusano, D., & Vita, P. D. (2024) · Scientific Reports · doi:10.1038/s41598-024-70257-1 · Cited by 8
Adapting quantile mapping to bias correct solar radiation data
Bailey, M. D., Nychka, D. W., Sengupta, M., Yang, J., Xie, Y., Habte, A., & Bandyopadhyay, S. (2025) · Solar Energy · doi:10.1016/j.solener.2024.113220 · Cited by 8
Climate’s firm grip on glacier ablation in the Cordillera Darwin Icefield, Tierra del Fuego
Temme, F., Sommer, C., Schaefer, M., Jaña, R., NETO, J. A., González, I., Izagirre, E., Giesecke, R., Tetzner, D., & Fürst, J. J. (2025) · Nature Communications · doi:10.1038/s41467-025-57698-6 · Cited by 11
A comprehensive evaluation of the accuracy of satellite-based precipitation estimates over Thailand
Kaprom, C., Williams, J. A., Mehrotra, R., Ophaphaibun, C., & Sriwongsitanon, N. (2025) · Journal of Hydrology Regional Studies · doi:10.1016/j.ejrh.2025.102380 · Cited by 12
Loganathan, P., Zea, E., Vinuesa, R., & Otero, E. (2025) · Environmental Science and Pollution Research · doi:10.1007/s11356-025-36872-9 · Cited by 11
“Deep learning has transformed pattern identification in big datasets in recent years, thanks to early applications modelling correlations between coarse GCM outputs and local observations using multi-layer perceptrons (MLPs) (Alzubaidi et al. 2021; Zorita and von Storch 1999).”
Insights into uncertainties in future drought analysis using hydrological simulation model
Kim, J. H., & Chung, E.-S. (2026) · Hydrology and earth system sciences · doi:10.5194/hess-30-227-2026 · Cited by 7
Monitoring Crop Status in the Continental United States Using the SMAP Level-4 Carbon Product
Wurster, P., Maneta, M., Kimball, J. S., Endsley, K. A., & Beguerı́a, S. (2021) · Frontiers in Big Data · doi:10.3389/fdata.2020.597720 · Cited by 8
Ollat, N., Zito, S., Richard, Y., Aigrain, P., Brugière, F., Duchêne, É., Atauri, I. G. D. C., Gautier, J., Giraud-Heraud, E. E., Hannin, H., et al. (2021) · Climatologie · doi:10.1051/climat/202118003 · Cited by 8
Performance assessment of CORDEX regional climate models in wind speed simulations over Zambia
Libanda, B. (2022) · Modeling Earth Systems and Environment · doi:10.1007/s40808-022-01504-5 · Cited by 8
“…overestimation suggests that efforts using these models to inform wind energy investments would benefit from empirical adjustments such as quantile mapping which was developed with the aim of adjusting the distribution of modelled data so that it matches observed climates (Gudmundsson et al. 2012).”
BackgroundLala, J., Lee, D., Bazo, J., & Block, P. (2022) · Weather and Climate Extremes · doi:10.1016/j.wace.2022.100510 · Cited by 13
Abraham, T., & Muluneh, A. (2022) · Air Soil and Water Research · doi:10.1177/11786221221135151 · Cited by 11
Lemus-Canovas, M., Ciuró, E. M., Cearreta-Innocenti, T., Serrano‐Notivoli, R., & Royé, D. (2024) · Urban Climate · doi:10.1016/j.uclim.2024.102019 · Cited by 10
Ghoul, I. E., Sellami, H., Khlifi, S., & Vanclooster, M. (2024) · Atmosphere · doi:10.3390/atmos15101209 · Cited by 8
Cantalejo, M., Cobos, M., Millares, A., & Baquerizo, A. (2024) · Scientific Reports · doi:10.1038/s41598-024-76848-2 · Cited by 9
“…number of wet days per month ( n w ) , (ii) the average precipitation per month ( x m ) , (iii) the averaged 95th percentile value per month ( x 95 ) 35,51,58,94 , and (iv) the averaged accumulated precipitation per month ( x cum ) ; and ζ r is the corresponding value for the reference data.”
BackgroundEvaluation of regional climate model temperature and precipitation outputs over Scandinavia
Landgren, O., Haugen, J., & Førland, E. J. (2014) · Climate Research · doi:10.3354/cr01240 · Cited by 8
“For more information regarding these methods, see e.g. Gudmundsson et al. (2012) or Engen-Skaugen (2007).”
MethodSelf-citationClimate change impacts on water balance in Western Bohemia and options for adaptation
Beran, A., Hanel, M., Nesládková, M., Vizina, A., Vyskoč, P., & Kožín, R. (2018) · Water Science & Technology Water Supply · doi:10.2166/ws.2018.080 · Cited by 8
Urban Heat Projections in a Changing Climate: Washington, DC, Case Study
Zhang, Y., & Ayyub, B. M. (2018) · ASCE-ASME Journal of Risk and Uncertainty in Engineering Systems Part A Civil Engineering · doi:10.1061/ajrua6.0000985 · Cited by 9
Bonanno, R., & Faggian, P. (2015) · Tethys Journal of Weather and Climate of the Western Mediterranean · doi:10.3369/tethys.2018.15.02 · Cited by 9
“Gudmundsson et al. (2012) reviewed different approaches using statistical transformations (classified into: distribution derived transformations, parametric transformations and nonparametric transformations) to postprocess RCM outputs and demonstrated an overall success in removing biases in RCMs.”
MethodAfzal, M., Vavlas, N., & Ragab, R. (2020) · Journal of Water and Climate Change · doi:10.2166/wcc.2020.117 · Cited by 8
Sun, F., Mejía, A., Sharma, S., Zeng, P., & Che, Y. (2020) · Journal of Applied Meteorology and Climatology · doi:10.1175/jamc-d-20-0078.1 · Cited by 9
Assessing the Influence of Compounding Factors to the Water Level Variation of Erhai Lake
Wu, H., Wang, S., Wu, T., Yao, B., & Ni, Z. (2020) · Water · doi:10.3390/w13010029 · Cited by 8
Blanco‐Ward, D., Rocha, A. C., Viceto, C., Ribeiro, A. C., Feliciano, M., Paoletti, E., & Miranda, A. I. (2021) · Atmospheric Environment · doi:10.1016/j.atmosenv.2021.118507 · Cited by 11
Rafatnejad, A., Tavakolifar, H., & Nazif, S. (2021) · International Journal of Climatology · doi:10.1002/joc.7280 · Cited by 8
Sundaram, G., & Radhakrishnan, S. (2022) · Arabian Journal of Geosciences · doi:10.1007/s12517-022-10403-z · Cited by 8
Jiang, Z., & Johnson, F. M. (2023) · Monthly Weather Review · doi:10.1175/mwr-d-22-0217.1 · Cited by 10
Yoon, S., & Cho, J. (2015) · Journal of Korea Water Resources Association · doi:10.3741/jkwra.2015.48.10.817 · Cited by 8
Approximating Long-Term Statistics Early in the Global Precipitation Measurement Era
Stanley, T. A., Kirschbaum, D. B., Huffman, G. J., & Adler, R. F. (2017) · Earth Interactions · doi:10.1175/ei-d-16-0025.1 · Cited by 8
Metadata
- Authors
- Gudmundsson, L., Bremnes, J. B., Haugen, J. E., & Engen-Skaugen, T.
- Affiliations
- Norwegian Meteorological Institute (NO)
- Venue
- Hydrology and Earth System Sciences
- Publisher
- Copernicus GmbH
- Published
- 2012-09-21
- Volume
- 16
- Issue
- 9
- Pages
- 3383-3390
- ISSN
- 1027-5606 (ISSN-L)
- 1607-7938
- OpenAlex
- W2166535858
- Cited by
- 1,318
- References
- 41
- Citations by year
- 2026: 132 · 2025: 134 · 2024: 124 · 2023: 136 · 2022: 137 · 2021: 172 · 2020: 116 · 2019: 85 · 2018: 76 · 2017: 68 · 2016: 63 · 2015: 35 · 2014: 20 · 2013: 17 · 2012: 3
- FWCI
- 20.14
- Type
- journal article
- Language
- en
- Open access
- gold
- doi.org
- Licence
- Locations
- Hydrology and earth system sciences (publishedVersion, cc-by)
- DOAJ (DOAJ: Directory of Open Access Journals) (submittedVersion)
- Repository for Publications and Research Data (ETH Zurich) (submittedVersion, cc-by)
- ETH Zürich Research Collection (cc-by)
- Topics
- Physical Sciences › Environmental Science › Global and Planetary Change › Climate variability and models
- Physical Sciences › Earth and Planetary Sciences › Atmospheric Science › Precipitation Measurement and Analysis
- Physical Sciences › Environmental Science › Water Science and Technology › Hydrology and Watershed Management Studies
- Keywords
- dynamical downscaling, precipitation bias correction, statistical post-processing, parametric transformation, climate change impacts on water resources
About these checks
Registry, retraction, Cites and statistics results are computed, not judged, with one exception: a printed reference that no index lists is read once by a model before it counts as a citation error. Claims are extracted by a model and kept only when their quote appears verbatim in the text; each cited source is then checked, with a model’s help, for whether it says what the claim relies on. Those verdicts can be wrong — read the claim’s quote and the cited source before relying on one.
Statistics and arithmetic are recomputed, not judged.
Confidence bands are shown only for fields calibrated on our annotated test set. None is calibrated yet, so no band is shown.
What counts as a claim ›How we measure confidence ›How we check this ›
Are you an author, or do you see a problem with this page? Request a review
Data sources
Bibliographic data: Semantic Scholar, OpenAlex, Crossref.
Contains information from the Semantic Scholar Academic Graph Datasets, made available under the ODC Attribution License (ODC-BY 1.0).
Semantic Scholar’s data is described in: Kinney, R., et al. (2023). The Semantic Scholar Open Data Platform. arXiv:2301.10140.
