

Technical Note: Downscaling RCM precipitation to the station scale using statistical transformations—A comparison of methods
Open accessPublished version of a preprint
The DOI matches its Crossref record; 41 of the 41 references it cites were found in a registry or an index.
Abstract
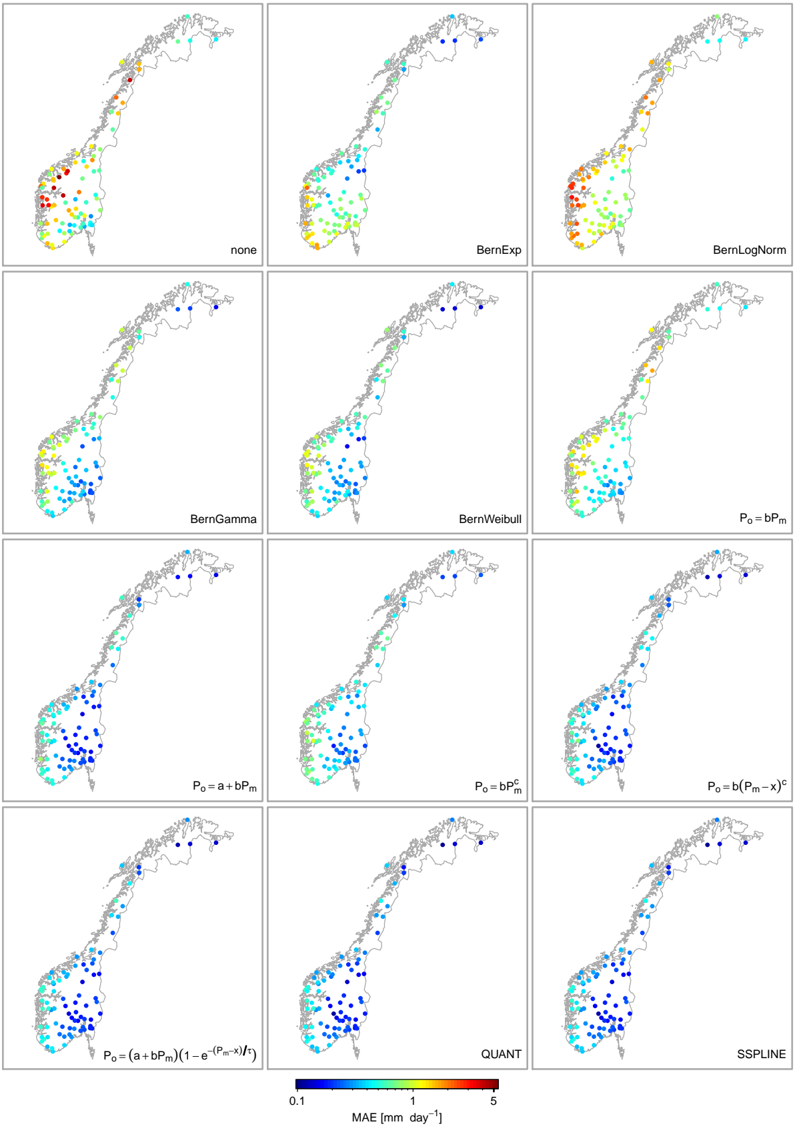
The impact of climate change on water resources is usually assessed at the local scale. However, regional climate models (RCMs) are known to exhibit systematic biases in precipitation. Hence, RCM simulations need to be post-processed in order to produce reliable estimates of local scale climate. Popular post-processing approaches are based on statistical transformations, which attempt to adjust the distribution of modelled data such that it closely resembles the observed climatology. However, the diversity of suggested methods renders the selection of optimal techniques difficult and therefore there is a need for clarification. In this paper, statistical transformations for post-processing RCM output are reviewed and classified into (1) distribution derived transformations, (2) parametric transformations and (3) nonparametric transformations, each differing with respect to their underlying assumptions. A real world application, using observations of 82 precipitation stations in Norway, showed that nonparametric transformations have the highest skill in systematically reducing biases in RCM precipitation.
Overview
The claims and statistics of this paper haven’t been checked yet.
Free: it reads the open-access text and checks the first 5 claims that cite a source we can check. Create a free account to check every claim.
Integrity signals
Registry
Cites
Statistics
Figures



Verification
Claims the paper makes
The claims and statistics of this paper haven’t been checked yet.
Free: it reads the open-access text and checks the first 5 claims that cite a source we can check. Create a free account to check every claim.
Claims other papers make about this one
Each is checked against this paper’s own text: does it say what the citing paper says it does?
The source backs part of the claim, not all of it — or backs it for a different population, condition or comparison.
In the citing paper
“Quantile mapping is the most used bias correction technique due to its ease of handling large amounts of data and its computational efficiency [58,59].”
From Climate Change Impacts on Streamflow in the Krishna River Basin, India: Uncertainty and Multi-Site Analysis (2022) · cites this paper as [58]
Experimental — accuracy not yet measured
Self-check
Percentages, sums and reported differences re-computed from the paper’s own numbers.
The self-check needs the paper’s full text.
Citations
Cites
The Elements of Statistical Learning
Hastie, T., Friedman, J., & Tibshirani, R. (2001) · Springer Series in Statistics · doi:10.1007/978-0-387-21606-5 · Cited by 24,162
Uppala, S. M., KÅllberg, P. W., Simmons, A. J., Andrae, U., Bechtold, V. D. C., Fiorino, M., Gibson, J. K., Haseler, J., Hernandez, A., Kelly, G. A., et al. (2005) · Quarterly Journal of the Royal Meteorological Society · doi:10.1256/qj.04.176 · Cited by 6,804 · cited 1×
“Modelled precipitation was extracted from a HIRHAM RCM simulation with 25 km resolution (Førland et al., 2009, 2011) forced with the ERA40 reanalysis (Uppala et al., 2005) on a model domain covering Norway and the Nordic Arctic.”
MethodTeutschbein, C., & Seibert, J. (2012) · Journal of Hydrology · doi:10.1016/j.jhydrol.2012.05.052 · Cited by 2,214 · cited 13×
“, 2011; Teutschbein and Seibert, 2012), the standard deviation (Engen-Skaugen, 2007; Li et al., 2010; Themeßl et al., 2011; Teutschbein and Seibert, 2012) and the skewness (Li et al.”
BackgroundMethodResultInfluentialHydrologic Implications of Dynamical and Statistical Approaches to Downscaling Climate Model Outputs
Wood, A. W., Leung, L. R., Sridhar, V., & Lettenmaier, D. P. (2004) · Climatic Change · doi:10.1023/b:clim.0000013685.99609.9e · Cited by 1,886 · cited 3×
“(2) using the empirical CDF of observed and modelled values instead of assuming parametric distributions (e.g.Panofsky and Brier, 1968; Wood et al., 2004; Reichle and Koster, 2004; Boé et al., 2007; Themeßl et al., 2011, 2012).”
BackgroundMethodMaraun, D., Wetterhall, F., Ireson, A. M., Chandler, R. E., Kendon, E. J., Widmann, M., Brienen, S., Rust, H. W., Sauter, T., Themeßl, M., et al. (2010) · Reviews of Geophysics · doi:10.1029/2009rg000314 · Cited by 1,805 · cited 3×
“Further, “statistical bias correction” (Piani et al., 2010a,b), “direct error correction methods” (Themeßl et al., 2011) and “model output statistics (MOS)” (Maraun et al., 2010) have been used to refer to the methods under investigation.”
MethodStatistical bias correction for daily precipitation in regional climate models over Europe
Piani, C., Haerter, J. O., & Coppola, E. (2010) · Theoretical and Applied Climatology · doi:10.1007/s00704-009-0134-9 · Cited by 1,154 · cited 9×
“…a set of scores is needed that quantifies the similarity of the observed and the (corrected) modelled empirical CDF. Previously used scores include overall measures, such as the root mean square error (Piani et al., 2010b) or the Kolmogorov-Smirnov two sample statistic (Dosio and Paruolo, 2011).”
BackgroundMethodInfluentialSome applications of statistics to meteorology
Panofsky, H. A., Brier, G. W., & Best, W. H. (1958) · University of Michigan Library Repository · Cited by 1,083
Li, H., Sheffield, J., & Wood, E. F. (2010) · Journal of Geophysical Research: Atmospheres · doi:10.1029/2009jd012882 · Cited by 901 · cited 6×
“Other suggested scores assess specific moments of the distribution including the mean (Engen-Skaugen, 2007; Li et al., 2010; Dosio and Paruolo, 2011; Themeßl et al., 2011; Turco et al., 2011; Teutschbein and Seibert, 2012), the standard deviation (Engen-Skaugen, 2007; Li et al., 2010; Themeßl et…”
BackgroundMethodInfluentialHow Well Do Coupled Models Simulate Today's Climate?
Reichler, T., & Kim, J. (2008) · Bulletin of the American Meteorological Society · doi:10.1175/bams-89-3-303 · Cited by 881
Piani, C., Weedon, G. P., Best, M., Gomes, S. M., Viterbo, P., Hagemann, S., & Haerter, J. O. (2010) · Journal of Hydrology · doi:10.1016/j.jhydrol.2010.10.024 · Cited by 868 · cited 9×
“…a set of scores is needed that quantifies the similarity of the observed and the (corrected) modelled empirical CDF. Previously used scores include overall measures, such as the root mean square error (Piani et al., 2010b) or the Kolmogorov-Smirnov two sample statistic (Dosio and Paruolo, 2011).”
BackgroundMethodInfluential
Cited by
Items 301–400 of 1,001
How Climate Change Affects Extremes in Maize and Wheat Yield in Two Cropping Regions
Ummenhofer, C. C., Hong, X., Twine, T. E., Girvetz, E. H., McCarthy, H. R., Chhetri, N., & Nicholas, K. A. (2015) · Journal of Climate · doi:10.1175/jcli-d-13-00326.1 · Cited by 43
Li, J., Sharma, A., Evans, J. P., & Johnson, F. M. (2016) · Journal of Hydrology · doi:10.1016/j.jhydrol.2016.04.070 · Cited by 40
“The observed synoptic weather data are obtained from the National Center for Environmental Prediction/National Center for Atmospheric Research (NCEP/NCAR) Reanalysis Project (Gudmundsson et al., 2012), referred as NNRP in the rest of the paper.”
MethodRegional Extreme Precipitation Events: Robust Inference From Credibly Simulated GCM Variables
Farnham, D. J., Doss‐Gollin, J., & Lall, U. (2018) · Water Resources Research · doi:10.1002/2017wr021318 · Cited by 41
“, 2015) after some form of bias correction (e.g., quantile-quantile mapping; Gudmundsson et al., 2012) or downscaling is applied.”
BackgroundWeidemann, S. S., Sauter, T., Malz, P., Jaña, R., NETO, J. A., Gino Casassa, R., & Schneider, C. (2018) · Frontiers in Earth Science · doi:10.3389/feart.2018.00081 · Cited by 38
“Incoming shortwave radiation SW in is taken from ERA-Interim and downscaled to AWS data using Quantile Mapping.”
InfluentialDas, S., Das, J., & Umamahesh, N. V. (2021) · International Journal of Climatology · doi:10.1002/joc.7145 · Cited by 38
“Based on a comparative study among different bias correction methods, Gudmundsson et al. (2012) suggested that nonparametric quantile mapping has the best skill in reducing the bias as no specific distribution is assumed for the distribution of datasets.”
BackgroundAssessing Climate Change Impact on Asphalt Binder Grade Selection and its Implications
Swarna, S. T., Hossain, K., Pandya, H., & Mehta, Y. (2021) · Transportation Research Record Journal of the Transportation Research Board · doi:10.1177/03611981211013026 · Cited by 41
“BCCAQ is a hybrid method having associations with both bias correction/constructed analogs (BCCA) (42) and quantile mapping (QMAP) (43).”
MethodMarahatta, S., Aryal, D., Devkota, L. P., Bhattarai, U., & Shrestha, D. (2021) · Water · doi:10.3390/w13111548 · Cited by 40
“The projected climate data at the meteorological stations were then bias corrected using the quantile mapping (QM) method [51,53].”
MethodXu, J., Yao, M., Wu, W., Qiao, X., Zhang, H., Wang, P., Yang, X., Zhao, X., & Zhang, J. (2021) · Environment International · doi:10.1016/j.envint.2021.106733 · Cited by 39
Impact of solar geoengineering on temperatures over the Indonesian Maritime Continent
Kuswanto, H., Kravitz, B., Miftahurrohmah, B., Fauzi, F., Sopahaluwaken, A., & Moore, J. C. (2021) · International Journal of Climatology · doi:10.1002/joc.7391 · Cited by 40
“Quantile mapping (QM) based methods were chosen because of their ability to handle higher-order moments in addition to being computationally efficient (Wood et al ., 2004; Piani et al ., 2010; Gudmundsson et al ., 2012; Teutschbein and Seibert, 2012).”
MethodIdrissou, M., Diekkrüger, B., Tischbein, B., de Hipt, F. O., Näschen, K., Poméon, T., Yira, Y., & Ibrahim, B. (2022) · Hydrology · doi:10.3390/hydrology9010012 · Cited by 42
Sian, K. T. C. L. K., Hagan, D. F. T., Ayugi, B. O., Nooni, I. K., Ullah, W., Babaousmail, H., & Ongoma, V. (2022) · International Journal of Climatology · doi:10.1002/joc.7707 · Cited by 41
“Undoubtedly, the conclusion of most comparative studies has remarked the reliability and robustness of the quantile mapping (QM) technique in minimizing PRE biases (Gudmundsson et al., 2012; Chen et al., 2013; Maraun, 2016).”
BackgroundEmmanouil, S., Langousis, A., Nikolopoulos, E. I., & Anagnostou, E. N. (2021) · Water Resources Research · doi:10.1029/2020wr029548 · Cited by 37
Das, P., Zhang, Z., Ghosh, S., Lu, J., Ayugi, B. O., Ojara, M., & Guo, X. (2023) · Global and Planetary Change · doi:10.1016/j.gloplacha.2023.104068 · Cited by 40
Badou, D. F., Diekkrüger, B., Kapangaziwiri, E., Mbaye, M., Yira, Y., Lawin, A. E., Oyerinde, G. T., & Afouda, A. A. (2018) · Hydrological Processes · doi:10.1002/hyp.13153 · Cited by 41
Mezghani, A., Dobler, A., Benestad, R. E., Haugen, J. E., Parding, K. M., Piniewski, M., & Kundzewicz, Z. W. (2019) · Journal of Applied Meteorology and Climatology · doi:10.1175/jamc-d-18-0179.1 · Cited by 45
Self-citationClimate change impact on flood hazard over Italy
Ojeda, M. G., Sante, F. D., Coppola, E., Fantini, A., Nogherotto, R., Raffaele, F., & Giorgi, F. (2022) · Journal of Hydrology · doi:10.1016/j.jhydrol.2022.128628 · Cited by 42
Changes in flood damage with global warming on the eastern coast of Spain
Cortès, M., Turco, M., Ward, P. J., Sánchez-Espigares, J. A., Alfieri, L., & Llasat, M. C. (2019) · Natural hazards and earth system sciences · doi:10.5194/nhess-19-2855-2019 · Cited by 45
“…19, 2855–2877, 2019 www.nat-hazards-earth-syst-sci.net/19/2855/2019/ each model, the differences between them are estimated by applying a quantile-mapping bias correction method, specifically with non-parametric quantile mapping using the robust empirical quantile method (Gudmundsson et al., 2012).”
MethodProjected effects of climate change on shallow landslides, North Shore Mountains, Vancouver, Canada
Jakob, M., & Owen, T. (2021) · Geomorphology · doi:10.1016/j.geomorph.2021.107921 · Cited by 36
Thrippleton, T., Temperli, C., Krumm, F., Mey, R., Zell, J., Stroheker, S., Goßner, M. M., Bebi, P., Thürig, E., & Schweier, J. (2023) · Regional Environmental Change · doi:10.1007/s10113-022-02015-w · Cited by 36
“The CC scenarios were downscaled using a regional downscaling approach based on quantile mapping (Gudmundsson et al. 2012).”
MethodSeo, G., & Ahn, J. (2023) · Atmosphere · doi:10.3390/atmos14071057 · Cited by 40
“[8] first suggested and applied the QM method to daily precipitation.”
BackgroundMethodInfluentialProjection of future precipitation extremes across the Bangkok Metropolitan Region
Cooper, R. T. (2019) · Heliyon · doi:10.1016/j.heliyon.2019.e01678 · Cited by 38
“As yet, no single best practise approach has been advocated (Gudmundsson et al., 2012), but a number of comprehensive reviews have recently been published that highlight positive and negative aspects of bias correction methods (Chen et al.”
BackgroundMethodInfluentialRatri, D. N., Whan, K., & Schmeits, M. J. (2019) · Journal of Applied Meteorology and Climatology · doi:10.1175/jamc-d-18-0210.1 · Cited by 37
“In our study, there is no fitting of a theoretical probability distribution to the data in creating the CDFs and no a priori assumptions are made (Gudmundsson et al. 2012).”
Evaluating the Impact of Climate Change on Paddy Water Balance Using APEX-Paddy Model
Kamruzzaman, M., Hwang, S., Choi, S.-K., Cho, J., Song, I., Song, J., Jeong, H., Jang, T., & Yoo, S. (2020) · Water · doi:10.3390/w12030852 · Cited by 41
“[46], as compared with the parametric approach, the nonparametric approaches showed better success in minimizing systemic bias.”
ResultGabiri, G., Diekkrüger, B., Näschen, K., Leemhuis, C., van der Linden, R., Mwanjalolo, M., & Obando, J. A. (2020) · Climate · doi:10.3390/cli8070083 · Cited by 44
“For precipitation, a non-parametric empirical quantile mapping approach [52] was applied to daily data for each month individually.”
MethodSilva, D. F., Simonović, S. P., Schardong, A., & Goldenfum, J. A. (2021) · Water · doi:10.3390/w13081008 · Cited by 39
“BCCAQv2 corrects the bias in daily precipitation series obtained from climate models so the distribution properties are close to historical [33,34].”
BackgroundChhetri, R., Pandey, V. P., Talchabhadel, R., & Thapa, B. R. (2021) · Theoretical and Applied Climatology · doi:10.1007/s00704-021-03698-7 · Cited by 39
“The biases in both mean and extreme precipitation were removed using nonparametric transformation approaches (Gudmundsson et al. 2012), as nonparametric methods outperform compared to parametric techniques (Mugume et al.”
MethodExtreme thermal conditions in sea turtle nests jeopardize reproductive output
Türkozan, O., Almpanidou, V., Yılmaz, C., & Mazaris, A. D. (2021) · Climatic Change · doi:10.1007/s10584-021-03153-6 · Cited by 38
Climate Change Adaptation Strategies for Canadian Asphalt Pavements; Part 1: Adaptation strategies
Swarna, S. T., Hossain, K., Mehta, Y., & Bernier, A. (2022) · Journal of Cleaner Production · doi:10.1016/j.jclepro.2022.132313 · Cited by 36
Present and future synoptic circulation patterns associated with cold and snowy spells over Italy
D’Errico, M., Pons, F., Yiou, P., Tao, S., Nardini, C., Lunkeit, F., & Faranda, D. (2022) · Earth System Dynamics · doi:10.5194/esd-13-961-2022 · Cited by 41
Khan, F., Ali, S., Ullah, H., & Muhammad, S. (2022) · Journal of Hydrology Regional Studies · doi:10.1016/j.ejrh.2022.101295 · Cited by 37
Oruç, S. (2022) · Acta Geophysica · doi:10.1007/s11600-022-00731-9 · Cited by 38
“(3) where Po and Pm denote observed and modeled precipitation, respectively, and Fm is the CDF of Pm, Fo is the inverse CDF (or quantile function) corresponding to Po (Piani et al. 2010; Gudmundsson et al. 2012).”
BackgroundJiménez-Navarro, I. C., Mesman, J. P., Pierson, D. C., Trolle, D., Nielsen, A., & Senent‐Aparicio, J. (2023) · The Science of The Total Environment · doi:10.1016/j.scitotenv.2023.163946 · Cited by 36
Assessment of Climate Change Impact on Flood Hazard Zones
Dysarz, T., Marcinkowski, P., Wicher-Dysarz, J., Piniewski, M., Mirosław‐Świątek, D., & Kundzewicz, Z. W. (2024) · Water Resources Management · doi:10.1007/s11269-024-04002-8 · Cited by 35
Demirel, M. C., Booij, M. J., & Hoekstra, A. Y. (2013) · Hydrology and earth system sciences · doi:10.5194/hess-17-4241-2013 · Cited by 35
“Nevertheless, it would be interesting to use a multi-model approach to assess model structural uncertainties and employing additional bias-correction techniques like quantile mapping (Teutschbein and Seibert, 2012; Gudmundsson et al., 2012) to the outputs from different RCMs.”
MethodMarcos-Garcia, P., & Pulido-Velázquez, M. (2017) · Ingeniería del agua · doi:10.4995/ia.2017.6361 · Cited by 35
Kwak, J., St‐Hilaire, A., Chebana, F., & Kim, G. (2017) · Water · doi:10.3390/w9050346 · Cited by 37
“However, GCM and RCM are known to have systematic biases at local or basin scale [58], and PCIC could also be biased.”
BackgroundMascaro, G. (2018) · Journal of Hydrology · doi:10.1016/j.jhydrol.2018.02.011 · Cited by 36
Afzal, M., & Ragab, R. (2019) · Water · doi:10.3390/w11091790 · Cited by 35
“This study applied bias correction method using the quantile mapping “qmap” package in R statistical tool [32].”
MethodTakhellambam, B. S., Srivastava, P., Lamba, J., McGehee, R. P., Kumar, H., & Tian, D. (2022) · Scientific Data · doi:10.1038/s41597-022-01304-7 · Cited by 36
Wang, D., Liu, J., Luan, Q., Shao, W., Fu, X., Wang, H. E., & Gu, Y. (2023) · Meteorological Applications · doi:10.1002/met.2144 · Cited by 38
“The nonparametric transformations were recommended for most bias correction applications (Gudmundsson et al., 2012).”
MethodUsing Machine Learning to Predict Suspended Sediment Transport under Climate Change
Bezak, N., Lebar, K., Bai, Y., & Rusjan, S. (2025) · Water Resources Management · doi:10.1007/s11269-025-04108-7 · Cited by 45
“ARSO used bias correction with nonparametric quantile mapping using empirical quantiles (Gudmundsson et al. 2012 ) with a 61-day moving window for each grid cell.”
Dong, N., Hao, H., Yang, M., Wei, J., Xu, S., & Kunstmann, H. G. (2025) · Hydrology and earth system sciences · doi:10.5194/hess-29-2023-2025 · Cited by 47
“In contrast, EC and EC-QM tend to align more closely with observed CDFs at these lead times.”
InfluentialHwang, S., Graham, W. D., Geurink, J. S., & Adams, A. (2013) · Journal of Hydrology · doi:10.1016/j.jhydrol.2013.11.042 · Cited by 36
Das, J., Treesa, A., & Umamahesh, N. V. (2018) · Water Resources Management · doi:10.1007/s11269-018-2046-x · Cited by 35
“Hence, in the present study nonparametric quantile mapping (Gudmundsson et al. 2012) is used to correct the weighted precipitation series for the entire grid points using the Eq.3 and the correction is also applied to the future time period for all the grid points and scenarios.”
InfluentialGao, C., Booij, M. J., & Xu, Y. (2019) · International Journal of Climatology · doi:10.1002/joc.6246 · Cited by 37
“In this study, 0.1 mm is considered as a threshold of the observations to distinguish a wet day from a dry day (Olsson et al., 2015; Sunyer et al., 2017; Gudmundsson et al., 2012) and determines the frequency of wet days.”
BackgroundInfluentialThrippleton, T., Blattert, C., Bont, L., Mey, R., Zell, J., Thürig, E., & Schweier, J. (2021) · Frontiers in Forests and Global Change · doi:10.3389/ffgc.2021.693020 · Cited by 37
Ngai, S. T., Juneng, L., Tangang, F., Chung, J. X., Supari, S., Salimun, E., Cruz, F. A. T., Ngo‐Duc, T., Phan‐Van, T., Santisirisomboon, J., et al. (2022) · Weather and Climate Extremes · doi:10.1016/j.wace.2022.100484 · Cited by 39
Tootoonchi, F., Haerter, J. O., Todorović, A., Räty, O., Grabs, T., & Teutschbein, C. (2022) · The Science of The Total Environment · doi:10.1016/j.scitotenv.2022.158615 · Cited by 39
“…assumptions and their performance in different regions, we refer the reader to other references (e.g., Fang et al., 2015; Gudmundsson et al., 2012; Gutjahr and Heinemann, 2013; Maraun and Widmann, 2018a; Räty et al., 2014; Teutschbein and Seibert, 2012; Watanabe et al.,…”
BackgroundMethodXue, P., Zhang, C., Zhang, W., Park, E., & Jakada, H. (2022) · Journal of Hydrology · doi:10.1016/j.jhydrol.2022.128550 · Cited by 37
When timing matters-considering changing temporal structures in runoff response surfaces
Vormoor, K., Rößler, O., Bürger, G., Bronstert, A., & Weingartner, R. (2017) · Climatic Change · doi:10.1007/s10584-017-1940-1 · Cited by 33
A strategy to effectively make use of large volumes of climate data for climate change adaptation
Benestad, R. E., Parding, K. M., Dobler, A., & Mezghani, A. (2017) · Climate Services · doi:10.1016/j.cliser.2017.06.013 · Cited by 37
Rianna, G., Reder, A., Mercogliano, P., & Pagano, L. (2017) · Hydrology · doi:10.3390/hydrology4030034 · Cited by 33
Hassanzadeh, E., Nazemi, A., Adamowski, J., Nguyen, T.-H., & Nguyen, V.-T. V. (2019) · Advances in Water Resources · doi:10.1016/j.advwatres.2019.07.001 · Cited by 41
Comparison of precipitation projections of CMIP5 and CMIP6 global climate models over Yulin, China
Shiru, M. S., Chung, ., Shahid, S., & Wang, X. (2021) · Theoretical and Applied Climatology · doi:10.1007/s00704-021-03823-6 · Cited by 36
Petatán‐Ramírez, D., Ojeda-Ruíz, M. Á., Sánchez‐Velasco, L., Rivas, D., Reyes‐Bonilla, H., Cruz-Piñón, G., Morzaria‐Luna, H. N., Cisneros-Montemayor, A. M., Cheung, W. W. L., & Salvadeo, C. J. (2019) · Deep Sea Research Part II Topical Studies in Oceanography · doi:10.1016/j.dsr2.2019.07.020 · Cited by 44
On bias correction of summer monsoon precipitation over India from CORDEX‐SA simulations
Choudhary, A., & Dimri, A. P. (2018) · International Journal of Climatology · doi:10.1002/joc.5889 · Cited by 32
Kolachian, R., & Saghafian, B. (2018) · Theoretical and Applied Climatology · doi:10.1007/s00704-018-2680-5 · Cited by 34
“For more details, please refer to Gudmundsson et al. (2012).”
Piao, J., Chen, W., Wang, L., & Chen, S. (2021) · International Journal of Climatology · doi:10.1002/joc.7297 · Cited by 32
“To date, tremendous efforts have been devoted to optimizing the performances of bias correction methods from multiple perspectives (e.g., model means and variances), with the main focus on quantile mapping in recent studies (Gudmundsson et al., 2012; Cannon et al., 2015; Yang et al., 2018).”
BackgroundMethodCrespi, A., Petitta, M., Marson, P., Viel, C., & Grigis, L. (2021) · Climate · doi:10.3390/cli9120181 · Cited by 36
“The implemented QM scheme was based on the R package qmap [27].”
MethodAnil, S., & Raj, P. A. (2022) · Journal of Water and Climate Change · doi:10.2166/wcc.2022.399 · Cited by 34
“In the present study, a non-parametric quantile mapping (QM) method (Gudmundsson et al. 2012; Cannon et al. 2015; Cannon 2016) is employed to remove the bias in each month of GCMs.”
MethodLi, M. H., Guo, Y., Cai, W., Testa, J. M., Shen, C., Li, R., & Su, J. (2023) · Communications Earth & Environment · doi:10.1038/s43247-023-00733-5 · Cited by 40
Marcinkowski, P., & Piniewski, M. (2023) · Agricultural Systems · doi:10.1016/j.agsy.2023.103813 · Cited by 34
Nguyen, H., Mehrotra, R., & Sharma, A. (2017) · Climate Dynamics · doi:10.1007/s00382-016-3510-z · Cited by 34
Quality control and bias adjustment of crowdsourced wind speed observations
Chen, J., Saunders, K., & Whan, K. (2021) · Quarterly Journal of the Royal Meteorological Society · doi:10.1002/qj.4146 · Cited by 31
“While this is not common practice for official wind data, there are numerous other studies within the climate literature (Terink et al. , 2009; Gudmundsson et al. , 2012; Ho et al. , 2012; Teutschbein and Seibert, 2012; Hawkins et al. , 2013; Fang et al. , 2015; Navarro-Racines and Tarapues, 2015;…”
MethodMichalek, A., Villarini, G., & Kim, T. (2024) · Earth s Future · doi:10.1029/2023ef004179 · Cited by 34
“…on climate model outputs such as precipitationandshownthatitisabletoimprovetherepresentationofprocessesattheregionalscale(e.g.,Golian& Murphy, 2022; Gudmundsson et al., 2012; Maraun et al., 2010; Piani et al., 2009; Sunyer et al., 2015; Tapiador et al., 2020), making it suitable for hydrologic…”
BackgroundDorchies, D., Thirel, G., Jay‐Allemand, M., Chauveau, M., Dehay, F., Bourgin, P.-Y., Perrin, C., Jost, C., Rizzoli, J.-L., Demerliac, S., et al. (2013) · International Journal of River Basin Management · doi:10.1080/15715124.2013.865636 · Cited by 31
Changes in site‐scale temperature extremes over China during 2071–2100 in CMIP5 simulations
Chen, Y. D., Li, J., & Zhang, Q. (2016) · Journal of Geophysical Research Atmospheres · doi:10.1002/2015jd024287 · Cited by 31
Hanel, M., Kožín, R., Heřmanovský, M., & Roub, R. (2017) · Environmental Modelling & Software · doi:10.1016/j.envsoft.2017.03.036 · Cited by 31
Quantitative model-data comparison of mid-Holocene lake-level change in the central Rocky Mountains
Morrill, C., Meador, E., Livneh, B., Liefert, D., & Shuman, B. N. (2019) · Climate Dynamics · doi:10.1007/s00382-019-04633-3 · Cited by 31
Gyasi‐Agyei, Y. (2020) · Water · doi:10.3390/w12071906 · Cited by 31
Kamruzzaman, M., Hwang, S., Choi, S.-K., Cho, J., Song, I., Jeong, H., Song, J., Jang, T., & Yoo, S. (2020) · Agricultural Water Management · doi:10.1016/j.agwat.2020.106345 · Cited by 31
Climate change impacts on precipitation and temperature in Prince Edward Island, Canada
Bhatti, A. Z., Farooque, A. A., Krouglicof, N., Peters, W. D., Acharya, B., Li, Q., & Ahsan, M. S. (2021) · World Water Policy · doi:10.1002/wwp2.12046 · Cited by 31
Hydrological projections in the upper reaches of the Yangtze River Basin from 2020 to 2050
Huang, Y., Xiao, W., Hou, B., Zhou, Y., Hou, G., Yi, L., & Cui, H. L. (2021) · Scientific Reports · doi:10.1038/s41598-021-88135-5 · Cited by 31
Kearns, E. J., Saah, D. S., Levine, C., Lautenberger, C., Doherty, O., Porter, J. R., Amodeo, M., Rudeen, C., Woodward, K. D., Johnson, G. W., et al. (2022) · Fire · doi:10.3390/fire5040117 · Cited by 38
“Relative Humidity Mid-century relative humidity projections used a comparatively simpler approach called empirical quantile mapping (Gudmundsson et al., 2012 [62]).”
MethodImpacts of Solar Radiation Management on Hydro-Climatic Extremes in Southeast Asia
Tan, M. L., Juneng, L., Kuswanto, H., Xuan, H., & Fei, Z. (2023) · Water · doi:10.3390/w15061089 · Cited by 33
“Changing climatology and extremes of the earth’s climate system are anticipated to lead to more intense natural hazards [2,3], which could collectively cause about 260 to 360 billion dollars in economic losses every year [4].”
BackgroundResultNahar, J., Johnson, F. M., & Sharma, A. (2018) · Water Resources Research · doi:10.1002/2017wr021293 · Cited by 35
“Both parametric and nonparametric forms for QM are available (Gudmundsson et al., 2012), and sophisticated bias correction approaches based on QM have been developed (Mehrotra & Sharma, 2016).”
BackgroundMethodShrestha, D., Basnyat, D. B., Gyawali, J., Creed, M., Sinclair, H. D., Golding, B. W., Muthusamy, M., Shrestha, S., Watson, C. S., Subedi, D. L., et al. (2023) · International Journal of Disaster Risk Reduction · doi:10.1016/j.ijdrr.2023.103997 · Cited by 32
“Details of this procedure are described in Gudmundsson et al. (2012).”
Liu, C., Xu, C., Zhang, Z., Xiong, S., Zhang, W., Zhang, B., Chen, H., Xu, Y., & Wang, S. (2024) · Geoscience Frontiers · doi:10.1016/j.gsf.2024.101819 · Cited by 32
Hybrid approaches enhance hydrological model usability for local streamflow prediction
Du, Y., & Pechlivanidis, I. G. (2025) · Communications Earth & Environment · doi:10.1038/s43247-025-02324-y · Cited by 45
Australian snowpack in the NARCliM ensemble: evaluation, bias correction and future projections
Luca, A. D., Evans, J. P., & Ji, F. (2017) · Climate Dynamics · doi:10.1007/s00382-017-3946-9 · Cited by 33
Chisanga, C. B., Elijah, P., & Vernon, R. N. C. (2017) · Scientific Research and Essays · doi:10.5897/sre2017.6521 · Cited by 32
“2013c; Navarro-Racines and Tarapues-Montenegro, 2015); and (c) Quantile Mapping (QM) [Equation 3] (Gudmundsson et al., 2012; Gudmundsson, 2016).”
Amouzou, K. A., Naab, J. B., Lamers, J. P. A., Borgemeister, C., Becker, M., & Vlek, P. L. G. (2018) · Agricultural Systems · doi:10.1016/j.agsy.2018.06.005 · Cited by 39
Gbangou, T., Ludwig, F., van Slobbe, E., Greuell, W., & Kranjac-Berisavljevic, G. (2020) · Theoretical and Applied Climatology · doi:10.1007/s00704-020-03212-5 · Cited by 36
Achieving effective calibration of precipitation forecasts over a continental scale
Yang, Q., Wang, Q. J., & Hakala, K. (2021) · Journal of Hydrology Regional Studies · doi:10.1016/j.ejrh.2021.100818 · Cited by 30
Kumar, K. N., Thota, M., Ashrit, R., Mitra, A. K., & Rajeevan, M. N. (2022) · Hydrological Sciences Journal · doi:10.1080/02626667.2022.2049272 · Cited by 33
Changes in the risk of extreme temperatures in megacities worldwide
Rajulapati, C. R., Abdelmoaty, H., Nerantzaki, S. D., & Papalexiou, S. M. (2022) · Climate Risk Management · doi:10.1016/j.crm.2022.100433 · Cited by 36
Das, S., Datta, P., Sharma, D., & Goswami, K. (2022) · Atmosphere · doi:10.3390/atmos13060941 · Cited by 37
“In this study, we applied the empirical quantile mapping (EQM) method, which is a non-parametric cumulative distribution function (CDF) transformation technique and has performed better in eliminating systematic biases from GCM outputs compared to that of parametric approaches [49,52].”
Method‘Asian water towers’ are not a sustainable solution to the downstream water crisis
Leng, X., Feng, X., Fu, B., Shi, Q., Ye, H., & Zhang, Y. (2022) · The Science of The Total Environment · doi:10.1016/j.scitotenv.2022.159237 · Cited by 29
Future heat extremes and impacts in a convection-permitting climate ensemble over Germany
Hundhausen, M., Feldmann, H., Laube, N., & Pinto, J. G. (2023) · Natural hazards and earth system sciences · doi:10.5194/nhess-23-2873-2023 · Cited by 38
Potential effects of climate changes on soil–atmosphere interaction and landslide hazard
Rianna, G., Comegna, L., Mercogliano, P., & Picarelli, L. (2016) · Natural Hazards · doi:10.1007/s11069-016-2481-z · Cited by 29
“The empirical quantile approach has been employed in this study due to the good performances displayed in other similar investigations (Gudmundsson et al. 2012; Villani et al. 2015).”
MethodImpacts of Climate Change on Rainfall Erosivity in the Huai Luang Watershed, Thailand
Plangoen, P., & Udmale, P. D. (2017) · Atmosphere · doi:10.3390/atmos8080143 · Cited by 33
“The non-parametric empirical Quantile method discussed in [39] is used to correct the daily precipitation.”
MethodBalcha, Y. A., Malcherek, A., & Alamirew, T. (2022) · Climate · doi:10.3390/cli10120185 · Cited by 30
Tootoonchi, F., Todorović, A., Grabs, T., & Teutschbein, C. (2023) · Journal of Hydrology · doi:10.1016/j.jhydrol.2023.129807 · Cited by 35
Li, J., Sharma, A., Johnson, F. M., & Evans, J. P. (2015) · Journal of Hydrology · doi:10.1016/j.jhydrol.2015.06.067 · Cited by 33
“For the future climate projections where observations are not available, bias correction requires the assumption that the biases are stationary (Gudmundsson et al., 2012; Maurer et al., 2013).”
BackgroundWu, Y., Wu, S., Wen, J., Tagle, F., Xu, M., & Tan, J. (2016) · Journal of Hydrometeorology · doi:10.1175/jhm-d-16-0033.1 · Cited by 31
“More details can be found in Gudmundsson et al. (2012) and Wu (2012).”
BackgroundDekens, L., Parey, S., Grandjacques, M., & Dacunha‐Castelle, D. (2017) · Environmetrics · doi:10.1002/env.2454 · Cited by 33
Boulard, D., Castel, T., Camberlin, P., Sergent, A.-S., Bréda, N., Badeau, V., Rossi, A., & Pohl, B. (2015) · Climate Dynamics · doi:10.1007/s00382-015-2724-9 · Cited by 29
High-resolution grids of daily air temperature for Peru - the new PISCOt v1.2 dataset
Huerta, A., Aybar, C., Imfeld, N., Correa, K., Felipe-Obando, O., Rau, P., Drenkhan, F., & Lavado-Casimiro, W. S. (2023) · Scientific Data · doi:10.1038/s41597-023-02777-w · Cited by 31
A new region-aware bias-correction method for simulated precipitation in areas of complex orography
Gómez‐Navarro, J. J., Raible, C. C., Bozhinova, D., Martius, O., Valero, J. A. G., & Montávez, J. P. (2018) · Geoscientific model development · doi:10.5194/gmd-11-2231-2018 · Cited by 31
“There is a variety of correction meth-ods which can bebroadly classi fi ed into distribution-derived transformations, parametric transformations and nonparametric transformations (Gudmundsson et al., 2012).”
BackgroundMethodInfluentialMagnusson, J., Eisner, S., Huang, S., Lussana, C., Mazzotti, G., Essery, R., Saloranta, T. M., & Beldring, S. (2019) · Water Resources Research · doi:10.1029/2019wr024925 · Cited by 30
“The grids were produced on the 1‐km grid by the quantile mapping technique presented by Gudmundsson et al. (2012) that adjusts the historical archive of the 10‐km Norwegian hindcast data set (NORA10; Reistad et al., 2011) to better match the climatology of the high‐resolution operational numerical…”
Method
Metadata
- Authors
- Gudmundsson, L., Bremnes, J. B., Haugen, J. E., & Engen-Skaugen, T.
- Affiliations
- Norwegian Meteorological Institute (NO)
- Venue
- Hydrology and Earth System Sciences
- Publisher
- Copernicus GmbH
- Published
- 2012-09-21
- Volume
- 16
- Issue
- 9
- Pages
- 3383-3390
- ISSN
- 1027-5606 (ISSN-L)
- 1607-7938
- OpenAlex
- W2166535858
- Cited by
- 1,318
- References
- 41
- Citations by year
- 2026: 132 · 2025: 134 · 2024: 124 · 2023: 136 · 2022: 137 · 2021: 172 · 2020: 116 · 2019: 85 · 2018: 76 · 2017: 68 · 2016: 63 · 2015: 35 · 2014: 20 · 2013: 17 · 2012: 3
- FWCI
- 20.14
- Type
- journal article
- Language
- en
- Open access
- gold
- doi.org
- Licence
- Locations
- Hydrology and earth system sciences (publishedVersion, cc-by)
- DOAJ (DOAJ: Directory of Open Access Journals) (submittedVersion)
- Repository for Publications and Research Data (ETH Zurich) (submittedVersion, cc-by)
- ETH Zürich Research Collection (cc-by)
- Topics
- Physical Sciences › Environmental Science › Global and Planetary Change › Climate variability and models
- Physical Sciences › Earth and Planetary Sciences › Atmospheric Science › Precipitation Measurement and Analysis
- Physical Sciences › Environmental Science › Water Science and Technology › Hydrology and Watershed Management Studies
- Keywords
- dynamical downscaling, precipitation bias correction, statistical post-processing, parametric transformation, climate change impacts on water resources
About these checks
Registry, retraction, Cites and statistics results are computed, not judged, with one exception: a printed reference that no index lists is read once by a model before it counts as a citation error. Claims are extracted by a model and kept only when their quote appears verbatim in the text; each cited source is then checked, with a model’s help, for whether it says what the claim relies on. Those verdicts can be wrong — read the claim’s quote and the cited source before relying on one.
Statistics and arithmetic are recomputed, not judged.
Confidence bands are shown only for fields calibrated on our annotated test set. None is calibrated yet, so no band is shown.
What counts as a claim ›How we measure confidence ›How we check this ›
Are you an author, or do you see a problem with this page? Request a review
Data sources
Bibliographic data: Semantic Scholar, OpenAlex, Crossref.
Contains information from the Semantic Scholar Academic Graph Datasets, made available under the ODC Attribution License (ODC-BY 1.0).
Semantic Scholar’s data is described in: Kinney, R., et al. (2023). The Semantic Scholar Open Data Platform. arXiv:2301.10140.
