

Technical Note: Downscaling RCM precipitation to the station scale using statistical transformations—A comparison of methods
Open accessPublished version of a preprint
The DOI matches its Crossref record; 41 of the 41 references it cites were found in a registry or an index.
Abstract
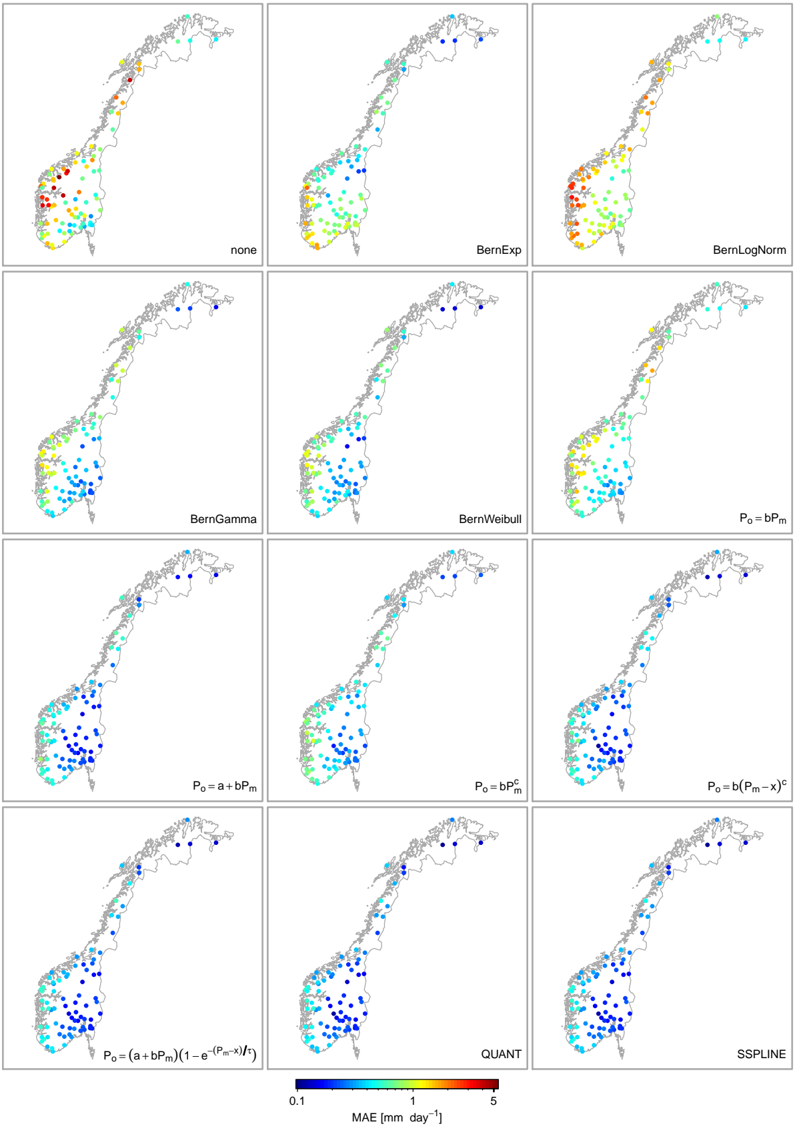
The impact of climate change on water resources is usually assessed at the local scale. However, regional climate models (RCMs) are known to exhibit systematic biases in precipitation. Hence, RCM simulations need to be post-processed in order to produce reliable estimates of local scale climate. Popular post-processing approaches are based on statistical transformations, which attempt to adjust the distribution of modelled data such that it closely resembles the observed climatology. However, the diversity of suggested methods renders the selection of optimal techniques difficult and therefore there is a need for clarification. In this paper, statistical transformations for post-processing RCM output are reviewed and classified into (1) distribution derived transformations, (2) parametric transformations and (3) nonparametric transformations, each differing with respect to their underlying assumptions. A real world application, using observations of 82 precipitation stations in Norway, showed that nonparametric transformations have the highest skill in systematically reducing biases in RCM precipitation.
Overview
The claims and statistics of this paper haven’t been checked yet.
Free: it reads the open-access text and checks the first 5 claims that cite a source we can check. Create a free account to check every claim.
Integrity signals
Registry
Cites
Statistics
Figures



Verification
Claims the paper makes
The claims and statistics of this paper haven’t been checked yet.
Free: it reads the open-access text and checks the first 5 claims that cite a source we can check. Create a free account to check every claim.
Claims other papers make about this one
Each is checked against this paper’s own text: does it say what the citing paper says it does?
The source backs part of the claim, not all of it — or backs it for a different population, condition or comparison.
In the citing paper
“Quantile mapping is the most used bias correction technique due to its ease of handling large amounts of data and its computational efficiency [58,59].”
From Climate Change Impacts on Streamflow in the Krishna River Basin, India: Uncertainty and Multi-Site Analysis (2022) · cites this paper as [58]
Experimental — accuracy not yet measured
Self-check
Percentages, sums and reported differences re-computed from the paper’s own numbers.
The self-check needs the paper’s full text.
Citations
Cites
The Elements of Statistical Learning
Hastie, T., Friedman, J., & Tibshirani, R. (2001) · Springer Series in Statistics · doi:10.1007/978-0-387-21606-5 · Cited by 24,162
Uppala, S. M., KÅllberg, P. W., Simmons, A. J., Andrae, U., Bechtold, V. D. C., Fiorino, M., Gibson, J. K., Haseler, J., Hernandez, A., Kelly, G. A., et al. (2005) · Quarterly Journal of the Royal Meteorological Society · doi:10.1256/qj.04.176 · Cited by 6,804 · cited 1×
“Modelled precipitation was extracted from a HIRHAM RCM simulation with 25 km resolution (Førland et al., 2009, 2011) forced with the ERA40 reanalysis (Uppala et al., 2005) on a model domain covering Norway and the Nordic Arctic.”
MethodTeutschbein, C., & Seibert, J. (2012) · Journal of Hydrology · doi:10.1016/j.jhydrol.2012.05.052 · Cited by 2,214 · cited 13×
“, 2011; Teutschbein and Seibert, 2012), the standard deviation (Engen-Skaugen, 2007; Li et al., 2010; Themeßl et al., 2011; Teutschbein and Seibert, 2012) and the skewness (Li et al.”
BackgroundMethodResultInfluentialHydrologic Implications of Dynamical and Statistical Approaches to Downscaling Climate Model Outputs
Wood, A. W., Leung, L. R., Sridhar, V., & Lettenmaier, D. P. (2004) · Climatic Change · doi:10.1023/b:clim.0000013685.99609.9e · Cited by 1,886 · cited 3×
“(2) using the empirical CDF of observed and modelled values instead of assuming parametric distributions (e.g.Panofsky and Brier, 1968; Wood et al., 2004; Reichle and Koster, 2004; Boé et al., 2007; Themeßl et al., 2011, 2012).”
BackgroundMethodMaraun, D., Wetterhall, F., Ireson, A. M., Chandler, R. E., Kendon, E. J., Widmann, M., Brienen, S., Rust, H. W., Sauter, T., Themeßl, M., et al. (2010) · Reviews of Geophysics · doi:10.1029/2009rg000314 · Cited by 1,805 · cited 3×
“Further, “statistical bias correction” (Piani et al., 2010a,b), “direct error correction methods” (Themeßl et al., 2011) and “model output statistics (MOS)” (Maraun et al., 2010) have been used to refer to the methods under investigation.”
MethodStatistical bias correction for daily precipitation in regional climate models over Europe
Piani, C., Haerter, J. O., & Coppola, E. (2010) · Theoretical and Applied Climatology · doi:10.1007/s00704-009-0134-9 · Cited by 1,154 · cited 9×
“…a set of scores is needed that quantifies the similarity of the observed and the (corrected) modelled empirical CDF. Previously used scores include overall measures, such as the root mean square error (Piani et al., 2010b) or the Kolmogorov-Smirnov two sample statistic (Dosio and Paruolo, 2011).”
BackgroundMethodInfluentialSome applications of statistics to meteorology
Panofsky, H. A., Brier, G. W., & Best, W. H. (1958) · University of Michigan Library Repository · Cited by 1,083
Li, H., Sheffield, J., & Wood, E. F. (2010) · Journal of Geophysical Research: Atmospheres · doi:10.1029/2009jd012882 · Cited by 901 · cited 6×
“Other suggested scores assess specific moments of the distribution including the mean (Engen-Skaugen, 2007; Li et al., 2010; Dosio and Paruolo, 2011; Themeßl et al., 2011; Turco et al., 2011; Teutschbein and Seibert, 2012), the standard deviation (Engen-Skaugen, 2007; Li et al., 2010; Themeßl et…”
BackgroundMethodInfluentialHow Well Do Coupled Models Simulate Today's Climate?
Reichler, T., & Kim, J. (2008) · Bulletin of the American Meteorological Society · doi:10.1175/bams-89-3-303 · Cited by 881
Piani, C., Weedon, G. P., Best, M., Gomes, S. M., Viterbo, P., Hagemann, S., & Haerter, J. O. (2010) · Journal of Hydrology · doi:10.1016/j.jhydrol.2010.10.024 · Cited by 868 · cited 9×
“…a set of scores is needed that quantifies the similarity of the observed and the (corrected) modelled empirical CDF. Previously used scores include overall measures, such as the root mean square error (Piani et al., 2010b) or the Kolmogorov-Smirnov two sample statistic (Dosio and Paruolo, 2011).”
BackgroundMethodInfluential
Cited by
Items 401–500 of 1,001
Soo, E. Z. X., Jaafar, W. Z. W., Lai, S. H., Othman, F. B., El‐Shafie, A., Islam, T., Srivastava, P. K., & Hadi, H. S. O. (2019) · Hydrology research · doi:10.2166/nh.2019.071 · Cited by 31
Conditional and residual trends of singular hot days in Europe
Jézéquel, A., Bevacqua, E., D’Andrea, F., Thao, S., Vautard, R., Vrac, M., & Yiou, P. (2020) · Environmental Research Letters · doi:10.1088/1748-9326/ab76dd · Cited by 28
“…the results between detrending, and three different types of normalization: a simple normalization (division by the standard deviation) gridpoint by gridpoint, another on the spatial mean of the Z500 field and a quantile-mapping (e.g. Panofsky and Brier 1958, Déqué 2007, Gudmundsson et al 2012).”
BackgroundAtmosphere Driven Mass-Balance Sensitivity of Halji Glacier, Himalayas
Arndt, A., Scherer, D., & Schneider, C. (2021) · Atmosphere · doi:10.3390/atmos12040426 · Cited by 28
“Therefore, we applied a quantile-mapping approach [70] to downscale the data to the AWS.”
MethodProjected changes in the n ear‐future mean climate and extreme climate events in northeast Thailand
Khadka, D., Babel, M. S., Collins, M. D., Shrestha, S., Virdis, S., & Chen, A. (2021) · International Journal of Climatology · doi:10.1002/joc.7377 · Cited by 34
Spatiotemporal Trend Analysis of Temperature and Rainfall over Ziway Lake Basin, Ethiopia
Hordofa, A. T., Leta, O. T., Alamirew, T., & Chukalla, A. D. (2021) · Hydrology · doi:10.3390/hydrology9010002 · Cited by 35
Matiu, M., & Hanzer, F. (2022) · Hydrology and earth system sciences · doi:10.5194/hess-26-3037-2022 · Cited by 32
“We compared four different bias-adjustment methods routinely applied for temperature and precipitation series in terms of their applicability for snow cover fraction: DC, QM (Gudmundsson et al., 2012), QDM (Cannon et al., 2015), and multivariate QDM (Cannon, 2018).”
MethodMIdASv0.2.1 – MultI-scale bias AdjuStment
Berg, P., Bosshard, T., Yang, W., & Zimmermann, K. D. (2022) · Geoscientific model development · doi:10.5194/gmd-15-6165-2022 · Cited by 30
“This issue has been dealt with in different ways, and here we used the method we call “qmapQ” from (Gudmundsson et al., 2012), which divides the data range into 100 quantile steps and thus ensures an equal number of data points in each sample.”
MethodClimate change impacts on wind power generation for the Italian peninsula
Bonanno, R., Viterbo, F., & Riva, G. M. (2022) · Regional Environmental Change · doi:10.1007/s10113-022-02007-w · Cited by 32
Hanchane, M., Kessabi, R., Krakauer, N. Y., Sadiki, A., Kassioui, J. E., & Aboubi, I. (2023) · Climate · doi:10.3390/cli11060120 · Cited by 31
Zhang, X., Booij, M. J., & Xu, Y. (2015) · Journal of Hydrometeorology · doi:10.1175/jhm-d-14-0218.1 · Cited by 28
“It has been successfully used for bias correction of meteorological outputs from GCMs and RCMs (Gudmundsson et al. 2012; Li et al. 2010; Themeßl et al. 2012) and also for postprocessing of hydrological forecasts (Hashino et al.”
MethodStaub, B., Hasler, A., Noetzli, J., & Delaloye, R. (2016) · Permafrost and Periglacial Processes · doi:10.1002/ppp.1913 · Cited by 28
“Statistical transformations are the most commonly used for bias correction and the spatial transfer of meteorological parameters (Gudmundsson et al., 2012; Rajczak et al., 2015; Tardivo and Berti, 2014).”
BackgroundMethodInfluentialPaparrizos, S., Smolenaars, W. J., Gbangou, T., van Slobbe, E., & Ludwig, F. (2020) · Atmosphere · doi:10.3390/atmos11101041 · Cited by 32
“At the same time, the ROC and corresponding AUC were computed using the ‘ROCR’ R-package [93].”
MethodPISCOeo_pm, a reference evapotranspiration gridded database based on FAO Penman-Monteith in Peru
Huerta, A., Bonnesoeur, V., Cuadros-Adriazola, J., Lope, L. F. G., Ochoa-Tocachi, B. F., Román‐Dañobeytia, F., & Lavado-Casimiro, W. S. (2022) · Scientific Data · doi:10.1038/s41597-022-01373-8 · Cited by 31
Risks and opportunities for a Swiss hydroelectricity company in a changing climate
Hakala, K., Addor, N., Gobbe, T., Ruffieux, J., & Seibert, J. (2020) · Hydrology and earth system sciences · doi:10.5194/hess-24-3815-2020 · Cited by 27
“The “qmap” package in R (Gudmundsson, 2016; Gudmundsson et al., 2012) was used to match the CDF of the simulated data to that of the observed data.”
MethodProjected crop water requirement over agro-climatically diversified region of Pakistan
Haider, S., & Ullah, K. (2019) · Agricultural and Forest Meteorology · doi:10.1016/j.agrformet.2019.107824 · Cited by 27
A novel method for assessing climate change impacts in ecotron experiments
Vanderkelen, I., Jakob Zscheischler, A., Gudmundsson, L., Keuler, K., Rineau, F., Beenaerts, N., Vangronsveld, J., Vicca, S., & Thiery, W. (2020) · International Journal of Biometeorology · doi:10.1007/s00484-020-01951-8 · Cited by 30
Self-citationRisk assessment in water resources planning under climate change at the Júcar River basin
Suárez-Almiñana, S., Solera, A., Madrigal, J. C., Andreu, J., & Paredes-Arquiola, J. (2020) · Hydrology and earth system sciences · doi:10.5194/hess-24-5297-2020 · Cited by 27
“…using the R statistical software (https://www.r-project.org/) at daily (precipitation and temperature time series) and monthly timescales (inflows time series) by interpolating the empirical quantiles for variables of the reference period based on the package developed by Gudmundsson et al. (2012).”
Spatiotemporal bias adjustment of IMERG satellite precipitation data across Canada
Moazami, S., Na, W., Najafi, M. R., & de Souza, C. P. E. (2022) · Advances in Water Resources · doi:10.1016/j.advwatres.2022.104300 · Cited by 27
Hamed, M. M., Salehie, O., Nashwan, M. S., & Shahid, S. (2022) · Environmental Science and Pollution Research · doi:10.1007/s11356-022-24985-4 · Cited by 29
Projecting Future Climate Change Scenarios Using Three Bias-Correction Methods
Kum, D., Lim, K. J., Jang, C. H., Ryu, J., Yang, J. E., Kim, S., Kong, D. S., & Jung, Y. (2014) · Advances in Meteorology · doi:10.1155/2014/704151 · Cited by 27
Goyburo, A., Rau, P., Lavado-Casimiro, W. S., Buytaert, W., Cuadros-Adriazola, J., & Horna, D. (2023) · Water · doi:10.3390/w15071439 · Cited by 26
Hydroclimatic Impact Assessment Using the SWAT Model in India—State of the Art Review
Dubey, S. K., Kim, J.-J., Her, Y., Sharma, D., & Jeong, H. (2023) · Sustainability · doi:10.3390/su152215779 · Cited by 29
Investigation of Low- and High-Flow Characteristics of Karst Catchments under Climate Change
Sapač, K., Medved, A., Rusjan, S., & Bezak, N. (2019) · Water · doi:10.3390/w11050925 · Cited by 26
“[48], we decided to use the method of non-parametric quantile mapping using empirical quantiles with linear extrapolation.”
MethodProjected changes in days with zero‐crossings for Norway
Nilsen, I. B., Hanssen‐Bauer, I., Tveito, O. E., & Wong, W. K. (2020) · International Journal of Climatology · doi:10.1002/joc.6913 · Cited by 26
“In this study, an empirical quantile mapping method (EQM) was applied (Gudmundsson et al., 2012).”
MethodLemus‐Canovas, M., & Bustins, J. A. L. (2021) · Natural hazards and earth system sciences · doi:10.5194/nhess-21-1721-2021 · Cited by 28
“In the present research we first employ a univariate bias correction approach, the empirical quantile mapping (EQM) method, which estimates the values of the empirical cumulative distribution function (ECDF) of the observed and modelled time series for each quantile (Panofsky and Brier, 1968; Gudmundsson et al., 2012).”
MethodTran-Anh, Q., Ngo‐Duc, T., Espagne, É., & Trinh‐Tuan, L. (2022) · Journal of Water and Climate Change · doi:10.2166/wcc.2022.144 · Cited by 29
The New Bias Correction Method for Daily Extremes Precipitation over South Korea using CMIP6 GCMs
Song, Y. H., Chung, ., & Shahid, S. (2022) · Water Resources Management · doi:10.1007/s11269-022-03338-3 · Cited by 26
Future extreme precipitation changes in the South Asian Summer Monsoon Dominance Region
Deegala, D., Song, Y. H., Chung, ., Ayugi, B. O., & Shahid, S. (2023) · Atmospheric Research · doi:10.1016/j.atmosres.2023.107029 · Cited by 27
Tao, Y., Yang, T., Faridzad, M., Jiang, L., He, X., & Zhang, X. (2017) · International Journal of Climatology · doi:10.1002/joc.5188 · Cited by 27
“The model evaluation and comparison have © 2017 Royal Meteorological Society been discussed thoroughly in many studies (Maraun et al., 2010; Gudmundsson et al., 2012; Liu et al., 2012, 2017; Lafon et al., 2013; Teutschbein and Seibert, 2013).”
BackgroundMethodAssessment of uncertainty in estimating future flood return levels under climate change
Das, J., & Umamahesh, N. V. (2018) · Natural Hazards · doi:10.1007/s11069-018-3291-2 · Cited by 27
“Therefore, Gudmundsson et al. (2012) quantified the performance of different techniques based on the skill in reducing the bias from the RCM rainfall.”
MethodAfzal, M., & Ragab, R. (2020) · Applied Water Science · doi:10.1007/s13201-020-01293-1 · Cited by 26
“This study applied bias correction method using the ‘qmap’ package in R statistical tool (Gudmundsson et al., 2012).”
MethodAridity shifts in the MENA region under the Paris Agreement climate change scenarios
Hamed, M. M., Sobh, M. T., Ali, Z., Nashwan, M. S., & Shahid, S. (2024) · Global and Planetary Change · doi:10.1016/j.gloplacha.2024.104483 · Cited by 24
Reder, A., Fedele, G., Manco, I., & Mercogliano, P. (2025) · Scientific Reports · doi:10.1038/s41598-024-84527-5 · Cited by 36
Liu, W., Zhang, X., Qi, F., & Engel, B. A. (2025) · Journal of Hydrology · doi:10.1016/j.jhydrol.2025.132971 · Cited by 25
Projections of climatic extremes in a data poor transboundary river basin of India and Pakistan
Aslam, R. A., Shrestha, S., Pal, I., Ninsawat, S., Shanmugam, M. S., & Anwar, S. (2020) · International Journal of Climatology · doi:10.1002/joc.6501 · Cited by 25
“The formulation of the transformation is given in Equation (1) (Piani et al., 2010; Gudmundsson et al., 2012).”
BackgroundPaz, S. M., & Willems, P. (2022) · Journal of Hydrology Regional Studies · doi:10.1016/j.ejrh.2022.101104 · Cited by 37
Dlamini, N. S., Senzanje, A., & Mabhaudhi, T. (2023) · Journal of Hydrology Regional Studies · doi:10.1016/j.ejrh.2023.101330 · Cited by 39
Li, X., Fang, G., Wei, J., Arnault, J., Laux, P., Wen, X., & Kunstmann, H. G. (2023) · Climate Dynamics · doi:10.1007/s00382-023-06781-z · Cited by 27
Could climate change exacerbate droughts in Bangladesh in the future?
Rahman, M., Tumon, M. S. H., Islam, M. M., Chen, N., Pham, Q. B., Ullah, K., Ahammed, S. J., Liza, S. N., Aziz, M. A., Chakma, S., et al. (2023) · Journal of Hydrology · doi:10.1016/j.jhydrol.2023.130096 · Cited by 26
The future of droughts in Iran according to CMIP6 projections
Yousefi, H., Ahani, A., Moridi, A., & Razavi, S. (2024) · Hydrological Sciences Journal · doi:10.1080/02626667.2024.2348720 · Cited by 25
Climate impacts on palm oil yields in the Nigerian Niger Delta
Okoro, S. U., Schickhoff, U., Böhner, J., Schneider, U. A., & Huth, N. I. (2017) · European Journal of Agronomy · doi:10.1016/j.eja.2017.02.002 · Cited by 33
Climate futures for Western Nepal based on regional climate models in the CORDEX‐SA
Dhaubanjar, S., Pandey, V. P., & Bharati, L. (2019) · International Journal of Climatology · doi:10.1002/joc.6327 · Cited by 25
“…from these RCMs. Observed station data were compared with RCM simulation data for the historical timeframe (1981–2005) to establish linear functions for bias correcting RCM historical and future projections using empirical quantile-mapping (Gudmundsson et al., 2012; Teutschbein and Seibert, 2012).”
MethodRagettli, S., Tong, X., Zhang, G., Wang, H., Zhang, S., & Stähli, M. (2019) · Hydrology research · doi:10.2166/nh.2019.118 · Cited by 28
Inundation modelling for Bangladeshi coasts using downscaled and bias-corrected temperature
Hasan, M. K., Kumar, L., & Gopalakrishnan, T. (2019) · Climate Risk Management · doi:10.1016/j.crm.2019.100207 · Cited by 29
Zhang, X., Chen, Y., Fang, G., Xia, Z., Li, Z., Duan, W., & Xia, Q. (2023) · Journal of Hydrology · doi:10.1016/j.jhydrol.2023.130158 · Cited by 29
Zhang, S., Harrop, B. E., Leung, L.-Y. R., Charalampopoulos, A.-T., Barthel, B., Xu, W., & Sapsis, T. P. (2024) · Journal of Advances in Modeling Earth Systems · doi:10.1029/2023ms004138 · Cited by 31
“…studies and many bias correction methods have been developed to provide more reliable regional climate information (e.g., Christensen et al., 2008; Deque, 2007; François et al., 2020; Gudmundsson et al., 2012; Vaittinada Ayar et al., 2021; Vrac et al., 2012; Z. Xu & Yang, 2012; Z. Xu et al., 2021).”
MethodSiegfried, T., Mujahid, A. U. H., Marti, B., Molnár, P., Karger, D. N., & Yakovlev, A. (2024) · Climatic Change · doi:10.1007/s10584-024-03799-y · Cited by 27
“…GCM simulations from 1979 – 2011 compared to the zonal mean subcatchment statistics of the CHELSA V21 daily data, the individual time series were bias-corrected in R for each GCM model separately using quantile mapping available via the qmap R Package (Gudmundsson et al. 2012; R Core Team 2022).”
Cai, M., An, C., Guy, C., & Lu, C. (2020) · Sustainability · doi:10.3390/su12030934 · Cited by 24
A Statistical Tool to Generate Potential Future Climate Scenarios for Hydrology Applications
Collados‐Lara, A., Pulido‐Velazquez, D., & Pardo‐Igúzquiza, E. (2020) · Scientific Programming · doi:10.1155/2020/8847571 · Cited by 25
“It does not include correction techniques based on the cumulative distribution function, which have been employed by other authors with good results [53, 54].”
MethodPerformance of seasonal forecasts of Douro and Port wine production
Santos, J. A., Ceglar, A., Toreti, A., & Prodhomme, C. (2020) · Agricultural and Forest Meteorology · doi:10.1016/j.agrformet.2020.108095 · Cited by 24
Yeste, P., Rosa-Cánovas, J. J., Romero-Jiménez, E., Ojeda, M. G., Gámiz‐Fortis, S. R., Castro‐Díez, Y., & Esteban‐Parra, M. J. (2021) · The Science of The Total Environment · doi:10.1016/j.scitotenv.2021.146126 · Cited by 30
“In this study we used the R package ‘qmap’ (Gudmundsson et al., 2012) in order to fit the cumulative distribution functions (CDFs) of the meteorological time series to the CDFs of the observations.”
BackgroundMethodChiew, F. H. S., Zheng, H., Potter, N. J., Charles, S. P., Thatcher, M., Ji, F., Syktus, J. I., Robertson, D., & Post, D. A. (2022) · Water · doi:10.3390/w14172730 · Cited by 24
Saeed, A., Ali, S., Khan, F., Muhammad, S., Reboita, M. S., Khan, A. W., Goheer, M. A., Khan, M. A., Kumar, R., Ikram, A., et al. (2022) · Environmental Geochemistry and Health · doi:10.1007/s10653-022-01429-z · Cited by 29
Future changes of summer monsoon rainfall and temperature over Bangladesh using 27 CMIP6 models
Bhattacharjee, A., Hassan, S. M. Q., Hazra, P., Kormoker, T., Islam, S., Alam, E., Islam, M. K., & Islam, A. R. M. T. (2023) · Geocarto International · doi:10.1080/10106049.2023.2285342 · Cited by 25
“Compared with delta change and additive models, the quintile mapping model outperforms better to lessen the absolute error between historical and projection for rainfall and temperature (Gudmundsson 2012).”
MethodDas, J., & Umamahesh, N. V. (2017) · Water Resources Management · doi:10.1007/s11269-017-1876-2 · Cited by 24
“Gudmundsson et al. (2012) examined both parametric and nonparametric bias correction techniques to reduce the bias exclusively in the RCM precipitation using 82 precipitation stations.”
MethodCorrecting systematic biases across multiple atmospheric variables in the frequency domain
Nguyen, H. H., Mehrotra, R., & Sharma, A. (2018) · Climate Dynamics · doi:10.1007/s00382-018-4191-6 · Cited by 28
“2004), quantile-based (Piani et al. 2010; Li et al. 2010; Hempel et al. 2013; Haerter et al. 2011; Gudmundsson et al. 2012) or persistence-based approaches (Johnson and Sharma 2012; Mehrotra and Sharma 2012), is the assumption of independence across variables or GCMs grid cells.”
BackgroundChim, K., Tunnicliffe, J., Shamseldin, A. Y., & Chan, K. (2020) · Dynamics of Atmospheres and Oceans · doi:10.1016/j.dynatmoce.2020.101182 · Cited by 27
A global high-resolution and bias-corrected dataset of CMIP6 projected heat stress metrics
Kong, Q., & Huber, M. S. (2025) · Scientific Data · doi:10.1038/s41597-025-04527-6 · Cited by 32
“…been developed to correct model simulations towards observations or reanalysis, including approaches correcting only the mean 68,92–94 , both mean and variance 35,95,96 , and quantile mapping (QM) methods that map the entire distribution of the simulated data to that of the observations 30,97–100 .”
Padulano, R., Gomez-Mogollon, L. A., Napolitano, L., & Rianna, G. (2025) · Journal of Hydrology · doi:10.1016/j.jhydrol.2025.132814 · Cited by 25
Keteklahijani, V. K., Alimohammadi, S., & Fattahi, E. (2019) · Ain Shams Engineering Journal · doi:10.1016/j.asej.2018.11.004 · Cited by 24
Urban multi-model climate projections of intense heat in Switzerland
Burgstall, A., Kotlarski, S., Casanueva, A., Hertig, E., Fischer, E. M., & Knutti, R. (2021) · Climate Services · doi:10.1016/j.cliser.2021.100228 · Cited by 25
Okafor, G. C., Larbi, I., Chukwuma, E. C., Nyamekye, C., Limantol, A. M., & Dotse, S.-Q. (2021) · Environmental Challenges · doi:10.1016/j.envc.2021.100285 · Cited by 25
A Novel Approach to Identify the Characteristics of Drought under Future Climate Change Scenario
Padhiary, J., Patra, K. C., & Dash, S. S. (2022) · Water Resources Management · doi:10.1007/s11269-022-03296-w · Cited by 23
Bendito, B. P. C., Chaves, H. M. L., & Scariot, A. O. (2023) · Water · doi:10.3390/w15030563 · Cited by 23
Projecting the Changes in Multifaceted Characteristics of Heatwave Events Across China
Wei, J., Wang, W., Wang, G., Cao, M., Yang, L., Zhang, S., Fu, J., & Xing, W. (2023) · Earth s Future · doi:10.1029/2022ef003387 · Cited by 24
Improving Boreal Summer Precipitation Predictions From the Global NMME Through Res34‐Unet
Tong, X., Zhou, W., & Xia, J. (2024) · Geophysical Research Letters · doi:10.1029/2023gl106391 · Cited by 25
“A common post-processing method is statistical post-processing, which includes weighting the NMME members (Slater et al., 2019; Yao & Yuan, 2018) and quantile mapping (Gudmundsson et al., 2012; Shastri et al., 2017).”
MethodBias correction of RCM outputs using mixture distributions under multiple extreme weather influences
Shin, J., Lee, T., Park, T., & Kim, S. (2018) · Theoretical and Applied Climatology · doi:10.1007/s00704-018-2585-3 · Cited by 23
Evolution of Burned Area in Forest Fires under Climate Change Conditions in Southern Spain Using ANN
Pérez‐Sánchez, J., Jimeno‐Sáez, P., Senent‐Aparicio, J., Díaz-Palmero, J. M., & Cabezas-Cerezo, J. D. D. (2019) · Applied Sciences · doi:10.3390/app9194155 · Cited by 25
“We used the R free software and the contributed package “qmap” [61], which can be obtained from the R project website.”
MethodWinter fidelity, movements, and energy expenditure of Midcontinent Greater White-fronted Geese
VonBank, J. A., Weegman, M. D., Link, P. T., Cunningham, S. A., Kraai, K. J., Collins, D. P., & Ballard, B. M. (2021) · Movement Ecology · doi:10.1186/s40462-020-00236-4 · Cited by 29
Villani, V., Rianna, G., Mercogliano, P., Zollo, A. L., & Schiano, P. G. (2015) · Journal of Urban and Environmental Engineering · doi:10.4090/juee.2014.v8n2.142-154 · Cited by 24
Sommerlot, A. R., Wagena, M. B., Fuka, D. R., & Easton, Z. M. (2016) · Environmental Modelling & Software · doi:10.1016/j.envsoft.2016.09.008 · Cited by 23
Ouellet‐Proulx, S., St‐Hilaire, A., & Boucher, M. (2017) · Water · doi:10.3390/w9070457 · Cited by 25
“Second, many different pre- and post-processing methods exist, spanning from very simple [53] to more elaborate (e.”
BackgroundLiu, T., Zhu, X., Tang, M., Guo, C., & Lu, D. (2024) · Atmospheric Research · doi:10.1016/j.atmosres.2024.107481 · Cited by 25
Mengistu, T. D., Chang, S. W., & Chung, I.-M. (2025) · Journal of Environmental Management · doi:10.1016/j.jenvman.2025.126025 · Cited by 28
Conditional diffusion models for downscaling and bias correction of Earth system model precipitation
Aich, M., Hess, P., Pan, B., Bathiany, S., Huang, Y., & Boers, N. (2026) · Geoscientific model development · doi:10.5194/gmd-19-1791-2026 · Cited by 49
Sun, C., Huang, G., Fan, Y., Zhou, X., Lu, C., & Wang, X. (2020) · Water Resources Research · doi:10.1029/2020wr027698 · Cited by 22
Tang, X., Zhang, J., Wang, G., Ruben, G. B., Bao, Z., Liu, Y., Liu, C., & Jin, J. (2021) · Remote Sensing · doi:10.3390/rs13020312 · Cited by 22
Collados‐Lara, A., Pardo‐Igúzquiza, E., & Pulido‐Velazquez, D. (2021) · The Science of The Total Environment · doi:10.1016/j.scitotenv.2021.147776 · Cited by 26
Nasseri, M., Schoups, G., & Taheri, M. (2021) · International Journal of Climatology · doi:10.1002/joc.7358 · Cited by 22
Performance evaluation of ERA5 precipitation estimates across Iran
Malayeri, A. K., Saghafian, B., & Raziei, T. (2021) · Arabian Journal of Geosciences · doi:10.1007/s12517-021-09079-8 · Cited by 23
Zhang, X., Chen, Y., Fang, G., Xia, Z., Yang, Y., Duan, W., Xia, Q., & Li, S. (2022) · Journal of Hydrology · doi:10.1016/j.jhydrol.2022.128269 · Cited by 22
Evaluation and bias correction of probabilistic volcanic ash forecasts
Crawford, A., Chai, T., Wang, B., Ring, A., Stunder, B. J. B., Loughner, C. P., Pavolonis, M. J., & Sieglaff, J. M. (2022) · Atmospheric chemistry and physics · doi:10.5194/acp-22-13967-2022 · Cited by 23
“Higher-order fits or other functional forms can be used or a non-parametric approach sometimes referred to as quantile mapping can be used (Piani et al., 2010; Gudmundsson et al., 2012).”
MethodRapid Acceleration of Dangerous Compound Heatwaves and Their Impacts in a Warmer China
Dong, W. G., Jia, X., Qian, Q., & Li, X. (2023) · Geophysical Research Letters · doi:10.1029/2023gl104850 · Cited by 23
“The RQUANT is a bias-correction technique that demonstrates superior performance in correcting climate model bias (Ashfaq et al., 2010; Gudmundsson et al., 2012; Tong et al., 2021).”
MethodDrought characteristics projections based on CMIP6 climate change scenarios in Syria
Mathbout, S., Vide, J. M., & Bustins, J. A. L. (2023) · Journal of Hydrology Regional Studies · doi:10.1016/j.ejrh.2023.101581 · Cited by 39
Prediction of long-term photovoltaic power generation in the context of climate change
Liu, Z., Guo, J., Wang, X., Wang, Y., Li, W., Wang, Y., Fan, Y., & Wang, X. (2024) · Renewable Energy · doi:10.1016/j.renene.2024.121263 · Cited by 25
Muñoz‐Mas, R., Marcos-Garcia, P., Lopez‐Nicolas, A., Martínez-García, F. J., Pulido-Velázquez, M., & Martínez‐Capel, F. (2018) · Ecological Modelling · doi:10.1016/j.ecolmodel.2018.08.012 · Cited by 25
Li, M. H., Ni, W., Zhang, F., Glibert, P. M., & Lin, C.-H. (. (2020) · The Science of The Total Environment · doi:10.1016/j.scitotenv.2020.140947 · Cited by 27
Mapping future water scarcity in a water abundant nation: Near-term projections for Scotland
Visser‐Quinn, A., Beevers, L. C., Lau, T., & Gosling, R. (2021) · Climate Risk Management · doi:10.1016/j.crm.2021.100302 · Cited by 32
Pradhananga, D., & Pomeroy, J. W. (2022) · Hydrology and earth system sciences · doi:10.5194/hess-26-2605-2022 · Cited by 22
Romero-Hernández, C. M., Ávila-Díaz, A., Quesada, B., de Medeiros, F. J., Cerón, W. L., Guzman-Escalante, J., Ocampo-Marulanda, C., Torres, R. R., & Zuluaga, C. F. (2024) · Journal of South American Earth Sciences · doi:10.1016/j.jsames.2024.104898 · Cited by 28
Ban, J., Lu, K., Liu, Y., Zang, J., Zhou, Z., Zhang, C., Liu, Z., Huang, J., Chen, Y., Gao, X., et al. (2024) · The Lancet Planetary Health · doi:10.1016/s2542-5196(24)00202-x · Cited by 21
Waqas, M., & Humphries, U. W. (2025) · Big Earth Data · doi:10.1080/20964471.2025.2547500 · Cited by 22
“Researchers commonly use QM (Gudmundsson et al., 2012; Humphries et al., 2024), Delta Change (Humphries et al., 2024), and equilibrium QM to correct GCM output errors and scale them to local levels (Lader et al., 2017).”
Climate and Land Use Effects on Hydrologic Processes in a Primarily Rain‐Fed, Agricultural Watershed
Phung, Q., Thompson, A. L., Baffaut, C., Costello, C., Sadler, E. J., Svoma, B. M., Lupo, A. R., & Gautam, S. (2019) · JAWRA Journal of the American Water Resources Association · doi:10.1111/1752-1688.12764 · Cited by 23
“This additional downscaling resulted in a better representation of weather in a specific area and is noted as being beneficial for impact assessment modeling (Wood et al. 2004; Feddersen and Andersen 2005; Chen et al. 2011; Gudmundsson et al. 2012).”
BackgroundRajbanshi, J., & Bhattacharya, S. (2021) · Modeling Earth Systems and Environment · doi:10.1007/s40808-021-01117-4 · Cited by 22
Pandey, V. P., Shrestha, D., & Adhikari, M. (2021) · Journal of Hydrology · doi:10.1016/j.jhydrol.2021.126383 · Cited by 23
Herbozo, J. E., Muñoz, L. E., Guerra, M. J., Minaya, V., Haro, P. L., Carrillo, V., Manciati, C., & Campozano, L. (2022) · Atmosphere · doi:10.3390/atmos13050828 · Cited by 21
Shrestha, A., Subedi, B., Shrestha, B., Shrestha, A., Maharjan, A., Bhattarai, P. K., & Pandey, V. P. (2023) · Climate Dynamics · doi:10.1007/s00382-023-06836-1 · Cited by 25
“(1) (Gudmundsson et al. 2012).”
Robinson, E. L., Huntingford, C., Semeena, V. S., & Bullock, J. M. (2023) · Earth system science data · doi:10.5194/essd-15-5371-2023 · Cited by 23
Leone, M., Gentile, F., Porto, A. L., Ricci, G. F., Schürz, C., Strauch, M., Völk, M., & Girolamo, A. M. D. (2024) · Journal of Hydrology Regional Studies · doi:10.1016/j.ejrh.2024.101698 · Cited by 22
“This method proved to be valid for the correction of the bias of climatic variables (Dumitrescu et al., 2023), especially for temperatures (Maraun, 2013), and was performed in the R environment with the ‘qmap ’ package 1.0 – 4 (Gudmundsson, 2016; Gudmundsson et al., 2012).”
InfluentialZebarjadian, F., Dolatabadi, N., Zahraie, B., Sohi, H. Y., & Zandi, O. (2024) · International Journal of Climatology · doi:10.1002/joc.8458 · Cited by 21
“Non-parametric method is recommended when there exist a substantial number of outliers and the mixed distribution cannot be fitted (Gudmundsson et al., 2012).”
Method
Metadata
- Authors
- Gudmundsson, L., Bremnes, J. B., Haugen, J. E., & Engen-Skaugen, T.
- Affiliations
- Norwegian Meteorological Institute (NO)
- Venue
- Hydrology and Earth System Sciences
- Publisher
- Copernicus GmbH
- Published
- 2012-09-21
- Volume
- 16
- Issue
- 9
- Pages
- 3383-3390
- ISSN
- 1027-5606 (ISSN-L)
- 1607-7938
- OpenAlex
- W2166535858
- Cited by
- 1,318
- References
- 41
- Citations by year
- 2026: 132 · 2025: 134 · 2024: 124 · 2023: 136 · 2022: 137 · 2021: 172 · 2020: 116 · 2019: 85 · 2018: 76 · 2017: 68 · 2016: 63 · 2015: 35 · 2014: 20 · 2013: 17 · 2012: 3
- FWCI
- 20.14
- Type
- journal article
- Language
- en
- Open access
- gold
- doi.org
- Licence
- Locations
- Hydrology and earth system sciences (publishedVersion, cc-by)
- DOAJ (DOAJ: Directory of Open Access Journals) (submittedVersion)
- Repository for Publications and Research Data (ETH Zurich) (submittedVersion, cc-by)
- ETH Zürich Research Collection (cc-by)
- Topics
- Physical Sciences › Environmental Science › Global and Planetary Change › Climate variability and models
- Physical Sciences › Earth and Planetary Sciences › Atmospheric Science › Precipitation Measurement and Analysis
- Physical Sciences › Environmental Science › Water Science and Technology › Hydrology and Watershed Management Studies
- Keywords
- dynamical downscaling, precipitation bias correction, statistical post-processing, parametric transformation, climate change impacts on water resources
About these checks
Registry, retraction, Cites and statistics results are computed, not judged, with one exception: a printed reference that no index lists is read once by a model before it counts as a citation error. Claims are extracted by a model and kept only when their quote appears verbatim in the text; each cited source is then checked, with a model’s help, for whether it says what the claim relies on. Those verdicts can be wrong — read the claim’s quote and the cited source before relying on one.
Statistics and arithmetic are recomputed, not judged.
Confidence bands are shown only for fields calibrated on our annotated test set. None is calibrated yet, so no band is shown.
What counts as a claim ›How we measure confidence ›How we check this ›
Are you an author, or do you see a problem with this page? Request a review
Data sources
Bibliographic data: Semantic Scholar, OpenAlex, Crossref.
Contains information from the Semantic Scholar Academic Graph Datasets, made available under the ODC Attribution License (ODC-BY 1.0).
Semantic Scholar’s data is described in: Kinney, R., et al. (2023). The Semantic Scholar Open Data Platform. arXiv:2301.10140.
